
Machine Learning Models for the Prediction of Energy Consumption Based on Cooling and Heating Loads in Internet-of-Things-Based Smart Buildings


Abstract
:1. Introduction
2. Literature Review
3. Proposed Model
3.1. Description
3.2. Properties
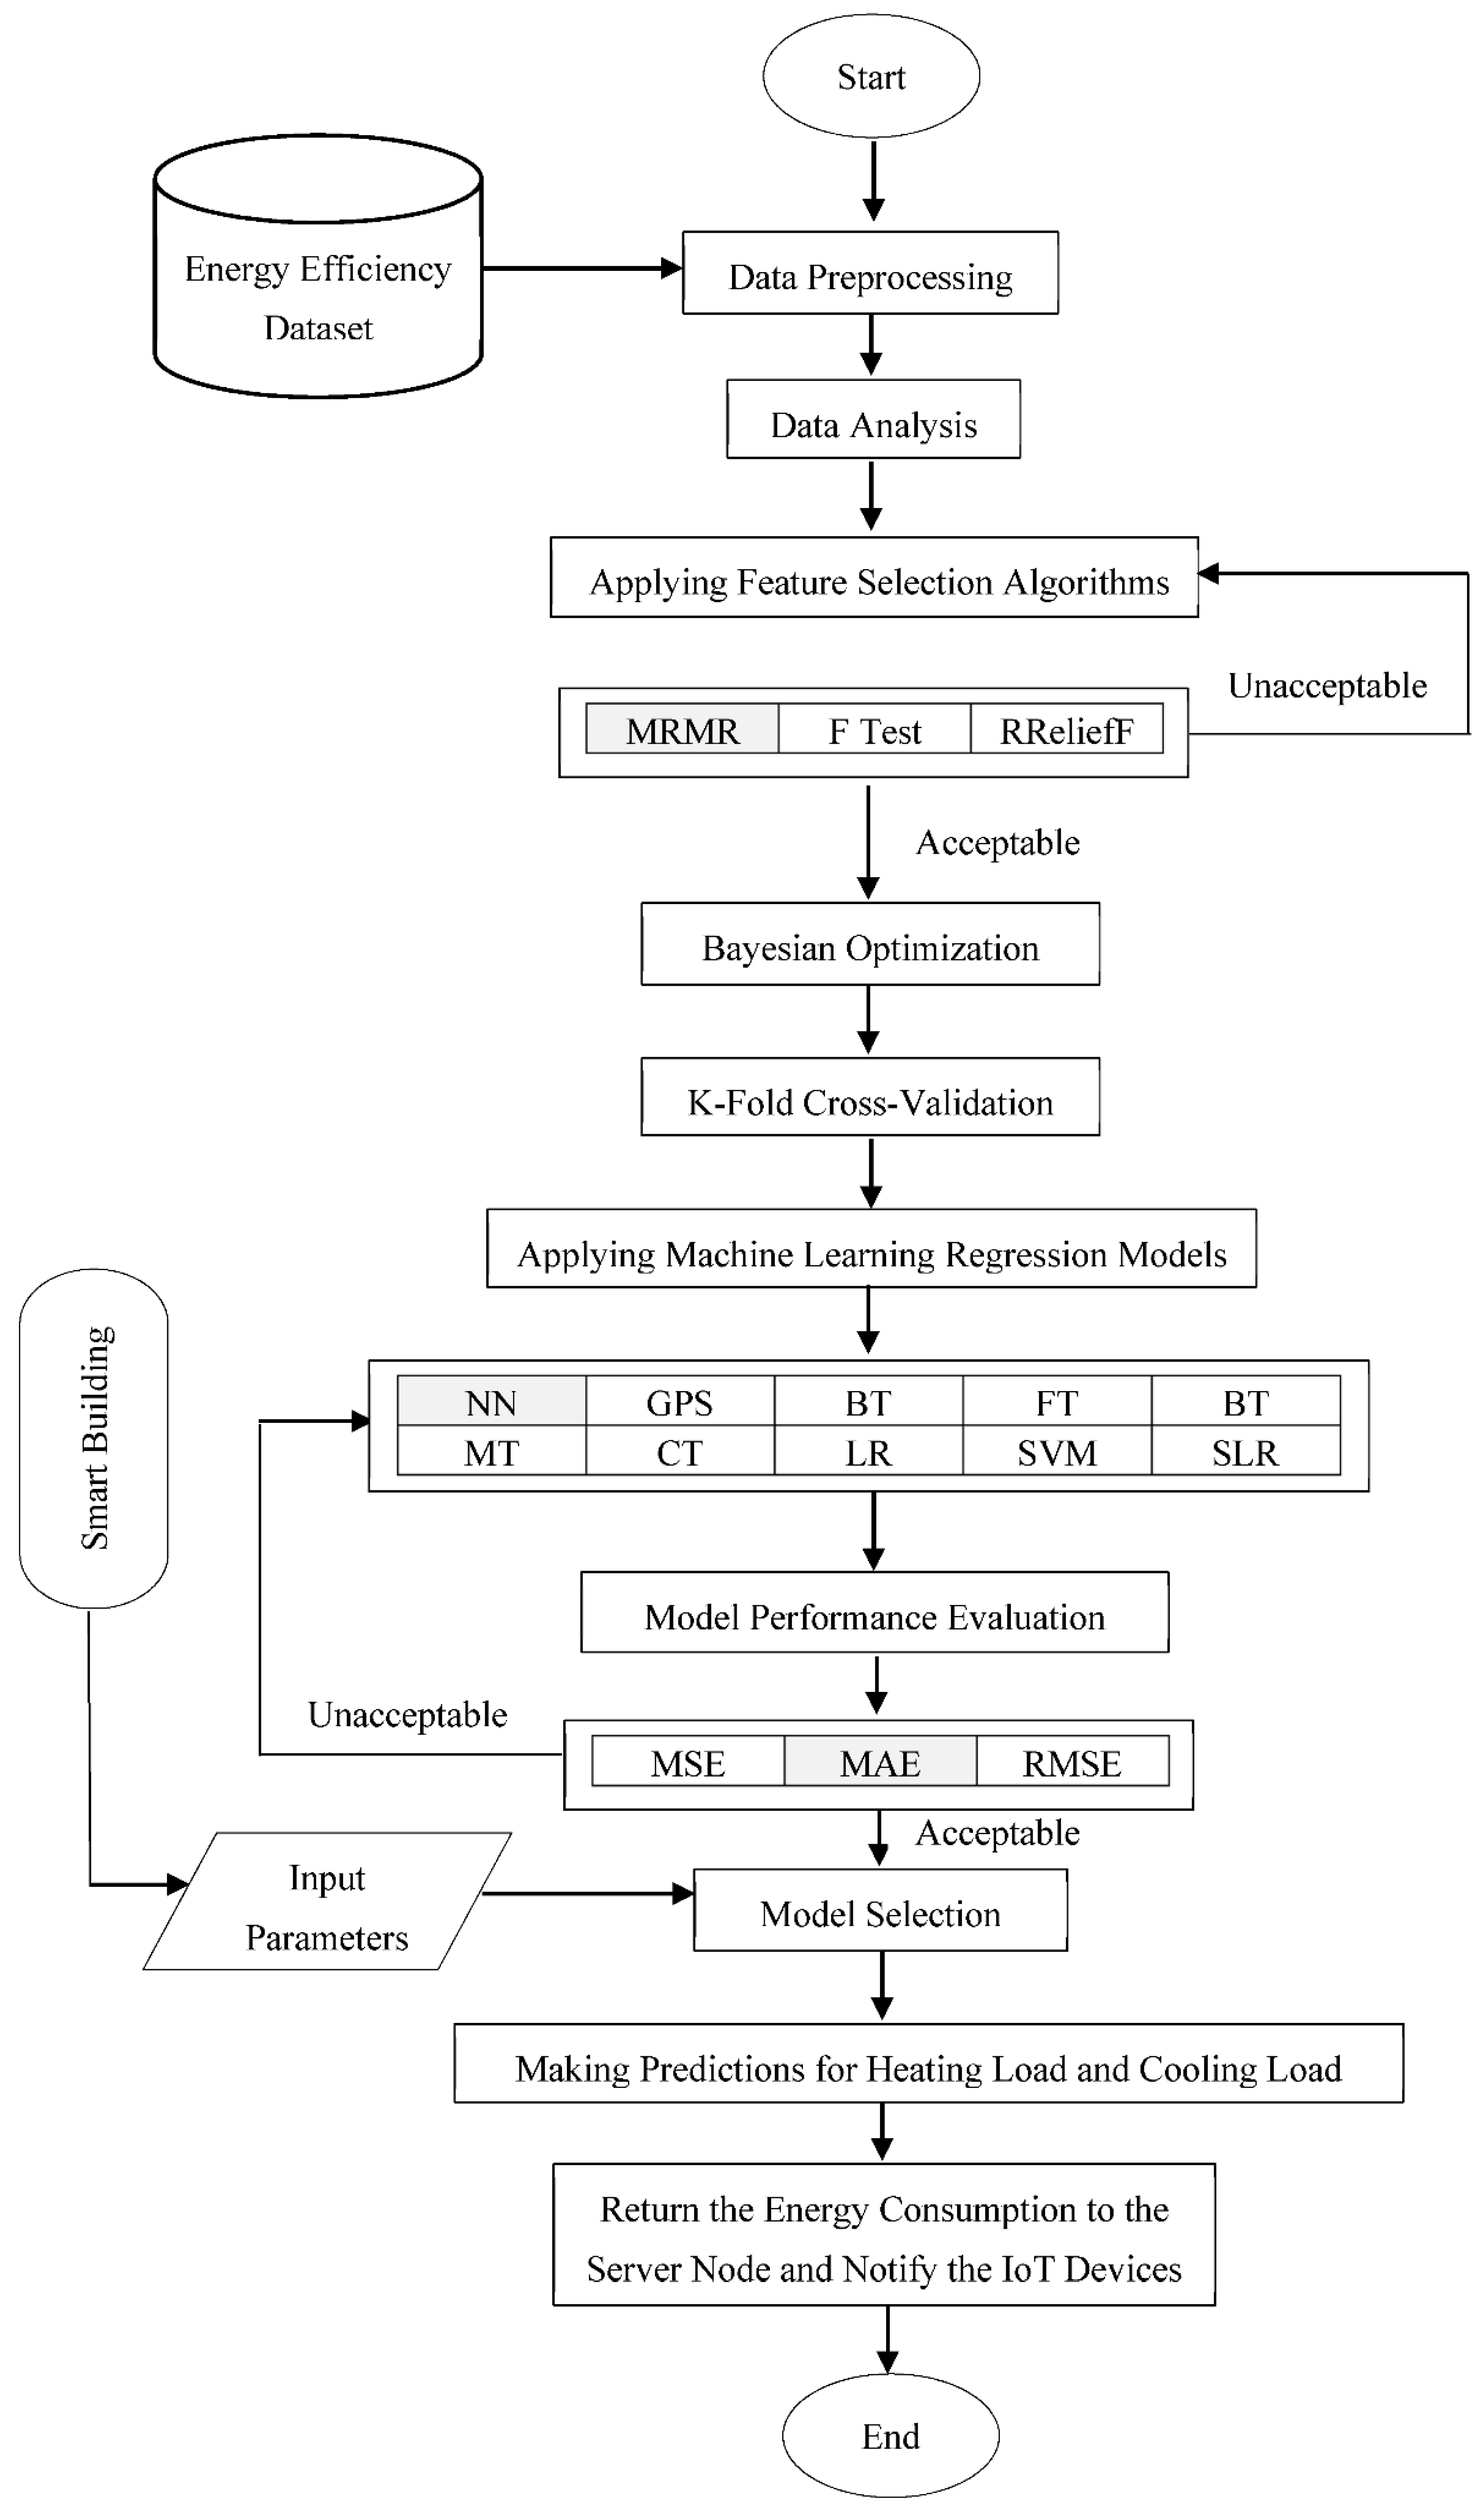
3.3. Algorithm
| Algorithm 1: Proposed Model (TNN + MRMR) |
| Inputs:N: Number of IoT-based smart buildings GA: Glazing areas GAD: Glazing area distributions O: Orientations Outputs:OHL ={o1, o2,…, oN} a set of heating load predictions OCL = {o1, o2,…, oN} a set of cooling load predictions Begin: for i = 1 to N * GA * GAD * O do insert Datai end apply data preprocessing perform data analysis for each feature fi in Data // determining feature importance rank(fi) = MRMR(fi) end D = // feature selection Bayesian optimization ModelHL = TNN(D) // training ModelCL = TNN(D) for each testdata ti do // testing oi = ModelHL(ti) // obtain heating load prediction OHL = OHL U oi oi = ModelCL(ti) // obtain cooling load prediction OCL = OCL U oi end Return OHL and OCL End |
4. Experimental Studies
4.1. Experiments
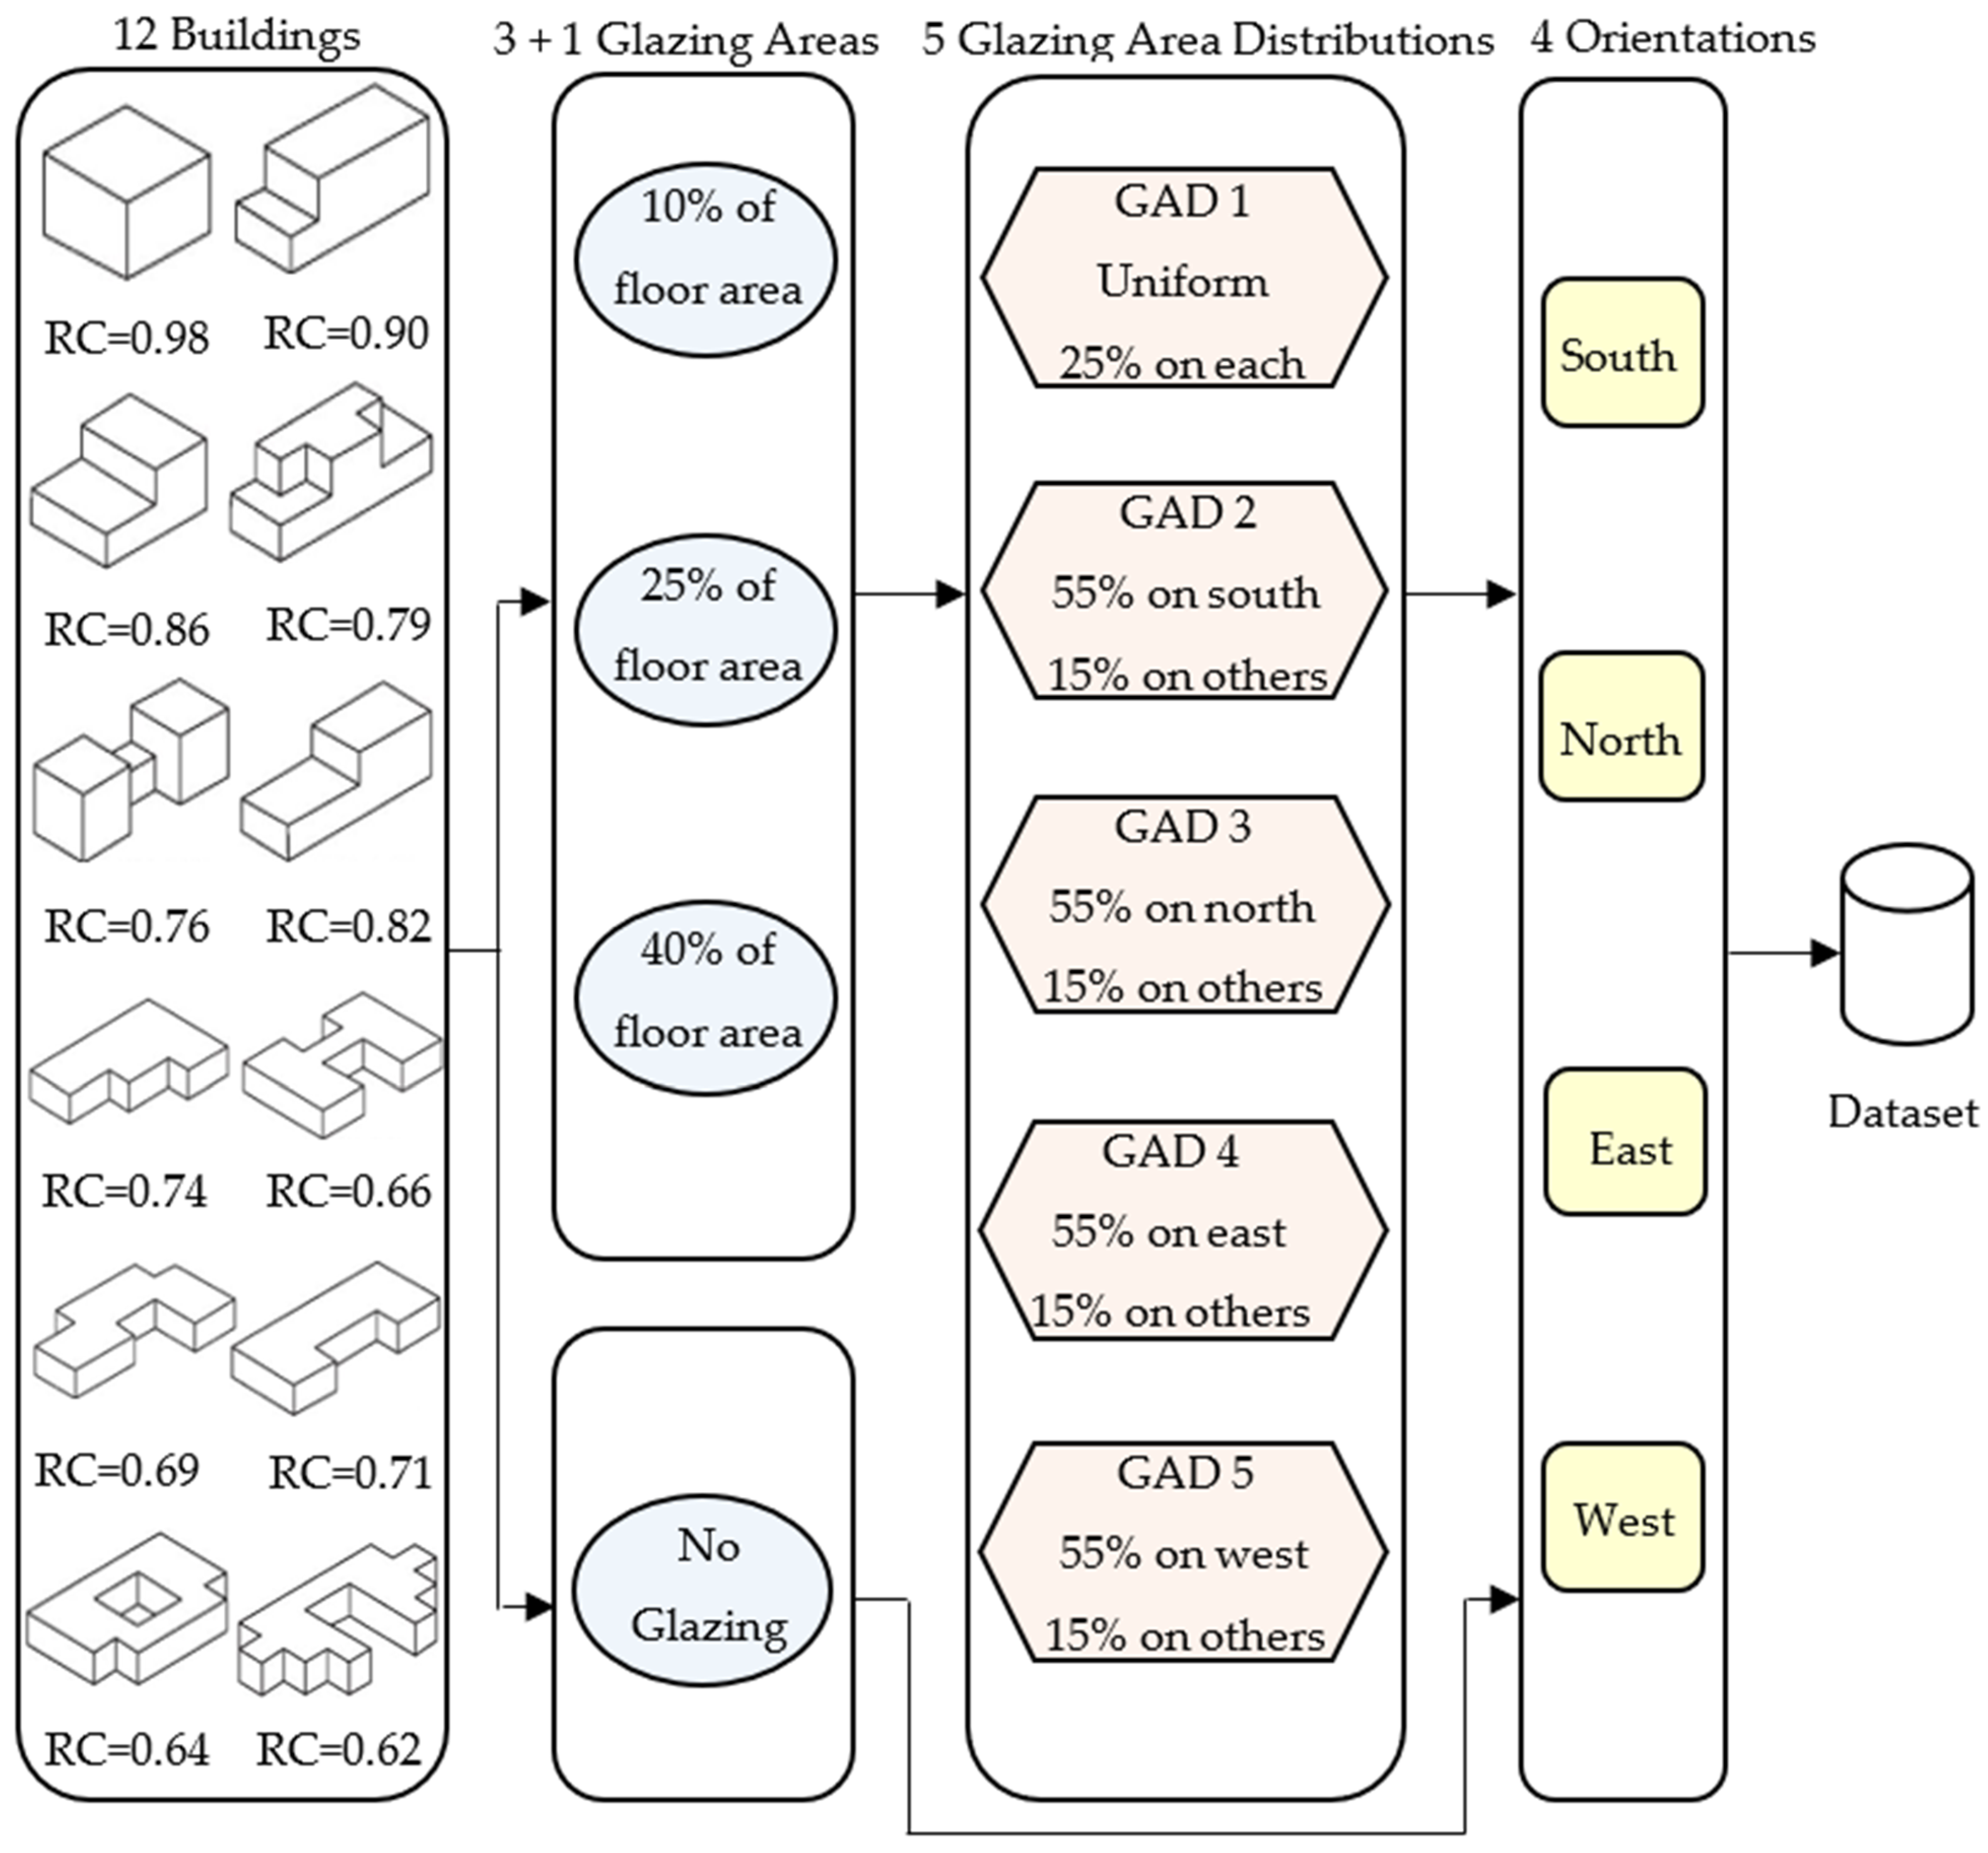
4.2. Dataset Description
4.3. Feature Selection
5. Experimental Results
5.1. Results
5.2. Comparison with the State-of-the-Art Studies
6. Conclusions and Future Works
Author Contributions
Funding
Institutional Review Board Statement
Informed Consent Statement
Data Availability Statement
Conflicts of Interest
References
- Saravanan, G.; Parkhe, S.; Thakar, C.; Kulkarni, V.; Mishra, H.; Gulothungan, G. Implementation of IoT in production and manufacturing: An Industry 4.0 approach. Mater. Today Proc. 2022, 51, 2427–2430. [Google Scholar] [CrossRef]
- Chaudhary, S.; Johari, R.; Bhatia, R.; Gupta, K.; Bhatnagar, A. CRAIOT: Concept, Review and Application(S) of IoT. In Proceedings of the 2019 4th International Conference on Internet of Things: Smart Innovation and Usages (IoT-SIU), Ghaziabad, India, 18–19 April 2019; pp. 1–4. [Google Scholar]
- Dholu, M.; Ghodinde, K. Internet of Things (IoT) for precision agriculture application. In Proceedings of the 2018 2nd International Conference on Trends in Electronics and Informatics (ICOEI), Tirunelveli, India, 11–12 May 2018; pp. 339–342. [Google Scholar]
- Thakur, N.; Han, C.Y. Indoor localization for personalized ambient assisted living of multiple users in multi-floor smart environments. Big Data Cogn. Comput. 2021, 5, 42. [Google Scholar] [CrossRef]
- Parvathi Sangeetha, B.; Kumar, N.; Ambalgi, A.; Abdul Haleem, S.; Thilagam, K.; Vijayakumar, P. IOT based smart irrigation management system for environmental sustainability in India. Sustain. Energy Technol. Assess. 2022, 52, 101973. [Google Scholar] [CrossRef]
- Anand, L.; Kotha, M.; Kannan, N.; Kumar, S.; Meera, M.; Shawl, R.; Ray, A. Design and development of IoT based health monitoring system for military applications. Mater. Today Proc. 2022, 1–4. [Google Scholar] [CrossRef]
- Kaur, J.; Santhoshkumar, N.; Nomani, M.; Kumar Sharma, D.; Pai Maroor, J.; Dhiman, V. Impact of internets of things (IOT) in retail sector. Mater. Today Proc. 2022, 51, 26–30. [Google Scholar] [CrossRef]
- Nithya, N.; Nallavan, G.; Sriabirami, V. A study on surface electromyography in sports applications using IoT. In Intelligent Data Communication Technologies and Internet of Things; Hemanth, D.J., Pelusi, D., Vuppalapati, C., Eds.; Lecture Notes on Data Engineering and Communications Technologies; Springer: Singapore, 2022; Volume 101, pp. 855–867. [Google Scholar]
- Motlagh, N.H.; Mohammadrezaei, M.; Hunt, J.; Zakeri, B. Internet of things (IoT) and the energy sector. Energies 2020, 13, 1–27. [Google Scholar]
- Khanna, A.; Kaur, S. Internet of things (IoT), applications and challenges: A comprehensive review. Wirel. Pers. Commun. 2020, 114, 1687–1762. [Google Scholar] [CrossRef]
- Mahdavinejad, M.; Rezvan, M.; Barekatain, M.; Adibi, P.; Barnaghi, P.; Sheth, A. Machine learning for Internet of things data analysis: A survey. Digit. Commun. Netw. 2018, 4, 161–175. [Google Scholar] [CrossRef]
- Huang, Y.; Li, C. Accurate heating, ventilation and air conditioning system load prediction for residential buildings using improved ant colony optimization and wavelet neural network. J. Build. Eng. 2021, 35, 101972. [Google Scholar] [CrossRef]
- Gaber, T.; El-Ghamry, A.; Hassanien, A. injection attack detection using machine learning for smart Iot applications. Phys. Commun. 2022, 52, 101685. [Google Scholar] [CrossRef]
- Mondal, T.; Mugaloremutt Jayadeva, S.; Pani, R.; Subramanian, M.; Ashokkumar, P.; Sumana, B. E Marketing strategy in health care using IoT and machine learning. Mater. Today Proc. 2022, 56, 2087–2091. [Google Scholar] [CrossRef]
- Siaterlis, G.; Franke, M.; Klein, K.; Hribernik, K.; Papapanagiotakis, G.; Palaiologos, S.; Antypas, G.; Nikolakis, N.; Alexopoulos, K. An IIoT approach for edge intelligence in production environments using machine learning and knowledge graphs. Procedia CIRP 2022, 106, 282–287. [Google Scholar] [CrossRef]
- Ribeiro Junior, F.; Bianchi, R.; Prati, R.; Kolehmainen, K.; Soininen, J.; Kamienski, C. Data reduction based on machine learning algorithms for fog computing in IoT smart agriculture. Biosyst. Eng. 2022, 1–17. [Google Scholar] [CrossRef]
- Tiwari, D.; Bhati, B.; Nagpal, B.; Sankhwar, S.; Al-Turjman, F. An Enhanced intelligent model: To protect marine IoT sensor environment using ensemble machine learning approach. Ocean. Eng. 2021, 242, 110180. [Google Scholar] [CrossRef]
- Fard, R.; Hosseini, S. Machine Learning algorithms for prediction of energy consumption and IoT modeling in complex networks. Microprocess Microsyst. 2022, 89, 104423. [Google Scholar] [CrossRef]
- Cakir, M.; Guvenc, M.; Mistikoglu, S. The experimental application of popular machine learning algorithms on predictive maintenance and the design of IIoT based condition monitoring system. Comput. Ind. Eng 2021, 151, 106948. [Google Scholar] [CrossRef]
- Rahman, H.; Faruq, M.; Abdul Hai, T.; Rahman, W.; Hossain, M.; Hasan, M.; Islam, S.; Moinuddin, M.; Islam, M.; Azad, M. IoT enabled mushroom farm automation with Machine Learning to classify toxic mushrooms in Bangladesh. J. Agric. Res. 2022, 7, 100267. [Google Scholar] [CrossRef]
- Meghana, J.; Hanumanthappa, J.; Prakash, S. Performance comparison of machine learning algorithms for data aggregation in social internet of things. Glob. Transit. Proc. 2021, 2, 212–219. [Google Scholar] [CrossRef]
- Khan, A.; Al-Badi, A. Open source machine learning frameworks for industrial internet of things. Procedia Comput. Sci. 2020, 170, 571–577. [Google Scholar] [CrossRef]
- Zhao, Z.; Anand, R.; Wang, M. Maximum relevance and minimum redundancy feature selection methods for a marketing machine learning platform. In Proceedings of the 2019 IEEE International Conference on Data Science and Advanced Analytics (DSAA), Washington, DC, USA, 5–8 October 2019; pp. 442–452. [Google Scholar]
- Tsanas, A.; Xifara, A. Accurate quantitative estimation of energy performance of residential buildings using statistical machine learning tools. Energy Build. 2012, 49, 560–567. [Google Scholar] [CrossRef]
- Pachauri, N.; Ahn, C. Regression tree ensemble learning-based prediction of the heating and cooling loads of residential buildings. Build. Simul. 2022, 1–15. [Google Scholar] [CrossRef]
- Almutairi, K.; Algarni, S.; Alqahtani, T.; Moayedi, H.; Mosavi, A. A TLBO-Tuned neural processor for predicting heating load in residential buildings. Sustainability 2022, 14, 5924. [Google Scholar] [CrossRef]
- Zheng, S.; Lyu, Z.; Foong, L. Early prediction of cooling load in energy-efficient buildings through novel optimizer of shuffled complex evolution. Eng. Comput. 2020, 38, 105–119. [Google Scholar] [CrossRef]
- Xu, Y.; Li, F.; Asgari, A. Prediction and optimization of heating and cooling loads in a residential building based on multi-layer perceptron neural network and different optimization algorithms. Energy J. 2022, 240, 122692. [Google Scholar] [CrossRef]
- Yildiz, M.; Beyhan, F.; Uçar, M. Enerji verimli bina tasarımında kural tabanlı yöntem yardımıyla isıtma ve soğutma yüklerinin tahminlemesi. OJAD 2021, 10, 73–80. [Google Scholar]
- Zhou, G.; Moayedi, H.; Foong, L. Teaching–learning-based metaheuristic scheme for modifying neural computing in appraising energy performance of building. Eng. Comput. 2021, 37, 3037–3048. [Google Scholar] [CrossRef]
- Moayedi, H.; Mosavi, A. Suggesting a stochastic fractal search paradigm in combination with artificial neural network for early prediction of cooling load in residential buildings. Energies 2021, 14, 1649. [Google Scholar] [CrossRef]
- Hosseini, S.; Fard, R. Machine learning algorithms for predicting electricity consumption of buildings. Wirel. Pers. Commun. 2021, 121, 3329–3341. [Google Scholar] [CrossRef]
- Gkioulekas, I.; Papageorgiou, L. Tree regression models using statistical testing and mixed integer programming. Comput. Ind. Eng. 2021, 153, 107059. [Google Scholar] [CrossRef]
- Chou, J.; Truong, D.; Tsai, C. Solving regression problems with intelligent machine learner for engineering informatics. Mathematics 2021, 9, 686. [Google Scholar] [CrossRef]
- Altay, O.; Ulas, M.; Alyamac, K. DCS-ELM: A novel method for extreme learning machine for regression problems and a new approach for the SFRSCC. PeerJ Comput. Sci. 2021, 7, 411. [Google Scholar] [CrossRef]
- Goyal, M.; Pandey, M. A systematic analysis for energy performance predictions in residential buildings using ensemble learning. Arab. J. Sci. Eng. 2021, 46, 3155–3168. [Google Scholar] [CrossRef]
- Zhou, G.; Moayedi, H.; Bahiraei, M.; Lyu, Z. Employing artificial bee colony and particle swarm techniques for optimizing a neural network in prediction of heating and cooling loads of residential buildings. J. Clean. Prod. 2020, 254, 120082. [Google Scholar] [CrossRef]
- Xudong, L.; Shuo, L.; Fan, Q. Prediction of building energy consumption based on IPSO-CLSTM neural network. J. Auton. Intell. 2021, 3, 11–22. [Google Scholar]
- Rashidifar, R.; Chen, F. Estimation of energy performance of buildings using machine learning tools. Eng. Engrxiv Arch. 2020, 1–6. [Google Scholar]
- Moradzadeh, A.; Mansour-Saatloo, A.; Mohammadi-Ivatloo, B.; Anvari-Moghaddam, A. Performance evaluation of two machine learning techniques in heating and cooling loads forecasting of residential buildings. Appl. Sci. 2020, 10, 3829. [Google Scholar] [CrossRef]
- Guo, Z.; Moayedi, H.; Foong, L.; Bahiraei, M. Optimal modification of heating, ventilation, and air conditioning system performances in residential buildings using the integration of metaheuristic optimization and neural computing. Energy Build. 2020, 214, 109866. [Google Scholar] [CrossRef]
- Akgundogdu, A. Comparative analysis of regression learning methods for estimation of energy performance of residential structures. Erzincan Univ. JST 2020, 13, 600–608. [Google Scholar]
- Moayedi, H.; Mu’azu, M.; Foong, L. Novel swarm-based approach for predicting the cooling load of residential buildings based on social behavior of elephant herds. Energy Build. 2020, 206, 109579. [Google Scholar] [CrossRef]
- Namlı, E.; Erdal, H.; Erdal, H. Artificial intelligence-based prediction models for energy performance of residential buildings. In Recycling and Reuse Approaches for Better Sustainability, 2nd ed.; Balkaya, N., Guneysu, S., Eds.; Springer: Cham, Switzerland, 2018; Volume 1, pp. 141–149. [Google Scholar]
- Le, L.; Nguyen, H.; Zhou, J.; Dou, J.; Moayedi, H. Estimating the heating load of buildings for smart city planning using a novel artificial intelligence technique PSO-XGBOOST. Appl. Sci. 2019, 9, 2714. [Google Scholar] [CrossRef] [Green Version]
- Tien Bui, D.; Moayedi, H.; Anastasios, D.; Kok Foong, L. Predicting heating and cooling loads in energy-efficient buildings using two hybrid intelligent models. Appl. Sci. 2019, 9, 3543. [Google Scholar] [CrossRef] [Green Version]
- Gkioulekas, I.; Papageorgiou, L. Piecewise regression analysis through information criteria using mathematical programming. Expert Syst. Appl. 2019, 121, 362–372. [Google Scholar] [CrossRef]
- Le, L.T.; Nguyen, H.; Dou, J.; Zhou, J. A comparative study of PSO-ANN, GA-ANN, ICA-ANN, and ABC-ANN in estimating the heating load of buildings’ energy efficiency for smart city planning. Appl. Sci. 2019, 9, 2630. [Google Scholar] [CrossRef] [Green Version]
- Razali, C.M.C.; Faruq, A. Comparative study between radial basis function neural network and random forest algorithm for building energy estimation. In Proceedings of the Fifth Malaysia-Japan Joint International Conference (MJJIC 2018), Sepang, Malaysia, 17–18 October 2018; pp. 3–4. [Google Scholar]
- Yang, L.; Liu, S.; Tsoka, S.; Papageorgiou, L. A regression tree approach using mathematical programming. Expert Syst. Appl. 2017, 78, 347–357. [Google Scholar] [CrossRef] [Green Version]
- Peker, M.; Özkaraca, O.; Kesimal, B. Enerji tasarruflu bina tasarımı için isıtma ve soğutma yüklerini regresyon tabanlı makine öğrenmesi algoritmaları ile modelleme. JIT 2017, 10, 443–449. [Google Scholar]
- Altun, M.; Ersöz, A.B.; Akçamete Güngör, A.; Pekcan, O. Application of artificial neural networks on building energy estimation. In Proceedings of the International Conference on Engineering Technologies, Konya, Turkey, 7–9 December 2017; pp. 1–4. [Google Scholar]
- Yang, L.; Liu, S.; Tsoka, S.; Papageorgiou, L. Mathematical programming for piecewise linear regression analysis. Expert Syst. Appl. 2016, 44, 156–167. [Google Scholar] [CrossRef] [Green Version]
- Ertugrul, Ö.F.; Kaya, Y. Smart city planning by estimating energy efficiency of buildings by extreme learning machine. In Proceedings of the 2016 4th International Istanbul Smart Grid Congress and Fair (ICSG), Istanbul, Turkey, 20–21 April 2016; pp. 1–5. [Google Scholar]
- Castelli, M.; Trujillo, L.; Vanneschi, L.; Popovič, A. Prediction of energy performance of residential buildings: A genetic programming approach. Energy Build. 2015, 102, 67–74. [Google Scholar] [CrossRef]
- Cheng, M.; Cao, M. Accurately predicting building energy performance using evolutionary multivariate adaptive regression splines. Appl. Soft Comput. 2014, 22, 178–188. [Google Scholar] [CrossRef]
- Nebot, À.; Mugica, F. Fuzzy approaches improve predictions of energy performance of buildings. In Proceedings of the 3rd International Conference on Simulation and Modeling Methodologies, Technologies and Applications, Reykjavík, Iceland, 29–31 July 2013; pp. 504–511. [Google Scholar]
- Witten, I.H.; Frank, E. Data Mining: Practical Machine Learning Tools with Java Implementations, 3rd ed.; Morgan Kaufmann: San Francisco, CA, USA, 2000; pp. 191–303. [Google Scholar]


| Parameter Type | Parameter Value |
|---|---|
| Number of layers | 3 |
| Number of neurons in each layer | 30 |
| Activation | Rectified Linear Unit (ReLU) |
| Momentum | 0.9000 |
| Iteration limit | 1200 |
| Iteration (epochs) | 30 |
| Regularization strength (lambda) | 0 |
| Initial learn rate | 0.0100 |
| Learn rate schedule | Piecewise |
| Learn rate drop factor | 0.2000 |
| Learn rate drop period | 5 |
| Dataset | Attribute | Problem | Number of Instances | Number of Attributes | Missed Value | Field | Year | Hit |
|---|---|---|---|---|---|---|---|---|
| Multivariate | Real Integer | Regression Classification | 768 | 8 | Not Available | Computer | 2012 | 418,111 |
| Features | Descriptions | Unit | Type | Min | Max | Mean | Mode | Median | Std. Dev. | Skewness |
|---|---|---|---|---|---|---|---|---|---|---|
| X1 | Relative Compactness | - | Input | 0.620 | 0.980 | 0.7642 | 0.980 | 0.750 | 0.106 | 0.496 |
| X2 | Surface Area | m2 | Input | 514.500 | 808.500 | 671.708 | 514.500 | 673.750 | 88.086 | −0.130 |
| X3 | Wall Area | m2 | Input | 245.000 | 416.500 | 318.500 | 294.000 | 318.500 | 43.626 | 0.533 |
| X4 | Roof Area | m2 | Input | 110.250 | 220.500 | 176.604 | 220.500 | 183.750 | 45.166 | −0.163 |
| X5 | Overall Height | m | Input | 3.500 | 7.000 | 5.250 | 7.000 | 5.250 | 1.751 | 0.000 |
| X6 | Orientation | - | Input | 2.000 | 5.000 | 3.500 | 2.000 | 3.500 | 1.119 | 0.000 |
| X7 | Glazing Area | m2 | Input | 0.000 | 0.400 | 0.234 | 0.100 | 0.250 | 0.133 | −0.060 |
| X8 | Glazing Area Distribution | - | Input | 0.000 | 5.000 | 2.812 | 1.000 | 3.000 | 1.551 | −0.089 |
| Y1 | Heating load | kWh/m2 | Output | 6.010 | 43.100 | 22.307 | 15.160 | 18.950 | 10.090 | 0.360 |
| Y2 | Cooling load | kWh/m2 | Output | 10.900 | 48.030 | 24.588 | 21.330 | 22.080 | 9.513 | 0.400 |
| Select | Features | F Test (Weight Value) |
|---|---|---|
| 1 | X2 | 597.2962 |
| 2 | X5 | 396.4874 |
| 3 | X4 | 392.4925 |
| 4 | X1 | 280.5078 |
| 5 | X3 | 132.4942 |
| 6 | X7 | 13.8447 |
| 7 | X8 | 3.2846 |
| 8 | X6 | 0.0004 |
| Select | Features | RReliefF (Weight Value) |
|---|---|---|
| 1 | X2 | 597.2962 |
| 2 | X5 | 396.4874 |
| 3 | X4 | 392.4925 |
| 4 | X1 | 280.5078 |
| 5 | X3 | 132.4942 |
| 6 | X7 | 13.8447 |
| 7 | X8 | 3.2846 |
| 8 | X6 | 0.0004 |
| Select | Features | MRMR (Weight Value) |
|---|---|---|
| 1 | X1 | 1.5395 |
| 2 | X7 | 1.0968 |
| 3 | X5 | 0.0004 |
| 4 | X2 | 0.0003 |
| 5 | X4 | 0.0003 |
| 6 | X3 | 0.0003 |
| 7 | X6 | 0 |
| 8 | X8 | 0 |
| Select | Features | F Test (Weight Value) |
|---|---|---|
| 1 | X1 | Inf |
| 2 | X2 | Inf |
| 3 | X5 | 603.1448 |
| 4 | X4 | 600.1703 |
| 5 | X3 | 202.7149 |
| 6 | X7 | 24.7248 |
| 7 | X8 | 1.4203 |
| 8 | X6 | 0.0006 |
| Select | Features | RReliefF (Weight Value) |
|---|---|---|
| 1 | X7 | 0.0528 |
| 2 | X3 | 0.0407 |
| 3 | X1 | 0.0254 |
| 4 | X2 | 0.0247 |
| 5 | X4 | 0.0032 |
| 6 | X5 | 0 |
| 7 | X8 | −0.0271 |
| 8 | X6 | −0.0646 |
| Select | Features | MRMR (Weight Value) |
|---|---|---|
| 1 | X1 | 1.1764 |
| 2 | X7 | 0.8875 |
| 3 | X5 | 0.1959 |
| 4 | X6 | 0.1920 |
| 5 | X4 | 0.1401 |
| 6 | X8 | 0.1374 |
| 7 | X2 | 0.1053 |
| 8 | X3 | 0.0995 |
| Select | Features | F Test (Weight Value) |
|---|---|---|
| 1 | X2 | 613.0155 |
| 2 | X5 | 403.2400 |
| 3 | X4 | 399.7051 |
| 4 | X1 | 295.1582 |
| 5 | X3 | 142.3529 |
| 6 | X7 | 9.5858 |
| 7 | X8 | 1.5007 |
| 8 | X6 | 0.0506 |
| Select | Features | RReliefF (Weight Value) |
|---|---|---|
| 1 | X3 | 0.0368 |
| 2 | X1 | 0.0252 |
| 3 | X2 | 0.0240 |
| 4 | X7 | 0.0112 |
| 5 | X4 | 0.0063 |
| 6 | X5 | 0 |
| 7 | X8 | −0.0182 |
| 8 | X6 | −0.0478 |
| Select | Features | MRMR (Weight Value) |
|---|---|---|
| 1 | X2 | 1.2353 |
| 2 | X7 | 0.9096 |
| 3 | X5 | 0.0004 |
| 4 | X1 | 0.0003 |
| 5 | X4 | 0.0003 |
| 6 | X3 | 0.0002 |
| 7 | X6 | 0 |
| 8 | X8 | 0 |
| Select | Features | F Test (Weight Value) |
|---|---|---|
| 1 | X1 | Inf |
| 2 | X2 | Inf |
| 3 | X5 | 624.5357 |
| 4 | X4 | 620.3089 |
| 5 | X3 | 217.5311 |
| 6 | X7 | 15.1747 |
| 7 | X8 | 0.2737 |
| 8 | X6 | 0.0771 |
| Select | Features | RReliefF (Weight Value) |
|---|---|---|
| 1 | X3 | 0.0317 |
| 2 | X2 | 0.0192 |
| 3 | X1 | 0.0189 |
| 4 | X7 | 0.0047 |
| 5 | X4 | 0.0022 |
| 6 | X5 | 0 |
| 7 | X8 | −0.0089 |
| 8 | X6 | −0.0341 |
| Select | Features | MRMR (Weight Value) |
|---|---|---|
| 1 | X1 | 1.1521 |
| 2 | X7 | 0.8652 |
| 3 | X5 | 0.2004 |
| 4 | X6 | 0.1872 |
| 5 | X4 | 0.1412 |
| 6 | X8 | 0.1305 |
| 7 | X2 | 0.1090 |
| 8 | X3 | 0.1030 |
| Trained Models | Heating Load (kWh/m2) | ||
|---|---|---|---|
| RMSE | MSE | MAE | |
| Tri-Layered Neural Network | 0.43101 | 0.18577 | 0.28993 |
| Gaussian Process Regression | 0.43094 | 0.18571 | 0.30279 |
| Boosted Trees | 0.57863 | 0.33481 | 0.39011 |
| Fine Tree | 0.69002 | 0.47613 | 0.42614 |
| Bagged Trees | 1.01200 | 1.02410 | 0.62627 |
| Medium Tree | 1.28930 | 1.66220 | 0.62704 |
| Stepwise Linear Regression | 1.06580 | 1.13600 | 0.85654 |
| Linear Regression | 1.08520 | 1.17770 | 0.87552 |
| Support Vector Machine | 1.81500 | 3.29410 | 1.34740 |
| Coarse Tree | 2.55120 | 6.50880 | 1.82770 |
| Trained Models | Heating Load (kWh/m2) | ||
|---|---|---|---|
| RMSE | MSE | MAE | |
| Tri-Layered Neural Network | 0.45689 | 0.20875 | 0.32360 |
| Gaussian Process Regression | 0.46479 | 0.21603 | 0.32875 |
| Fine Tree | 0.66731 | 0.44530 | 0.41115 |
| Medium Tree | 1.02460 | 1.04970 | 0.52673 |
| Boosted Trees | 0.79549 | 0.63280 | 0.56936 |
| Bagged Trees | 1.11810 | 1.25010 | 0.71605 |
| Stepwise Linear Regression | 1.09030 | 1.18880 | 0.85486 |
| Support Vector Machine | 2.15290 | 4.63490 | 1.49260 |
| Coarse Tree | 2.32150 | 5.38930 | 1.61410 |
| Linear Regression | 2.94610 | 8.67920 | 2.09680 |
| Trained Models | Cooling Load (kWh/m2) | ||
|---|---|---|---|
| RMSE | MSE | MAE | |
| Tri-Layered Neural Network | 0.92695 | 0.85924 | 0.58471 |
| Bagged Trees | 1.04970 | 1.10190 | 0.69217 |
| Boosted Trees | 1.14220 | 1.30470 | 0.76579 |
| Gaussian Process Regression | 1.59690 | 2.55000 | 1.00870 |
| Medium Tree | 1.82170 | 3.31840 | 1.21790 |
| Fine Tree | 2.05060 | 4.20510 | 1.26150 |
| Linear Regression | 1.99200 | 3.96800 | 1.56330 |
| Support Vector Machine | 2.54350 | 6.46930 | 1.81400 |
| Stepwise Linear Regression | 2.25080 | 5.06610 | 1.85550 |
| Coarse Tree | 2.70090 | 7.29490 | 1.97750 |
| Trained Models | Cooling Load (kWh/m2) | ||
|---|---|---|---|
| RMSE | MSE | MAE | |
| Tri-Layered Neural Network | 0.81391 | 0.66245 | 0.53527 |
| Gaussian Process Regression | 1.31090 | 1.71850 | 0.85299 |
| Boosted Trees | 1.63640 | 2.67770 | 1.08790 |
| Medium Tree | 1.80640 | 3.26310 | 1.18900 |
| Fine Tree | 1.99780 | 3.99130 | 1.24190 |
| Bagged Trees | 1.87700 | 3.52320 | 1.28010 |
| Linear Regression | 1.93530 | 3.74520 | 1.51460 |
| Support Vector Machine | 2.30970 | 5.33480 | 1.67010 |
| Stepwise Linear Regression | 2.19510 | 4.81860 | 1.78440 |
| Coarse Tree | 2.61780 | 6.85290 | 1.88240 |
| Reference | Year | Method | Heating Load (MAE) (kWh/m2) | Cooling Load (MAE) (kWh/m2) |
|---|---|---|---|---|
| Pachauri and Ahn [25] | 2022 | Stepwise Regression (STR) | 0.997 | 1.631 |
| Squared Exponential Gaussian Process Regression (SEGPR) | 0.627 | 2.685 | ||
| Exponential Gaussian Process Regression (EGPR) | 1.323 | 1.065 | ||
| Matern 5/2 Exponential Gaussian Process Regression (M52GPR) | 0.866 | 2.690 | ||
| Rational Quadratic Exponential Gaussian Process Regression (RQGPR) | 0.736 | 2.694 | ||
| Bayesian Optimized GPR (BGPR) | 0.497 | 0.739 | ||
| Shuffled Frog Leaping Optimization—Regression Tree Ensemble (SRTE) | 0.332 | 0.536 | ||
| Almutairi et al. [26] | 2022 | Firefly Algorithm—Multi-Layer Perceptron (FA-MLP) | 1.797 | - |
| Optics-Inspired Optimization—Multi-Layer Perceptron (OIO-MLP) | 1.927 | - | ||
| Shuffled Complex Evolution—Multi-Layer Perceptron (SCE-MLP) | 1.607 | - | ||
| Teaching–Learning-Based Optimization—Multi-Layer Perceptron (TLBO-MLP) | 1.580 | - | ||
| Zheng et al. [27] | 2022 | Shuffled Complex Evolution—Multi-Layer Perceptron (SCE-MLP) | - | 1.8124 |
| Xu et al. [28] | 2022 | Biogeography-Based Optimization (BBO) | 2.350 | 2.460 |
| Genetic Algorithm (GA) | 2.730 | 2.410 | ||
| Particle Swarm Optimization (PSO) | 3.720 | 3.010 | ||
| Population-Based Incremental Learning (PBIL) | 5.580 | 4.170 | ||
| Evolution Strategy (ES) | 6.650 | 4.490 | ||
| Ant Colony Optimization (ACO) | 8.790 | 6.650 | ||
| Fard and Hosseini [18] | 2022 | K-Nearest Neighbors | 1.512 | 1.339 |
| AdaBoost | 0.292 | 0.911 | ||
| Random Forest | 0.361 | 1.129 | ||
| Neural Network | 2.744 | 3.192 | ||
| Yildiz et al. [29] | 2022 | Decision Tress | 2.520 | 2.400 |
| Zhou et al. [30] | 2021 | Teaching–Learning-Based Optimization—Multi-Layer Perceptron (TLBO-MLP) | - | 1.829 |
| Moayedi and Mosavi [31] | 2021 | Multi-Layer Perceptron Neural Network (MLPNN) | - | 2.457 |
| Grasshopper Optimization Algorithm—Artificial Neural Network (GOA-ANN) | - | 1.895 | ||
| Firefly Algorithm—Artificial Neural Network (FA-ANN) | - | 2.026 | ||
| Stochastic Fractal Search—Artificial Neural Network (SFS–ANN) | - | 1.583 | ||
| Huang and Li [12] | 2021 | Wavelet Neural Network (WNN) | 4.825 | 4.617 |
| Ant Colony Optimization—Wavelet Neural Network (ACO-WNN) | 3.516 | 3.144 | ||
| Improved ACO-WNN (I-ACO-WNN) | 0.847 | 0.700 | ||
| Hosseini and Fard [32] | 2021 | Decision Tree | 0.725 | 1.274 |
| Random Forest | 0.404 | 1.128 | ||
| K-Nearest Neighbors | 1.692 | 1.512 | ||
| Gkioulekas and Papageorgiou [33] | 2021 | StatTree | 0.367 | 1.175 |
| Mathematical Programming Tree (MPtree) | 0.354 | 0.891 | ||
| Cubist | 0.347 | 0.938 | ||
| Classification and Regression Tree (CART) | 2.011 | 2.400 | ||
| Model Tree (M5P) | 0.693 | 1.210 | ||
| Conditional Inference Tree (CTree) | 0.665 | 1.403 | ||
| Chou et al. [34] | 2021 | Artificial Neural Network (ANN) | 0.360 | 0.799 |
| ANN + Classification and Regression Tree (CART) | 0.352 | 0.900 | ||
| Bagging ANN | 0.291 | 0.556 | ||
| Linear Ridge Regression (LRR) | 3.226 | 3.619 | ||
| Altay et al. [35] | 2021 | Linear Regression (LR) | 2.087 | 2.264 |
| Support Vector Regression (SVR) | 2.043 | 2.244 | ||
| Discrete-time Chaotic Systems-based Extreme Learning Machine (DCS-ELM) | 0.803 | 1.074 | ||
| Goyal and Pandey [36] | 2021 | Multiple Linear Regression (MLR) | 2.610 | 2.620 |
| K-Nearest Neighbours (KNN) | 1.960 | 1.540 | ||
| Support Vector Regression (SVR) | 3.190 | 2.250 | ||
| Random Forest | 0.360 | 1.390 | ||
| Gradient Boosting Machines | 0.380 | 1.250 | ||
| Extreme Gradient Boosting | 0.370 | 1.270 | ||
| Zhou et al. [37] | 2020 | Multi-Layer Perceptron (MLP) | 2.460 | 2.427 |
| Artificial Bee Colony—Multi-Layer Perceptron (ABC-MLP) | 1.911 | 2.176 | ||
| Particle Swarm Optimization—Multi-Layer Perceptron (PSO-MLP) | 1.863 | 2.136 | ||
| Xudong et al. [38] | 2020 | Media Loss Rate (MLR) | 2.253 | 2.277 |
| Support Vector Regression (SVR) | 1.207 | 1.546 | ||
| Extreme Learning Machine (ELM) | 0.659 | 1.211 | ||
| Long Short-Term Memory (LSTM) | 0.453 | 1.170 | ||
| Improved Particle Swarm Optimization—Long Short-Term Memory (IPSO-LSTM) | 0.375 | 1.166 | ||
| Improved Particle Swarm Optimization—Convolution Long Short-Term Memory (IPSO-CLSTM) | 0.343 | 1.020 | ||
| Rashidifar and Chen [39] | 2020 | Random Forest | 0.36 | 1.24 |
| Moradzadeh et al. [40] | 2020 | Multi-Layer Perceptron (MLP) | 0.411 | 2.097 |
| Support Vector Regression (SVR | 0.778 | 1.476 | ||
| Guo et al. [41] | 2020 | Wind-Driven Optimization—Multi-Layer Perceptron (WDO-MLP) | 1.986 | 2.242 |
| Whale Optimization Algorithm—Multi-Layer Perceptron (WOA-MLP) | 2.192 | 2.539 | ||
| Spotted Hyena Optimization—Multi-Layer Perceptron (SHO-MLP) | 3.109 | 4.593 | ||
| Salp Swarm Algorithm—Multi-Layer Perceptron (SSA-MLP) | 1.917 | 2.183 | ||
| Akgundogdu [42] | 2020 | Linear Regression | 1.970 | 2.146 |
| Multi-Layer Perceptron (MLP) | 1.406 | 1.635 | ||
| Radial Basis Function Network (RBFN) | 1.794 | 2.001 | ||
| Support Vector Machine (SVM) | 1.892 | 2.066 | ||
| Gaussian Processes (GP) | 1.958 | 2.150 | ||
| Adaptive Neuro-Fuzzy Inference System (ANFIS) | 0.460 | 1.260 | ||
| Moayedi et al. [43] | 2020 | Ant Colony Optimization (ACO)—Multi-Layer Perceptron (ACO-MLP) | - | 2.601 |
| Harris Hawks Optimization—Multi-Layer Perceptron (HHO-MLP) | - | 2.326 | ||
| Elephant Herding Optimization—Multi-Layer Perceptron (EHO-MLP) | - | 2.128 | ||
| Namli et al. [44] | 2019 | Multi-Layer Perceptron (MLP) | 0.840 | 1.838 |
| Support Vector Regression (SVR) | 2.040 | 2.205 | ||
| Instance-based Learning (IBk) | 3.326 | 3.580 | ||
| Locally Weighted Learning (LWL) | 3.303 | 3.009 | ||
| Model Trees Regression (M5P) | 0.649 | 1.186 | ||
| Reduced Error Pruning Tree (REPTree) | 0.386 | 1.179 | ||
| Le et al. [45] | 2019 | Particle Swarm Optimization—Extreme Gradient Boosting Machine (PSO-XGBoost) | 0.615 | - |
| Extreme Gradient Boosting Machine (XGBoost) | 0.720 | - | ||
| Support Vector Machine (SVM) | 0.910 | - | ||
| Random Forest | 0.557 | - | ||
| Genetic Programming (GP) | 0.798 | - | ||
| Classification and Regression Tree (CART) | 0.773 | - | ||
| Bui et al. [46] | 2019 | Artificial Neural Network (ANN) | 2.938 | 3.283 |
| Genetic Algorithm—Artificial Neural Network (GA-ANN) | 2.062 | 2.098 | ||
| Imperialist Competition Algorithm—Artificial Neural Network (ICA-ANN) | 2.008 | 2.105 | ||
| Gkioulekas and Papageorgiou [47] | 2019 | Piecewise Regression with Iterative Akaike (PRIA) | 0.820 | 1.337 |
| Piecewise Regression with Iterative Bayesian (PRIB) | 0.909 | 1.342 | ||
| Piecewise Regression with Optimised Akaike (PROA) | 0.806 | 1.275 | ||
| Piecewise Regression with Optimised Bayesian (PROB) | 0.906 | 1.351 | ||
| Le et al. [48] | 2019 | Genetic Algorithm—Artificial Neural Network (GA-ANN) | 0.798 | - |
| Particle Swarm Optimization—Artificial Neural Network (PSO-ANN) | 1.027 | - | ||
| Imperialist Competitive Algorithm—Artificial Neural Network (ICA-ANN) | 0.980 | - | ||
| Artificial Bee Colony—Artificial Neural Network (ABC-ANN) | 0.957 | - | ||
| Razali et al. [49] | 2018 | Radial Basis Function Neural Network (RBFNN) | 0.320 | 0.890 |
| Random Forest (RF) | 0.510 | 1.420 | ||
| Yang et al. [50] | 2017 | Mathematical Programming Tree (MPTree) | 0.350 | 0.800 |
| Classification and Regression Tree (CART) | 2.000 | 2.380 | ||
| Conditional Inference Tree (Ctree) | 0.630 | 1.400 | ||
| Evolutionary Tree (Evtree) | 0.560 | 1.590 | ||
| M5P Tree | 0.690 | 1.210 | ||
| Cubist | 0.350 | 0.890 | ||
| Peker et al. [51] | 2017 | Support Vector Machine (SVM) | 2.439 | 3.186 |
| Linear Regression | 2.074 | 2.240 | ||
| Random Forest | 0.422 | 1.339 | ||
| K-Nearest Neighbors (KNN) | 1.512 | 1.313 | ||
| Altun et al. [52] | 2017 | Artificial Neural Network (ANN) | 0.350 | 0.800 |
| Yang et al. [53] | 2016 | Linear Regression | 2.089 | 2.266 |
| Multi-Layer Perceptron | 0.993 | 1.924 | ||
| Kriging | 1.788 | 2.044 | ||
| Support Vector Regression (SVR) | 2.036 | 2.191 | ||
| K-Nearest Neighbors (KNN) | 1.937 | 2.148 | ||
| Random Forest | 1.435 | 1.644 | ||
| Multivariate Adaptive Regression Splines (MARS) | 0.796 | 1.324 | ||
| Pace Regression | 2.089 | 2.261 | ||
| Automated Learning of Algebraic Models for Optimization (ALAMO) | 2.722 | 2.765 | ||
| Optimal Piecewise Linear Regression Analysis (OPLRA) | 0.810 | 1.278 | ||
| Ertugrul and Kaya [54] | 2016 | Extreme Learning Machine (ELM) | 2.031 | 1.726 |
| Artificial Neural Network (ANN) | 2.304 | 1.946 | ||
| Linear Regression (LR) | 2.880 | 2.450 | ||
| K-Nearest Neighbor Regression (KNNR) | 2.558 | 1.990 | ||
| Ridge Regression (Ridger) | 2.127 | 2.293 | ||
| Kernel Smoother (kSmooth) | 2.332 | 1.916 | ||
| Pseudo-Inverse Regression (PINVR) | 2.091 | 2.269 | ||
| Partial Least Squares Regression (PLSR) | 2.160 | 2.320 | ||
| Castelli et al. [55] | 2015 | Geometric Semantic Genetic Programming (GSGP) | 1.310 | 1.470 |
| GSGP with Local Search (HYBRID) | 1.260 | 1.370 | ||
| HYBRID Approach Integrated with Linear Scaling (HYBRID-LIN) | 0.510 | 1.180 | ||
| Cheng and Cao [56] | 2014 | Evolutionary Multivariate Adaptive Regression Splines (EMARS) | 0.350 | 0.710 |
| Multivariate Adaptive Regression Splines (MARS) | 0.530 | 1.120 | ||
| Back-Propagation Neural Network (BPNN) | 1.610 | 1.920 | ||
| Radial Basis Function Neural Network (RBFNN) | 0.510 | 1.300 | ||
| Classification And Regression Tree (CART) | 0.730 | 1.310 | ||
| Support Vector Machine (SVM) | 2.190 | 2.100 | ||
| Nebot and Mugica [57] | 2013 | Adaptive Neuro-Fuzzy Inference System (ANFIS) | 0.520 | 1.060 |
| Fuzzy Inductive Reasoning (FIR) | 0.350 | 1.090 | ||
| Tsanasa and Xifarab [24] | 2012 | Random Forest | 0.510 | 1.420 |
| Iteratively Reweighted Least Squares (IRLS) | 2.140 | 2.210 | ||
| Average | 1.506 | 1.893 | ||
| Proposed Method | Tri-Layered Neural Network (TNN) + Maximum Relevance Minimum Redundancy (MRMR) | 0.289 | 0.535 | |
Publisher’s Note: MDPI stays neutral with regard to jurisdictional claims in published maps and institutional affiliations. |
© 2022 by the authors. Licensee MDPI, Basel, Switzerland. This article is an open access article distributed under the terms and conditions of the Creative Commons Attribution (CC BY) license (https://creativecommons.org/licenses/by/4.0/).
Share and Cite
Ghasemkhani, B.; Yilmaz, R.; Birant, D.; Kut, R.A. Machine Learning Models for the Prediction of Energy Consumption Based on Cooling and Heating Loads in Internet-of-Things-Based Smart Buildings. Symmetry 2022, 14, 1553. https://doi.org/10.3390/sym14081553
Ghasemkhani B, Yilmaz R, Birant D, Kut RA. Machine Learning Models for the Prediction of Energy Consumption Based on Cooling and Heating Loads in Internet-of-Things-Based Smart Buildings. Symmetry. 2022; 14(8):1553. https://doi.org/10.3390/sym14081553
Chicago/Turabian StyleGhasemkhani, Bita, Reyat Yilmaz, Derya Birant, and Recep Alp Kut. 2022. "Machine Learning Models for the Prediction of Energy Consumption Based on Cooling and Heating Loads in Internet-of-Things-Based Smart Buildings" Symmetry 14, no. 8: 1553. https://doi.org/10.3390/sym14081553
APA StyleGhasemkhani, B., Yilmaz, R., Birant, D., & Kut, R. A. (2022). Machine Learning Models for the Prediction of Energy Consumption Based on Cooling and Heating Loads in Internet-of-Things-Based Smart Buildings. Symmetry, 14(8), 1553. https://doi.org/10.3390/sym14081553