Article

A Fault Diagnosis and Prognosis Method for Lithium-Ion Batteries Based on a Nonlinear Autoregressive Exogenous Neural Network and Boxplot

1
School of Information and Electronic Engineering, Shandong Technology and Business University, Yantai 264005, China
2
School of Control Science and Engineering, Shandong University, Jinan 250061, China
3
Yantai Dongfang Wisdom Electric Co., Ltd., Yantai 264003, China
*
Authors to whom correspondence should be addressed.
Symmetry 2021, 13(9), 1714; https://doi.org/10.3390/sym13091714
Submission received: 18 August 2021 / Revised: 12 September 2021 / Accepted: 14 September 2021 / Published: 16 September 2021
(This article belongs to the Special Issue Symmetry in Power Battery Management Systems)

Abstract

:
The frequent occurrence of electric vehicle fire accidents reveals the safety hazards of batteries. When a battery fails, its symmetry is broken, which results in a rapid degradation of its safety performance and poses a great threat to electric vehicles. Therefore, accurate battery fault diagnoses and prognoses are the key to ensuring the safe and durable operation of electric vehicles. Thus, in this paper, we propose a new fault diagnosis and prognosis method for lithium-ion batteries based on a nonlinear autoregressive exogenous (NARX) neural network and boxplot for the first time. Firstly, experiments are conducted under different temperature conditions to guarantee the diversity of the data of lithium-ion batteries and then to ensure the accuracy of the fault diagnosis and prognosis at different working temperatures. Based on the collected voltage and current data, the NARX neural network is then used to accurately predict the future battery voltage. A boxplot is then used for the battery fault diagnosis and early warning based on the predicted voltage. Finally, the experimental results (in a new dataset) and a comparative study with a back propagation (BP) neural network not only validate the high precision, all-climate applicability, strong robustness and superiority of the proposed NARX model but also verify the fault diagnosis and early warning ability of the boxplot. In summary, the proposed fault diagnosis and prognosis approach is promising in real electric vehicle applications.

1. Introduction

In recent years, electric vehicles powered by lithium-ion batteries have received widespread attention at home and abroad as the future of the automobile industry is developed in the direction of high efficiency and sustainability to solve problems such as the energy crisis and environment pollution [1,2,3,4]. As an important part of electric vehicles, the battery system largely determines the performance of electric vehicles [5,6]. Among them, lithium-ion batteries have been widely used in various energy storage applications such as electric vehicles and the smart grid because of their advantages of high energy density, high power density, high cell voltage, long cycle life, light weight and environmental protection and they have become the hot spot in the development of global electric vehicles [7,8]. The battery pack usually consists of hundreds or thousands of cells connected in series and parallel to obtain the desired voltage and capacity [9,10]. Due to defects in the production and manufacturing process, abusive operation during the actual use process, the aging of the battery and the destruction of the symmetrical structure, each cell or related components may have various faults and this safety hazard is huge [11,12,13]. If these faults are not diagnosed and handled in a timely manner, the safety performance of the battery will be significantly reduced and thermal runaway may even appear in a few extreme cases, posing a serious threat to the normal operation of electric vehicles and the safety of drivers [14,15,16]. Many studies have shown that voltage anomalies are an important fault indicator and the battery voltage will fluctuate differently from normal when the battery is faulty [17]. Typical voltage abnormalities can be classified as overvoltage and undervoltage [18]. Overvoltage means that the battery is overcharged and there may be an open-circuit fault or an overvoltage fault. Undervoltage means that the battery is discharged excessively, which may cause a short-circuit fault or an undervoltage fault. Therefore, accurate voltage prediction, rapid voltage abnormality identification, timely fault diagnosis and fault warnings are essential to guarantee and improve the safety and durability of lithium-ion batteries and prevent the occurrence of thermal runaway.
At present, many researchers have made great efforts in fault diagnosis and the fault diagnosis methods proposed in the existing literature can be classified into three categories: threshold-based methods, model-based methods and data-driven-based methods. The threshold-based fault diagnosis methods include the fixed-threshold method, multi-threshold method and adaptive-threshold method. For example, Zhao et al. [19] detected overvoltage/undervoltage faults by judging whether the battery voltage exceeded the threshold. Duan et al. [20] calculated the evaluated values of twelve cells under three evaluation factors based on information entropy then calculated the standard deviation of the evaluated values and finally compared the standard deviation with the set threshold to evaluate the degree of the battery pack inconsistency. This kind of method has the advantages of simplicity and easy implementation but it is a great challenge to determine the appropriate thresholds in practical applications. If the threshold is set too high, the sensitivity of the fault diagnosis will be reduced and the alarm may not be triggered. Conversely, a too low threshold makes it more likely to be triggered, which can easily lead to false alarms. In contrast, the model-based methods can accurately describe the dynamic characteristics of the battery and distinguish the fault when the voltage is within a safe range [21,22,23]. A great deal of research has been devoted to modeling lithium-ion batteries and the most commonly used of these is the equivalent circuit model (ECM) [24]. Liu et al. [25] proposed a series battery pack sensor fault detection and isolation scheme based on a second-order ECM and an adaptive extended Kalman filter. Xiong et al. [26] proposed a two-step ECM-based method for the diagnosis of an external short-circuit (ESC) fault in a battery pack. However, the model-based methods rely heavily on the accuracy of the battery model. In addition, battery systems are highly nonlinear and usually a model can only be used to detect a specific fault type. Therefore, this requires a large amount of modeling effort resulting in an online implementation complexity. In order to deal with the strong nonlinearity of the battery system and to find simple, efficient, easy to implement and robust fault diagnosis methods, data-driven-based methods have been widely explored and have become a hot spot for fault diagnosis research [27,28,29,30]. Kang et al. [31] proposed an online multi-fault diagnosis method for a series battery pack based on an improved correlation coefficient method and a nonredundant crossed-style measurement circuit. Shang et al. [32] proposed an early multi-fault diagnosis method for batteries based on modified sample entropy. However, most of these fault diagnosis methods only amplify abnormal voltages to diagnose early minor faults and they cannot predict future voltages and battery faults.
The frequent occurrence of electric vehicle fire accidents has caused several scholars to pay great attention to the prediction of battery faults [33]. With the rapid development of artificial intelligence, machine learning technologies are considered to be powerful tools for modeling highly nonlinear systems, which provide great opportunities to achieve battery fault diagnosis and prognosis. A few scholars have begun to use neural networks to predict battery voltage and realize battery fault prognosis. Hong et al. [17] used a long short-term memory (LSTM) neural network for the multi-step voltage prediction of a battery system and combined this with the alarm threshold to evaluate the safety of the battery to determine whether the battery would fail. In addition, Li et al. [34] proposed a new battery fault diagnosis method combining the LSTM model and the ECM to perform a risk assessment of potential faults and realize an early warning of thermal runaway. Although the applications of neural networks in battery management systems (BMS) are increasing, they are mostly focused on the state of charge (SOC) estimation [35,36], state of health (SOH) estimation [37,38] and remaining useful life (RUL) prediction [39,40]. Battery voltage prediction and fault prognosis has not been fully explored and are still controversial. In order to fill the gap in this area, this paper proposes a fault diagnosis and prognosis method for lithium-ion batteries based on an accurate voltage prediction using a nonlinear autoregressive with exogenous input (NARX) neural network. The NARX neural network is one of the most widely used neural networks in nonlinear dynamic systems, which can effectively handle time series data. This method includes the time delay feedback of the network and is able to retain the past values of input and output data and apply them to the calculation of the current output, which can effectively deal with the long-term dependence of the data. Although the NARX neural network has a strong predictive and nonlinear mapping ability, no research has been seen in the literature that is devoted to developing a voltage prediction and fault prognosis model for lithium-ion batteries.
In this study, we propose a new fault diagnosis and prognosis method for lithium-ion batteries. When the NARX voltage prediction model is built, based on the accurate prediction of the future battery voltage, a boxplot is used to further identify the abnormal voltage and provide an early fault warning for the battery. The flowchart of the battery voltage prediction and the fault prognosis based on the NARX network is shown in Figure 1, including offline and online parts. In the development of the voltage prediction model, the influence of temperature is comprehensively considered in this study and the all-climate applicability of the NARX voltage prediction model is verified. In addition, unlike other studies, the validation dataset used in this study is completely new, rather than using the traditional K-fold cross-validation method, which validates the robustness and generalization of the proposed NARX voltage prediction model. Finally, the voltage abnormality levels and types are classified based on the boxplot, which can effectively realize the fault diagnosis of the battery.
The rest of the paper is organized as follows: Section 2 describes the acquisition of the lithium-ion battery characteristic data and the development of the NARX voltage prediction model in detail. In Section 3, the voltage prediction results and a comparative study discussion are given. Section 4 describes the fault diagnosis and early warning strategy. Finally, Section 5 summarizes this work.

2. Voltage Prediction Model Development

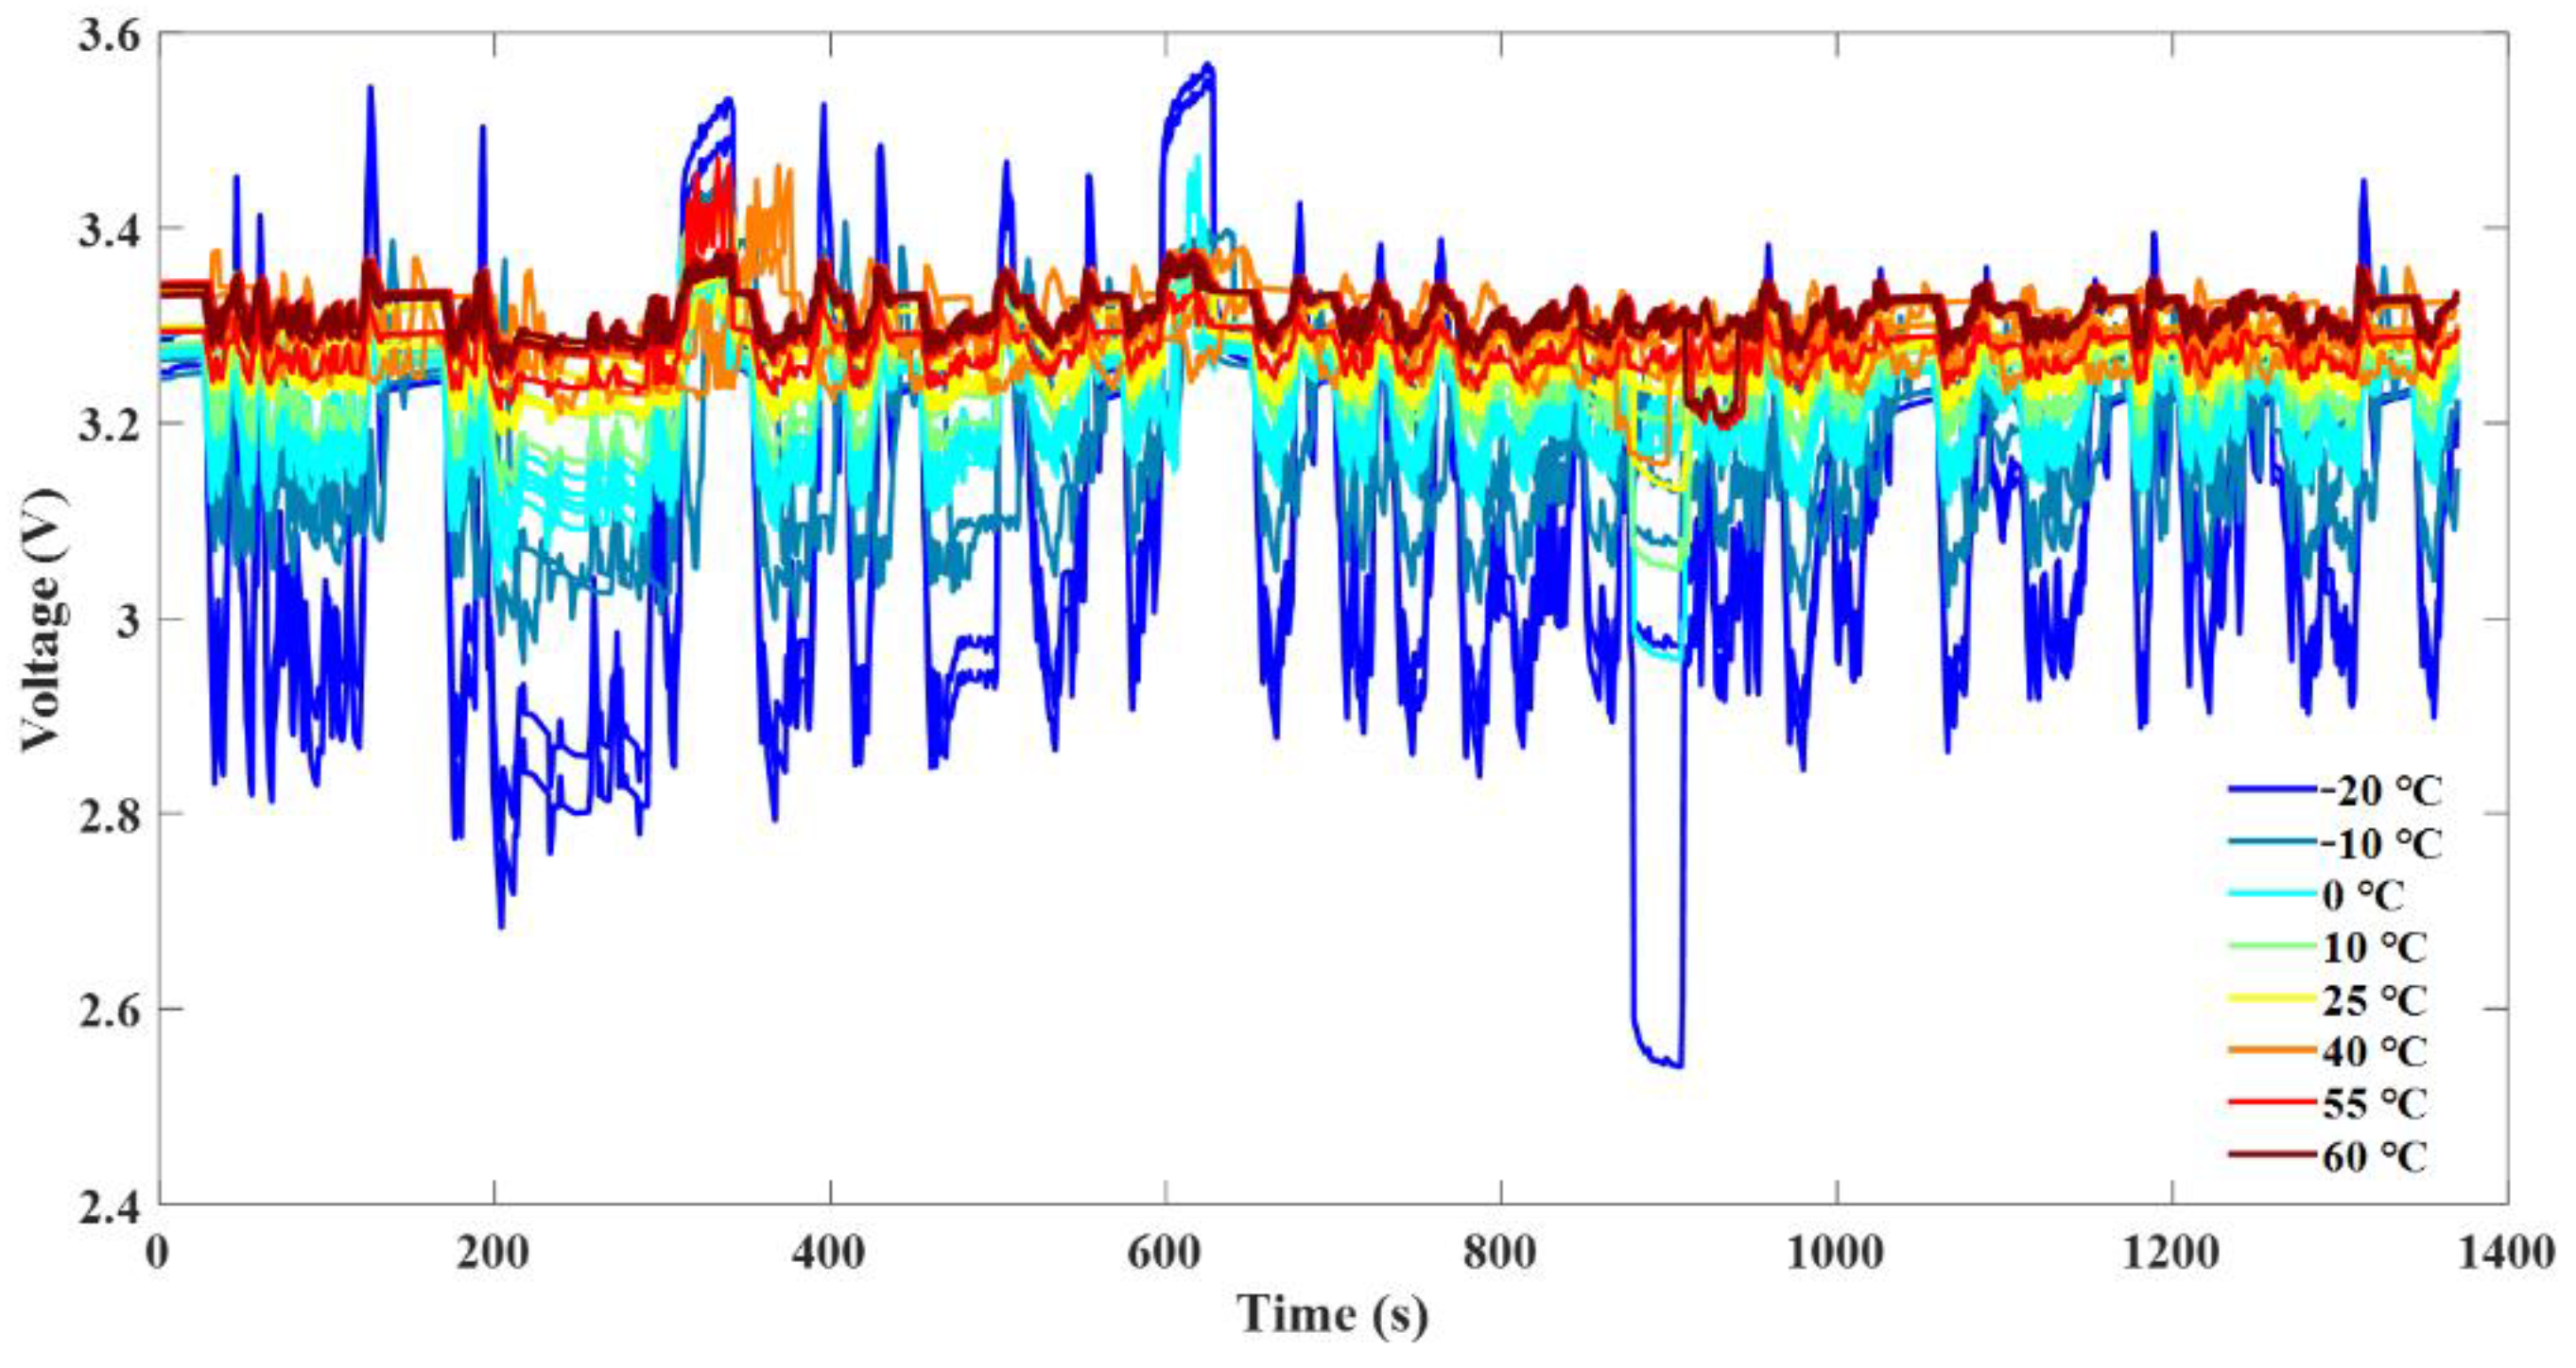
2.1. Description of the Data Acquisition

The development of a voltage prediction model requires sufficient datasets so the acquisition of lithium-ion battery characteristic data is the premise of building a robust voltage prediction model. The battery characteristic data used in this work were obtained by means of a full set of battery test simulation equipment owned by the laboratory of the electric vehicle power battery research group at Shandong University. The experimental apparatus mainly included a host computer, a Jufu (Suzhou) low and high temperature testing machine, an Arbin power battery tester and test batteries. The specific parameters of the test battery are shown in Table 1. The 1865 EH consists of twenty 1.6 Ah Lishen 18,650 lithium-ion batteries in parallel. Its typical application is as power battery for electric vehicles. In this work, twenty-three batteries of the same specification were used for charging and discharging experiments according to the test temperatures summarized in Table 2 and the data acquisition frequency was 1 Hz. The collected battery data included the normal and faulty data. In order to achieve an online diagnosis and an early warning of battery faults, it was necessary to make full use of the easily accessible voltage, current and temperature data. However, the temperature data could not well-reflect the electrical characteristics of the battery system and the correlation analysis showed a weak correlation between the temperature and voltage so the battery current was finally selected as the input of the NARX in this work.

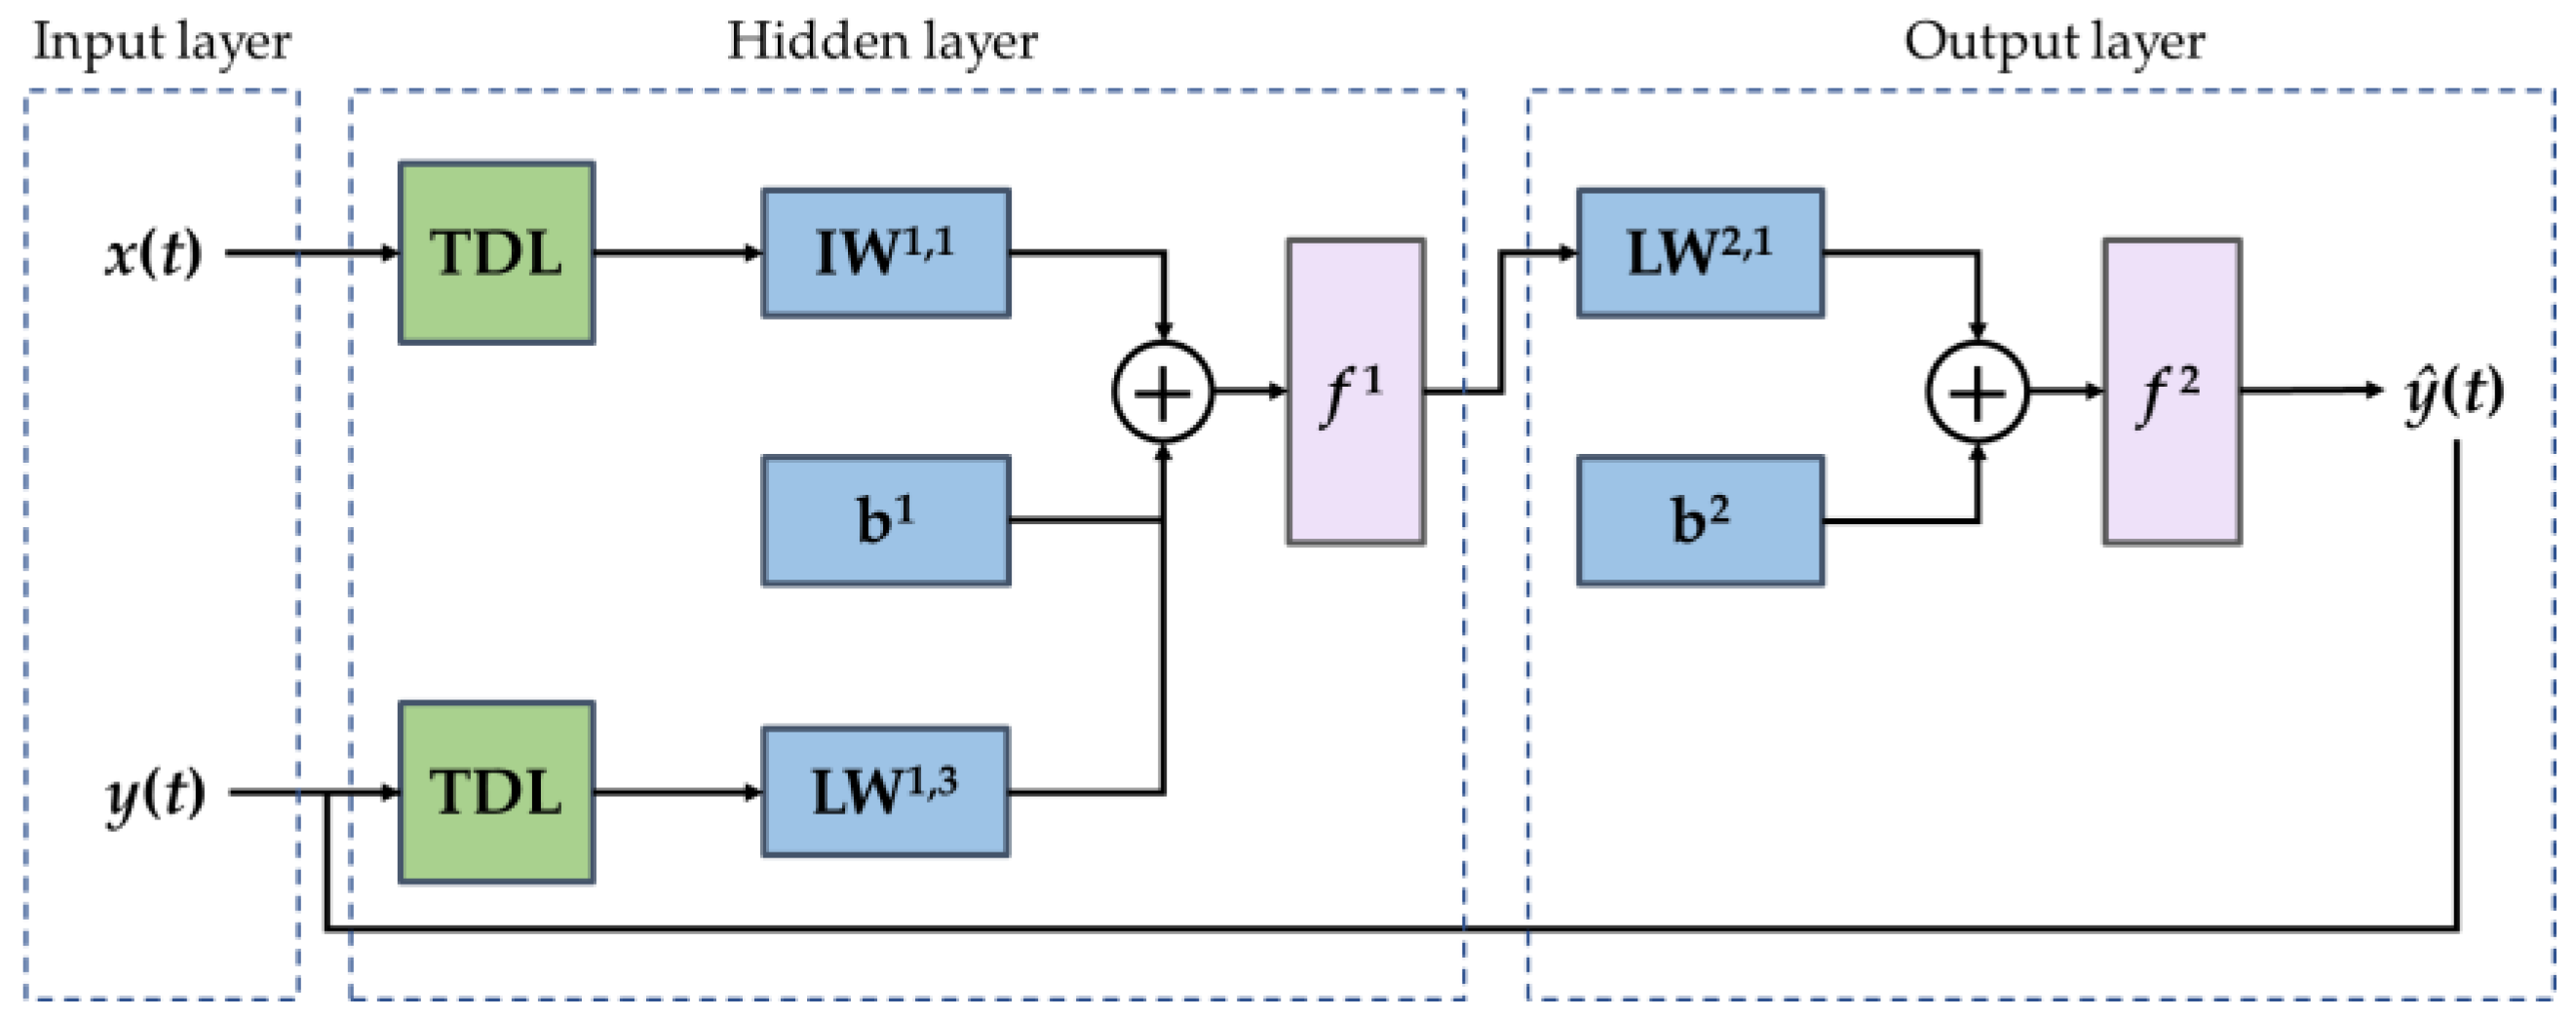
2.2. NARX Architecture

Nonlinear autoregressive with exogenous input (NARX) neural network is a dynamic neural network with time delay and feedback mechanisms, thus enhancing its ability to memorize historical data and effectively handle long-term dependencies. The output data y(t) of this network depends on the past value of y ( t ) and the past value of the external input data x ( t ) . The mathematical model of the NARX can be expressed as [41]:
y ( t ) = f ( y ( t 1 ) , y ( t 2 ) , , y ( t d y ) , x ( t 1 ) , x ( t 2 ) , , x ( t d x ) )
where f ( , ) is the nonlinear mapping function, d x is the input time delay and d y is the output time delay.
A standard NARX neural network is composed of an input layer, a hidden layer and an output layer as well as an input and output time delay. The network structure is shown in Figure 2 where the time delay line (TDL) is the input and output time delay, IW is the input weight, b is the bias, LW is the layer weight and f is the activation function. The hidden and output layers constitute a two-layer feedforward network in which the activation functions of the hidden layer and the output layer are the sigmoid function and linear function, respectively. The NARX network uses the TDL to store the past values of x ( t ) and y ( t ) and applies them to the calculation of the current output, updating the current value of the output accordingly. Therefore, the input of the NARX network includes time delay X ( t ) :
X ( t ) = [ x ( t 1 ) , x ( t 2 ) , , x ( t d x ) y ( t 1 ) , y ( t 2 ) , , y ( t d y ) ] .
Battery faults will lead to voltage abnormities and an abnormal voltage also means that battery faults have occurred or potential faults will occur. Therefore, the abnormal voltage is an important indicator of battery faults and battery faults diagnosis can be performed by the predicted voltage. Lithium-ion batteries are a dynamic system with strong nonlinearity and it is difficult to accurately describe the drastic voltage changes by traditional modeling methods. As mentioned above, the NARX dynamic neural network contains the time delay X ( t ) , which has the ability to cope with the nonlinear behavior of system and can be effectively used for the voltage prediction of the nonlinear battery system.

2.3. Model Training and Voltage Prediction Based on the NARX

Before training the NARX network, the input delay, feedback delay, size of the hidden layer, feedback mode and training function should be determined in advance. In addition, each time the neural network is trained, different outputs may be generated due to different initial weights and biases and different ways of dividing the dataset into training data, validation data and test data. Therefore, multiple retraining is required to find an accurate and reliable voltage prediction model. After network training, it is an essential step to evaluate the prediction performance of the NARX voltage prediction model.

2.3.1. Determination of the Time Delays and Hidden Layer Size

The selection of the size of delay and hidden layer neurons also has a certain impact on the prediction accuracy of the NARX network. When the training performance of the network is unsatisfactory, it can try to increase the number of delay and hidden layer neurons. Increasing the number of neurons also means that more computations are required. Moreover, when the number is set too high, there may be a tendency of overfitting, resulting in a very small error in the training data but a large error in the test data. Therefore, the selection of the number of delay and hidden layer neurons should maintain the high prediction accuracy of the model and also avoid overfitting to ensure the generalization ability of the network as well as achieving a balance between the two.

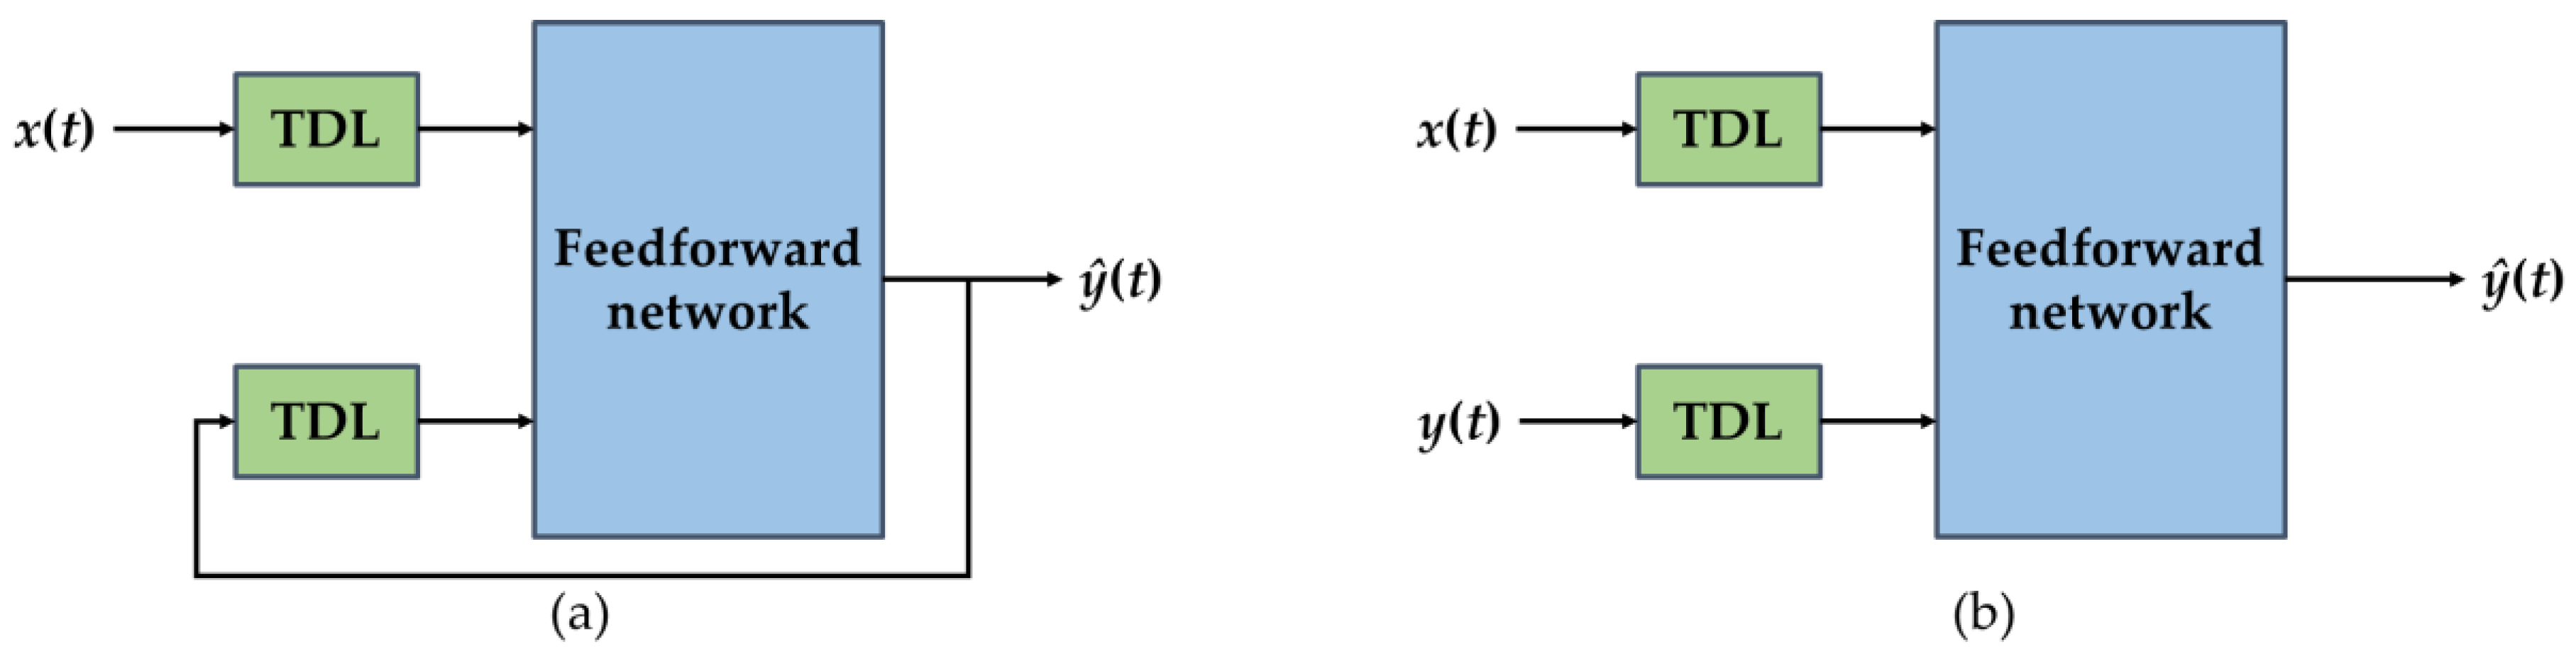
2.3.2. Determination of the Feedback Mode

The NARX network contains two feedback modes: the parallel mode and the series-parallel mode [42]. The parallel mode is also called the close-loop mode. In this mode, the output of the network is the feedback to the input of the feedforward neural network through the time delay. Its structure is shown in Figure 3a. As the real output is available during the training period of the network, the feedback loop can be opened and use an open-loop architecture (series-parallel architecture) as shown in Figure 3b, where the real output was used instead of the feedback estimated output. For effective training, we chose the series-parallel architecture for this work. As the expected output feeds back to the input in this mode, the prediction performance is more accurate and the generated network is a pure feedforward architecture that can be trained with more efficient algorithms.

2.3.3. Determination of the Train Function

There are various training functions to train the NARX network, among which the Levenberg–Marquardt (LM), Bayesian regularization (BR) and scaled conjugate gradient (SCG) are the three most commonly used training algorithms. In this work, the LM algorithm was chosen. The LM algorithm is a hybrid algorithm combining the Gauss–Newton method and the gradient descent method [43]. The gradient descent method ensures that the loss function decreases at each iteration but the convergence is slow. The Gauss–Newton method converges very quickly but does not guarantee that the function is going down at each iteration. The LM algorithm integrates the advantages of these two methods. By adjusting the damping factor μ , the optimization can switch between the gradient descent method and Gauss–Newton method freely. It not only guarantees that the loss function descends at each iteration but also guarantees a fast convergence. The LM algorithm is described in Equation (3). When μ is large it is equivalent to the gradient descent method and when μ is small it is equivalent to the Gauss–Newton method. A relatively small μ should be set at first when using the LM algorithm. When the objective function increases, μ should be increased by using the gradient descent method to find the minimum value of the loss of function and then μ should be decreased to find it using the Gauss–Newton method.
( J T J + μ I ) h lm = g    with    g = J T f    and    μ 0
where I is the identity matrix, g is the gradient, μ is the damping factor and μ > 0 ensures that h lm is a descent direction. Here, J = J ( x ) and f = f ( x ) and J is a Jacobian matrix that contains the first-order partial derivatives of the function f ( x ) .

2.3.4. Predictive Performance Evaluation

After the parameters of the NARX network were determined, we began to train the network and the training continued until the validation error failed to decrease for six iterations. After training the network, it was necessary to evaluate the performance of the well-trained NARX voltage prediction model. The most commonly used performance indicators are the root mean square error (RMSE), mean absolute error (MAE) and R-square ( R 2 ) [44]. The values of RMSE and MAE were closer to zero and the value of R 2 was closer to 1, indicating that the accuracy of the model was higher and the predicted value was closer to the real value. The performance indicators in this work were defined as follows:
R M S E = 1 n t = 1 n ( U ^ t U t ) 2
M A E = 1 n t = 1 n | ( U ^ t U t ) |
R 2 = 1 t = 1 n ( U ^ t U t ) 2 t = 1 n ( U t U ¯ ) 2
where n is the time step, U ^ t and U t represent the predicted voltage and real voltage, respectively, and U ¯ is the mean value of the voltage sequence U .

3. Voltage Prediction Results and Discussion

In this work, the dataset obtained through the experiment contained the voltage and current data collected from twenty-three batteries of the same specification in charge and discharge experiments at eight temperatures, which enabled us to develop a voltage prediction model in an all-climate condition. Among them, the voltage and current are the most easily accessible battery characteristic data so using the current as the input of the NARX network and the voltage as the output of the NARX network effectively reduces the complexity of NARX network with a low computational cost. It is worth noting that a good voltage prediction model should be able to perform well on unseen data. To achieve this goal, all cells (Cell 12, Cell 13 and Cell 14) at 25 °C were selected for validation. In addition, the developed model should also be able to predict the voltage effectively at extreme temperatures, so one cell each at extreme temperatures of −20 °C and 60 °C (Cell 1 and Cell 22) were selected for validation. It is well-known that due to the performance defects of the battery itself, it will exhibit great differences under different external environmental temperatures. As can be seen from Figure 4, when the battery was in a low temperature environment and because the temperature was lower than the optimal operating temperature range of the battery system, the voltage fluctuated more drastically than other temperatures. As the validation dataset contained the untrained data of all batteries at 25 °C as well as the characteristic data of batteries at extreme temperatures, the proposed model was guaranteed to have an excellent predictive performance for unknown data and at all temperatures. In this way, we could ensure that the proposed voltage prediction model had excellent generalization ability and all-climate applicability.

3.1. Voltage Prediction Results

As described in Section 2.3, the input delay, feedback delay, size of the hidden layer, feedback mode and training function were determined before training the NARX network. In this work, the input and feedback delays were selected as five, the size of the hidden layer neurons was selected as ten, the network was trained in a series-parallel mode and the LM algorithm was used as the training function. In the training phase, the whole training dataset was divided into three parts, namely, training, validation and testing data. From this dataset, 70% was used for training the network, 15% was used for the validation and the remaining 15% was used for testing. The training data were all presented to the network during the training phase and the network adjusted according to the errors. The validation data were used to evaluate the generalization ability of the network to avoid the overfitting of training and to stop training when the generalization stopped improving. The testing data had no effect on training and were used to evaluate the training quantity and model performance after training.
After training the NARX voltage prediction model, it was crucial to verify the voltage prediction performance of the model on untrained batteries. As mentioned before, five batteries were used for the validation and the voltage prediction results for these five batteries are shown in Figure 5. As can be seen from the figure, the NARX model showed an outstanding prediction performance. It is worth noting that the three cells (Cell 12, Cell 13 and Cell 14) at 25 °C were not used for training and the NARX model also performed with a high prediction accuracy. Another noteworthy point is that the voltage of Cell 1 fluctuated greatly at a low temperature but the NARX model still accurately predicted the cell voltage even at a high temperature. Table 3 summarizes the voltage prediction performance of the proposed NARX model. The RMSEs of the five validation datasets were 4.2273 × 10⁻², 9.2318 × 10⁻³, 7.9855 × 10⁻³, 9.6344 × 10⁻³ and 7.6182 × 10⁻³. It was clear that the RMSE was the smallest at a higher temperature and the RMSE at a lower temperature was slightly higher than at other temperatures, indicating that the accuracy of the voltage prediction was affected by the temperature. The slightly higher RMSE at a lower temperature might have been due to the fact that the internal resistance of the cell increased and the nonlinear Butler–Volmer effects and diffusion were more prevalent [45]. In addition, the voltage fluctuations were more severe at low temperatures making the voltage harder to predict than at other temperatures. However, in general, the RMSE at each temperature was low, which verified the accuracy and effectiveness of the proposed NARX voltage prediction method. In conclusion, the results confirmed that the proposed NARX model had an excellent prediction ability with strong robustness and all-climate applicability and could effectively predict the cell voltage at different temperatures. Moreover, it is important to note that the performance of battery will gradually degrade over time due to battery aging and thus the accuracy of the prediction model may be reduced. Therefore, when the RMSE is greater than 0.1, it indicates that the prediction error of the model is large. It is then necessary to retrain the network to maintain the reliability of the prediction model and ensure the accuracy of the predicted voltage to guarantee the accuracy of the fault prognosis.

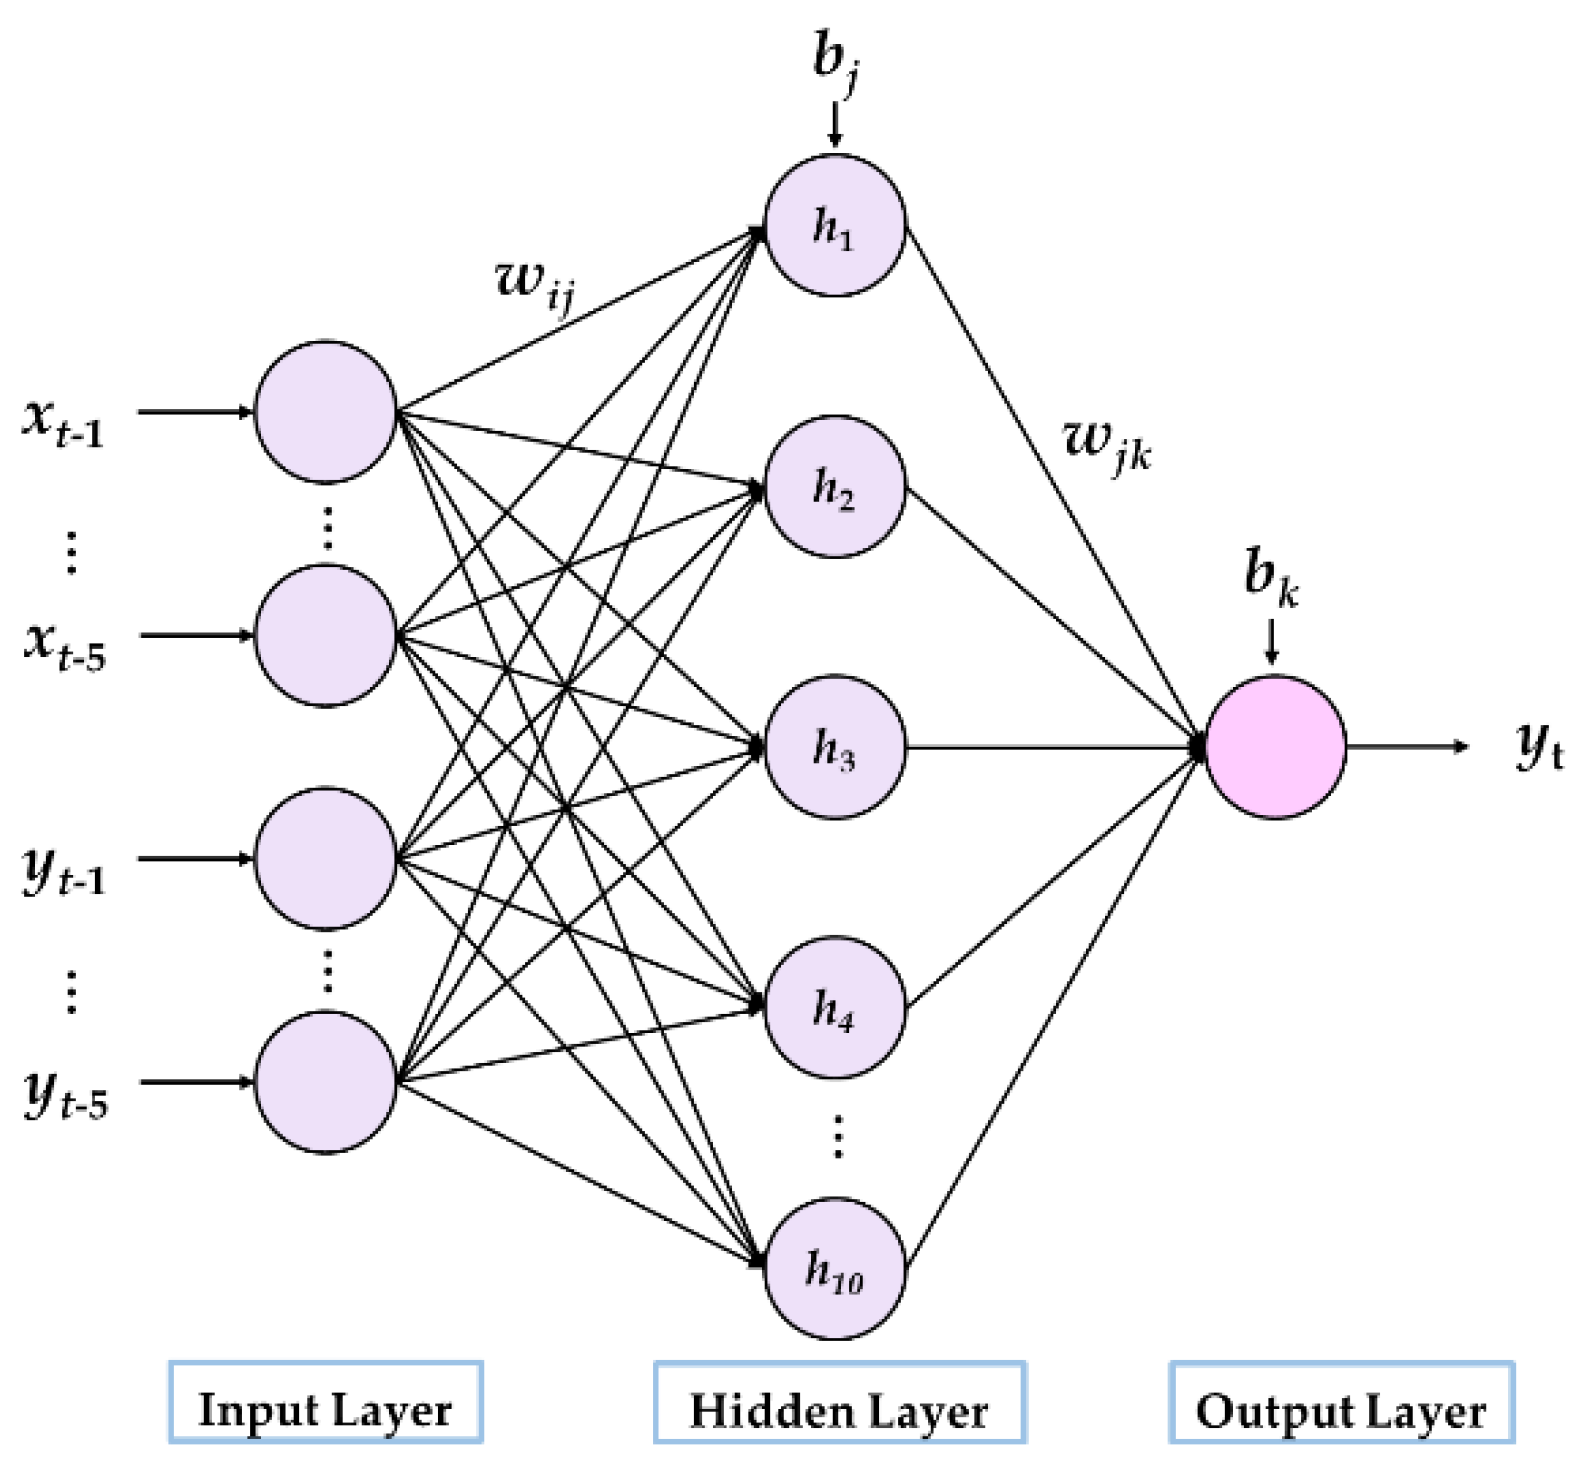
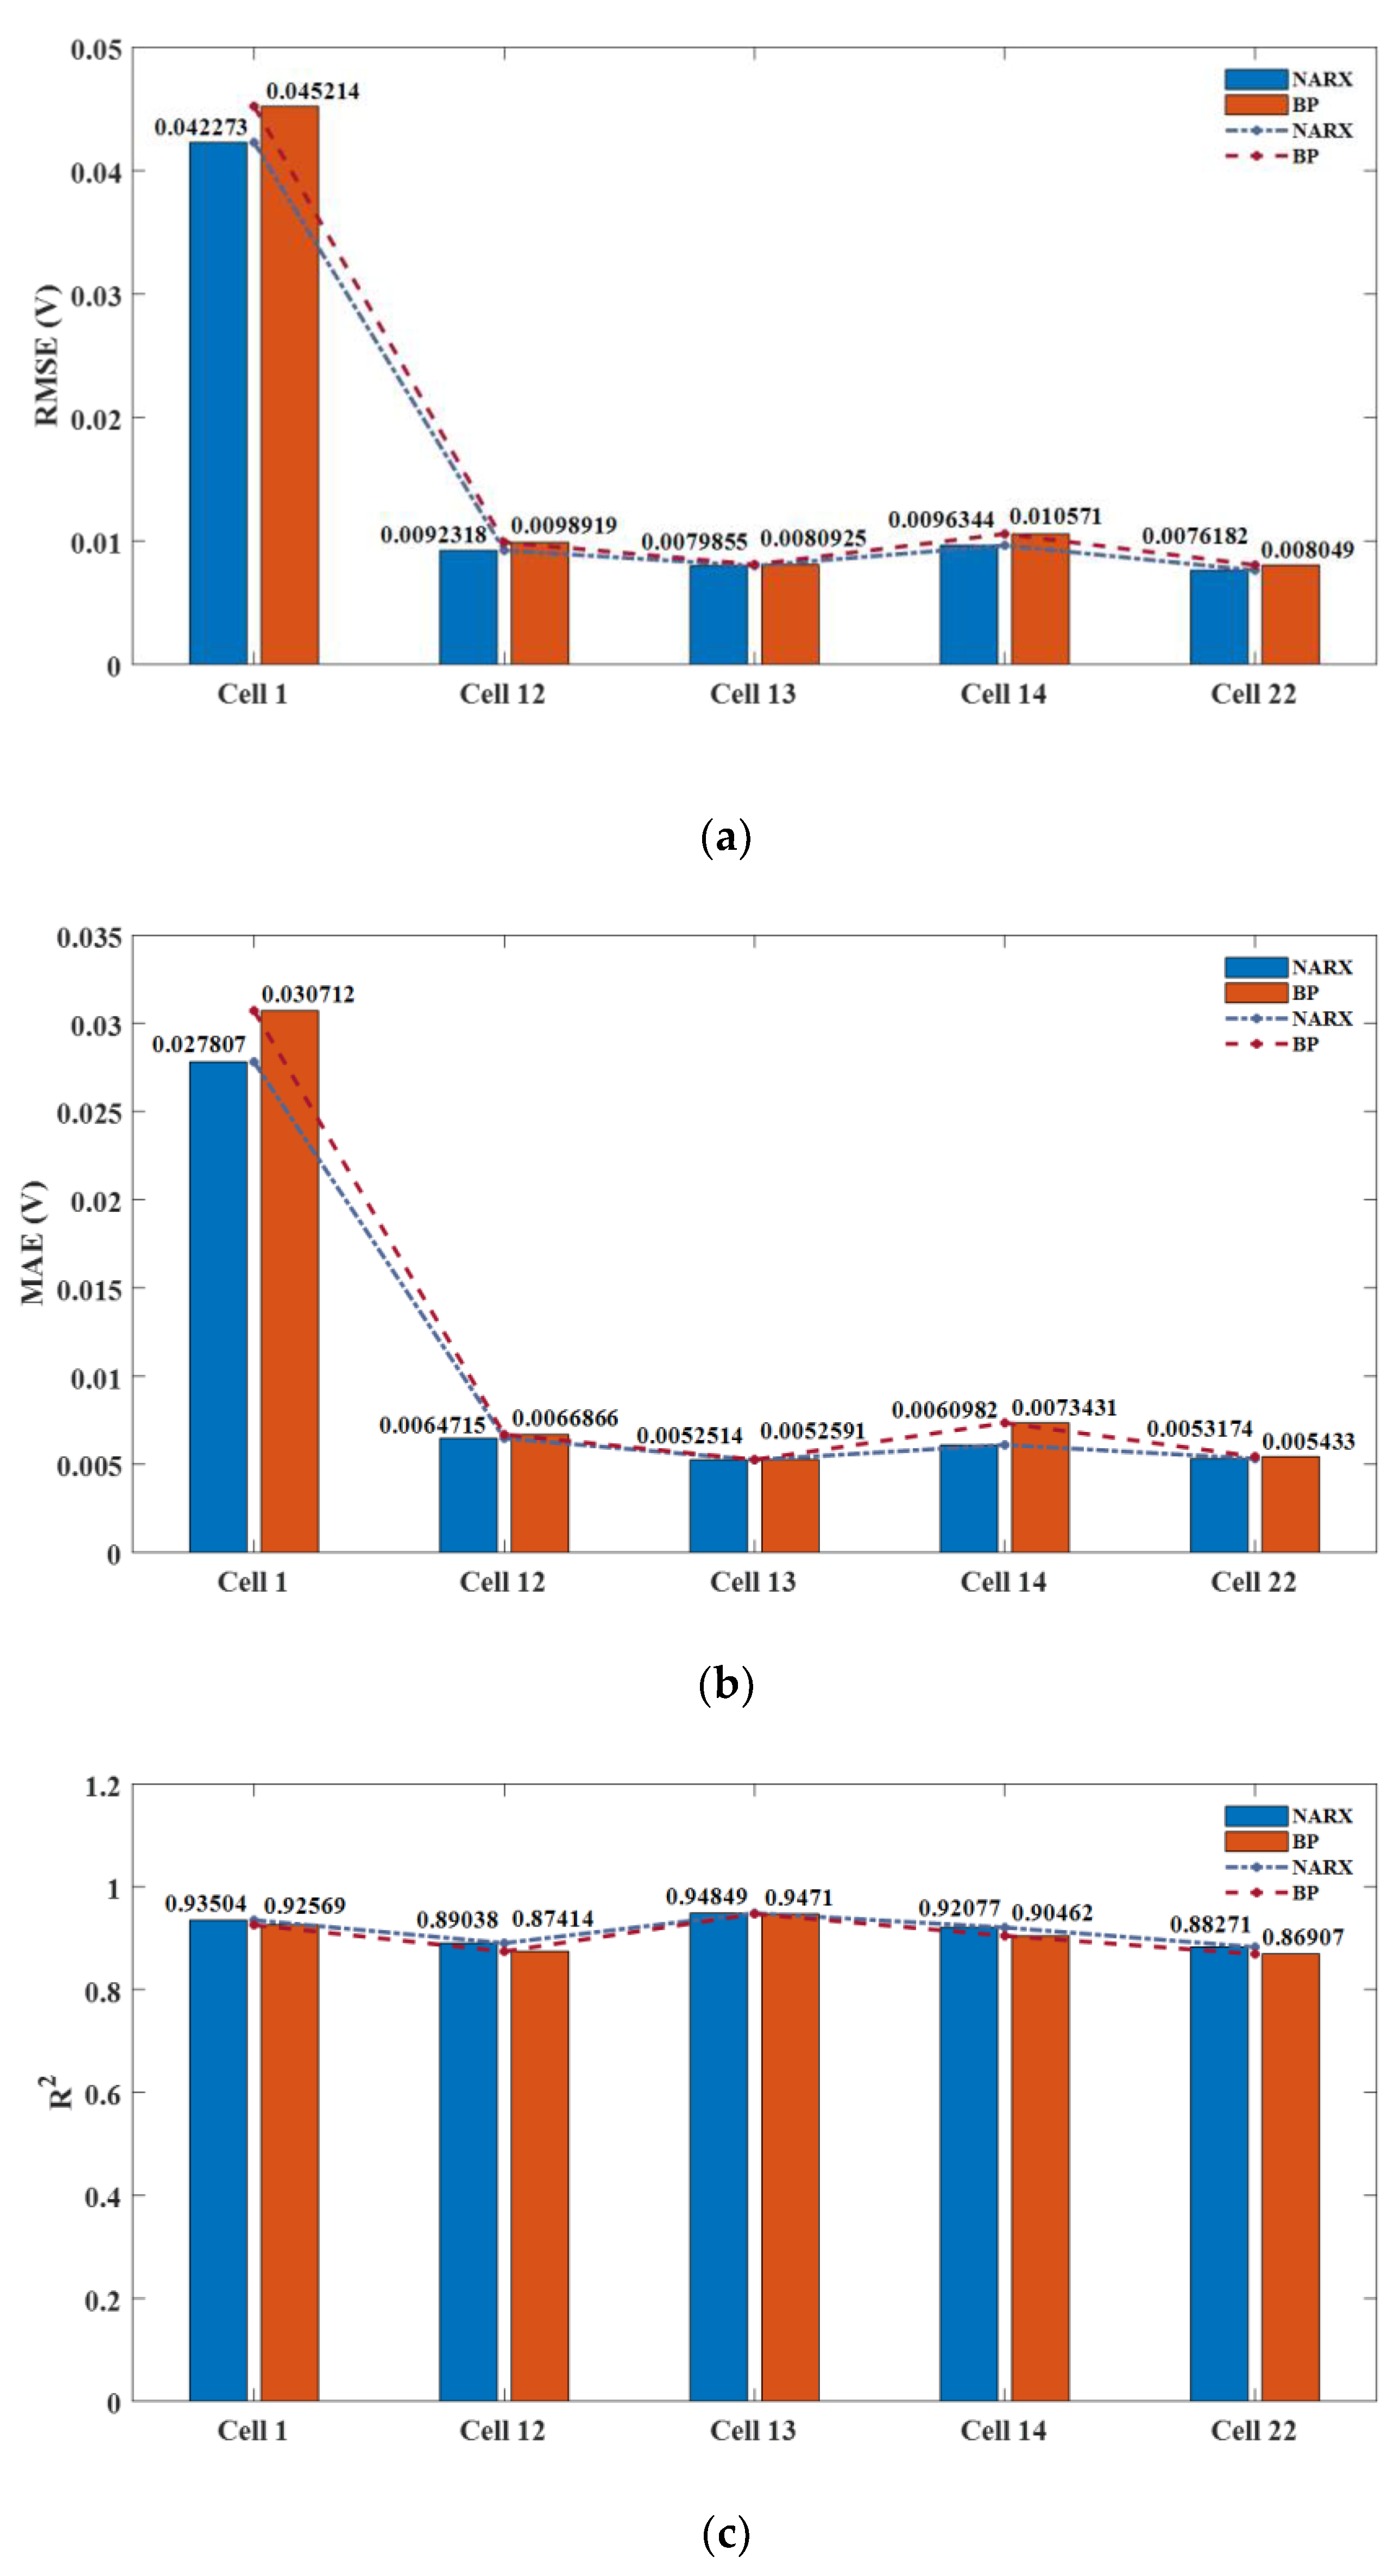
3.2. The Comparison of NARX with Back Propagation Neural Network

In order to verify the superiority of the proposed NARX model, this section will discuss the advantages of the NARX model compared with a back propagation (BP) neural network. BP neural network is a kind of multi-layer feedforward neural network trained according to error back propagation and is a widely used neural network at present [46]. It has the general advantages of neural networks with a strong nonlinear mapping ability, self-learning ability, self-adaptive ability, generalization ability and fault tolerance ability [47]. Unlike the NARX, it does not contain the feedback connection of the network. To compare the performance of the NARX network with the BP network, we trained the BP network with the same size of hidden layer and the same training function. The structure of the BP neural network is shown in Figure 6. The size of the hidden layer was ten and the voltage at the time instant t was determined by the voltages and currents of the previous five time intervals. In the training phase, the input data were normalized to obtain a better convergence. As with the NARX, 70% of the input data was used for training, 15% was used for validation and the remaining 15% was used for testing. After training, it was validated by using the new validation dataset as described before to test the prediction performance of the obtained BP model. Figure 7 compares the performance of the BP and the NARX with the validation dataset. According to the three performance indicators adopted in this work, the NARX had a significantly better voltage prediction ability than the BP, indicating that the NARX model better simulated the electrochemical characteristics of the battery and had a stronger ability of nonlinear system modeling of the battery than the BP. Therefore, the proposed NARX model could predict the battery voltage more accurately and thus obtain a better fault diagnosis performance.

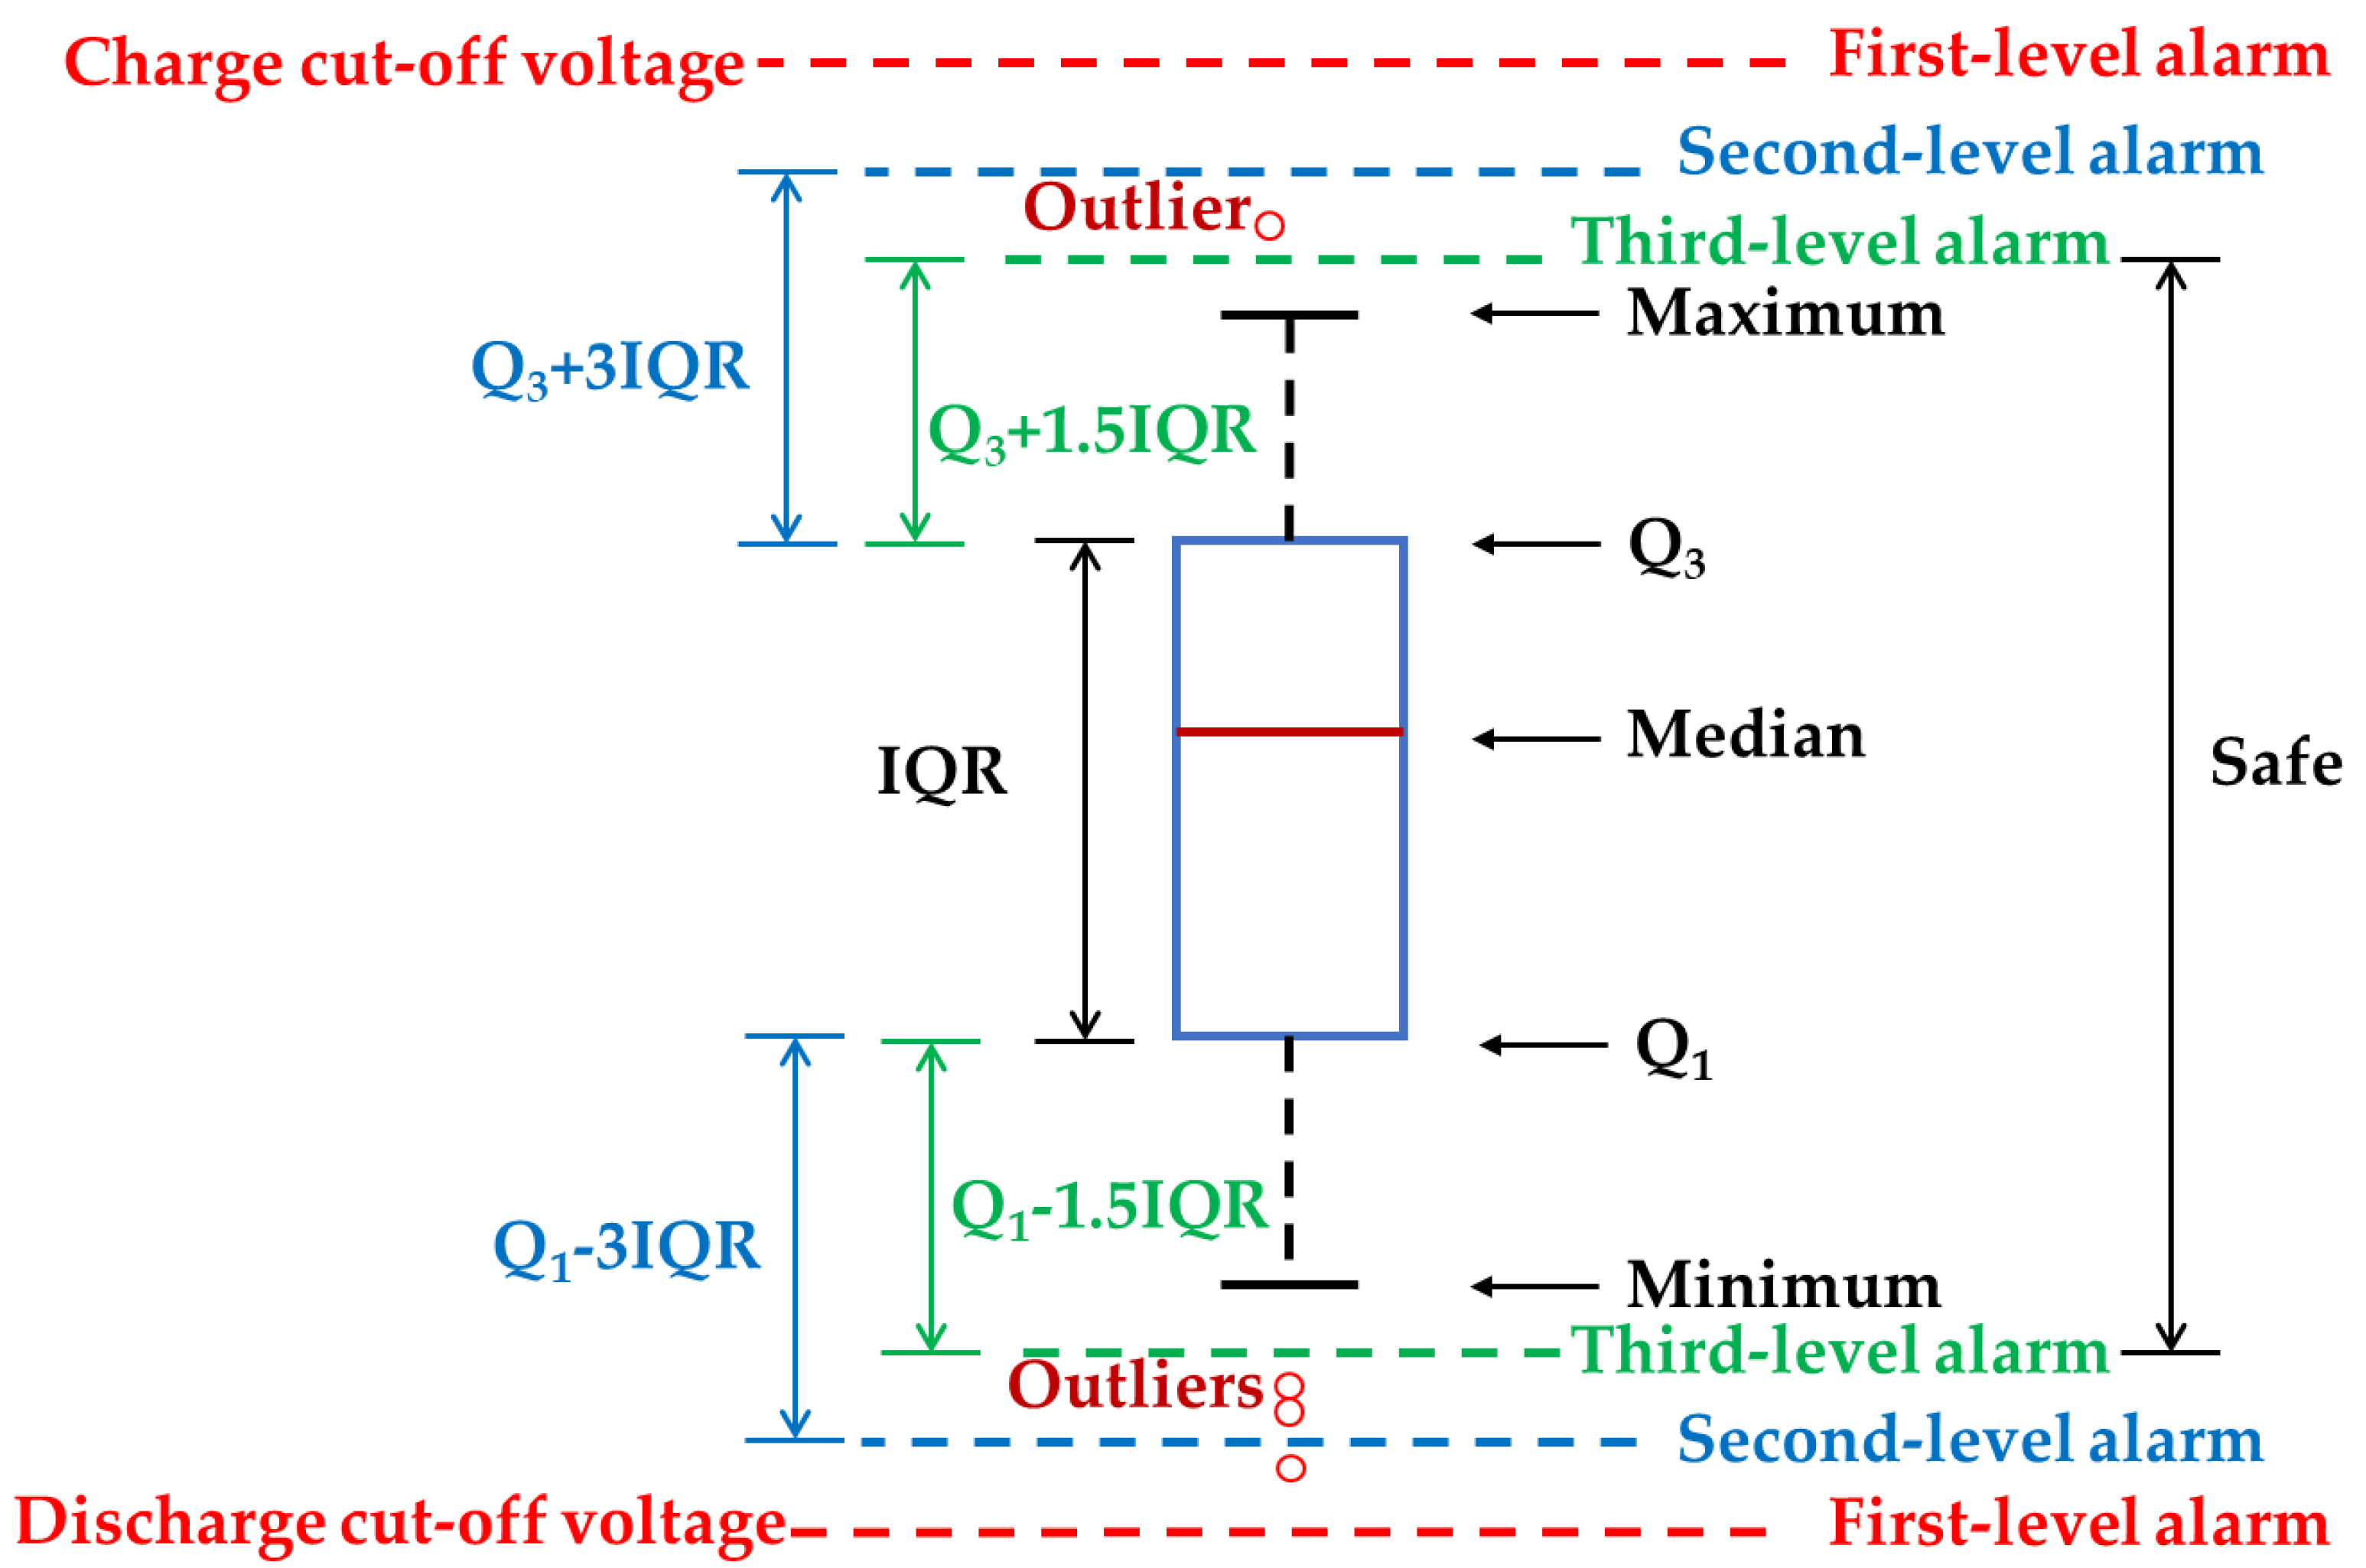
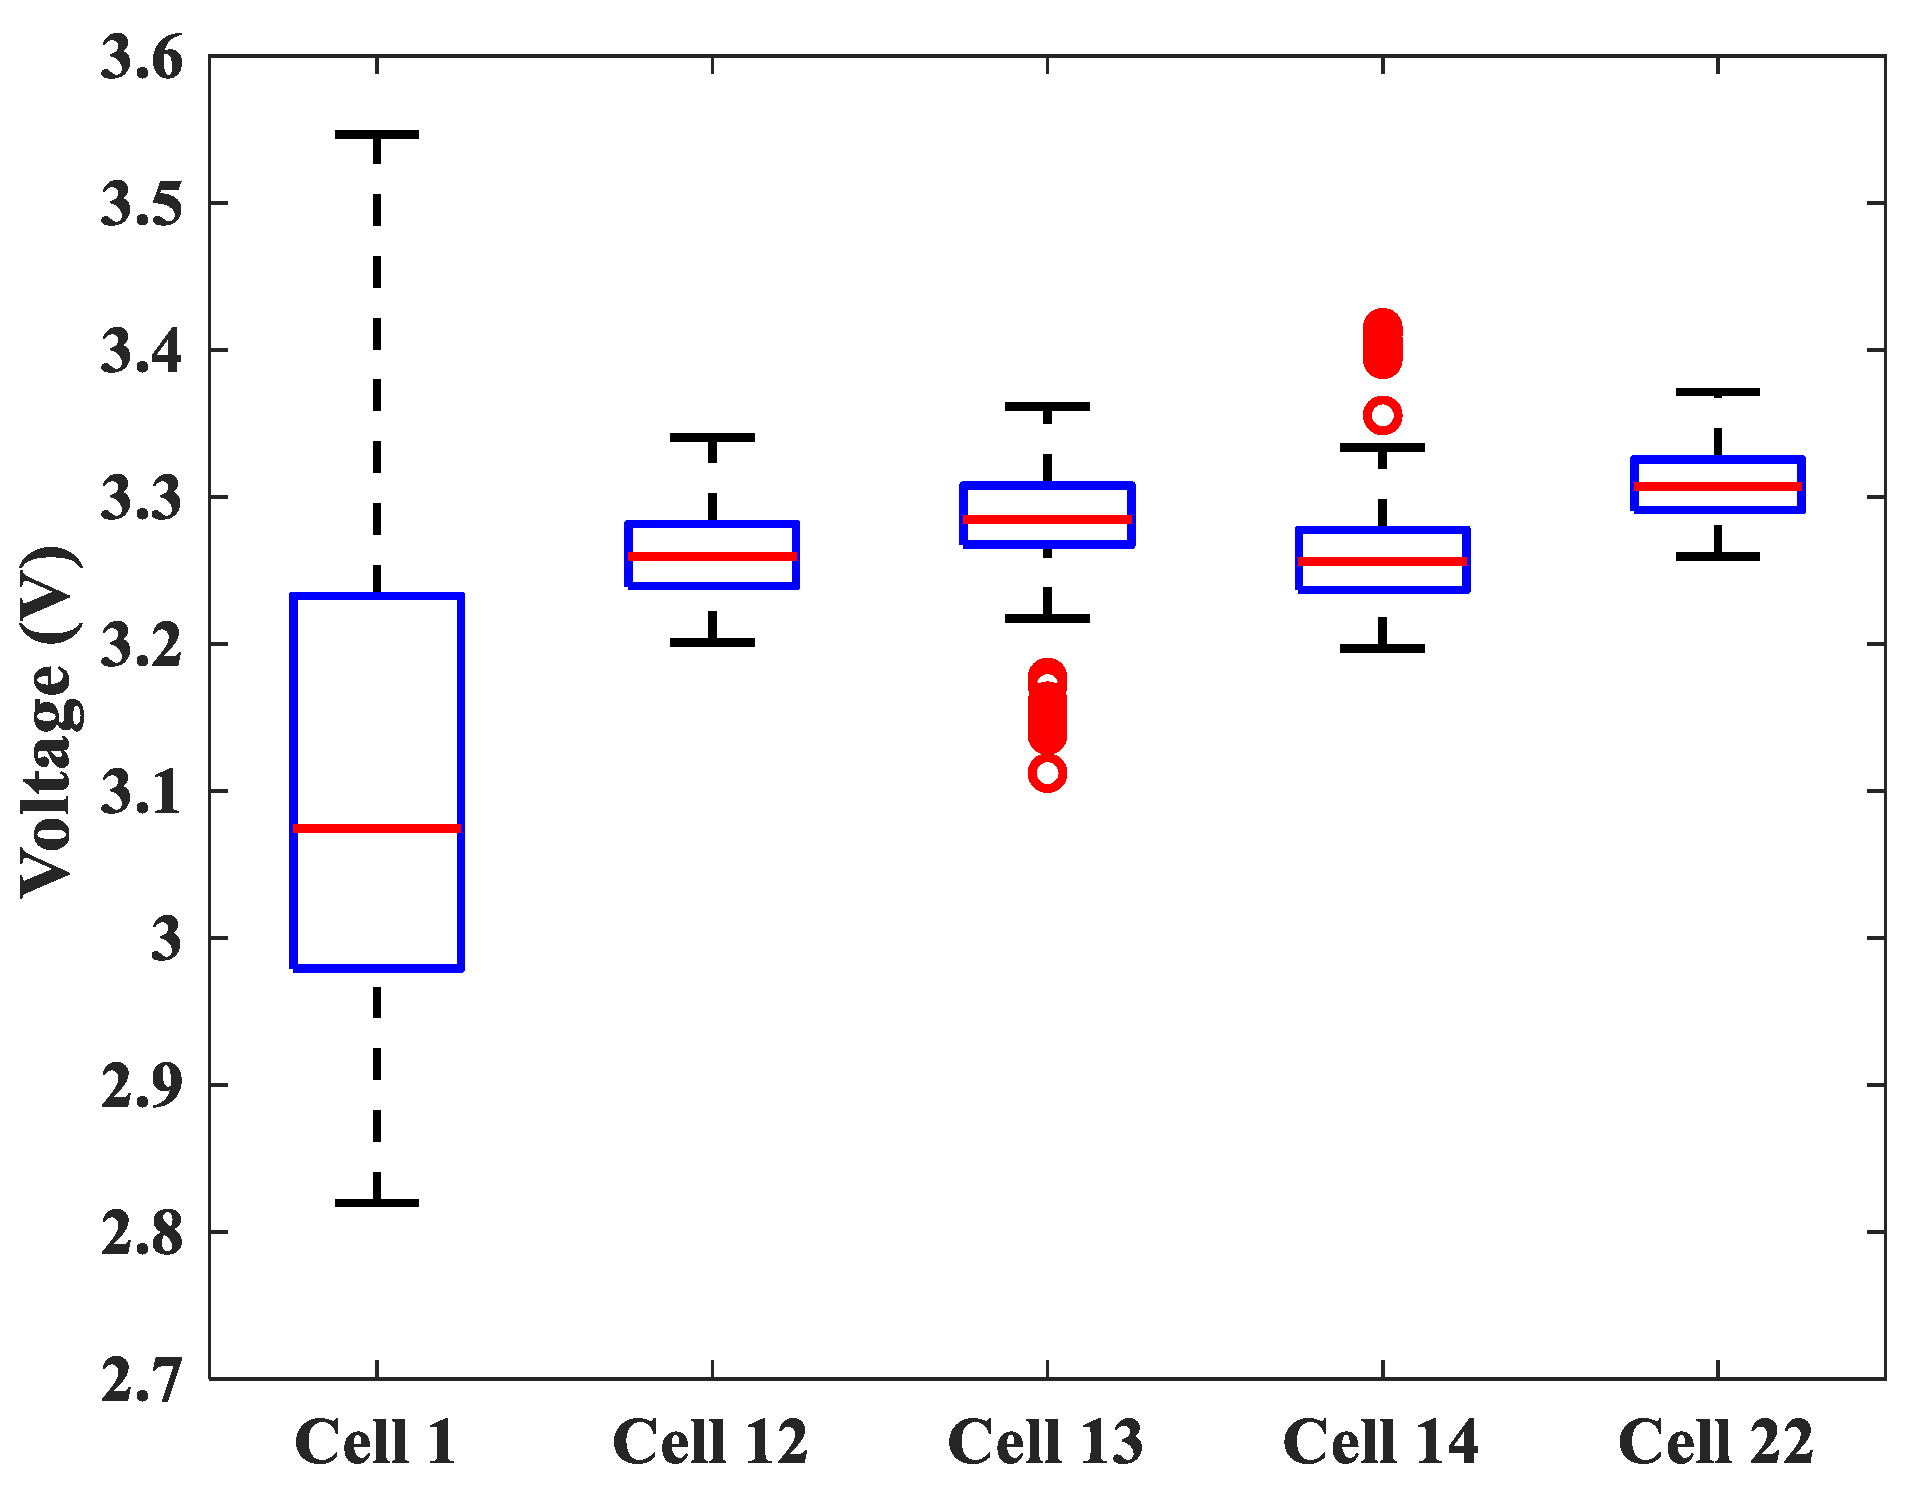
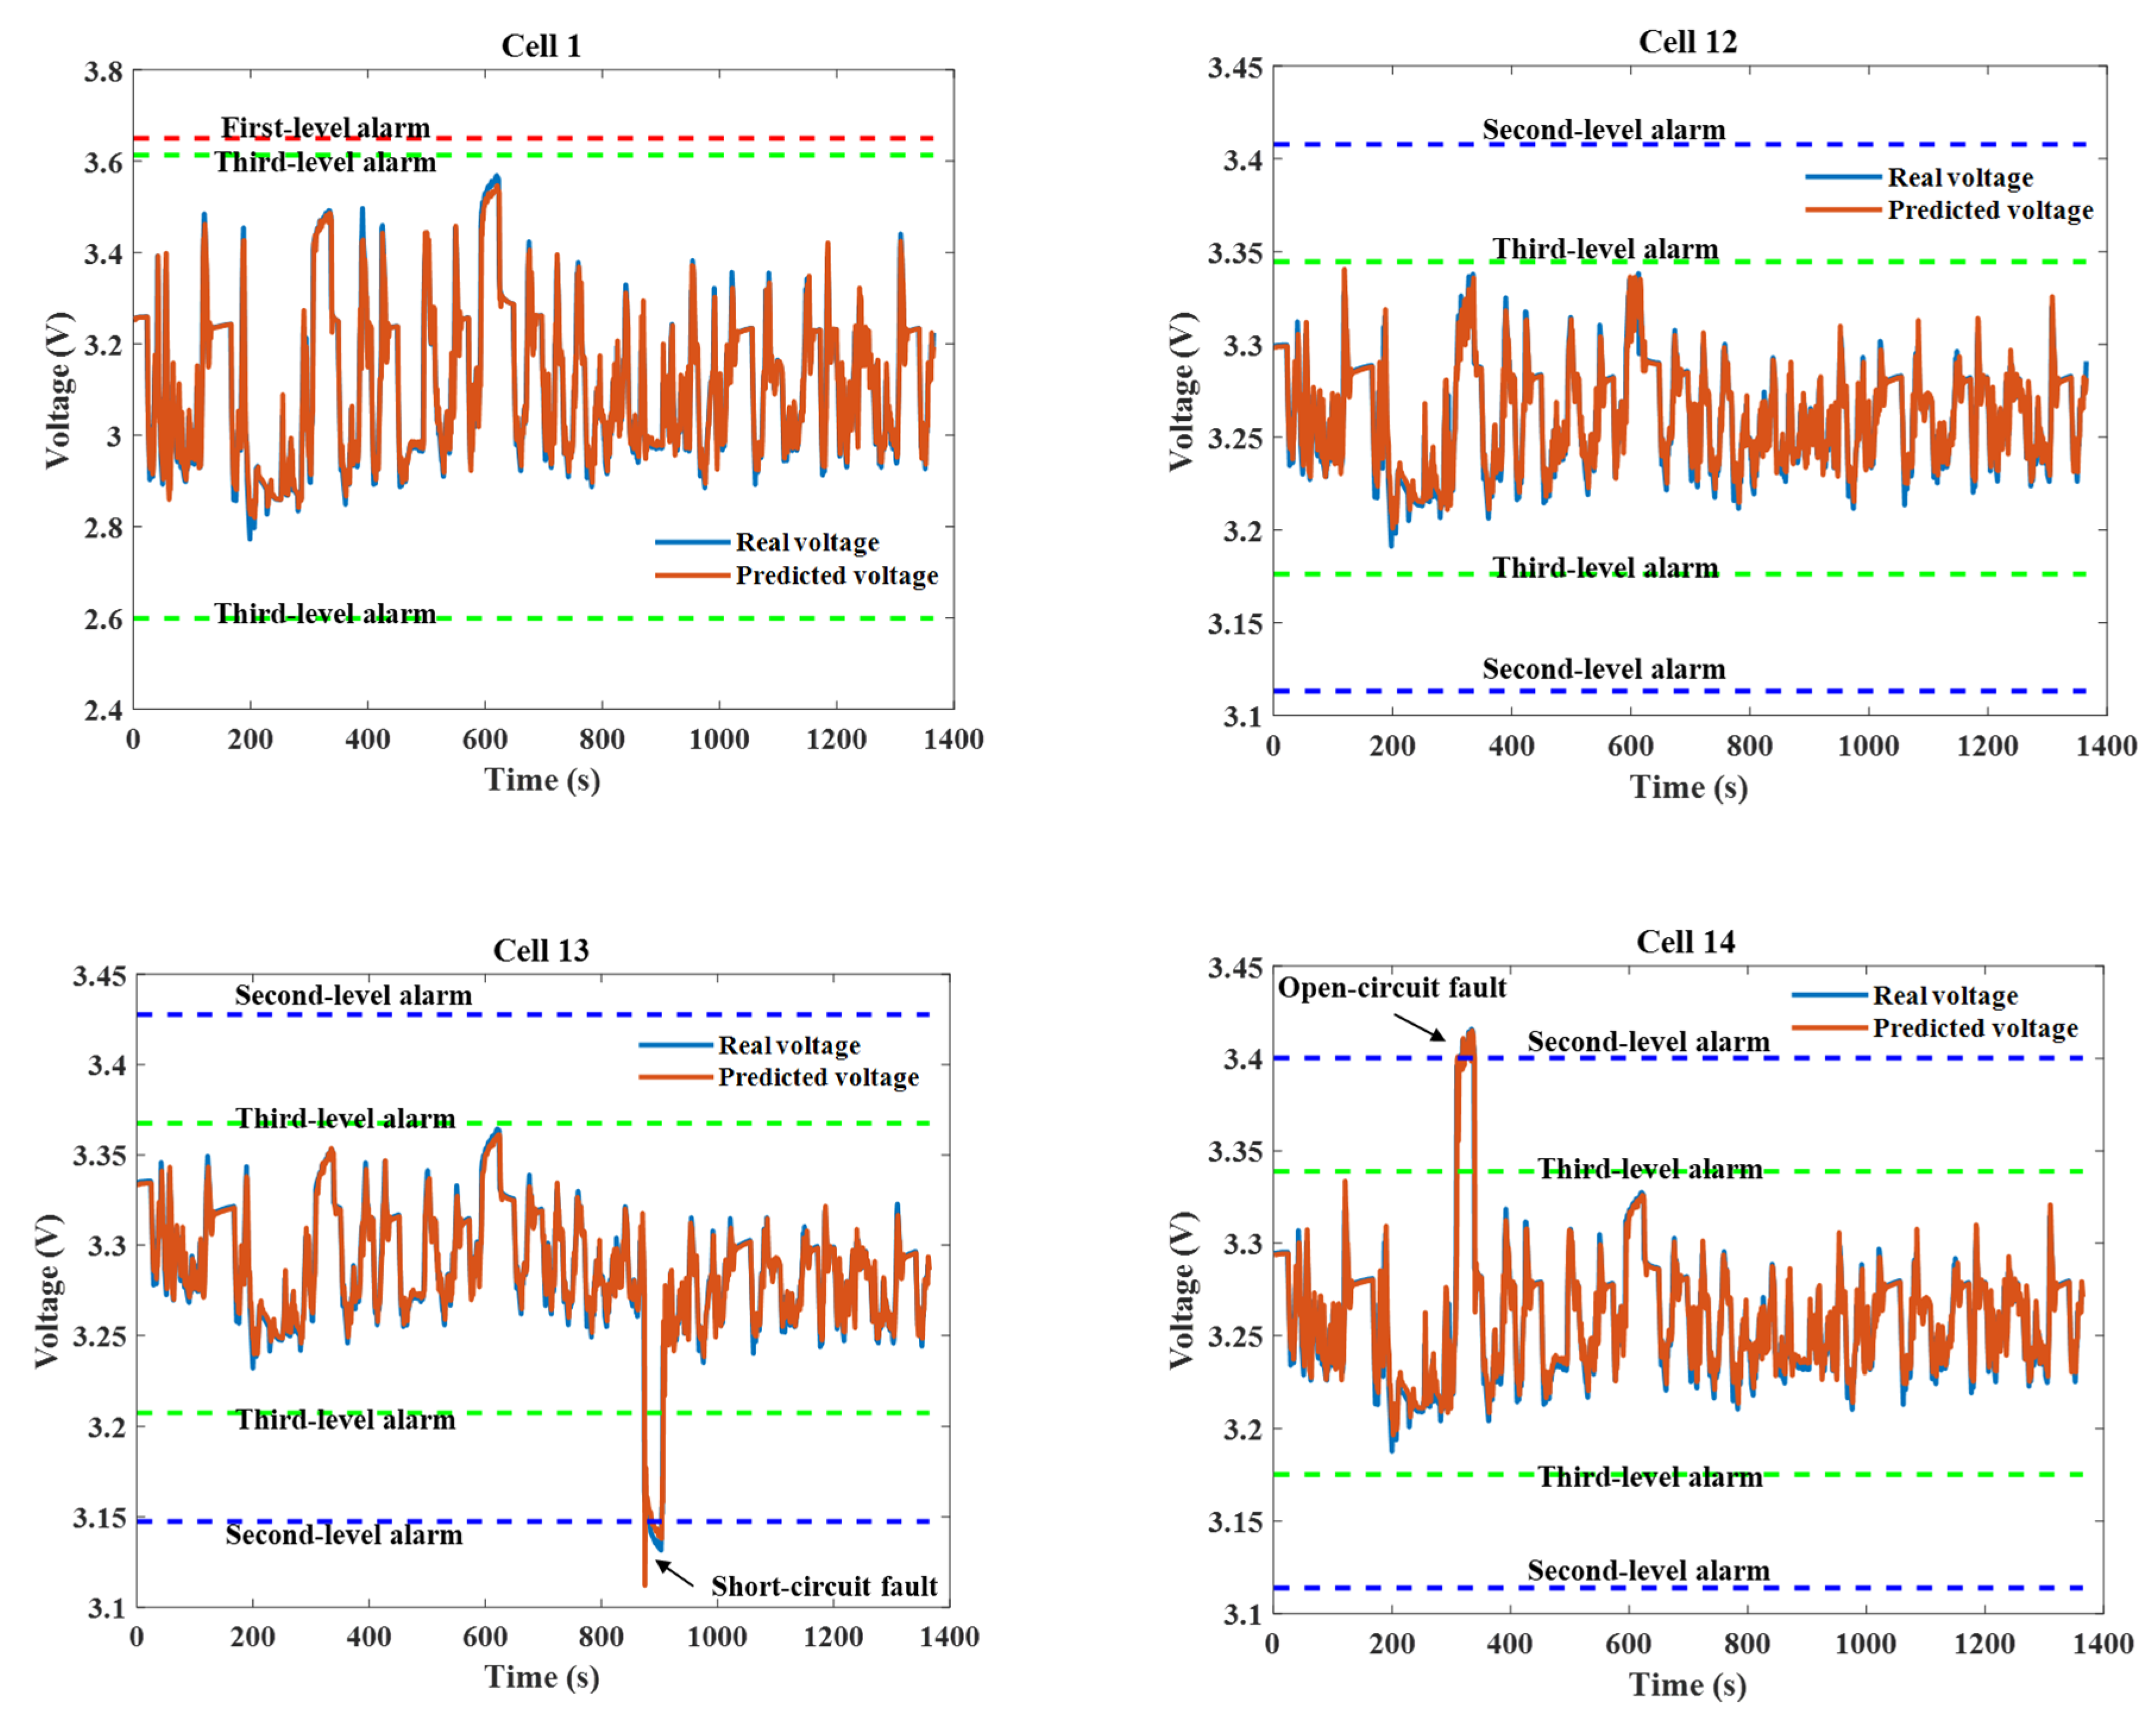
4. Battery Fault Diagnosis

As mentioned in Section 2 and Section 3, the dataset collected from the experiments in this work included the characteristic data of normal and faulty batteries and the proposed NARX voltage prediction model had a strong robustness and all-climate applicability, which could effectively predict the battery voltage and ensure the accuracy of the battery fault diagnosis. It is well-known that the voltage will show different fluctuations from normal when the battery is faulty and thus voltage abnormalities are an important indicator for fault diagnosis. The boxplot, also known as a box-whisker plot, was invented by John Tukey, a famous American statistician, in 1977. It can accurately and reliably describe the discrete distribution of data and can quickly identify outliers [48]. The structure of a boxplot is shown in Figure 8. It is composed of five numerical points: the smallest observation (minimum), the first quartile (Q1), the second quartile/median (Q2), the third quartile (Q3) and the largest observation (maximum) where the distance between the first quartile and the third quartile is the interquartile range (IQR), which is defined as:
IQR = Q 3 Q 1 .
It should be noted that the whiskers only extend to the most extreme observations within 1.5 IQR of the third and first quartiles. According to the basic criteria followed by statistics, values located at least 1.5 IQR above the third quartile or below the first quartile are outliers. The outlier cut-off point is defined as:
Outlier    cut-off    point = { Q 3 + β × IQR Q 1 β × IQR }
where β = 1.5 is the inner limit and β = 3 is the outer limit. All the data outside the inner limit are outliers; the outliers between the inner limit and the outer limit are mild outliers and the outliers outside the outer limit are extreme outliers.
In order to effectively implement the battery fault diagnosis, the voltage abnormality alarm or warning thresholds were set according to the boxplot, as shown in Table 4. In addition, a more intuitive view of the threshold settings is shown in Figure 9. It is worth mentioning that the proposed fault diagnosis method is applicable for other battery systems based on the appropriate setting of the voltage abnormality alarm or warning thresholds. As can be seen from Table 4, the alarm or warning level of the voltage anomaly could be divided into three levels. If the battery voltage is above the third quartile 1.5 IQR or under the first quartile 1.5 IQR, the third-level alarm will be triggered. The battery may have potential minor faults and it is necessary to take a few measurements to intervene in time to prevent the further deterioration of the battery. For drivers, they should pay attention to inspection and maintenance in daily use. If the battery voltage exceeds 3 IQR of the third quartile or below 3 IQR of the first quartile, the second-level alarm will be triggered, indicating that the battery is in a dangerous state and that it is necessary to check the alarm location and repair the faulty battery. When the battery voltage exceeds the charge or discharge cut-off voltage, the first-level alarm will be triggered and it is required for the driver to stop and get out of the car immediately to avoid accidents and then call a professional to check the faulty battery and replace the battery if necessary. It should be emphasized that the first-level alarm is triggered directly when the maximum and minimum exceed the charge or discharge cut-off voltage.
An effective fault diagnosis model should be robust and reliable. As shown in Figure 10, among the five validation cells, we intuitively knew from the boxplot that Cell 13 and Cell 14 had an abnormal voltage whereas the other cells were normal and the existing abnormal voltages of the cells did not trigger the first-level alarm. Figure 11 depicts the real and predicted voltages of these five cells and it can be seen that the predicted voltages were very close to the real voltages. According to the proposed fault diagnosis method, Cell 1, Cell 12 and Cell 22 did not trigger any alarm and the battery operated normally. Cell 14 and Cell 13 showed abnormal voltage fluctuations at around 310 s and 875 s, respectively, and triggered the second-level alarm. Therefore, the fault diagnosis method proposed in this paper could effectively detect abnormal cells without giving false alarms to the normal cells, which verified the robustness and reliability of the proposed method.

5. Conclusions

In this paper, a method of fault diagnosis and prognosis for lithium-ion batteries based on a NARX neural network was proposed, which took full advantage of the NARX neural network’s competitive prediction ability as well as the ability to cope with the nonlinear behavior of batteries. To consider the effect of ambient temperature, charge and discharge experiments were performed on twenty-three cells at eight temperatures to obtain battery dataset of which eighteen cells were used for training the NARX model and five cells were used for validation so that the proposed NARX model could perform effective battery voltage predictions in all climates. The five selected validation cells were untrained and the results showed that the NARX model had excellent prediction and generalization capabilities, validating the effectiveness and robustness of the proposed NARX model. In addition, a comparative study was conducted to verify the superiority of the proposed NARX model by comparing it with a BP neural network. The results showed that the NARX model was superior to the BP model in all performance metrics, indicating that it had a better prediction performance than the BP neural network. Moreover, the developed NARX model can be trained offline and implemented online so the proposed NARX model could realize the online prediction of the battery voltage, which is helpful for the rapid diagnosis of battery faults. Finally, a fault prognosis strategy based on boxplot was proposed to classify the voltage abnormality levels and types. The abnormal voltage could be quickly identified through the accurate voltage prediction and then the battery fault could be accurately diagnosed and the faulty cell precisely located. The results showed that the method could effectively achieve fault prognosis without non-alarm or false alarm. It is worth mentioning that the proposed method had strong robustness, accuracy and simplicity and has the potential for online fault diagnosis and prognosis in electric vehicles.

Author Contributions

Conceptualization: Y.Q. and J.S.; methodology: Y.Q. and J.S.; software: Y.Q.; validation: Y.Q. and J.S.; formal analysis: Y.Q.; investigation: J.S.; resources: Y.S.; data curation: Y.Q.; writing—original draft preparation: Y.Q.; writing—review and editing: Y.Q., J.S., Y.S. and D.W.; visualization: Y.Q.; supervision: J.S.; project administration: J.S.; funding acquisition: Y.S. All authors have read and agreed to the published version of the manuscript.

Funding

This paper is supported by the National Natural Science Foundation of China (No.61903223, 62122041, 62173211), Shandong Provincial Key Research and Development Program (Major Scientific and Technological Innovation Project) (No.2019JZZY010416), Shandong Provincial Science and Technology Support Program of Youth Innovation Team in Colleges (No.2019KJN041).

Institutional Review Board Statement

Not applicable.

Informed Consent Statement

Not applicable.

Data Availability Statement

Not applicable.

Acknowledgments

The authors would like to acknowledge the support of the Shandong Provincial Demonstration Base for the Joint Cultivation of Graduates with Integrated Production and Education “New Generation Information Technology Joint Cultivation Base for Graduates with Integrated Production and Education”.

Conflicts of Interest

The authors declare no conflict of interest.

References

  1. Du, Z.L.; Lin, B.Q.; Guan, C.X. Development path of electric vehicles in China under environmental and energy security constraints. Resour. Conserv. Recycl. 2019, 143, 17–26. [Google Scholar] [CrossRef]
  2. Hasan, M.K.; Mahmud, M.; Ahasan Habib, A.K.M.; Motakabber, S.M.A.; Islame, S. Review of electric vehicle energy storage and management system: Standards, issues, and challenges. J. Energy Storage 2021, 41, 102940. [Google Scholar] [CrossRef]
  3. Costa, C.M.; Barbosa, J.C.; Castro, H.; Gonçalves, R.; Lanceros-Méndez, S. Electric vehicles: To what extent are environmentally friendly and cost effective?—Comparative study by european countries. Renew. Sustain. Energy Rev. 2021, 151, 111548. [Google Scholar] [CrossRef]
  4. Li, Z.H.; Khajepour, A.; Song, J.C. A comprehensive review of the key technologies for pure electric vehicles. Energy 2019, 182, 824–839. [Google Scholar] [CrossRef]
  5. Andwari, A.M.; Pesiridis, A.; Rajoo, S.; Martinez-Botas, R.; Esfahanian, V. A review of battery electric vehicle technology and readiness levels. Renew. Sustain. Energy Rev. 2017, 78, 414–430. [Google Scholar] [CrossRef]
  6. Gandoman, F.H.; Jaguemont, J.; Goutam, S.; Gopalakrishnan, R.; Firouz, Y.; Kalogiannis, T.; Omar, N.; Mierlo, J.N. Concept of reliability and safety assessment of lithium-ion batteries in electric vehicles: Basics, progress, and challenges. Appl. Energy 2019, 251, 113343. [Google Scholar] [CrossRef]
  7. Shang, Y.L.; Liu, K.L.; Cui, N.X.; Wang, N.; Li, K.; Zhang, C.H. A compact resonant switched-capacitor heater for lithium-ion battery self-heating at low temperatures. IEEE Trans. Power Electron. 2020, 35, 7134–7144. [Google Scholar] [CrossRef]
  8. Zubi, G.; Dufo-López, R.; Carvalho, M.; Pasaoglu, G. The lithium-ion battery: State of the art and future perspectives. Renew. Sustain. Energy Rev. 2018, 89, 292–308. [Google Scholar] [CrossRef]
  9. Xiong, R.; Sun, W.Z.; Yu, Q.Q.; Sun, F.C. Research progress, challenges and prospects of fault diagnosis on battery system of electric vehicles. Appl. Energy 2020, 279, 115855. [Google Scholar] [CrossRef]
  10. Shang, Y.L.; Zhao, S.F.; Fu, Y.H.; Han, B.; Hu, P.P.; Mi, C.C. A lithium-ion battery balancing circuit based on synchronous rectification. IEEE Trans. Power Electron. 2020, 35, 1637–1648. [Google Scholar] [CrossRef]
  11. Liu, B.H.; Jia, Y.K.; Yuan, C.H.; Wang, L.B.; Gao, X.; Yin, S.; Xu, J. Safety issues and mechanisms of lithium-ion battery cell upon mechanical abusive loading: A review. Energy Storage Mater. 2020, 24, 85–112. [Google Scholar] [CrossRef]
  12. Xiong, R.; Pan, Y.; Shen, W.X.; Li, H.L.; Sun, F.C. Lithium-ion battery aging mechanisms and diagnosis method for automotive applications: Recent advances and perspectives. Renew. Sustain. Energy Rev. 2020, 131, 110048. [Google Scholar] [CrossRef]
  13. Lee, M.; Kim, N.; Seo, J.; Patil, M.S. Thermal abuse behavior of the LIR2450 micro coin cell battery having capacity of 120 mAh with internal short circuit by penetrating element. Symmetry 2020, 12, 246. [Google Scholar] [CrossRef] [Green Version]
  14. Chombo, P.V.; Laoonual, Y. A review of safety strategies of a li-ion battery. J. Power Sources 2020, 478, 228649. [Google Scholar] [CrossRef]
  15. Feng, X.N.; Ouyang, M.G.; Liu, X.; Lu, L.G.; Xia, Y.; He, X.M. Thermal runaway mechanism of lithium-ion battery for electric vehicles: A review. Energy Storage Mater. 2018, 10, 246–267. [Google Scholar] [CrossRef]
  16. Liao, Z.H.; Zhang, S.; Li, K.; Zhang, G.Q.; Habetler, T.G. A survey of methods for monitoring and detecting thermal runaway of lithium-ion batteries. J. Power Sources 2019, 436, 226879. [Google Scholar] [CrossRef]
  17. Hong, J.C.; Wang, Z.P.; Yao, Y.T. Fault prognosis of battery system based on accurate voltage abnormity prognosis using long short-term memory neural networks. Appl. Energy 2019, 251, 113381. [Google Scholar] [CrossRef]
  18. Zhao, Y.; Liu, P.; Wang, Z.P.; Zhang, L.; Hong, J.C. Fault and defect diagnosis of battery for electric vehicles based on big data analysis methods. Appl. Energy 2017, 207, 354–362. [Google Scholar] [CrossRef]
  19. Zhao, R.; Liu, J.; Gu, J.J. Simulation and experimental study on lithium-ion battery short circuit. Appl. Energy 2016, 173, 29–39. [Google Scholar] [CrossRef]
  20. Duan, B.; Li, Z.Y.; Gu, P.W.; Zhou, Z.K.; Zhang, C.H. Evaluation of battery inconsistency based on information entropy. J. Energy Storage 2018, 16, 160–166. [Google Scholar] [CrossRef]
  21. Yang, R.X.; Xiong, R.; He, H.W.; Chen, Z.Y. A fractional-order model-based battery external short circuit fault diagnosis approach for all-climate electric vehicles application. J. Clean. Prod. 2018, 187, 950–959. [Google Scholar] [CrossRef]
  22. Yang, Z.C.; Li, J.Q.; Jiang, H.F.; Liu, Z.M. A novel model-based damage detection method for lithium-ion batteries. J. Energy Storage 2021, 42, 102970. [Google Scholar] [CrossRef]
  23. Gao, W.K.; Zheng, Y.J.; Ouyang, M.G.; Li, J.Q.; Lai, X.; Hu, X.S. Micro-short-circuit diagnosis for series-connected lithium-ion battery packs using mean-difference model. IEEE Trans. Ind. Electron. 2019, 66, 2132–2142. [Google Scholar] [CrossRef]
  24. Hua, X.; Zhang, C.; Offer, G. Finding a better fit for lithium-ion batteries: A simple, novel, load dependent, modified equivalent circuit model and parameterization method. J. Power Sources 2021, 484, 229117. [Google Scholar] [CrossRef]
  25. Liu, Z.T.; He, H.W. Sensor fault detection and isolation for a lithium-ion battery pack in electric vehicles using adaptive extended Kalman filter. Appl. Energy 2017, 185, 2033–2044. [Google Scholar] [CrossRef]
  26. Xiong, R.; Yang, R.X.; Chen, Z.Y.; Shen, W.X.; Sun, F.C. Online fault diagnosis of external short circuit for lithium-ion battery pack. IEEE Trans. Ind. Electron. 2020, 67, 1081–1091. [Google Scholar] [CrossRef]
  27. Xia, B.; Shang, Y.L.; Nguyen, T.; Mi, C. A correlation based fault detection method for short circuits in battery packs. J. Power Sources 2017, 337, 1–10. [Google Scholar] [CrossRef] [Green Version]
  28. Kang, Y.Z.; Duan, B.; Zhou, Z.K.; Shang, Y.L.; Zhang, C.H. A multi-fault diagnostic method based on an interleaved voltage measurement topology for series connected battery packs. J. Power Sources 2019, 417, 132–144. [Google Scholar] [CrossRef]
  29. Li, X.Y.; Dai, K.W.; Wang, Z.P.; Han, W.J. Lithium-ion batteries fault diagnostic for electric vehicles using sample entropy analysis method. J. Energy Storage 2020, 27, 101121. [Google Scholar] [CrossRef]
  30. Wang, Z.P.; Hong, J.C.; Liu, P.; Zhang, L. Voltage fault diagnosis and prognosis of battery systems based on entropy and Z-score for electric vehicles. Appl. Energy 2017, 196, 289–302. [Google Scholar] [CrossRef]
  31. Kang, Y.Z.; Duan, B.; Zhou, Z.K.; Shang, Y.L.; Zhang, C.H. Online multi-fault detection and diagnosis for battery packs in electric vehicles. Appl. Energy 2020, 259, 114170. [Google Scholar] [CrossRef]
  32. Shang, Y.L.; Lu, G.P.; Kang, Y.Z.; Zhou, Z.K.; Duan, B.; Zhang, C.H. A multi-fault diagnosis method based on modified sample entropy for lithium-ion battery strings. J. Power Sources 2020, 446, 227275. [Google Scholar] [CrossRef]
  33. Zhang, H.; Niu, G.X.; Zhang, B.; Miao, Q. Cost-effective lebesgue sampling long short-term memory networks for lithium-ion batteries diagnosis and prognosis. IEEE Trans. Ind. Electron. 2021, 1. [Google Scholar] [CrossRef]
  34. Li, D.; Zhang, Z.S.; Liu, P.; Wang, Z.P.; Zhang, L. Battery fault diagnosis for electric vehicles based on voltage abnormality by combining the long short-term memory neural network and the equivalent circuit model. IEEE Trans. Power Electron. 2021, 36, 1303–1315. [Google Scholar] [CrossRef]
  35. Tian, Y.; Lai, R.C.; Li, X.Y.; Xiang, L.J.; Tian, J.D. A combined method for state-of-charge estimation for lithium-ion batteries using a long short-term memory network and an adaptive cubature Kalman filter. Appl. Energy 2020, 265, 114789. [Google Scholar] [CrossRef]
  36. Chen, J.; Ouyang, Q.; Xu, C.F.; Su, H.Y. Neural network-based state of charge observer design for lithium-ion batteries. IEEE Trans. Control Syst. Technol. 2018, 26, 313–320. [Google Scholar] [CrossRef]
  37. Lin, M.Q.; Zeng, X.P.; Wu, J. State of health estimation of lithium-ion battery based on an adaptive tunable hybrid radial basis function network. J. Power Sources 2021, 504, 230063. [Google Scholar] [CrossRef]
  38. Chang, C.; Wang, Q.Y.; Jiang, J.C.; Wu, T.Z. Lithium-ion battery state of health estimation using the incremental capacity and wavelet neural networks with genetic algorithm. J. Energy Storage 2021, 38, 102570. [Google Scholar] [CrossRef]
  39. Liu, K.L.; Shang, Y.L.; Ouyang, Q.; Widanage, W.D. A data-driven approach with uncertainty quantification for predicting future capacities and remaining useful life of lithium-ion battery. IEEE Trans. Ind. Electron. 2021, 68, 3170–3180. [Google Scholar] [CrossRef]
  40. Tong, Z.M.; Miao, J.Z.; Tong, S.G.; Lu, Y.Y. Early prediction of remaining useful life for lithium-ion batteries based on a hybrid machine learning method. J. Clean. Prod. 2021, 317, 128265. [Google Scholar] [CrossRef]
  41. Samara, S.; Natsheh, E. Intelligent PV panels fault diagnosis method based on NARX network and linguistic fuzzy rule-based systems. Sustainability 2020, 12, 2011. [Google Scholar] [CrossRef] [Green Version]
  42. Boussaada, Z.; Curea, O.; Remaci, A.; Camblong, H.; Bellaaj, N.M. A nonlinear autoregressive exogenous (NARX) neural network model for the prediction of the daily direct solar radiation. Energies 2018, 11, 620. [Google Scholar] [CrossRef] [Green Version]
  43. Louzazni, M.; Mosalam, H.; Cotfas, D.T. Forecasting of photovoltaic power by means of non-linear auto-regressive exogenous artificial neural network and time series analysis. Electronics 2021, 10, 1953. [Google Scholar] [CrossRef]
  44. Emmert-Streib, F.; Dehmer, M. Evaluation of regression models: Model assessment, model selection and generalization error. Mach. Learn. Knowl. Extr. 2019, 1, 32. [Google Scholar] [CrossRef] [Green Version]
  45. Zhao, R.X.; Kollmeyer, P.J.; Lorenz, R.D.; Jahns, T.M. A compact methodology via a recurrent neural network for accurate equivalent circuit type modeling of lithium-ion batteries. IEEE Trans. Ind. Appl. 2019, 55, 1922–1931. [Google Scholar] [CrossRef]
  46. Lai, X.; Qiao, D.D.; Zheng, Y.J.; Yi, W. A novel screening method based on a partially discharging curve using a genetic algorithm and back-propagation model for the cascade utilization of retired lithium-ion batteries. Electronics 2018, 7, 399. [Google Scholar] [CrossRef] [Green Version]
  47. Yang, R.X.; Xiong, R.; Ma, S.X.; Lin, X.F. Characterization of external short circuit faults in electric vehicle li-ion battery packs and prediction using artificial neural networks. Appl. Energy 2020, 260, 114253. [Google Scholar] [CrossRef]
  48. Zhou, J.M.; Wang, F.L.; Zhang, C.C.; Zhang, L.; Li, P. Evaluation of rolling bearing performance degradation using wavelet packet energy entropy and RBF neural network. Symmetry 2019, 11, 1064. [Google Scholar] [CrossRef] [Green Version]
Figure 1. The flowchart of the voltage prediction and fault prognosis based on the proposed NARX model.
Symmetry 13 01714 g001
Figure 2. The structure of the NARX neural network.
Symmetry 13 01714 g002
Figure 3. The feedback mode of the NARX: (a) parallel architecture; (b) series-parallel architecture.
Symmetry 13 01714 g003
Figure 4. The voltage sequences of twenty-three cells at eight temperatures.
Symmetry 13 01714 g004
Figure 5. The cell voltage prediction results based on the NARX.
Symmetry 13 01714 g005
Figure 6. The structure of the BP neural network.
Symmetry 13 01714 g006
Figure 7. The comparison of the NARX and the BP performances: (a) the RMSE of the five cells; (b) the MAE of the five cells; (c) the R2 of the five cells.
Symmetry 13 01714 g007
Figure 8. The structure of a boxplot.
Symmetry 13 01714 g008
Figure 9. The alarm levels for the voltage abnormities.
Symmetry 13 01714 g009
Figure 10. The boxplot of the five validation cells.
Symmetry 13 01714 g010
Figure 11. The fault alarm or warning results for the five validation cells.
Symmetry 13 01714 g011aSymmetry 13 01714 g011b
Table 1. Battery specification parameters.
ItemsParameters
Battery type1865 EH
Nominal voltage3.2 V
Charge cut-off voltage3.65 ± 0.05 V
Discharge cut-off voltage2.0 ± 0.05 V
Nominal rated capacity32 Ah
Table 2. Cells cycled at eight experimental temperatures to obtain the characteristic data.
Test ModeTemperature/°CNumber of CellsCell Index
1−2021,2
2−1023,4
3055,6,7,8,9
410210,11
525312,13,14
640415,16,17,18
755319,20,21
860222,23
Table 3. The evaluation of the NARX voltage prediction performance for untrained and extreme temperature cells.
Cell IndexRMSE (V)MAE (V) R 2   Computational Time (s)
10.0422730.0278070.9350414.69
120.00923180.00647150.8903813.23
130.00798550.00525140.9484911.84
140.00963440.00609820.9207712.51
220.00761820.00531740.8827113.02
Table 4. Alarm or warning thresholds and levels for voltage abnormities to perform fault diagnosis.
Alarm or Warning ThresholdsFault TypesAlarm or Warning Levels
U ^ t > Charge   cut-off   voltage Overvoltage fault1
Q 3 +   3 IQR U ^ t Charge   cut-off   voltage Open-circuit fault2
Q 3 +   1.5 IQR U ^ t Q 3 +   3 IQR Potential open-circuit fault3
Q 1   1.5 IQR < U ^ t < Q 3 +   1.5 IQR NormalSafe
Q 1   3 IQR U ^ t Q 1   1.5 IQR Potential short-circuit fault3
Discharge   cut-off   voltage U ^ t Q 1   3 IQR Short-circuit fault2
U ^ t < Discharge   cut-off   voltage Undervoltage fault1
Publisher’s Note: MDPI stays neutral with regard to jurisdictional claims in published maps and institutional affiliations.

