Abstract
In order to play the important role of electric vehicles to promote the realization of the 3060 double carbon target, electric vehicles have seen explosive growth. However, due to the tight symmetry between the number and distribution of electric vehicles and their corresponding charging facilities, the layout of charging facilities has higher requirements. This paper collects travel data in the form of a traffic travel questionnaire for electric vehicle users. Based on the vehicle parking demand model of the queuing theory and Monte Carlo simulation, the paper gives the number of stopping vehicles and the time of vehicles stopping in different places such as residential areas, workplaces, supermarket parking and roadside. In addition, based on the Bass prediction model, the main parameters are modeled in the model, and the price correction coefficient is introduced. The improved Bass model is used to predict the growth trend of electric vehicles in different regions in different years and in different incentive sites. By predicting the ownership of urban electric vehicles and accurately grasping the distribution and operation of electric vehicles, this paper can provide guidance and suggestions for the planning and construction of charging facilities in different regions, effectively reduce the investment cost of charging facilities and guide local governments to formulate reasonable planning schemes.
1. Introduction
As oil resources become increasingly scarce, traditional fuel vehicles consume a lot of energy and emit a lot of greenhouse gases, while electric vehicles, as a power source, have the advantages of low pollution and high energy efficiency [1,2], the large-scale development of electric vehicles is one of the means to alleviate the increasingly severe energy and environmental problems [3]. By June 2021, the number of electric vehicles in China was 6.03 million, and the number of pure electric vehicles was 4.93 million, accounting for 81.68% of the total number of electric vehicles. However, when large-scale electric vehicles are connected to the grid, there is bound to be a significant impact on the grid. Moreover, if not planned, the rapid growth of the number of electric vehicles will seriously affect the symmetry of the number and distribution between them and the supporting charging facilities. Therefore, it is the basis of planning charging facilities to make reasonable statistics of travel rules and accurately predict the later period of ownership [4,5,6].
The analysis of electric vehicles travel rules involves users’ commuting behavior, travel time, residence time, charging behavior selection, etc. Based on the data of 492 questionnaires, literature [7] collected relevant data of electric vehicle driving and explored user preferences and cognition of electric vehicles based on planned behavior theory and consumer decision theory. Xu et al. [8] analyzed the spatial behavior characteristics of travelers based on travel chain, and studied the driving behavior characteristics of travel purpose, travel starting point and travel distance. In the literature [9,10], a random travel chain was introduced to simulate the movement characteristics of electric vehicles. By mining and analyzing the travel data of HNTS, the probability distribution of each characteristic quantity in the travel chain was obtained, and then the temporal and spatial distribution of electric vehicle charging demand and load was calculated by probability sampling. Based on the Monte Carlo simulation, the spatial-temporal characteristics of users’ travel behaviors are described, and the charging and discharging behaviors of electric vehicles are simulated and predicted [11,12]. At the same time, range anxiety affects the driving path choice of electric vehicles users [13]. The literature [14] analyzes the driving path of electric vehicles users and puts forward a generalized model of road network path choice based on user range anxiety. Hu and Yue [15] start from the travel behavior of electric vehicles users, and based on the point demand and path demand, combined with the queuing theory model of electric vehicles charging station, rationally chooses the location of charging station and allocates the number of charging piles, so as to plan the urban charging infrastructure.
Due to the limitation of driving range and insufficient charging facilities, there is a big gap between the development of electric vehicles and traditional fuel vehicles. The literature [16] mainly adopted Logistic and Compertz curve models to analyze, and believed that the popularization of vehicles would go through three stages: rapid exponential growth stage, steady growth stage and steady-state, and tried to determine the bliss point of vehicle ownership rate by the different variables. Wang [17] analyzed the main social indicators related to vehicle ownership, and predicted electric vehicle ownership based on grey correlation analysis and BP neural network. The Simpson formula was used to improve the background value of the grey neural network so as to improve the prediction progress of the model. The literature [18,19,20] analyzed various factors and related relationships affecting the development of electric vehicles from a macro perspective, and obtained the development trend of electric vehicles by using the idea of system dynamics. In literature [21,22], the Bass model is improved to achieve the dynamic modeling for the prediction of medium and long-term ownership of electric private cars.
In this paper, the basic travel data of electric vehicle users are obtained by designing a questionnaire, and the statistical model of electric vehicle users’ travel rules is established by using the data fitting method. The vehicle parking demand model based on queuing theory and Monte Carlo simulation are presented to give the number of stopping vehicles and the time of vehicle stopping in different places such as residential areas, workplaces, supermarket parking and roadside. In addition, considering economic, policy, environmental and other factors, the growth trend of regional electric vehicles under different incentive places is predicted based on the improved Bass model. The travel patterns and the forecast results of electric vehicles can accurately grasp the distribution and operation of electric vehicles and provide data support for safe charging of electric vehicles, thus effectively reducing the occurrence of battery spontaneous combustion and charging facility failure during the charging process. Moreover, it can provide guidance and suggestions for the planning and construction of charging facilities in the region, which can effectively reduce the investment cost of charging facilities and guide the local government to make reasonable planning schemes.
2. Statistical Analysis of Urban Electric Vehicle Travel Rules
2.1. Traffic Travel Questionnaire Design for Electric Vehicles Users
In combination with the development situation of Xinjiang and the goal of charging facilities construction demand, and considering the main factors affecting the travel rule of electric vehicles, a traffic travel questionnaire for electric vehicle users was designed. In this paper, the main factors affecting the travel of electric vehicles are as follows:
- 1.
- Average daily travel mileage
Average daily travel mileage refers to the total miles of users’ daily travel behavior.
- 2.
- Travel mileage
Travel mileage refers to the distance electric vehicles users travel from their starting point to their destination. It is related to the travel purpose of electric vehicles, which can be divided into four categories: commuting, leisure and entertainment, official and business trips, and visiting relatives and friends.
- 3.
- Parking place
The parking times and duration of each vehicle in different places are also different. Parking places are mainly divided into workplaces, residential areas, roadside and public parking.
- 4.
- The initial SOC
The initial SOC refers to the starting SOC when an electric vehicle chooses to charge.
At present, due to the low number of electric vehicles in Xinjiang, it is difficult to obtain sufficient data, so the number of research samples is small. Based on the travel and parking rules of traditional fuel vehicle users, the study can be conducted instead of electric vehicle users (Table 1, Table 2 and Table 3).

Table 1.
Parking scenarios of electric vehicles in different time periods.

Table 2.
The parking time of electric vehicles in different scenarios.

Table 3.
Charging behavior of users with different residual fuel.
- Q1 Average daily mileage of your vehicle?
- Q2 The daily mileage per trip of your vehicle?
- Q3 Where is your car usually parked in each period?
- Q4 What is your daily parking time?
- Q5 How much fuel is left in your vehicle when you choose to refuel?
2.2. Mathematical Modeling of Electric Vehicle Travel Behavior
The travel behavior and charging selection behavior of electric vehicle users are related to the remaining batteries capacity, the average daily mileage, the parking place, the parking time and other factors.
2.2.1. Electric Vehicle Remaining Batteries Capacity Model
Battery has always been the focus of the development of the electric vehicle industry, and the range of electric vehicles is a measure of the level of development of electric vehicle. Now, electric vehicles have made some progress in battery technology, but the public is still anxious about battery technology. The SOC of remaining batteries capacity is the key factor of users’ willingness to charge and a key indicator to measure users’ charging demand. A questionnaire survey was conducted to obtain the probability distribution of whether the user has the intention of charging in the SOC of different remaining batteries capacity.
The initial SOC of charging obeys normal distribution, and its probability density function is:
Figure 1 is the probability distribution of Percentage of battery remaining capacity.The questionnaire data of 1156 electric vehicle owners were selected and 12 invalid data were screened out. If the respondent’s choice was random, they chose one option at random between 10% and 50%.
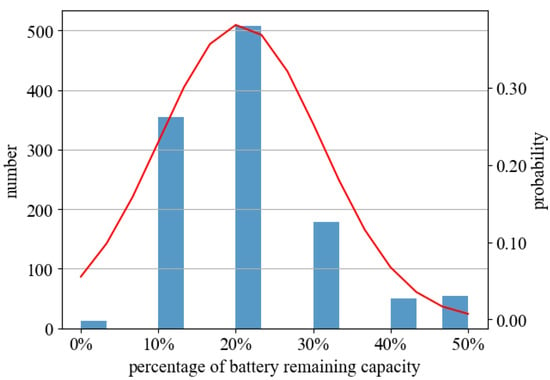
Figure 1.
Probability distribution of percentage of battery remaining capacity.
In the known statistical data, there are 361, 500, 183, 49 and 51 people with 10% to 50% of the remaining batteries capacity, and the average = 20.42% and standard deviation = 10.38% of the battery remaining capacity can be obtained.
2.2.2. Average Daily Mileage Model of Electric Vehicles
Vehicle daily mileage is generally obtained by GPS positioning or travel survey. GPS positioning is limited by the cost, and the sample data are generally less, with poor representativeness. After years of investigation and accumulation, domestic and foreign Vehicle travel survey statistics have been relatively perfect, among which the most representative data comes from HNTS. By analyzing HNTS data, it is obtained that daily vehicle mileage x satisfies lognormal distribution, and its probability density function is [23]:
The x is the distance traveled, is the mean of lnx, and is the standard deviation of lnx.
According to the data, the mean value of x is 39.78 and the standard deviation is 29.31. The lognormal distribution of the average daily mileage is shown in Figure 2.
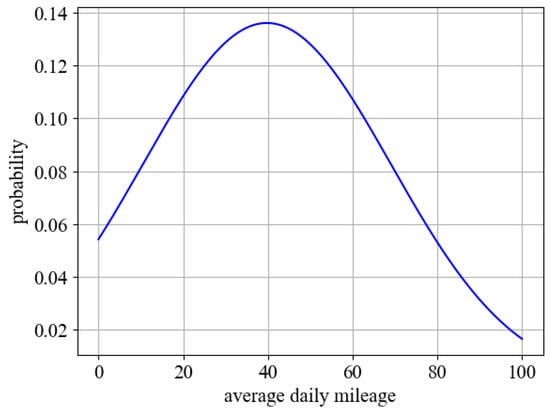
Figure 2.
Probability distribution of average daily mileage.
2.3. Vehicle Parking Demand Model Based on Queuing Theory and Monte Carlo Simulation
Considering the fixed parking capacity in different areas such as workplaces and residential area, when the electric vehicles driver finds that there is no parking space in the current area, he will choose to leave. As a result, the parking demand of electric vehicles is highly correlated with factors such as the arrival time of each vehicle in different time periods, the time difference between two consecutive vehicles arriving at the same area and the parking time of vehicles, so the paper considers introducing performance indicators of queuing theory model to measure the parking demand, and through Monte Carlo simulation to verify the efficiency and high accuracy of the results.
2.3.1. Queuing Theory
Queuing theory, also known as stochastic service system theory, is a mathematical discipline specially used to study the phenomenon of crowded queuing [24]. The purpose of queuing theory is to solve the optimal design and control of service system by studying the probabilistic characteristics of various service systems queuing. A queuing service system mainly consists of input process, queuing rules and service organizations. The structure model of the queuing system in the charging station is shown in Figure 3.
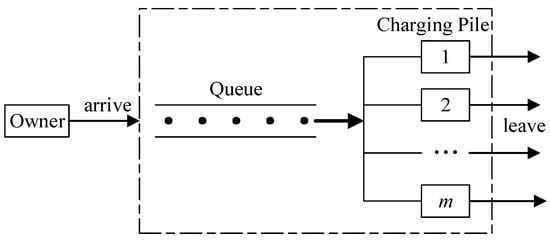
Figure 3.
Structure diagram of queuing system in charging station.
The daily travel time and destination of electric vehicles are random, and so are the electric vehicles with quick charging needs accessing charging stations. The electric vehicle charging station is a random service system. The service objects are electric vehicles, the service facilities are charging machines, and the service institutions are charging stations.
The parking of electric vehicles in different areas is taken as a random service system, and it is the queuing system M/M/c of multiple service stations. The first M represents the probability distribution of the time interval between the arrival of adjacent electric vehicles in this area, which obeys the Poisson distribution. The second M is the probability distribution of the service time of each service station, that is, the parking time, obeying a negative exponential distribution. In addition, c is the number of service stations, which is generally distributed randomly.
The queuing system consists of three parts: arrival time, service time and service rules of electric vehicles. The system has the following characteristics: (1) Vehicles come separately, are independent of each other, and the process of arriving at the service system within a certain time obeys Poisson distribution. (2) The service rule in the vehicle parking demand model is that come first and served first. At the same time, the service efficiency of each service station is the same. (3) Arrival time and service time are sampled from random numbers and probability distributions that conform to the survey data.
In different periods, the time for each electric vehicle to arrive at charging stations in different regions obeys Poisson distribution, then its density function is:
where, λ is the average number of electric vehicles arriving in different areas in each time slot.
Meanwhile, the interval time between two continuous vehicles arriving at the same area follows an exponential distribution, and the parameters in different areas at different time periods are considered to be different. Its density function is:
All the electric vehicles entering the charging station for charging are independent of each other, when time interval length Δt is small enough, in the time period [t, t + Δt], the probability of customer arriving service system is only related with the length of time interval, and it is not related to the starting time, and in the time period [t, t + Δt], the probability of two customers arriving the service system at the same time is very small, the above characteristics satisfy the characteristics of Poisson distribution that are no aftereffect, stationarity and general type.
2.3.2. Monte Carlo Algorithm
Monte Carlo simulation method is a random simulation method based on probability and statistics methods. It generally uses random numbers to give a probability model on a complex problem, so that the solution of the complex problem corresponds to some characteristics of the random variables in the model, so as to achieve the purpose of solving. The Monte Carlo simulation method has the advantages of less computation, higher accuracy and faster speed. According to the daily mileage distribution, parking distribution and other data, Monte Carlo simulation is adopted to extract the travel distribution of electric vehicle in different regions at different times. The flow chart is shown in Figure 4.
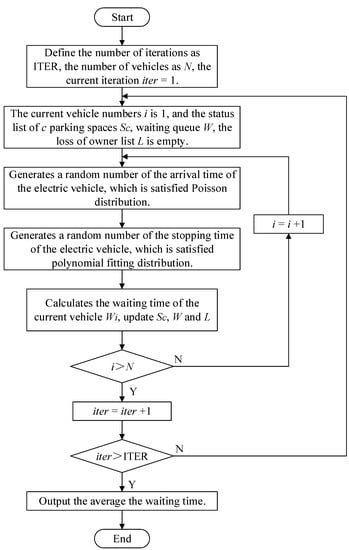
Figure 4.
Parking demand prediction flow chart of electric vehicles based on Monte Carlo simulation.
2.3.3. Simulation Analysis of Vehicle Parking Demand Based on Monte Carlo Algorithm
According to known survey data statistics and Equation (3) distribution, random numbers are generated to obtain the average number of electric vehicles parked in different areas in each time segment, as shown in Figure 5.
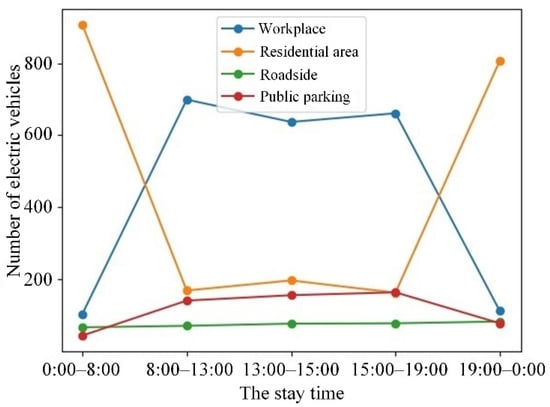
Figure 5.
The number of electric vehicles parked in each region.
Meanwhile, the interval time between two continuous vehicles arriving at the same area follows an exponential distribution, and the parameters in different areas at different time periods are considered to be different.
Random numbers are generated based on the known survey data collected in Table 1, Table 2 and Table 3 and Equation (4) distribution. The parking time of each electric vehicle in different time periods in different regions can be obtained. The residence time curve of electric vehicles in various regions is shown in Figure 6.
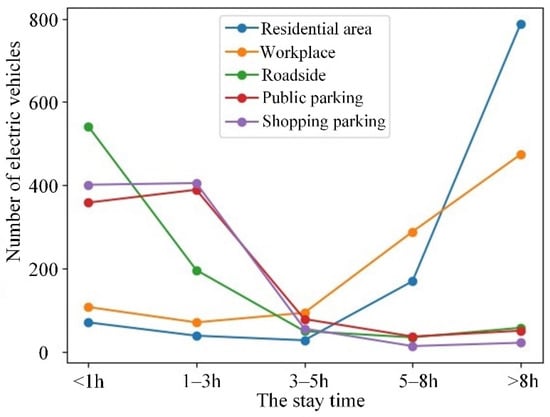
Figure 6.
Staying time of electric vehicles in each region.
The function curve of parking time can be fitted by polynomial based on existing data, and its expression is as follows:
Based on the Monte Carlo algorithm, polynomial fitting curves of residence time of electric vehicles in five regions were obtained, as shown in Figure 7. By sampling polynomial curves, the random residence time of electric vehicles in each region can be obtained.
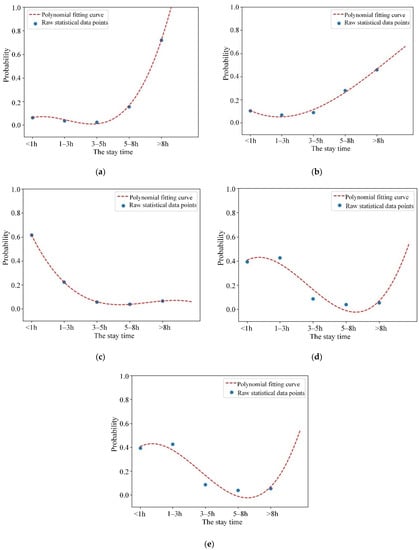
Figure 7.
Polynomial fitting curves of staying time of electric vehicles in each regions. (a) residential area; (b) workplace; (c) roadside; (d) public parking; (e) supermarket parking.
Through the above system parameters, the waiting time of each electric vehicle in each area can be calculated, and the waiting time can be taken as the main indicator of the parking demand of electric vehicles. For the ith owner, in the M/M/c system, if i ≤ c, the waiting time is 0, and the owner can find a parking space in the area directly. If i > c, the vehicle owner needs to look for a parking space around the area for a period of time, and the maximum waiting time for customers is set as T. We stipulate that the vehicle owner will find the first free parking space, then the waiting time of the ith vehicle owner must be calculated and compare his arrival time plus the maximum waiting time with the earliest time of the c vehicle owners who leave the area.
Based on the Monte Carlo simulation method, the whole electric vehicle parking system is simulated by random number and fitted parameter distribution, finally the waiting time is obtained as the main indicator of vehicle parking demand in different regions.
It is assumed that there are 1044 electric vehicle owners in the system, and the simulation experiment is run 200 times, and the results are analyzed. Considering the patience and practical situation of electric vehicle owners, it is set that if the queuing time exceeds 12 min, the owners will leave automatically. According to the experiment, about 200 parking Spaces need to be set up in the residential area so as not to lose the owners, and the average waiting time is 0.86 min. The workplace needs to set up about 211 parking spaces, the average waiting time is 4.5 min. About 104 parking spaces need to be set up on the roadside, and the average waiting time is 4.15 min. The average waiting time for a public parking is 3.86 min, with about 138 spaces. From the results of the experiment, the parking demand of the residential area and the workplace is the largest, followed by the public parking, and the parking demand of the roadside is the smallest.
3. Regional Electric Vehicle Ownership Prediction Based on the Improved Bass Model
3.1. Analysis of Factors Promoting the Growth of Electric Vehicles
At present, the main factors affecting the development of electric vehicles include the factors of the electric vehicle industry itself and other factors related to electric vehicles.
For the electric vehicle industry itself, the main influencing factors are the technical development level of the electric vehicle industry, such as the level of electric vehicle charging infrastructure construction and the progress level of battery technology, which includes battery range, fast and slow charging time [25,26], and adaptability to low temperature in winter, etc. [27].
From the point of developing the low temperature adaptability of the electric vehicle in winter, through attaching with the power battery manufacturers, such as BYD (Shenzhen, China), CATL (Ningde, China), collecting the official electric vehicle test report in cold weather (Mohe in Heilongjiang, Zhangjiakou in Hebei), and making electric vehicle owners using condition research in the north of Xinjiang, it is found that foreign electric vehicle range about 20~25% lower in winter (Tesla 20% lower), domestic electric vehicle range about 40~50% lower in winter. The daily mileage of electric vehicles is about 150 km, and electric vehicles usually have 30 to 40% of base power in winter, charging power is 4~6 kw. during the trough period, it can be charged to more than 80% in 7~9 h (including preheating time) to meet the daily driving needs. With the iterative progress of technology, the battery safety, charging time and capacity are constantly improving, and with the improvement of the battery management system (BMS) and auxiliary heating system, the problem of the decline of electric vehicle’s winter rangeability is being solved.
At the same time, in the early stage of the development of the electric vehicle industry, the promotion of electric vehicles is affected by the strength of policy support and media advertising. Policy support is determined by power grid support strength and government support strength. If the number of days of severe weather pollution increases in a year, CO2 emissions from fuel vehicles increased rapidly, the government will actively promote the development of electric vehicles, such as implementing incentive price or subsidy policies and encouraging the research and development of new technologies. If the proportion of electric vehicles discharging into the grid increases with the increase of the number of electric vehicles, the power grid can realize the benefit of peak clipping and valley filling, and the grid will also increase its support for the development of electric vehicles. The interaction between electric vehicles and the power grid depends on charging piles, so the support of the power grid for the development of electric vehicles is mainly reflected in the construction of charging piles.
The main factor related to electric vehicles is the increase in oil price, which increases the cost of using traditional fuel vehicles, thus promoting the promotion of electric vehicles. The purchase intention of electric vehicle users is affected by factors such as electric vehicle economy, charging convenience, and electric vehicle subsidy level. The pile-to-vehicle ratio refers to the ratio between electric vehicle charging and changing facilities and the number of electric vehicles in a certain area. The larger the ratio is, the greater the proportion of electric vehicle charging and changing facilities in the number of electric vehicles, and the greater the charging convenience of electric vehicle users will be.
3.2. Improved Bass Modeling
Bass model, also known as the Bass diffusion model, was created by American marketing scholar Frank Bass. It is a market share prediction model specifically for the adoption and diffusion of innovative products and technologies. Innovative adopters. Another group of potential adopters, whose time to adopt a new product is influenced by other members of society, and their pressure increases as the number of early adopters increases. Bass calls these potential adopters imitators [28,29].
where f(t + 1) is the proportion of the number of new consumers in t + 1 year to the total potential consumers in t + 1 year. F(t) refers to the proportion of the number of new products in the cumulative total of similar products used in the market in that year. p is the innovation coefficient (external influence coefficient), which reflects the number of consumers who will purchase new products under external influence. q is the imitation coefficient (internal influence coefficient), which reflects the number of consumers affected by network effects and others’ purchasing decisions.
The Bass model expresses the nature of the diffusion process with mathematical equations, which greatly simplifies people’s understanding of innovation diffusion and makes it systematic. As a new technology product, the maximum market potential of electric vehicles depends on the product technology maturity, coverage of public supporting facilities, government media publicity and subsidies.
Parameters p and q determine the shape of curve F(t) in the Bass model, and the values of p and q are mostly determined by fitting historical data of market share in relevant studies. However, electric private cars are still in the early stage of promotion, and the historical data such as sales volume and per capita ownership are not perfect. The method to determine the parameters based on data fitting is not available at present [30]. Therefore, this paper builds an improved Bass model on the basis of literature [31], changes the constant coefficients p and q estimated based on historical conditions into the modeling of parameters p and q under the consideration of relevant factors affecting the growth of electric vehicles, and introduces the price correction coefficient. The iterative model of the electric vehicle ownership prediction matrix is shown as follows:
where E(t) is the ownership of private electric vehicles in the t year. V(t) is the total number of private vehicles in the t year. λ is the annual natural growth rate of private vehicles. F(t + 1) is the proportion of the number of new electric vehicles in t + 1 year to the total potential vehicles sold in the market in t + 1 year. F(t) is the penetration rate of private electric vehicles in the t year, and is the proportion of the ownership of private electric vehicles in the t year to the total number of private vehicles in the t year, with a value range of [0, 1]. F(t + 1) is the proportion of the number of new electric vehicles in t + 1 year to the total potential vehicles sold in the market in t + 1 year. p(t) is the innovation coefficient. q(t) is the imitation coefficient. x(t) is the price correction coefficient.
The innovation coefficient p(t) is affected by policy intensity, media publicity effect and technology maturity. This part of users are consumers who spontaneously adopt electric vehicles, and are not affected by users who have already purchased electric vehicles. They are called innovative adopters. Considering that there is a lag between the media publicity and the crowd recognition of a new idea or product, the increase in the acceptance of electric vehicles by the crowd is related to the policy media publicity and the technical maturity of electric vehicles, and the innovation coefficient p(t) is expressed as follows:
where p(t) represents the innovation coefficient in the t year; M represents the propaganda intensity of policies and media, and its value range is [0, 1]. T(t) is the technical maturity of electric vehicles in the t year, such as the development of electric vehicle batteries and related charging infrastructure. α is the technical update coefficient. The innovation coefficient p(t) defined in the above equation is a time-varying parameter, which can reflect the dynamic change of the number of consumers who spontaneously adopt new products.
Imitation coefficient q(t) is affected by electric vehicle visibility and user satisfaction. This part of users are consumers who are influenced by the users who previously purchased electric vehicles, called imitators. The imitation coefficient is related to the occurrence frequency of electric vehicles in daily life and the evaluation of electric vehicles by electric vehicle owners around potential consumers. The imitation coefficient q(t) is expressed as follows:
where the q0 is the imitation coefficient under the condition of complete satisfaction of the owners of private electric vehicles, which can be calculated by referring to the upper limit of the imitation coefficient of other durable goods. c(t) is the relative visibility of private electric vehicles in the city. Relative visibility can be expressed by the permeability of private electric vehicles F(t), that is, c(t) = F(t). s(t) is the overall satisfaction of private electric vehicle owners in this city, represented by the charging convenience index, that is, the convenience of charging after the completion of the daily driving task, with a value range of [0, 1].
where is the average daily mileage. L is the range of electric vehicles. rt is the pile-to-vehicle ratio. is the regulator.
The price correction coefficient x(t) is affected by price cost and policy subsidies, and there is a competitive relationship between electric vehicles and conventional fuel vehicles. Considering the purchase and use costs of electric vehicles relative to conventional energy vehicles, the price correction coefficient x(t) is expressed as follows:
Among them, the CEV(t) and CCV(t) is the total cost of electric vehicles and conventional fuel vehicles respectively, and is the present value converted to in the first t year of purchase. β is the cost impact coefficient, which is negative.
The total cost C(T) includes the acquisition cost Cbuy(t) and maintenance cost Copr(t). The acquisition cost is the converted residual value of the vehicle plus the tax value, as shown below:
where Cp(t) is the selling price of the vehicle (tax included). Cs(t) is a tax on the purchase of a vehicle (electric vehicles are exempt). rdep is the vehicle depreciation rate. τ is the estimated service life of the vehicle.
Maintenance cost Copr(t) refers to the maintenance cost during the service period (three years free warranty for conventional fuel vehicles, increasing maintenance cost after three years, lifetime warranty for electric vehicles), which is expressed as follows:
where Cm represents the increasing part of vehicle annual maintenance cost.
The prediction process of private electric vehicle ownership based on the improved Bass model is shown in Figure 8. Considering the external and internal influencing factors of the electric vehicle as well as the price advantage of the electric vehicle, the ownership of the electric vehicle in this region each year is obtained through simulation.
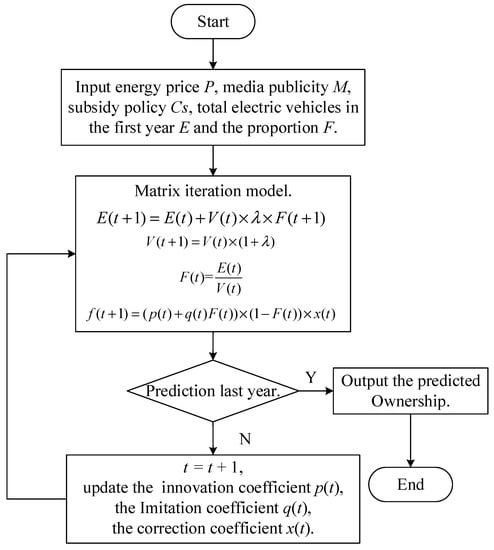
Figure 8.
Flow chart of electric vehicle ownership prediction based on the Bass model.
3.3. Simulation Analysis of Electric Vehicle Ownership in Xinjiang
The method proposed in this paper is used to forecast the ownership of electric private vehicles in Xinjiang Province. Figure 9 and Table 4 show the forecast results of electric private vehicle ownership under different policy intensity and media publicity intensity. In the short term, there is little difference in the ownership of electric private vehicles. However, as time goes by, the promotion effect of policy support and media publicity on electric private vehicles gradually appears, and the effect of compulsory measures is the most obvious. Figure 10 and Table 5 show the forecast results of electric vehicle private vehicle ownership under different electric vehicle technology upgrading degrees, with the improvement of electric vehicle technology and infrastructure, electric vehicle customer satisfaction increases, which can promote electric vehicle sales.
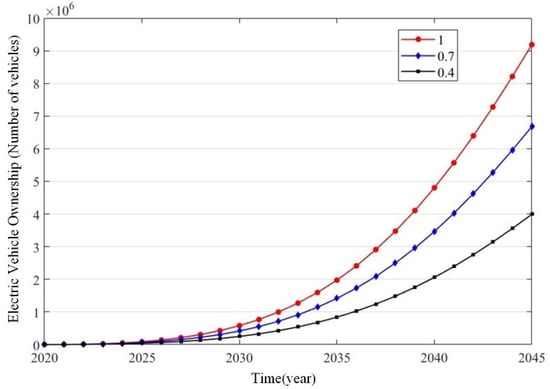
Figure 9.
Electric vehicle ownership under different support strength M (α = 0.5).

Table 4.
Electric vehicle ownership under different support strength M (α = 0.5).
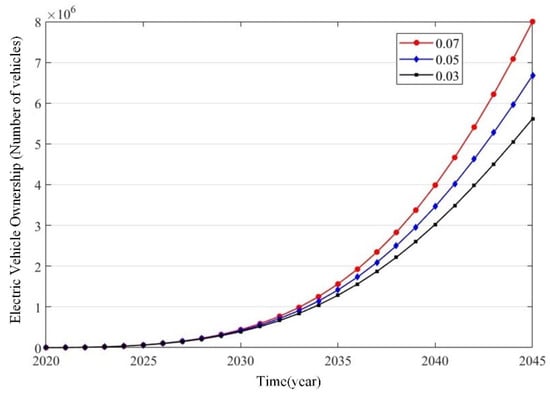
Figure 10.
Electric vehicle ownership under different technology update degrees, α (M = 0.7).

Table 5.
Electric vehicle ownership under different technology update degrees, α (M = 0.7).
Assuming that the initial value of the coefficient q0 = 0.5, initial value of innovation coefficient p0 = 0.001, technical maturity T0 = 0.01 of electric vehicles in 2019, technical update degree = 0.1.
The basic scene is set as that the fire ban policy has not been implemented in Xinjiang. The radical scene is that the Xinjiang Government will adopt the points reward policy in 2023, and the whole Xinjiang will begin to ban burning in 2028. At the same time, the key technologies and infrastructure construction of new energy vehicles will be accelerated from 2025. In addition, due to a large number of purchases of oil-powered vehicles around 2010, fuel-powered vehicles will begin to be scrapped in large quantities in 2030 based on the average service life of oil-powered vehicles of 20 years, and the number of replaced electric private vehicles will increase. Since 2015, the growth rate of fuel vehicles has declined, so the number of replacements of electric vehicles has decreased.
Figure 11 shows the forecast chart of electric vehicle ownership in Xinjiang by 2038, and Table 6 shows the electric vehicle ownership in Xinjiang by 2038. In the basic scene, the total number of electric vehicles in Xinjiang will be 1,690,700 by 2038, accounting for 5.4% of the total number of private vehicles. Under the radical scene, the total number of electric vehicles in Xinjiang will be 6,437,900 by 2038, accounting for 86.7% of the total number of private vehicles. The model can accurately reflect the role of media publicity, policy subsidies and electric vehicle-related infrastructure in popularizing private electric vehicles.
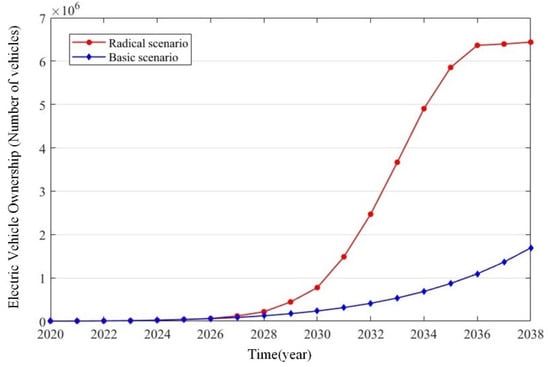
Figure 11.
Forecast of electric vehicle ownership in Xinjiang.

Table 6.
Electric vehicle ownership in Xinjiang by 2038 (million).
In the early stage, the subsidy policy can play a significant role in increasing the market share of electric vehicles, so that electric vehicles have a certain internal growth capacity in the development process. Through policy support, electric vehicles development can be maintained at a high speed, but this development is not sustainable. With the intensification of market competition, the reduction of purchase costs brought by technological upgrading will become normal, and the preferential price will no longer arouse attention on the market. Therefore, the Government needs to seek new schemes to relay the subsidy policy.
The Government can appropriately increase the incentive mechanism to promote the vehicle enterprises to speed up technological upgrading and enhance the enthusiasm of technological innovation; reasonably increasing the “privilege” of electric vehicles in traffic and using public media to publicize the advantages of electric vehicles and the positive reputation provided by existing buyers can greatly influence the purchase decisions of imitators in the social system; enterprises and public institutions promote electric special vehicles, improve the market penetration in the special field, improve the visibility and user satisfaction of electric vehicles, implement a commercial application to drive the development of social electric vehicles to have a demonstration effect.
In the future, consumers will pay more attention to the cost performance of products, and new energy vehicles with high-cost performance will have an overwhelming advantage in the market. Only through technical guidance can electric vehicles have market competitiveness, can the sustained growth of electric vehicles be promoted. At present, there is still a need to solve the battery technology problems, and gradually improve the electric vehicle charging infrastructure construction.
The research and development in the field of the battery should be strengthened, and the standardization among various manufacturers in the industry should be unified, so as to improve the versatility of products, so as to realize scale economy and maximum resource sharing and utilization. The scale economy effect can better promote the production enterprises actively study and develop new technology, new equipment, and improve the competitiveness of enterprises. The improvement of battery equipment technology will increase the range of driving, shorten the charging time, extend the battery cycle life, improve the safety performance, improve the vehicle environment, enhance user satisfaction, greatly increase the public’s awareness of electric vehicles, and promote the production and marketing of electric vehicles in society.
4. Conclusions
This paper collects travel data in the form of a traffic travel questionnaire for electric vehicle users. Based on the queuing theory of vehicle parking demand model and Monte Carlo simulation, the paper gives the number of stopping vehicles and time of vehicle stopping in different places such as residential areas, workplaces, shopping malls and roadside. The results show that the parking demand of the residential area and the workplace is the largest, followed by the public parking, and the parking demand of the roadside is the least. In addition, the reasons influencing the development of electric vehicles are analyzed from the perspective of the electric vehicle industry itself and related factors. Based on the Bass prediction model, the main parameters are modeled in the model, and the price correction coefficient is introduced. The improved Bass model is used to predict the growth trend of electric vehicles in different years and different incentive scenarios in Xinjiang. By 2038, in the base scenario, the total number of electric vehicles in Xinjiang will reach 16,900, accounting for 5.4 percent of the total number of private cars. Under the radical scenario, the total number of electric vehicles in Xinjiang would reach 64,400, accounting for 86.7 percent of the total private cars. Results show that in the future in recent 10 years, the electric car ownership based and radical in two different scenarios are slowing, public awareness for electric cars is not high, but as time continue to radical scenario can make the electric car ownership increased dramatically, help promote large-scale development of electric vehicle and realize transportation “carbon peak and carbon neutral”. At the same time, we should also pay attention to whether the implementation of radical scenes conforms to social reality. In general, travel rules and forecast results of holding volume can provide certain guidance and suggestions for planning and construction of charging facilities in the region, effectively reduce the investment cost of charging facilities, and guide local governments to formulate reasonable planning schemes.
Author Contributions
Conceptualization: H.G. and L.Y.; funding acquisition: H.G.; investigation: H.G., L.Y. and A.Z.; software: A.Z.; validation: M.S.; writing—original draft: H.G. and L.Y.; writing—review and editing: H.G., L.Y., A.Z. and M.S. All authors have read and agreed to the published version of the manuscript.
Funding
This research was supported in part by the National Natural Science Foundation of China under Grant 52077107 (Fault Warning Analysis and Operation and Maintenance Service of Electric Vehicle Pile During Charging Process).
Institutional Review Board Statement
Not applicable.
Informed Consent Statement
Not applicable.
Data Availability Statement
The raw data supporting the conclusions of this article will be made available by the authors, without undue reservation.
Acknowledgments
This research was supported in part by the National Natural Science Foundation of China under Grant 52077107 (Fault Warning Analysis and Operation and Maintenance Service of Electric Vehicle Pile During Charging Process).
Conflicts of Interest
The authors declare no conflict of interest.
References
- Du, J.; Ouyang, M.; Chen, J. Prospects for Chinese electric vehicle technologies in 2016–2020: Ambition and rationality. Energy 2017, 120, 584–596. [Google Scholar] [CrossRef]
- Ji, Z.; Huang, X. Plug-in electric vehicle charging infrastructure deployment of China towards 2020: Policies, methodologies, and challenges. Renew. Sustain. Energy Rev. 2018, 90, 710–727. [Google Scholar] [CrossRef]
- Sparkes, M. Smart system can dramatically cut wait to charge electric car. New Sci. 2021, 249, 12. [Google Scholar] [CrossRef]
- Tian, M.; Tang, B.; Yang, X.; Xia, X. Planning of charging stations for electric vehicles based on a comprehensive consideration of charging demand and distribution network capacity. Power Grid Technol. 2021, 2, 498–509. [Google Scholar]
- Li, X.; Li, L.; Liu, W.; Zhao, X.; Xie, Q. Prediction of the spatial-temporal distribution of electric vehicle charging load based on dynamic traffic information. Power Syst. Prot. Control 2020, 1, 117–125. [Google Scholar]
- Guo, L. Based on the User Travel Behavior of Electric Vehicle Charging Load Modeling Method; North China Electric Power University: Beijing, China, 2019. [Google Scholar]
- Yang, Q. Research on Consumers’ Preference and Influencing Factors for Purchasing Pure Electric Vehicles under Different Business Models; China University of Mining and Technology: Xuzhou, China, 2020. [Google Scholar]
- Xu, Q.; Cai, T.; Liu, Y.; Yao, L.; Zeng, P. Location planning of EV charging stations considering drivers’ behavior habits and travel chains. Autom. Power Syst. 2016, 4, 59–65, 77. [Google Scholar]
- Wen, J.; Tao, S.; Xiao, X. Analysis on charging demand of EV based on stochastic simulation of trip chain. Power Syst. Technol. 2015, 39, 1477–1484. [Google Scholar]
- Tang, D.; Wang, P. Probabilistic modeling of nodal charging demand based on spatial-temporal dynamics of moving electric vehicles. IEEE Trans. Smart Grid 2016, 7, 627–636. [Google Scholar] [CrossRef]
- Chen, R.; He, Y.; Chen, F.; Dong, M.; Li, D.; Guang, F. Long Range Forecasting of Electric Vehicle Daily Load Based on System Dynamics and Monte Carlo Simulation. China Electr. Power 2018, 9, 126–134. [Google Scholar]
- Song, Y.; Lin, S.; Tang, Z.; He, S.; Lu, Y.; Mao, T. Probabilistic Modeling of Spatial and Temporal Distribution of Electric Vehicle Charging Load Based on Dynamic Vehicle Flow. Autom. Power Syst. 2020, 23, 47–56. [Google Scholar]
- Tian, F.; Chen, Z. Research on planning of electric vehicle charging station considering user choice preference. Comput. Eng. Appl. (accepted).
- Agrawal, S.K.; Boyles, S.D.; Jiang, N.; Shahabi, M.; Unnikrishnan, A. Network Route Choice Model for Battery Electric Vehicle Drivers with Different Risk Attitudes. Transp. Res. Rec. 2015, 2498, 75–83. [Google Scholar] [CrossRef]
- Hu, L.; Yue, T. Research on marginal cost model of electric vehicle charging and swapping facilities based on queuing theory. J. Phys. Conf. Ser. 2021, 1848, 012076. [Google Scholar] [CrossRef]
- Muraleedharakurup, G.; McGordon, A.; Poxon, J.; Jennings, P. Building a better business case: The use of non-linear growth models for predicting the market for hybrid vehicles in the UK. In Proceedings of the Fifth International Conference and Exhibition on Ecological Vehicles and Renewable Energies, Monaco, 25–28 March 2010. [Google Scholar]
- Wang, D. Vehicle ownership prediction based on grey correlation and BP neural network. Comput. Technol. Autom. 2015, 1, 29–33. [Google Scholar]
- Wu, W.; Xia, J. Prediction of vehicle ownership based on Simpson’s improved grey neural network. J. Chongqing Jiaotong Univ. 2019, 9, 101–108. [Google Scholar]
- Hou, B.; Yu, N.; Zhou, K. System dynamics analysis and simulation of the development scale of pure electric vehicle. J. Chongqing Univ. Technol. 2014, 12, 23–29, 40. [Google Scholar]
- Zhou, H.; Liu, J.; Liu, Y.; Xiang, Y.; Dai, S.; Li, T. Scale deduction analysis and simulation of electric vehicle based on system dynamics. J. Power Syst. Autom. 2017, 8, 1–7. [Google Scholar]
- Yu, H.; Zhang, Y.; Pan, A. Medium and long term model of electric private car charging load. J. Power Syst. Autom. 2019, 43, 80–87. [Google Scholar]
- Lan, S. Research on Development Strategy of New e Energy Vehicles in China Based on Generalized Bass Model; Tianjin University: Tianjin, China, 2019. [Google Scholar]
- Amara-Ouali, Y.; Goude, Y.; Massart, P.; Poggi, J.-M.; Yan, H. A Review of Electric Vehicle Load Open Data and Models. Energies 2021, 14, 2233. [Google Scholar] [CrossRef]
- Bae, S.; Kwasinski, A. Spatial and temporal model of electric vehicle charging demand. IEEE Trans. Smart Grid 2012, 3, 394–403. [Google Scholar] [CrossRef]
- Vazquez, S.; Lukic, S.; Galvan, E. Energy Storage Systems for Transport and Grid Applications. IEEE Trans. Ind. Electron. 2010, 57, 3881–3895. [Google Scholar] [CrossRef] [Green Version]
- Poullikkas, A. Sustainable options for electric vehicle technologies. Renew. Sustain. Energy Rev. 2015, 41, 1277–1287. [Google Scholar] [CrossRef]
- Quddus, M.; Shahvari, O.; Marufuzzaman, M.; Ekşioglu, D.; Castillo, K. Designing a Reliable Electric Vehicle Charging Station Expansion under Uncertainty. Int. J. Prod. Econ. 2021, 236, 108132. [Google Scholar] [CrossRef]
- Mehdi, N.; Omer, T. Development of an agent-based model for regional market penetration projections of electric vehicles in the United States. Energy 2016, 96, 215–230. [Google Scholar]
- Yang, X.T.; Yang, Y. New energy vehicle market forecasting based on BASS model: A case study of Shanghai. Oper. Manag. 2015, 10, 133–136. [Google Scholar]
- Yu, H.; Zhang, Y.; Pan, A. Medium and long-term model for charging load of electric private cars. Autom. Power Syst. 2019, 21, 80–87. [Google Scholar]
- Zeng, M.; Zeng, F.; Zhu, X.; Xu, S. Prediction of Electric vehicle ownership in China based on Bass model. China Power 2013, 46, 36–39. [Google Scholar]
Publisher’s Note: MDPI stays neutral with regard to jurisdictional claims in published maps and institutional affiliations. |
© 2021 by the authors. Licensee MDPI, Basel, Switzerland. This article is an open access article distributed under the terms and conditions of the Creative Commons Attribution (CC BY) license (https://creativecommons.org/licenses/by/4.0/).