Abstract
Bringing together the experience and knowledge of engineers allowed building modern footbridges as very slender structures. This in turn has led to structural vibration problems, which is a direct consequence of slender structures. In some footbridges, this problem occurs when natural construction frequencies are close to excitation frequencies. This requires a design methodology, which would ensure user safety and convenience of use of the footbridge in operation. Considering the aforementioned dynamic response, the analysis of the finite element model of a footbridge was conducted focusing on critical acceleration and deformation meanings. The model was based on the footbridge prototype located in Vilnius, Lithuania. Two different loading methods were developed to investigate the dynamic effects caused by people crossing a footbridge. The comparison of experimental and finite element model (FEM) results revealed that the footbridge in operation is within the limit values of comfort requirements in terms of its vibrations.
1. Introduction
Nowadays, the monitoring of bridges and other large scale structures [1] has a significant impact on their operation and maintenance. The use of the monitoring data allows to confirm that the existing bridges can withstand increased load conditions; monitoring experience also allows improving mathematical models and the design of structures of future bridges. Some of the latest research and experiments are presented in the literature [2,3,4,5,6,7].
Since footbridges have been relatively slender structures, they are sensitive to dynamic loading. Road and railway bridges are exposed to high speeds and magnitudes of loading [2], while in the cases of footbridges, load translates slowly (pedestrians) but it can result in a harmonic excitation; in both cases, dynamic excitation can cause relatively high displacements and deformations [3].
Various experiments reveal dynamic performance of the existing bridges at different dynamic loads [4,5]. Monitoring the ambient environment, that is, wind, transportation, pedestrians or a huge equipment nearby, is the most frequent type of bridge monitoring. The fact that people are sensitive to low frequency vibrations is one of the reasons why dynamic experiments are performed on bridges [6,7]. Standards (EN 1990, ISO 10137, EN 1991-2/AC) list the allowed parameters of vibrations (i.e. frequencies and amplitudes) [8,9,10]. The fundamental frequencies of pedestrian bridges are in a frequency range of excitation caused by pedestrians. This is an additional problem that can cause a resonance effect [11,12,13]. There is a high probability of a group of people crossing a bridge causing low frequency vibrations, if their marching coincides with natural frequencies of the bridge; that is extremely dangerous, because this can cause damage to or destruction of the bridge structure [14].
When it comes to the analysis of bridges for both scientific and design purposes, the finite element model (FEM) of a bridge is an effective tool for analyzing dynamic behavior of bridges [15,16].
The main research aim is to obtain dynamic parameters of a footbridge at different static and dynamic loads and to compare the actual performance with FEM. In the first stage experimentally obtained self-vibration mode shapes were compared to theoretically calculated ones by applying finite element analysis The adequacy of experimental results was evaluated, also updating the theoretical FE model. In the second stage of the experiment, dynamical parameters of the bridge under different static and dynamic loading conditions were determined experimentally. In the future, the results presented in the paper can be used for calibration of theoretical approaches for the assessment of the dynamic behavior of footbridges subjected to different types of excitation.
The present work provides the baseline vibration behavior of footbridges, which elucidates where high amplitudes exist and are likely to cause fatigue and other damages. This article analyzes the effect of various excitations (shock, excitation of a moving group of people) on the structure of the pedestrian bridge, as well as the effect of the static load of the bridge on the dynamic properties of the bridge. The obtained data can be used to evaluate the implementation of diagnostic tools of analogous constructions.
2. Materials and Methods
The footbridge being analyzed was built above the western bypass of Vilnius, near V. Maciulevičius street, in 2013. Figure 1 illustrates the general view of the footbridge. Two steel trusses of a rectangular configuration are 48,3 m long and 4,2 m wide. The superstructure is supported by elastomeric bearings on reinforced concrete abutments and corresponds to simply supported structures. The main geometric parameters of the bridge are presented in Figure 2. Structural components of the space truss consist of rectangular (RHS) or square (SHS) hollow sections presented in Table 1. The orthotropic bridge deck is made up of structural steel plates stiffened in both directions and an 8 mm thick polymer wearing surface. The superstructure of the bridge is made of steel grade S355 with a yield strength of fy = 355 MPa and an ultimate strength of fu = 510 MPa.
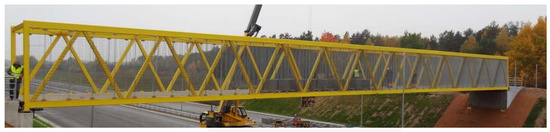
Figure 1.
General view of the footbridge.
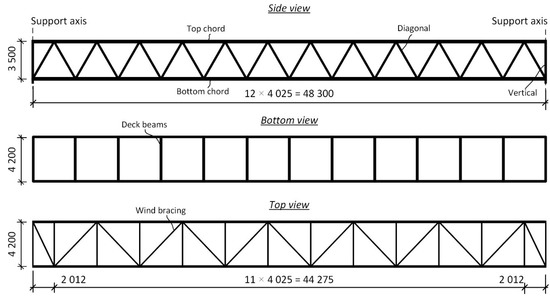
Figure 2.
Main geometric parameters of the truss footbridge.

Table 1.
Cross-sections of the truss footbridge.
Vibrations of the footbridge were determined using “Brüel&Kjær” equipment (Figure 3). Accelerometers 8344 (Figure 3b, measuring range of ± 2.6 g, a sensitivity of 2.5 V/g and 0.176 kg of weight) were arranged on mounting blocks that guaranteed proper orientation and attachment. The detailed description of this equipment (Figure 3a, LAN-XI Data Acquisition Hardware Type 3660 with 3-modules: one 3160-B-042 and two 3050-B-060) was presented in the authors’ works [2]. Two types of measurements were performed in the experimental studies—the OMA (Operational Modal Analysis) was performed in the first case; the measurements were made of the bridge points at different external loads in the second case.
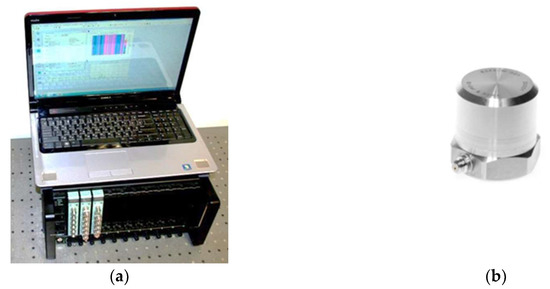
Figure 3.
Vibration measuring equipment: (a) Measuring device “Brüel&Kjær”; (b) Accelerometers 8344.
Fourteen accelerometers were used in the OMA and one of them was used to perform fixed reference measurements. The following conditions were met during accelerations recording—sampling frequency 100 Hz; sampling time 20 s; Spectral density estimation resolution 3200 and frequency line spacing 0.015 Hz. Accordingly, six accelerometers (Figure 4) were used for measurements at different external loads, the following data recording parameters: sampling rate of 50 Hz and a sampling time of 64 s, resolution of the spectral density 3200.
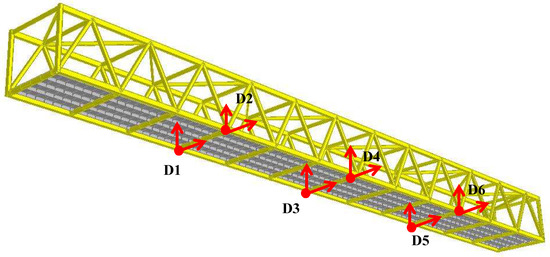
Figure 4.
Arrangement of measuring instruments during dynamic testing.
Six points of the footbridge were measured (D1–D6, Figure 4)—four sensors were positioned at the quarters (D1, D2, D5 and D6) and the other two—at the middle (D3 and D4) of the bridge. Six vertical degrees of freedom and two additional horizontal degrees of freedom in the middle section were measured in total (D3 and D4).
Mounting locations of gauges were chosen at the interim point of the truss system as a dominant length showing that it acts as a beam. The maximum beam displacement during the first, third, fifth and so forth, beam modes was in the middle of the beam type structure. Signals from gauges were processed through Origin 6 and Pulse software. Spectra, distributions and statistical parameters were obtained.
Loading of the footbridge. When it comes to bridge vibrations caused by passing pedestrians, marching intensity was the main parameter of this load. The average intensity of the gait ranged at the interval from 1.6 to 2.4 Hz, with the dominant frequency being 2.0 Hz. The gait of approximately half of pedestrians being analyzed ranged from 1.9 to 2.1 Hz, while that of 95% pedestrians was between 1.65 and 2.35 Hz [17,18].
A rhythmical gait may be considered a dynamic load, periodically loading the bridge at 20 s time intervals; this load can be described by Fourier series and expressed as the following formula [17,18]:
where G is the average weight of a pedestrian; is the pacing frequency; is the phase lag of the i-th harmonic and αi the Fourier coefficient of the i-th harmonic.
Different sources provide expressions of the Fourier series that are not exact but rather fitted to certain factors and measuring results [19,20,21,22,23]. The time function of the dynamic load of pedestrians pacing is reached at the frequency of 2 Hz. Not only the first harmonic that coincides with pacing frequency but also higher frequencies are important.
Usually several pedestrians are crossing the bridge, so two different situations were analyzed:
- -
- A random gait, when the step frequency of passing pedestrians distributes under the probability curve and the phase angle of the first harmonic is random;
- -
- A synchronic gait when pedestrian gait coincides, that is, a uniform frequency and phase.
These conditions result in higher loads on the bridge; the analysis of the first harmonic revealed that a load increases in a nearly linear proportionality to the number of passing pedestrians. Determining the exact moment when the load affects the bridge is rather complicated, therefore when analyzing dynamic performance of bridges, gait is considered to be synchronous, if the number of pedestrians does not exceed 25. When trying to model the highest possible number of realistic conditions of operation, pedestrian density is considered as one person per square meter. Then the load on the bridge can be calculated given the geometrical parameters of the structure [24,25,26,27,28,29].
A cycle between two same events is defined as a gait cycle [30,31,32,33]. A cycle duration is a duration of the entire gait cycle. It should be emphasized that the beginning of a cycle can be identified and executed in any order to ensure that the gait is continuous and smooth. The gait phase when one foot touches the surface is identified as initial, that is, the first event. Therefore, the gait itself can be divided into two main phases: the oscillation phase and the standstill phase.
The first phase takes up 40% of the walking time and is defined as the position of one foot raised from the surface. The second phase takes up 60% and is defined as the contact of the foot with the surface from heel to toe.
There is an emphasis on the existing dual support period in the gait, which is the moment when both feet are on the surface, that is, one foot not yet raised and the other one not yet landed. Such a period occurs twice in the course of the gait: at the beginning and the end of the gait [34,35,36]. This period covers 20% of the total gait duration and is directly dependent on speed, namely, it decreases as the speed increases. [37,38,39,40,41,42,43].
The design comfort requirements for pedestrian bridges according the Eurocode [8,10,44,45,46] establish that structural accelerations under pedestrian action shall be no greater than 0.70 m/s2 for the vertical and 0.20 m/s2 for the horizontal direction, respectively. The maximum design acceleration limits for vibration frequencies are defined by other design requirements [47,48,49]. According to Eurocode [8,10], the control of these accelerations is not necessary, if the first vertical vibration frequency of the footbridge is higher than 5 Hz [50,51].
FEM model of a footbridge. The finite element method is a reliable method for modeling footbridge structures in order to solve a certain number of equations of the bridge structure. The finite element model of a footbridge allows predicting the course of the study and estimating natural frequencies of spectrum and mode shapes. For practical reasons, the linear time domain modal analysis was conducted. This paper presents an evaluation of the structural vibrations induced by walking as a dynamic excitation. The dynamic response of a bridge was determined through the analysis of natural frequencies, displacements, velocities and accelerations. The footbridge model was created using Solidworks software [52]. Dynamic analysis results were presented from a wide range of numerical analyses.
In order to evaluate the results obtained by the proposed method quantitatively and qualitatively, the maximum acceleration values of the bridge construction were measured and compared with the current structural design criteria [53,54] and current design standards [18,55,56] to assess potential spectra of unwanted high vibration levels [57,58,59].
The FEM model makes it possible to realistically estimate the corresponding dynamic behavior of a real bridge [15]. An innovative vehicle-bridge interaction FEM model in which vehicles modeled as a multipoint system interact with the updated bridge model in a way that takes into account the roughness of the road surface [16]. A comparison of two methods is also possible—the analytical kinematic method (KM) and the finite element method (FEM), which allow us to take into account the typical types of damage to the masonry arch barrel and to investigate their effect on the final load-bearing capacity of the structure [60]. Spectral stochastic FEM with local basic functions in the stochastic domain (SL-FEM) is one of the most flexible and accurate stochastic methods [61]. A two-level generalized FEM model with global local enrichments (GFEM gl) is also used to estimate stress intensity coefficients (SIFs) at spot welds subjected to thermomechanical loads [62]. Orthotropic A-FEM depicts all major lesion modes with improved nonlinear coherent zone models (CZMs) that explicitly account for asymmetric tensile and compression reactions [63]. FEM models can be partially replaced by CSPI (Corrugated Steel Pipe Institute) test methods [64].
Natural frequencies. Most constructions (mechanical systems) have been modeled as linear with a relatively small plastic deformation. Dynamic characteristics of the footbridge structure were determined using the classical modal analysis. Natural frequencies and mode shapes were obtained by solving the following equation where damping is disregarded because of its minor influence:
where is the mass matrix, is the stiffness matrix, is the displacement vector.
For each time interval t displacements u were calculating by solving the following equation:
where is the modal shape, is the natural frequency.
Finally, the equation of eigen frequencies can be expressed as:
Natural frequencies and mode shapes can be calculated using the matrix equation:
The scalars that satisfy a matrix equation are called ‘generalized eigenvectors’ and ‘generalized eigenvalues’ of the equation. The special values of satisfying are related to the natural frequencies by .
3. Results
The experiments of bridge dynamics were carried out by loading concrete slabs that simulate crowd load. 36 palettes with concrete blocks were placed in the middle 21.6 m long section of the bridge (Figure 5). Each pallet contained 20 concrete blocks, with the total weight of a pallet with slabs beings 470 kg.
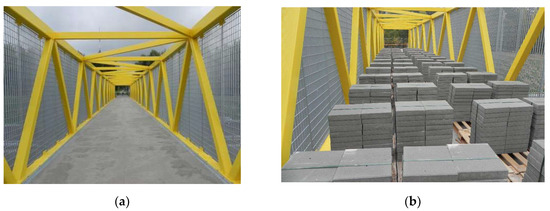
Figure 5.
Loaded concrete slabs imitating crowd loading; (a) View without concrete slabs, (b) View of loaded footbridge.
Two tests of human induced vibrations were conducted on the unloaded bridge: with a group of people crossing the bridge and a group of people rocking the bridge (in order to excite the bridge in dominant directions and measure corresponding accelerations). Results from these tests are presented in Figure 6, Figure 7, Figure 8 and Figure 9. Figure 6 and Figure 7 analyze the accelerations from 0 to 64 s in the section to assess the impact of external influences on the structure and analyze the extended sections from 35 to 40 s to evaluate only the structure response (since the bridge was not excited from 35 s) to the structure.
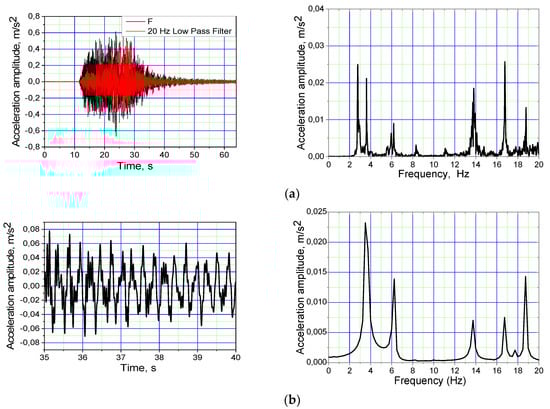
Figure 6.
Acceleration time histories and frequency spectra of acceleration amplitudes: The middle of the bridge (D3 point in Figure 4), a vertical acceleration signal with time and spectral frequency graphs after a group of people crossed the bridge; (a) the interval of 0 to 64; (b) the expanded signal from 35 to 40 s.
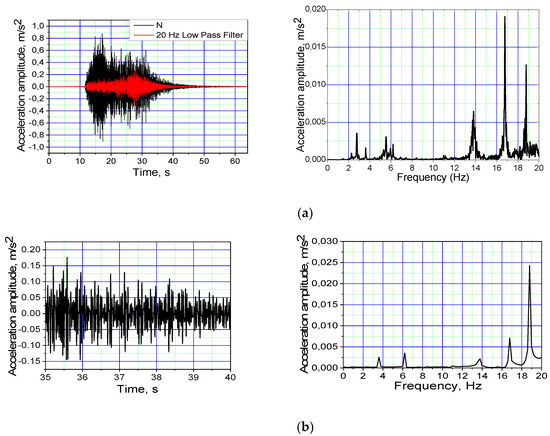
Figure 7.
The middle of the bridge (D3 point in Figure 4) in the horizontal direction of the acceleration signal with time and spectral frequency graphs after a group of people crossed the bridge; (a) the interval of 0 to 64; (b) the expanded signal from 35 to 40 s.
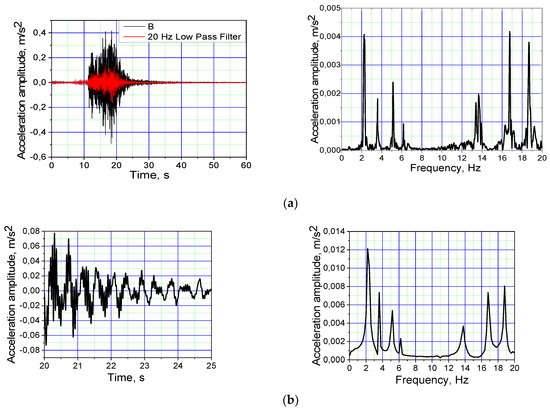
Figure 8.
The middle of the bridge (D3 point in Figure 4) in the vertical direction of the acceleration signal with time and spectral frequency graphs as a group of people runs on the bridge; (a) the interval of 0 to 64; (b) the expanded signal from 35 to 40 s.
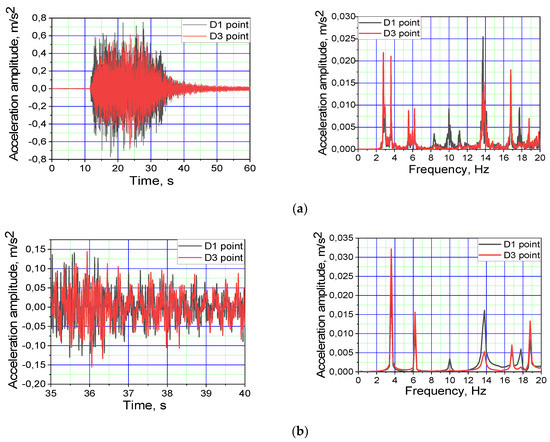
Figure 9.
The significance of the acceleration signal in the horizontal direction using time and spectral frequency graphs for the middle and the quarter of the footbridge (points D3 and D1 in Figure 4) as a group of people swings the bridge; (a) the interval of 0 to 64; (b) the expanded signal from 35 to 40 s.
Figure 6 and Figure 7 present measured vibrations in horizontal and vertical directions in both time and spectral domain caused by a group of people crossing the bridge.
Figure 8 presents the measured vibrations in the horizontal direction in both time and spectral domain caused by a group of people rocking the bridge. Figure 9 present the measured vibrations in the vertical direction in time and spectral domain caused by two people running through the bridge.
Figure 8 and Figure 9 show that the acceleration amplitude in the vertical direction was up to 0.7 m/s2 (about 2/3 of the total magnitude of the acceleration component comprises up to 20 Hz) and the horizontal direction was up to 0.92 m/s2 (about 1/3 of the total acceleration amplitudes to form component 20 Hz). Figure 9 illustrates two 2.3 and 5.2 Hz horizontal modes that run at a vertical excitation.
The value of the velocity amplitude in the vertical direction was 0.75 m/s2 (Figure 9). Figure 9 shows six excitations (3.6, 6.2, 10.0, 13.79, 16.79 and 17.79 Hz) in the vertical direction.
The dynamic parameters of the footbridge, natural frequencies and modal shapes were determined without any loading on the bridge and with the bridge being loaded (36 pallets 470 kg each, see Figure 5b). Resonant frequencies of the bridge were obtained at different load conditions with an impact excitation, conducting the OMA. Figure 10 illustrates spectral responses of the bridge during the impact excitation at certain loads.
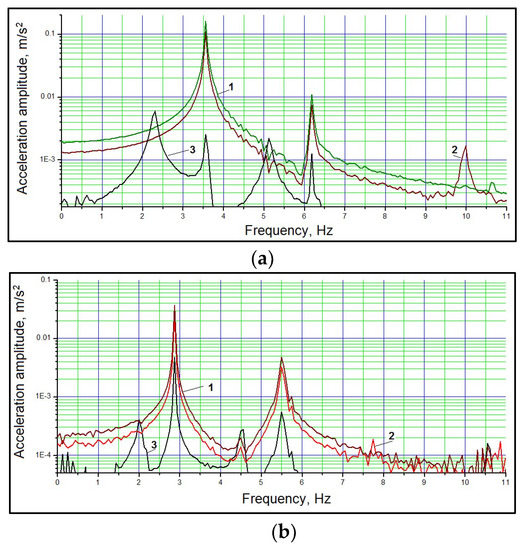
Figure 10.
Frequency spectra of acceleration amplitudes under impact excitation of unloaded (a) and semi-loaded; (b) bridge (1—midpoint, vertical; 2—quarter, vertical; 3—midpoint, horizontal).
Figure 10 shows spectral responses for 3 measured degrees of freedom (1—Midpoint vertical 2—quarter vertical 3—Midpoint, horizontal). Spectral density graphs revealed that the loading of the bridge led to a decrease in natural frequencies of approximately 10% to 20 %.
The graphs presented in Figure 11 were obtained using the measuring software PULSE LabShop.
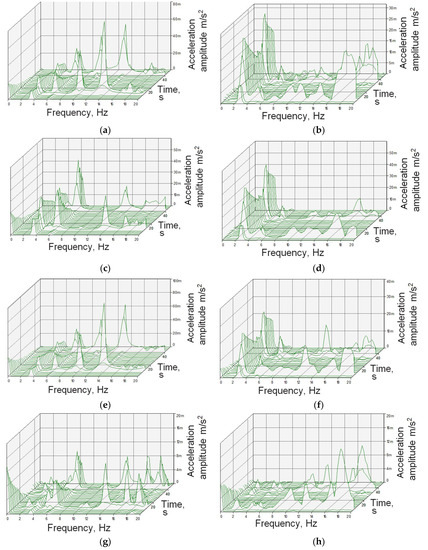
Figure 11.
The Fourier amplitude spectra (without a load and semi-loaded): (a) vertical direction, respectively D1 (without load); (b) vertical direction, respectively D1 (semi-loaded); (c) vertical direction, respectively D3 (without load); (d) vertical direction, respectively D3 (semi-loaded); (e) vertical direction, respectively D5 (without load); (f) vertical direction, respectively D5 (semi-loaded); (g) horizontal direction, respectively D3 (without load); (h) horizontal direction, respectively D3 (semi-loaded).
Results of the OMA are shown below, presenting the acceleration and spectrum analysis of the bridge without loading and semi-loaded (Figure 11). Points D1–D6 are arranged in the vertical direction and points D3 and D4—in the horizontal direction (denotation as in Figure 4).
Figure 11 illustrates the results obtained using the measuring software PULSE LabShop. Figure 11a–f show the dominant mode frequencies in the vertical direction (3.5, 6.25, 10.0, 13.79 Hz—without load; 2.75, 5.50, 7.75 Hz—semi-loaded). Figure 11g,h respectively illustrate that horizontal displacements appear along the vertical line (2.25, 5.00 Hz—without load, 2.00, 4.50 Hz—semi-loaded).
The graphs in Figure 11 were obtained from the experimentation result processing package OMA. This shows that the obtained experimental mode values are consistent with the measurement results processed in OMA.
4. Discussion
The time outlook of the horizontal accelerations of the footbridge was measured at the points of installation of accelerometers (Figure 3). The first and the following horizontal frequencies were obtained through the modal analysis and averaged over time and the dominant frequency was obtained from the records of Singular values of spectral density matrices (Figure 12). Table 2 presents the obtained mode shapes and frequencies.
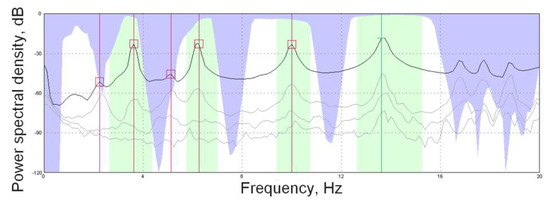
Figure 12.
Detected modes using FDD (Frequency Domain Decomposition)—Operational Modal Analysis (OMA).
Table 2.
Experimental modes and corresponding natural frequencies after the impact excitation of the bridge and the OMA, along with statistical characteristics.
Figure 13 illustrates the first 6 mode shapes of the footbridge after the experimental modal analysis.
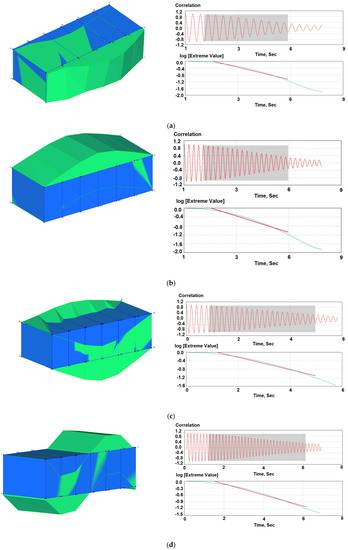
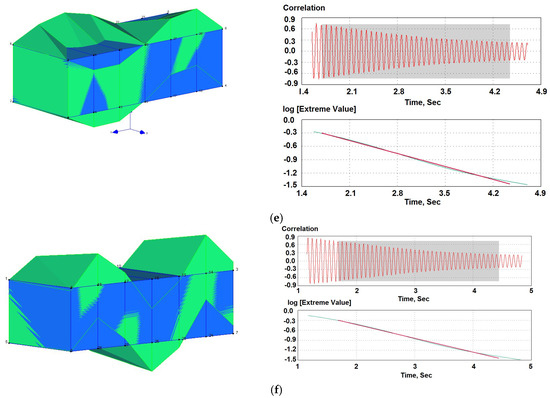
Figure 13.
Results of the footbridge modal analysis: first 6 modes (a–e) and curves used primarily to calculate the damping ratio: a normalized correlation function for each mode and calculation of the damping ratio using the correlation function.
An experimental analysis of the stair module was performed, which revealed linear and angular deformations of structures, considering a relative displacement between significant points of the path. The composite footbridge experimental modal analysis revealed linear and angular displacements of structural parts, illustrating the most loaded construction sites and allowing to make assumptions on the reasons behind dangerous staircase movements.
Figure 13 and Table 2 present the obtained and calculated resonant frequencies and damping coefficients. Statistical parameters (presented in Table 2) were calculated using the following formulae:
- arithmetic mean:where n is the number of the measurement results, xi—the measurement result.
- standard deviation:coefficient of variation
To assess the adequacy of the experimental results, a numerical modal analysis was conducted using FE software package SolidWorks, allowing to obtain the theoretical natural frequencies and the corresponding mode shapes. FE model shown in Figure 14 was considered in a three-dimensional stress state. A solid mesh with tetrahedral 3D solid elements was used for numerical modeling of the bridge. The created FE model totally consisted of about 170,000 nodes and 94,000 elements.
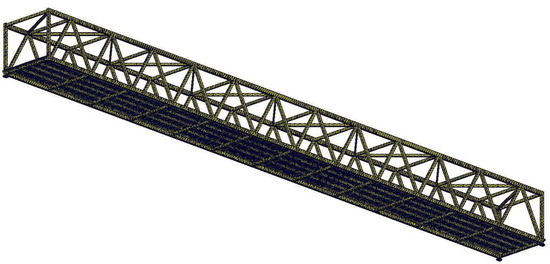
Figure 14.
Finite element (FE) model of the truss footbridge.
Table 3 presents a comparison of numerical values of natural frequencies with those determined experimentally.
Table 3.
Experimental and numerical natural frequencies.
Figure 14 illustrates mode shapes of the footbridge obtained from the FE model (Total Nodes are 169,105; Total Elements 93,557; Maximum Aspect Ratio is 9084.3).
The results (Figure 15 and Table 3) revealed a strong dependence between simulation and experimental results. The existing deflection ranges between 0% and 14%. The comparison of the measured and experimental data of the first three modes shows sufficient accuracy between 0% and 4% proving reliability of the test results. Differences for the 4th and 5th mode came as a result of the non-compliance of the FE model of the footbridge. Walking frequency was the dominant frequency of footbridge vibrations, which confirms that the force of synchronously walking pedestrians dominated over the force of pedestrians synchronized with the structure.
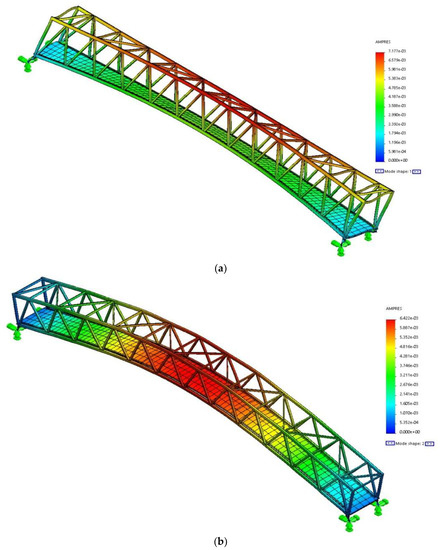
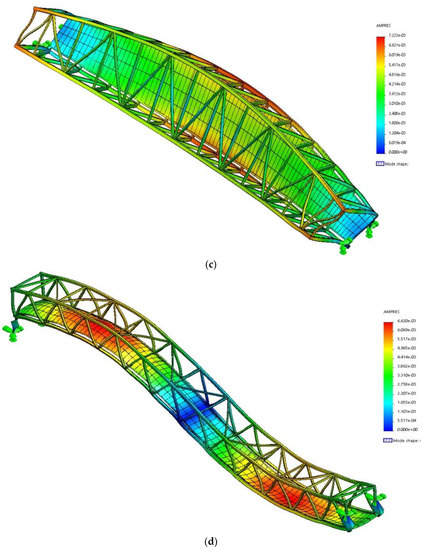
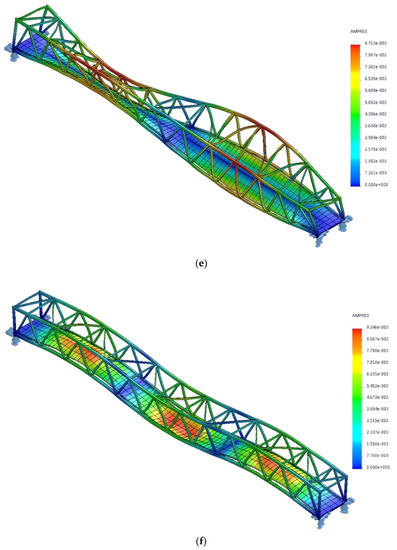
Figure 15.
Mode shapes obtained from the FE model of the bridge (a) 1st bending horizontal; (b) 1st bending vertical; (c) 1st torsional, (d) 2nd bending vertical, (e) 2nd torsional, (f) 3rd bending vertical.
5. Conclusions
The presented study describes dynamic behavior properties under different static loads and the impact on the footbridge. Vibrations caused by pedestrians walking have been known to affect bridges. Extreme vibration values (frequencies, velocities, accelerations) may cause discomfort using the bridge, trigger an undesirable strain and stress of the bridge structure, while the strain and stress can damage the bridge structure.
The FE model developed during this research showed strong dependence on the field experiment results. The FE model not only provided the maximum values of the accelerations of the bridge obtained by natural dynamic tests but also a response over time. Therefore, this model allows checking comfort requirements, such as Eurocode [8,10] and can be used for a more detailed analysis according to the criteria of the ISO 10137 standard [9].
When it comes to pedestrian comfort of the footbridge being analyzed, both experimental and numerical results showed the maximum value of the vertical acceleration to be within the limits of Eurocode [8,10] that is, 0.70 m/s2. The comparative evaluation of the experimental results according to the ISO 10137 threshold revealed that pedestrians should not feel any discomfort caused by structural vibrations of the footbridge. The model developed using commercial FE package allows predicting the structural behavior. The research of the dynamic behavior of full operation of the footbridge, such as a faster response to human movement (jogging or running), are planned in the future.
Author Contributions
Conceptualization, A.K. and D.B.; methodology, J.S. and K.K.; software, D.V.; validation, J.M., D.U. and D.R.; formal analysis, A.K.; investigation, D.B., J.S., J.M.; resources, K.K. and D.V.; data curation, D.U. and D.R; writing—original draft preparation, A.K., D.B. and J.M.; writing—review and editing, K.K. and D.V.; visualization, D.U. and D.R.; supervision, A.K. and J.S.; project administration, J.M.; funding acquisition, J.S., D.U. and D.R. All authors have read and agreed to the published version of the manuscript.
Funding
The second author has received funding from European Social Fund under grant agreement with the Research Council of Lithuania (LMTLT) for the project No 09.3.3-LMT-K-712-01-0145.
Acknowledgments
The second author gratefully acknowledges the financial support from the European Social Fund under the grant agreement with the Research Council of Lithuania (LMTLT) for the project No 09.3.3-LMT-K-712-01-0145.
Conflicts of Interest
The authors declare no conflict of interest.
References
- Ono, K. Structural Health Monitoring of Large Structures Using Acoustic Emission–Case Histories. Appl. Sci. 2019, 9, 4602. [Google Scholar] [CrossRef]
- Kilikevičius, A.; Skeivalas, J.; Kilikevičienė, K.; Matijošius, J. Analysis of Dynamic Parameters of a Railway Bridge. Appl. Sci. 2019, 9, 2545. [Google Scholar] [CrossRef]
- García, D.A.; Rosales, M.B.; Sampaio, R. Dynamic behaviour of a timber footbridge with uncertain material properties under a single deterministic walking load. Struct. Saf. 2019, 77, 10–17. [Google Scholar] [CrossRef]
- Wu, T.; Qiu, W. Dynamic analyses of pile-supported bridges including soil-structure interaction under stochastic ice loads. Soil Dyn. Earthq. Eng. 2020, 128, 105879. [Google Scholar] [CrossRef]
- Yazdani, M.; Jahdngiri, V.; Marefat, M.S. Seismic performance assessment of plain concrete arch bridges under near-field earthquakes using incremental dynamic analysis. Eng. Fail. Anal. 2019, 106, 104170. [Google Scholar] [CrossRef]
- Li, Z.; Zhang, Q.; Fan, F.; Shen, S. A method for calculating uncomfortable rates of people due to vertical floor vibrations using corresponding assessment values based on fuzzy reliability theory. J. Build. Eng. 2020, 28, 101061. [Google Scholar] [CrossRef]
- Casagrande, D.; Giongo, I.; Pederzolli, F.; Franciosi, A.; Piazza, M. Analytical, numerical and experimental assessment of vibration performance in timber floors. Eng. Struct. 2018, 168, 748–758. [Google Scholar] [CrossRef]
- EN 1990:2002+A1. Eurocode-Basis of Structural Design. Available online: https://www.phd.eng.br/wp-content/uploads/2015/12/en.1990.2002.pdf (accessed on 6 April 2020).
- ISO. ISO 10137:2007-Bases for Design of Structures-Serviceability of Buildings and Walkways Against Vibrations. Available online: https://www.iso.org/standard/37070.html (accessed on 20 November 2019).
- EN 1991-2. Eurocode 1: Actions on structures-Part 2: Traffic loads on bridges. Available online: https://www.phd.eng.br/wp-content/uploads/2015/12/en.1991.2.2003.pdf (accessed on 6 April 2020).
- Alocci, C.; Valvo, P.S. Feasibility study of a hybrid FRP-steel cable-stayed pedestrian swing bridge. Eng. Struct. 2019, 189, 359–372. [Google Scholar] [CrossRef]
- Peng, W.; Ding, R.; Xu, W.; Xu, X.; Dai, F.; Taciroglu, E. A forensic analysis of the Florida International University pedestrian bridge collapse using incident video footages. Eng. Struct. 2019, 200, 109732. [Google Scholar] [CrossRef]
- Patra, M.; Perumal, V.; Rao, K.V.K. Modelling the effects of risk factor and time savings on pedestrians’ choice of crossing facilities at signalised intersections. Case Stud. Transp. Policy 2019. [Google Scholar] [CrossRef]
- Frýba, L. A rough assessment of railway bridges for high speed trains. Eng. Struct. 2001, 23, 548–556. [Google Scholar] [CrossRef]
- Papán, D.; Demeterová, K. The Dynamic FEM Models Results Comparison of the New Bridge Over Danube River in Bratislava. Procedia Eng. 2016, 161, 1300–1307. [Google Scholar] [CrossRef][Green Version]
- Nguyen, K.; Freytag, B.; Ralbovsky, M.; Rio, O. Assessment of serviceability limit state of vibrations in the UHPFRC-Wild bridge through an updated FEM using vehicle-bridge interaction. Comput. Struct. 2015, 156, 29–41. [Google Scholar] [CrossRef]
- Živanović, S.; Pavic, A.; Reynolds, P. Vibration serviceability of footbridges under human-induced excitation: A literature review. J. Sound Vib. 2005, 279, 1–74. [Google Scholar] [CrossRef]
- Mercier, H.; Ammann, W.J.; Deischl, F.; Eisenmann, J.; Floegl, I.; Hirsch, G.H.; Klein, G.K.; Lande, G.J.; Mahrenholtz, O.; Natke, H.G.; et al. Vibration Problems in Structures: Practical Guidelines; Euro-International Committee for Concrete, Ed.; CEB bulletin d’information; Comite Euro-International du Beton: Lausanne, Switzerland, 1991; ISBN 978-2-88394-014-7. [Google Scholar]
- Ahmadi, E.; Caprani, C.; Živanović, S.; Heidarpour, A. Assessment of human-structure interaction on a lively lightweight GFRP footbridge. Eng. Struct. 2019, 199, 109687. [Google Scholar] [CrossRef]
- Brownjohn, J.; Bocian, M.; Hester, D. Forced vibration testing of footbridges using calibrated human shaker and wireless sensors. Procedia Eng. 2017, 199, 417–422. [Google Scholar] [CrossRef][Green Version]
- Vladimír, Š.; Michal, P.; Tomáš, P. A Dynamic Analysis of the Cable-Stayed Footbridge in Čelákovice Town. Procedia Eng. 2017, 199, 2877–2882. [Google Scholar] [CrossRef]
- Zäll, E.; Andersson, A.; Ülker-Kaustell, M.; Karoumi, R. An efficient approach for considering the effect of human-structure interaction on footbridges. Procedia Eng. 2017, 199, 2913–2918. [Google Scholar] [CrossRef]
- Liu, X.; Schauer, T.; Goldack, A.; Schlaich, M. Multi-Modal Active Vibration Control of a Lightweight Stress-Ribbon Footbridge Based on Subspace Identification. IFAC-Pap. 2017, 50, 7058–7063. [Google Scholar] [CrossRef]
- Martínez-Rodrigo, M.D.; Moliner, E.; Romero, A.; De Roeck, G.; Galvín, P. Maximum resonance and cancellation phenomena in orthotropic plates traversed by moving loads: Application to railway bridges. Int. J. Mech. Sci. 2020, 169, 105316. [Google Scholar] [CrossRef]
- Yang, Y.; He, R.; Sneed, L.; Saiidi, M.S.; Belarbi, A. Truss modeling of as-built and CFRP-repaired RC bridge columns subjected to combined cyclic lateral loading and torsion. Eng. Struct. 2019, 200, 109664. [Google Scholar] [CrossRef]
- Frøseth, G.T.; Rönnquist, A. Load model of historic traffic for fatigue life estimation of Norwegian railway bridges. Eng. Struct. 2019, 200, 109626. [Google Scholar] [CrossRef]
- Ranjbarian, M.; Mechtcherine, V. Influence of loading parameters in cyclic tension-compression regime on crack-bridging behaviour of PVA microfibres embedded in cement-based matrix. Constr. Build. Mater. 2019, 228, 116760. [Google Scholar] [CrossRef]
- Ti, Z.; Zhang, M.; Li, Y.; Wei, K. Numerical study on the stochastic response of a long-span sea-crossing bridge subjected to extreme nonlinear wave loads. Eng. Struct. 2019, 196, 109287. [Google Scholar] [CrossRef]
- Cao, J.; Ren, S.; Cao, S.; Ge, Y. Physical simulations on wind loading characteristics of streamlined bridge decks under tornado-like vortices. J. Wind Eng. Ind. Aerodyn. 2019, 189, 56–70. [Google Scholar] [CrossRef]
- Kaddar, B.; Aoustin, Y.; Chevallereau, C. Arm swing effects on walking bipedal gaits composed of impact, single and double support phases. Robot. Auton. Syst. 2015, 66, 104–115. [Google Scholar] [CrossRef]
- Silva, F.M.; Machado, J.A.T. Dynamic Efficiency During Bipedal Walking. IFAC Proc. Vol. 1998, 31, 195–200. [Google Scholar] [CrossRef]
- Lv, Y.; Wang, H.; Zhou, Y.; Yoshino, H.; Yonekura, H.; Takaki, R.; Kurihara, G. The influence of ventilation mode and personnel walking behavior on distribution characteristics of indoor particles. Build. Environ. 2019, 149, 582–591. [Google Scholar] [CrossRef]
- Chang, L.; Tu, S.; Ye, W.; Zhang, X. Dynamic simulation of contaminant inleakage produced by human walking into control room. Int. J. Heat Mass Transf. 2017, 113, 1179–1188. [Google Scholar] [CrossRef]
- Li, H.; Thrash, T.; Hölscher, C.; Schinazi, V.R. The effect of crowdedness on human wayfinding and locomotion in a multi-level virtual shopping mall. J. Environ. Psychol. 2019, 65, 101320. [Google Scholar] [CrossRef]
- Schlageter-Tello, A.; Van Hertem, T.; Bokkers, E.A.M.; Viazzi, S.; Bahr, C.; Lokhorst, K. Performance of human observers and an automatic 3-dimensional computer-vision-based locomotion scoring method to detect lameness and hoof lesions in dairy cows. J. Dairy Sci. 2018, 101, 6322–6335. [Google Scholar] [CrossRef]
- Acevedo, M.; Ponce, H. Multibody dynamics for human-like locomotion. In Design and Operation of Human Locomotion Systems; Elsevier: Amsterdam, The Netherlands, 2020; pp. 51–81. ISBN 978-0-12-815659-9. [Google Scholar]
- Huang, W.-N.W.; VanSwearingen, J. An observational treatment-based gait pattern classification method for targeting interventions for older adult males with mobility problems: Validity based on movement control and biomechanical factors. Gait Posture 2019, 71, 192–197. [Google Scholar] [CrossRef]
- Barrio, R.; Lozano, Á.; Rodríguez, M.; Serrano, S. Numerical detection of patterns in CPGs: Gait patterns in insect movement. Commun. Nonlinear Sci. Numer. Simul. 2020, 82, 105047. [Google Scholar] [CrossRef]
- van Andel, S.; Cole, M.H.; Pepping, G.-J. Influence of age and falls incidence on tau guidance of centre of pressure movement during gait initiation. Gait Posture 2019, 70, 104–108. [Google Scholar] [CrossRef]
- Oliveira, N.; Ehrenberg, N.; Cheng, J.; Blochlinger, S.; Barrance, P. Visual kinematic feedback enhances the execution of a novel knee flexion gait pattern in children and adolescents. Gait Posture 2019, 74, 94–101. [Google Scholar] [CrossRef]
- Li, T.; Li, Q.; Liu, T. An actuated dissipative spring-mass walking model: Predicting human-like ground reaction forces and the effects of model parameters. J. Biomech. 2019, 90, 58–64. [Google Scholar] [CrossRef]
- Kumar, P.; Kumar, A.; Racic, V.; Erlicher, S. Modelling vertical human walking forces using self-sustained oscillator. Mech. Syst. Signal Process. 2018, 99, 345–363. [Google Scholar] [CrossRef]
- Hao, M.; Chen, K.; Fu, C. Effects of hip torque during step-to-step transition on center-of-mass dynamics during human walking examined with numerical simulation. J. Biomech. 2019, 90, 33–39. [Google Scholar] [CrossRef]
- Leander, J. Reliability evaluation of the Eurocode model for fatigue assessment of steel bridges. J. Constr. Steel Res. 2018, 141, 1–8. [Google Scholar] [CrossRef]
- Hobbacher, A.F.; Hicks, S.J.; Karpenko, M.; Thole, F.; Uy, B. Transfer of Australasian bridge design to fatigue verification system of Eurocode 3. J. Constr. Steel Res. 2016, 122, 532–542. [Google Scholar] [CrossRef]
- Kuhlmann, U.; Bove, S.; Breunig, S.; Drebenstedt, K. Fatigue design of selected details in steel bridges. Structures 2019, 21, 75–89. [Google Scholar] [CrossRef]
- Matsuoka, K.; Collina, A.; Somaschini, C.; Sogabe, M. Influence of local deck vibrations on the evaluation of the maximum acceleration of a steel-concrete composite bridge for a high-speed railway. Eng. Struct. 2019, 200, 109736. [Google Scholar] [CrossRef]
- Enríquez-Zárate, J.; Silva-Navarro, G.; Abundis-Fong, H.F. Active vibration suppression through positive acceleration feedback on a building-like structure: An experimental study. Mech. Syst. Signal Process. 2016, 72–73, 451–461. [Google Scholar] [CrossRef]
- Guozhen, Y.; Yongqian, L.; Zhi, Y. A novel fiber Bragg grating acceleration sensor for measurement of vibration. Optik 2016, 127, 8874–8882. [Google Scholar] [CrossRef]
- Bruno, L.; Corbetta, A. Uncertainties in crowd dynamic loading of footbridges: A novel multi-scale model of pedestrian traffic. Eng. Struct. 2017, 147, 545–566. [Google Scholar] [CrossRef]
- Gonilha, J.A.; Correia, J.R.; Branco, F.A. Dynamic response under pedestrian load of a GFRP–SFRSCC hybrid footbridge prototype: Experimental tests and numerical simulation. Compos. Struct. 2013, 95, 453–463. [Google Scholar] [CrossRef]
- Ansys manual Theory reference. Available online: http://research.me.udel.edu/~lwang/teaching/MEx81/ansys56manual.pdf (accessed on 20 November 2019).
- Gaspar, C.M.R.; Santos da Silva, J.G.; Costa-Neves, L.F. Multimode vibration control of building steel–concrete composite floors submitted to human rhythmic activities. Comput. Struct. 2016, 165, 107–122. [Google Scholar] [CrossRef]
- Mohamed Fahmy, Y.G.; Sidky, A.N.M. An experimental investigation of composite floor vibration due to human activities. A case study. HBRC J. 2012, 8, 228–238. [Google Scholar] [CrossRef]
- ISO. ISO 2631-2:2003 Mechanical vibration and shock—Evaluation of human exposure to whole-body vibration—Part 2: Vibration in buildings (1 Hz to 80 Hz). Available online: https://www.iso.org/standard/23012.html (accessed on 20 November 2019).
- Griffin, M.J. Handbook of Human Vibration, 1. print. paperback ed.; Academic Press: London, UK, 1996; ISBN 978-0-12-303040-5. [Google Scholar]
- Li, X.F.; Li, H.B.; Zhang, G.K. Damage assessment and blast vibrations controlling considering rock properties of underwater blasting. Int. J. Rock Mech. Min. Sci. 2019, 121, 104045. [Google Scholar] [CrossRef]
- Venkatesh, G.; Kamal, C.; Vennila, P.; Govindaraju, M.; Mary, Y.S.; Armakovic, S.; Armakovic, S.J.; Kaya, S.; Panicker, C.Y. Molecular dynamic simulations, ALIE surface, Fukui functions geometrical, molecular docking and vibrational spectra studies of tetra chloro p and m-xylene. J. Mol. Struct. 2018, 1171, 253–267. [Google Scholar] [CrossRef]
- Pietropolli Charmet, A.; Bizzocchi, L.; Giuliano, B.M.; Caselli, P.; Craig, N.C.; Krasnoshchekov, S.V. Disentangling the IR spectra of 2,3,3,3-tetrafluoropropene using an ab initio description of vibrational polyads by means of canonical Van Vleck perturbation theory. J. Quant. Spectrosc. Radiat. Transf. 2019, 239, 106656. [Google Scholar] [CrossRef]
- Kamiński, T.; Bień, J. Application of Kinematic Method and FEM in Analysis of Ultimate Load Bearing Capacity of Damaged Masonry Arch Bridges. Procedia Eng. 2013, 57, 524–532. [Google Scholar] [CrossRef]
- Pivovarov, D.; Steinmann, P.; Willner, K. Acceleration of the spectral stochastic FEM using POD and element based discrete empirical approximation for a micromechanical model of heterogeneous materials with random geometry. Comput. Methods Appl. Mech. Eng. 2019, 360, 112689. [Google Scholar] [CrossRef]
- Li, H.; O’Hara, P.; Duarte, C.A. A two-scale generalized FEM for the evaluation of stress intensity factors at spot welds subjected to thermomechanical loads. Eng. Fract. Mech. 2019, 213, 21–52. [Google Scholar] [CrossRef]
- Xu, Y.; Jung, J.; Nojavan, S.; Yang, Q. An orthotropic augmented finite element method (A-FEM) for high-fidelity progressive damage analyses of laminated composites. Compos. Struct. 2019, 229, 111416. [Google Scholar] [CrossRef]
- Maleska, T.; Beben, D. Numerical analysis of a soil-steel bridge during backfilling using various shell models. Eng. Struct. 2019, 196, 109358. [Google Scholar] [CrossRef]
© 2020 by the authors. Licensee MDPI, Basel, Switzerland. This article is an open access article distributed under the terms and conditions of the Creative Commons Attribution (CC BY) license (http://creativecommons.org/licenses/by/4.0/).