Article

A New Macro-Model of Gas Flow and Parameter Extraction for a CMOS-MEMS Vacuum Sensor

Department of Mechatronics Engineering, National Changhua University of Education, Changhua 50074, Taiwan
*
Author to whom correspondence should be addressed.
Symmetry 2020, 12(10), 1604; https://doi.org/10.3390/sym12101604
Submission received: 31 August 2020 / Revised: 18 September 2020 / Accepted: 24 September 2020 / Published: 26 September 2020

Abstract

:
When using a MEMS sensor to measure the vacuum of a medium, the transition flow between the viscous flow and molar flow is usually used to describe the gas convection due to the physical principle, which is difficult to study through analysis and simulation. In this study, the description of gas flow under different pressures in a CMOS-MEMS vacuum sensors has been incorporated into a new behavioral ANSYS model. The proposed model was built and the characteristic parameters in the model were obtained based on a CMOS-MEMS thermopile patterned with circular symmetry and an embedded heater as a heat source. It contains a characteristic length to describe the effective distance of heat dissipation to the silicon substrate, and the corresponding transition pressure to describe the symmetrical phenomenon of gas heat conduction. The macro-model is based on the description of the physical characteristics of heat transfer and the characteristic parameters of the CMOS-MEMS vacuum sensor. The characteristic length of 49 μm and the corresponding transition pressure of 2396 mTorr for the thermoelectric-type vacuum sensor were extracted and verified successfully. The results show that the average error for the prediction of vacuum sensing by the macro-model we proposed is about 1.11%. This approach provides more applications for vacuum analysis. It can reduce the complexity of simulation and analysis and provide better simulation effects, including gas conduction mechanisms.

Graphical Abstract

1. Introduction

In the past several decades, numerous vacuum gauges with a drastic reduction of volume have been developed [1,2]. This development was promoted by mature technology in the semiconductor industry and micro-electro-mechanical systems (MEMS) based on the techniques of microfabrication. Among these, CMOS-MEMS, with its batch fabrication techniques, enables vacuum sensing components to be manufactured with increased performance and reliability, combined with the obvious advantages of low consumed power, and reduced physic size, volume, and weight at a relatively low-cost level [2,3]. It is also easily integrated on the same chip with control or processing circuitry by using a commercial semiconductor device process [2,3,4]. Among these studies, thermal MEMS elements are widely used as thermal sensors and heating components, especially thermal-type vacuum sensors (Pirani pressure gauge), which can be used for pressure sensing [5,6,7].
The performance of thermal equipment greatly depends on the heat transfer behavior of the device. In general, the heat dissipation of a thermally conductive vacuum sensor element includes solid conduction and gas conduction, and the radiation loss is relatively small and can be ignored. Especially for thermal microsensors under vacuum, gas conductance can even dominate heat transfer behavior and atmospheric performance [8,9]. The physical mechanism of vacuum measurement is quite complicated. The gas conductance is described by convection when heat is conducted into gas molecules and the gas moves these molecules away from the heat source as a whole. Generally, it is used to describe the heat exchange on the surface due to the movement of gas on the surface. In addition, the response time constant of thermal equipment is also defined as the ratio of heat capacity to thermal conductivity, which also largely depends on its thermal performance.
In 2003, Puigcorbe’s team developed a laboratory-optimized micro-hotplate for the gas sensor in order to characterize its thermal behavior by combining experimental measurements with finite element model simulations. Their work was carried out by combining coupled three-dimensional finite element modelling simulations with electrical, infrared thermography, and interferometric microscopy experimental measurements. The performances predicted by the numerical model are in good accordance with experimental results [10]. In 2014, Mahdavifar et al., reported a microbridge-based thermal conductivity gas sensor which was realized by CMOS-compatible processes and surface micromachining techniques. Modeling results showed that the heat loss from a constant voltage application was observed to be a function of the thermal conductivity of the ambient gas [11]. Past studies have shown that the quantitative characterization of thermal characteristics is very useful and valuable for sensor performance analysis and sensor design [10,11,12].
Thermopile vacuum sensors, based on the Seebeck effect, are fully compatible with CMOS processes, thereby enabling high yield production with minimal post-MEMS processing [1,2,3,4,13,14,15,16,17]. Due to the multi-physics of MEMS devices, it is convenient to use a finite element method for modeling and simulation. In 1999, Folkmer et al., described an approach for simulation and optimization of MEMS with strongly physically-coupled behavior by the use of commercial analysis tools. The combination of the finite element analysis with multi-physics system simulation was successfully demonstrated by the example of a pressure sensor system [18]. However, although the engineering simulation software (e.g., ANSYS, CoventorWare, COMSOL) has coupled field analysis capabilities, both the complexity of the geometrical structure and the feasibility of the thermal parameters occasionally offer incorrect results and conclusions [18,19,20,21,22,23,24].
In 2008, Todd and Xie reported a simple electrothermomechanical lumped element model (ETM-LEM) which was developed by integrating an electrothermal LEM of a heater with a thermomechanical LEM of a bimorph actuator [19]. In 2011, Niessner et al., developed a multi-energy domain-coupled macro-model that allows for the efficient simulation of the dynamic response of electrostatically-controlled RF-MEMS switches on the system level. This constituted a very good result, especially because the models contain only geometric parameters and no problem-specific fit factors are needed to obtain this accuracy [20]. In 2011, Mele’s team reported a microhotplate by a combination of lumped element modeling and measurements conducted on a reference microhotplate. Their work showed that the temperature variation over the heated area is reduced from an initial 13%–4% [21]. In 2017, Chen and Wu reported a macro-model for the dynamic simulation and analysis of a non-uniform microbeam MEMS device subjected to an electrostatic actuation force, which showed that the macro-model can dramatically reduce the computation time while capturing the device behavior faithfully [22]. In 2020, Kaczynski et al., developed an analytical model of the flow resistance for viscous air damping in a MEMS structure comprising a perforated plate in close proximity to a solid plate. The model covers an extended geometry range and the validity compared to previously reported models [23]. Consequently, a macro-model with the quantitative characterization of thermal characteristics and, thus, the reduced computational expense is necessary to enable fast simulation of the gas sensor. A macro-model is a reduced description of the original problem and the validity of the simulated results strongly depends on the respective approach chosen for its derivation. In addition, when the device is constructed and fabricated by the CMOS process, it will dramatically raise the complexity of meshing for multi-layers of thin-film structure which includes the plural thermoelectric elements and high aspect ratio of membrane area [4].
We present a physics-based multiple parameters macro-model that allows for the efficient simulation of the response of the thermal-type vacuum sensor patterned with circular symmetry and an embedded heater as a heat source, which depended on gas conduction on the system-level. In this study, a thermopile with a heater was developed to verify the proposed macro-model, and the characteristic parameters in the model were obtained. The sensor was designed and manufactured using a TSMC 0.35 μm 2P4M standard CMOS semiconductor process and post-MEMS process to measure vacuum pressure. ANSYS finite element analysis software (Ansys, Canonsburg, PA, USA) was used to model and simulate the device. For the mentioned problem in the analysis process, a quasi-static multiphysics simulation model was developed. Through ANSYS simulation software, combined with actual vacuum measurement, the characteristic length could be quickly found. A macro-model of the thermal-type vacuum sensor was built, and the parameters were extracted using discrete mathematical methods. It is effective to import it into ANSYS simulation software for steady-state thermal analysis and simulation. The method established in this research can avoid complicated simulation and data analysis. It provides more powerful capabilities for further applications of various practical development of MEMS devices.
In the following sections, the working principle of the thermal-type sensor for vacuum sensing and its key issue for the characteristic length of the macro-model are described. Our developed CMOS-MEMS thermal-type vacuum sensor for verifying the macro-model is presented. The vacuum measurement system is arranged and introduced. The parameters extraction from the macro-model used in simulation based on the vacuum measuring results is analyzed and discussed.

2. Working Principle of a Thermal-Type Vacuum Sensor

The macro-model of vacuum measurement is governed and described by the heat transfer equation which includes the heat capacity H and the total thermal conductance G. To build the macro-model of gas flow in the vacuum measurement, a CMOS-MEMS thermopile vacuum sensor with a heater was adopted. The working principle of heat conduction for the thermopile is introduced in this section. Then the design and fabrication of the thermopile, and the macro-model based on the consideration of heat conduction by solid are mentioned.

2.1. Working Principle

The total thermal conductance of the thermal-type vacuum sensor and its relation to pressure is described as follows:
G   ( P ) = G s + G g ( P ) + G r
where Gs, Gg, and Gr are the thermal conductance of solid, gas, and radiation, respectively. Equation (2) shows the dependence of temperature rise ΔT on the pressure as follows:
Δ T ( P ) = ϕ 0 G ( P )
where ϕ0 is the heating power of the sensor.
For the vacuum sensor, the heat conduction by the solid thermoelectric element can almost be regarded as a fixed value, and the contribution of radiation is ignored under the room temperature condition. Therefore, the heat conduction of gas in the total thermal conductance plays the role of sensing for different pressures. Figure 1 presents the sensing scheme of the proposed thermoelectric-type vacuum sensor under the three forms of heat transfer.
The mesh-based finite numerical solver is difficult to acquire detailed and accurate solutions of application for MEMS vacuum sensors, and has challenges and limitations. Attempts to simultaneously address both larger air spaces with hundreds of micron-scale and nano-scale MEMS devices have exposed the limitations of conventional grid-based tools [25,26]. Therefore, beyond the conventional methods, we firstly propose and validate our proposed meshless airflow macro-model as an alternative method to overcome these limitations of the mesh-based solver.
The symmetrical phenomenon of gas heat conduction is mainly produced by the movement and collision of molecules. To conduct the theoretical formulations for simulation of the vacuum sensor, the Knudsen number Kn was adopted, which is most widely used to study the design of microfluidics and MEMS devices when the gas flow ranges from continuum to free-molecular. It is defined as follows [27,28,29,30]:
Kn ( P ) = λ ( P ) L
where λ is the mean free path of gas molecules and L is the characteristic length which describes the effective heat conduction distance from the heater on the membrane to the heat sink (i.e., silicon substrate and side walls of the cavity). The mean free path of gas molecules can be calculated as follows [31]:
λ ( P ) = μ P π k B T 2 m
where μ, P, kB, and T are the dynamic viscosity, the pressure, Boltzmann Constant, and the thermodynamic temperature of gas molecules, and m is the gas relative molecular mass.
Generally speaking, when Kn < 0.01, thermal transport is in the continuous regime. During the heat transfer process, the probability of collision between molecules far exceeds the one between gas molecules and the silicon substrate under the thermoelectric element. The thermal properties are close to their bulk values under higher pressure. When Kn > 10, thermal transport is in the free molecule regime. The probability of collision between gas molecules is much lower than the one between gas molecules and the silicon substrate. Thermal properties will be dominated by the boundary scattering under high vacuum. For the Knudsen number Kn between them, it is the working regime for most thermal-type MEMS sensors, while the thermal transport is in the transition regime and thermal properties will deviate from bulk values in some degree due to the boundary effect. In this state, the energy exchange between the gas molecules and the silicon substrate is not sufficient, the gas molecules after the collision do not have the temperature of the silicon substrate and, therefore, there is a temperature difference [29,30,32]. A previous study has pointed out that, for the comparison of four types of micro-hot plates, these micro-hot plates contain four characteristic lengths from 220 nm to 21 µm, which leads a Knudsen number Kn variation from 0.364 down to 0.004 by the results of theoretical and measurement. The thermal convection coefficient 1242 Wm2K−1 was obtained for the largest gap of 21 µm. However, the effective thermal conductivity f the gap of 220 nm is as low as 1.2 × 10⁻³ Wm−1K−1. Both of them indicate that the size effect of gaseous heat transport is significant in such microscale devices. The air gap in MEMS devices usually varies from 100 nm to micrometers, boundary effects will affect heat transfer, and the characteristic length is in the micrometer range. The mean free path for air under 1 atm and room temperature is about 80 nm [32].
In this study, the thermal conductivity kg of gas molecules under atmospheric pressure P can be expressed as follows [33,34,35,36,37,38]:
k g ( P ) = k 0 1 + 2 β Kn ( P )
β = 2 · 9 γ 5 4 γ + 1 · 2 α α
where k0 is the thermal conductivity of gas under atmospheric pressure. α and γ are the adaptation coefficient and the specific heat ratio. kg is one of the main characteristic parameters in this study. From Equations (3)–(6), one can see that the thermal conductivity kg of gas not only varies with the type of gas but is also related to the state parameters of the gas (temperature, pressure, etc.).
According to Equations (3)–(6), the various pressure conditions based on the situations of the vacuum measurement are adopted to calculate the thermal conductivity of the gas in the environment of air molecules and at ambient temperature 298 K. The characteristic length plays an important role to estimate the thermal conductivity kg (P) of gas molecules under different pressures. Therefore, to build the macro-model, the simulation of the thermal-type vacuum sensor was based on the speculation of appropriate characteristic lengths under different vacuum environments at the beginning. The process is shown in Figure 2. These thermal conductivities kg (P) of gas molecules under different pressures were substituted into the simulation software to simulate and analyze the temperature distribution in the structure of the proposed thermal-type vacuum sensor.
For the thermoelectric sensor, during the operation of heating, the working temperature on the hot junction of the thermoelectric element is determined by the heat conduction. Thereby the difference of temperature between the hot and cold junctions is influenced by the different pressures of the gas within the chamber. Based on the Seebeck effect, the output voltage Vth is proportional to the temperature difference ΔT from the thermopile as follows:
V t h = N · Δ S · Δ T
where N denotes the number of pairs of the thermocouples on the thermopile and ΔS refers to the difference between the Seebeck coefficients of the two types of material used in the thermocouple.
In Figure 2, the relationship curves between the pressure and temperature difference ΔT from simulation results were compared with the vacuum measurement results to build the macro-model of gas flow for the thermal-type vacuum sensor. Among them, the relationship curve between the pressure and output voltage Vth from the thermal-type element would be described in the vacuum measurement results. The flow chart of the extraction of characteristic length is illustrated in Figure 2 and described below.

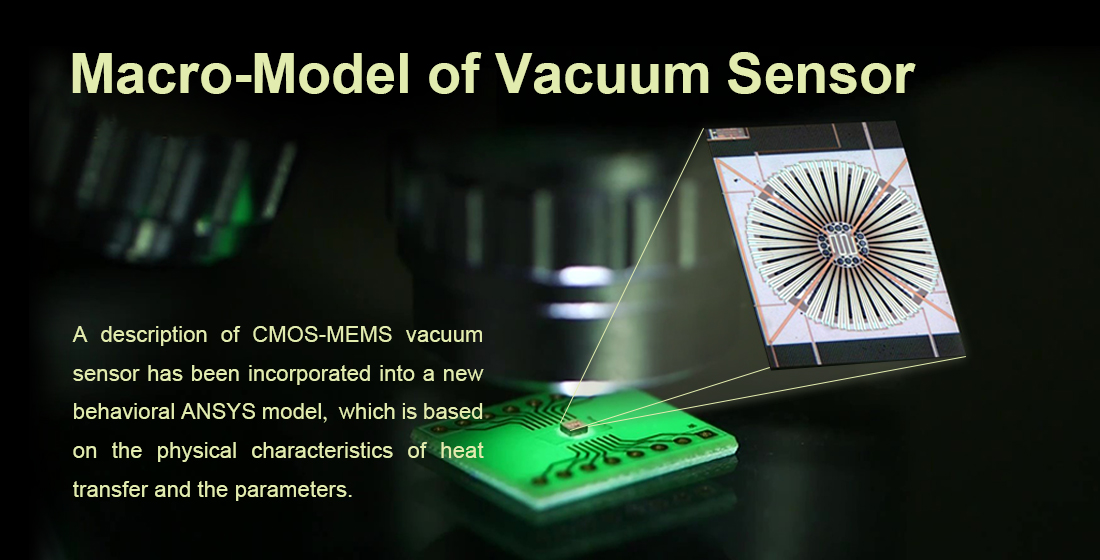
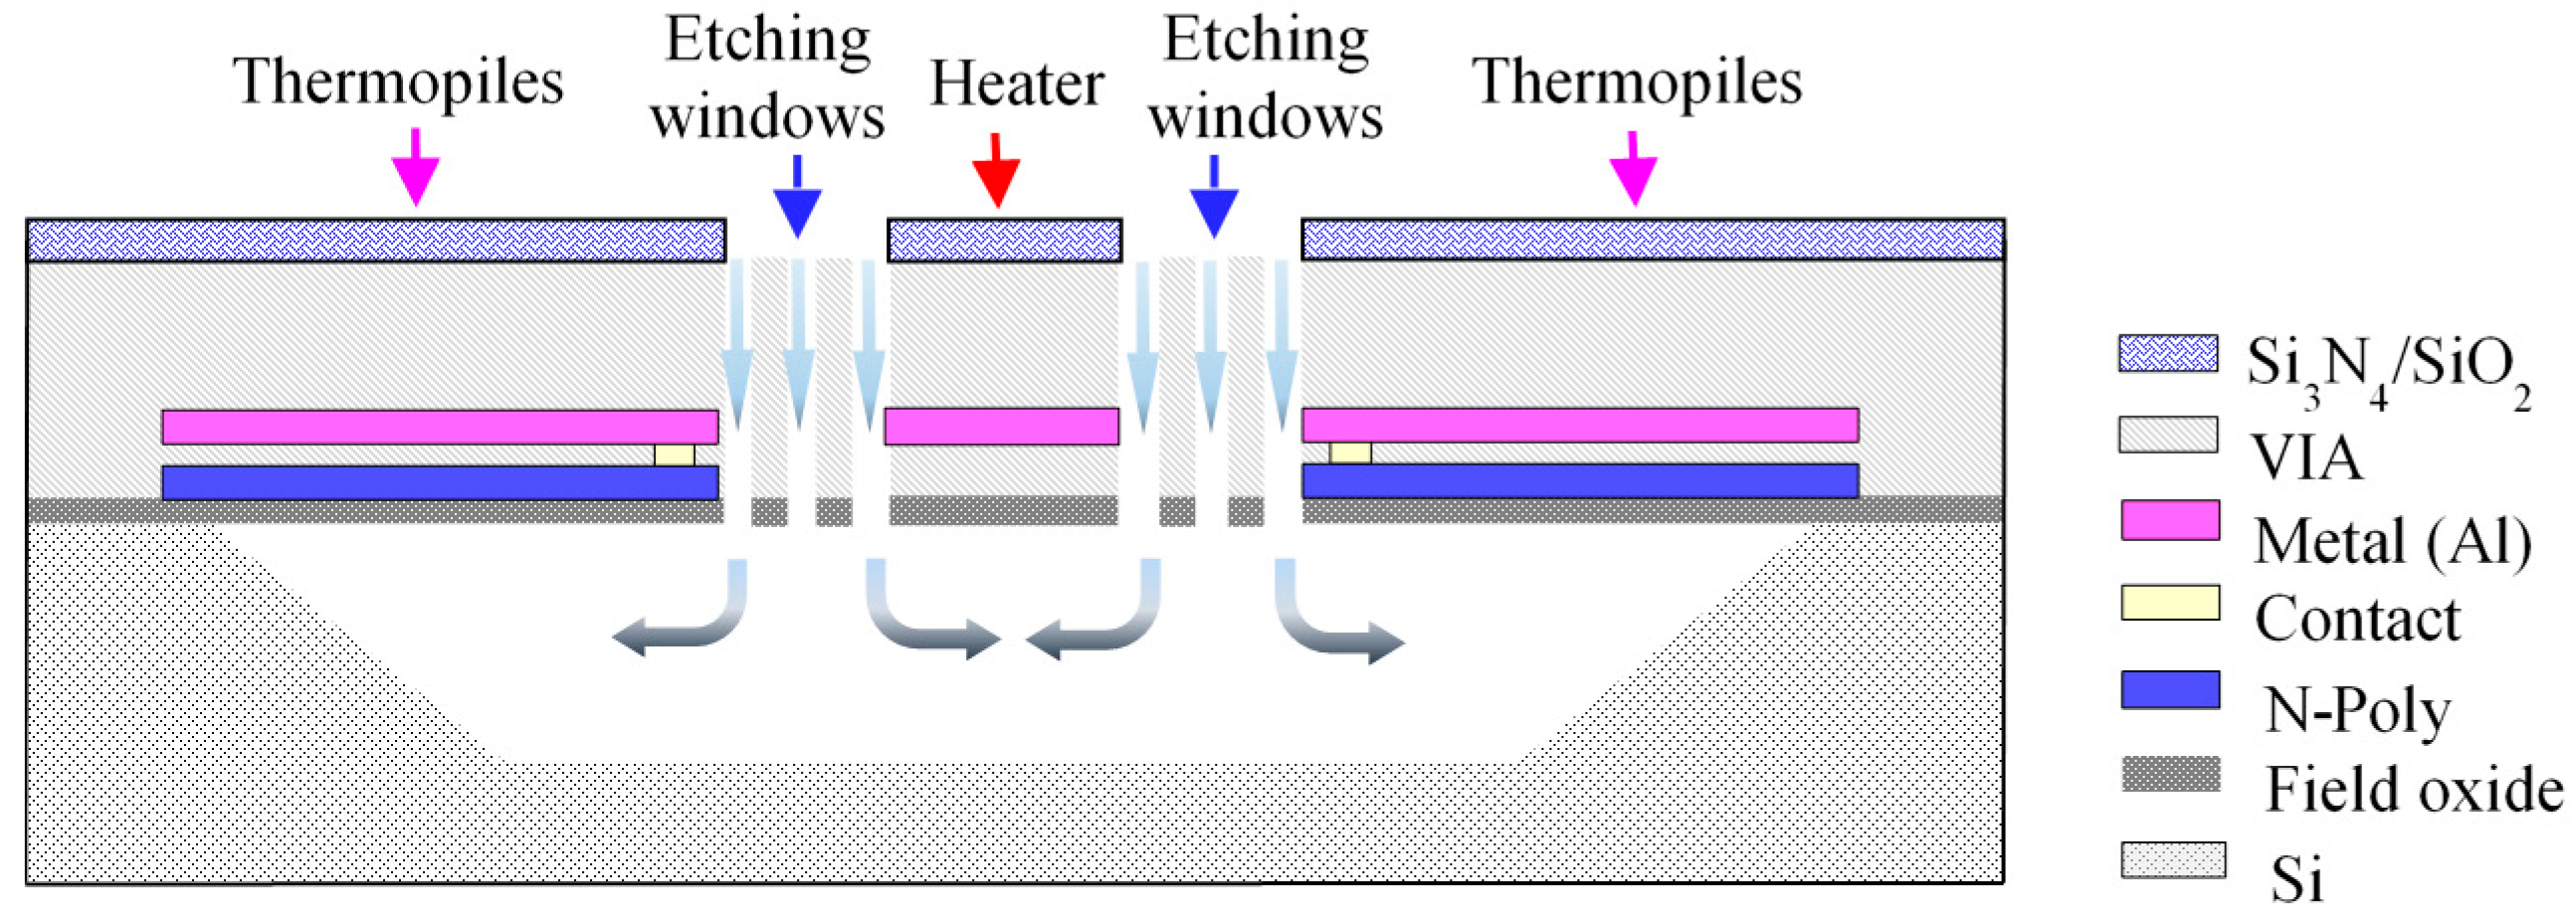
2.2. Proposed Thermal-Type Vacuum Sensor

To verify the validity of the proposed macro-model, a thermoelectric-type vacuum sensor was designed and fabricated using TSMC’s 0.35 μm 2P4M standard CMOS semiconductor process. The size of the thermoelectric-type vacuum sensor is 1.5 mm × 1.5 mm. The thermocouple was built on the top of the field oxide layer which is mainly used as isolation material in semiconductor fabrication and made of aluminum and N-poly material provided by the CMOS process. In order to effectively increase the number of thermocouples, the thermopile formed by connecting 64 pairs of thermocouples is designed into a circular array to enhance the sensitivity of the sensor. The length of the thermopile is 250 μm. The membrane size of the sensor is 680 μm × 680 μm. In terms of structural design, there is a long-etching window with a length of 200 μm and an average width of about 4.8 μm between every two pairs of thermocouples. Moreover, to connect the heater in the center of the membrane and the structure of the thermopile, a micro-link structure is designed around the heater to form an appropriate etching window for suspending the membrane completely. The total length and width of the N-polysilicon heater were 460 μm and 5 μm. A series of post-processes including an isotropic RIE (reactive-ion etching) and wet etching processes were also used to remove the silicon beneath the sensing structures after the CMOS processes. The cross-section of the vacuum sensor is shown in Figure 3. Photography with the correlative dimensions and layout of the chip after fabrication is shown in Figure 4.

2.3. A Simplified Theoretical Description of Heat Transfer for Thermal-Type Vacuum Sensor

In order to enhance the simulation efficiency, simplify the geometric complexity of the thermoelectric element, and improve the aforementioned meshing faults caused by the heavy loading of calculation in meshing, the theoretical description of thermal conductivity for the structure of the thermoelectric elements was simplified. For a single material to conduct heat, the heat transfer phenomenon of energy moving from the hot junction to cold junction can be expressed as follows:
Q s = k s A L s ( T h T c ) = G s ( T h T c )
where Qs is the dissipated thermal power, ks denotes the thermal conductivity of the structure, A is the cross-section area of the membrane through which heat is transferred, Th and Tc are the temperatures of the hot junction and cold junction, and Ls refers to the distance between the hot junction and cold junction. To consider more complex structures of multiple layers to conduct heat, a simplified theoretical description of heat transfer for the thermal-type vacuum sensor is revealed: When the thermoelectric elements are stacked by different materials in the CMOS-MEMS process, the total thermal solid conductance Gs of the elements can be expressed as follows:
G s = i = 1 n k i A i L s , i = 1 ~ n
k e q = k 1 A 1 + k 2 A 2 + + k n A n A 1 + A 2 + + A n
where i is used for the different materials in the thermoelectric element. The equivalent thermal conductivity keq can be applied to the heat transfer simulation as the thermal conductivity of the structure for the macro-model. The materials used in the thermoelectric element in this study include Al, N-poly, SiO2, and Si3N4, and their thermal conductivities are 237, 31.4, 1.25, 16 W/mk, respectively. After calculation, the equivalent thermal conductivity of the heater and thermocouple are about 4 W/mk and 8.2 W/mk, respectively.

3. Vacuum Measurement

3.1. Experiment Setup

To investigate the thermal properties of the proposed CMOS-MEMS thermal-type vacuum sensor, the vacuum measurements were arranged, and the signal acquisition circuits were built as shown in Figure 5. The experimental setup included a vacuum chamber, the proposed CMOS-MEMS thermal-type vacuum sensor, a signal processing circuit with a low-offset chopper amplifier (AD8551, Analog Devices, Norwood, MA, USA), a low-pass filter, a 16-bit ADC (ADS 1115, Texas Instruments, Dallas, TX, USA) and the last, a digital MCU ARM Cortex-M0 (Nuvoton, Hsinchu Science and Industrial Park, Taiwan) to control the procedures of signal reading. CS, SCLK, and Do are digital control and data for ADS1115, which stand for chip select, serial clock, and data out, respectively. The reading of the standard vacuum gauge was used as the reference value in the calibration. Meanwhile, vacuum was applied from 10 mTorr to 760 Torr with a mechanical pump Edwards 12 RV12 (Edwards, Burgess Hill, UK), and measurement was proceeded after reaching a steady state for about 30 min. The heater of the thermal-type vacuum sensor installed within the vacuum chamber was connected to a function generator and the output voltage of the thermal-type vacuum sensor was delivered to the AD8551, where four-wire feedthroughs on the chamber wall were used to meet the requirement of signal connection.

3.2. Signal Acquisition from Thermal-Type Vacuum Sensor

One GPIO of MCU was used to give periodic signals to the heater of the thermal-type vacuum sensor with heating for two seconds and cooling for two seconds to avoid thermal drift effects. The output signal is a weak sinusoidal wave for the detection of temperature changes in the thermoelectric element. After amplification and low-pass filtering, the signal is delivered to LabVIEW software (National Instruments, Austin, TX, USA) as shown in Figure 5. The inverting amplification was adopted with a gain of 547.

4. Building of Macro-Model of Vacuum Measurement and Verification

Gas conductance Gg under pressure P dominates the response of the proposed thermal-type vacuum sensor described as follows [39,40,41,42]:
G g ( P ) = G a A s P ( P t P + P t )
where Ga is a parameter related to the free molecular conductivity of gas under the ambient temperature, which depends on the type of gas and the specific properties of the materials used in the sensor and the configuration in detail. As refers to the floating-membrane area. Pt denotes the transition pressure associated with the transfer of heat, which is the critical pressure used to characterize the mechanisms underlying the thermal conductivity of the gas in the chamber [36].
Under fixed conditions of heating operation for the heater, it shows when P << Pt, the gas thermal conductance is proportional to the pressure P in Equation (11). At the same time, the pressure closes to higher vacuum. The gas thermal conductance will have the smallest value and the heat transfer in the thermoelectric element is dominated by the solid thermal conduction. Therefore, the temperature difference across the thermocouple will be higher. On the other hand, when P >> Pt, the gas thermal conductance can be regarded as a constant, i.e., the pressure of gas does not affect the gas thermal conductance. The gas thermal conductance will have a maximum value, so the temperature difference on the thermocouple under heating operation is lower [5,40]. Therefore, the pressure resolution of the floating-membrane sensor could be determined by the transition pressures [42]. After the vacuum measurement and simulation, the transition pressures were extracted by comparison with each other, where the complete steps are shown in Figure 2 and described as follows.

4.1. Simulation of Temperature under Different Characteristic Lengths

To build the macro-model, the characteristic length and the corresponding transition pressures for the proposed sensor to describe the phenomenon of heat conduction by gas is proceeded to be extracted from the following steps. The following procedures were carried out under the pressure of 10 mTorr~760 Torr and the heating power of 0.414 mW was supplied to the heater on the sensor. For the first step, the relationship between the characteristic length of the sensor and the transition pressure is required to be built. Therefore, five different characteristic lengths were chosen and the gas thermal conductivities for different pressures can be derived according to Equations (3)–(6). The five characteristic lengths were assumed as 40, 50, 100, 200, 300 μm, respectively. Then the gas thermal conductivity kg is derived from these characteristic lengths and substituted into the macro-model of the sensor. After the simulation by ANSYS, then the relationships between temperature difference and pressures at various characteristic lengths were established as shown in Figure 6.
The temperature difference of the thermal vacuum sensor is relatively stable under high pressure and low pressure, while the transition pressure is within the range of obvious changes in the output signal.
Based on Equations (2) and (11), the transition pressure can be derived by the curve fitting of the simulated data for each curve in Figure 6. The transition pressure is defined as the median value between the maximum and minimum of the temperature difference. The transition pressures corresponding to those five different characteristic lengths were calculated as 2876, 2394, 1169, 520, and 366 mTorr from Figure 6, respectively. Therefore, the curve fitting of the relationship between the characteristic length and the transition pressure is built which is shown in Figure 7.

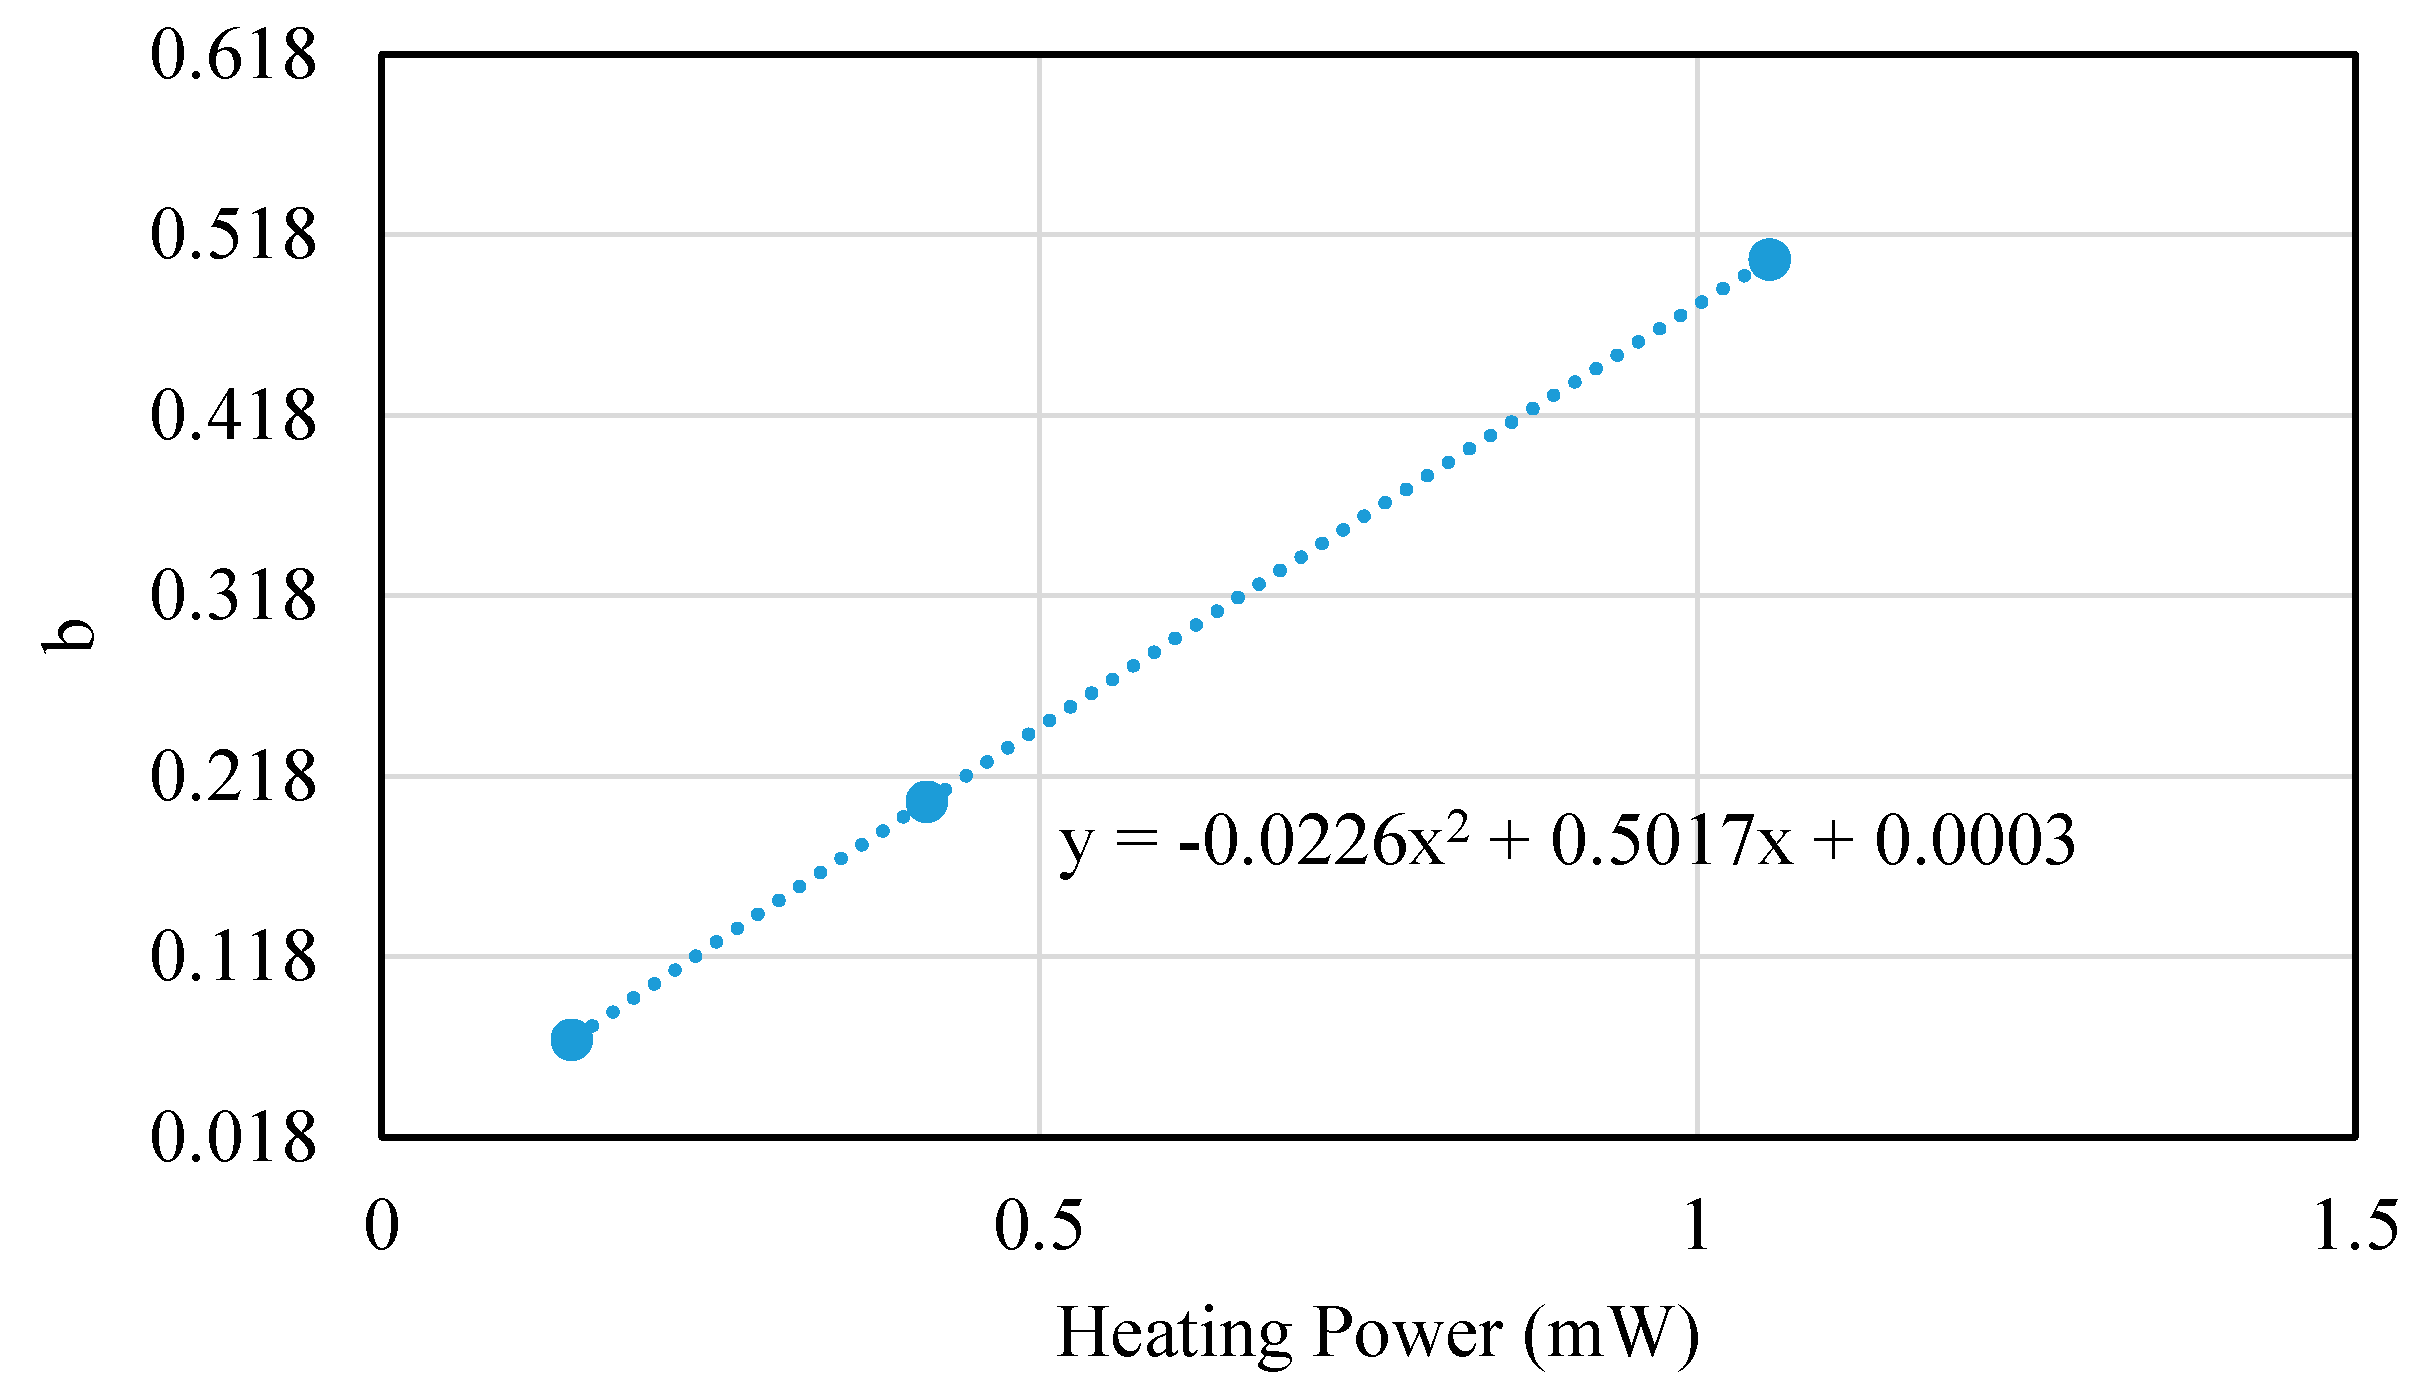
4.2. Parameter Extraction and Verification of Macro-Model

Finally, the vacuum measurement of the proposed sensor is also performed under the same conditions as the above simulation, and the corresponding transition pressure Pt was extracted as 2396 mTorr shown in Figure 8.
According to the equation of curve fitting in Figure 7, the characteristic length of 49 μm for the thermal-type vacuum sensor was extracted by the transition pressure of 2396 mTorr derived from vacuum measurement. The overall procedures of modelling are shown in Figure 2. The results of the simulation of vacuum measurement were also proceeded based on the characteristic length of 49 μm, which is shown in Figure 9. It shows our proposed macro-model is dramatically matched and is suitable for the application and operation of the thermal-type vacuum sensor.

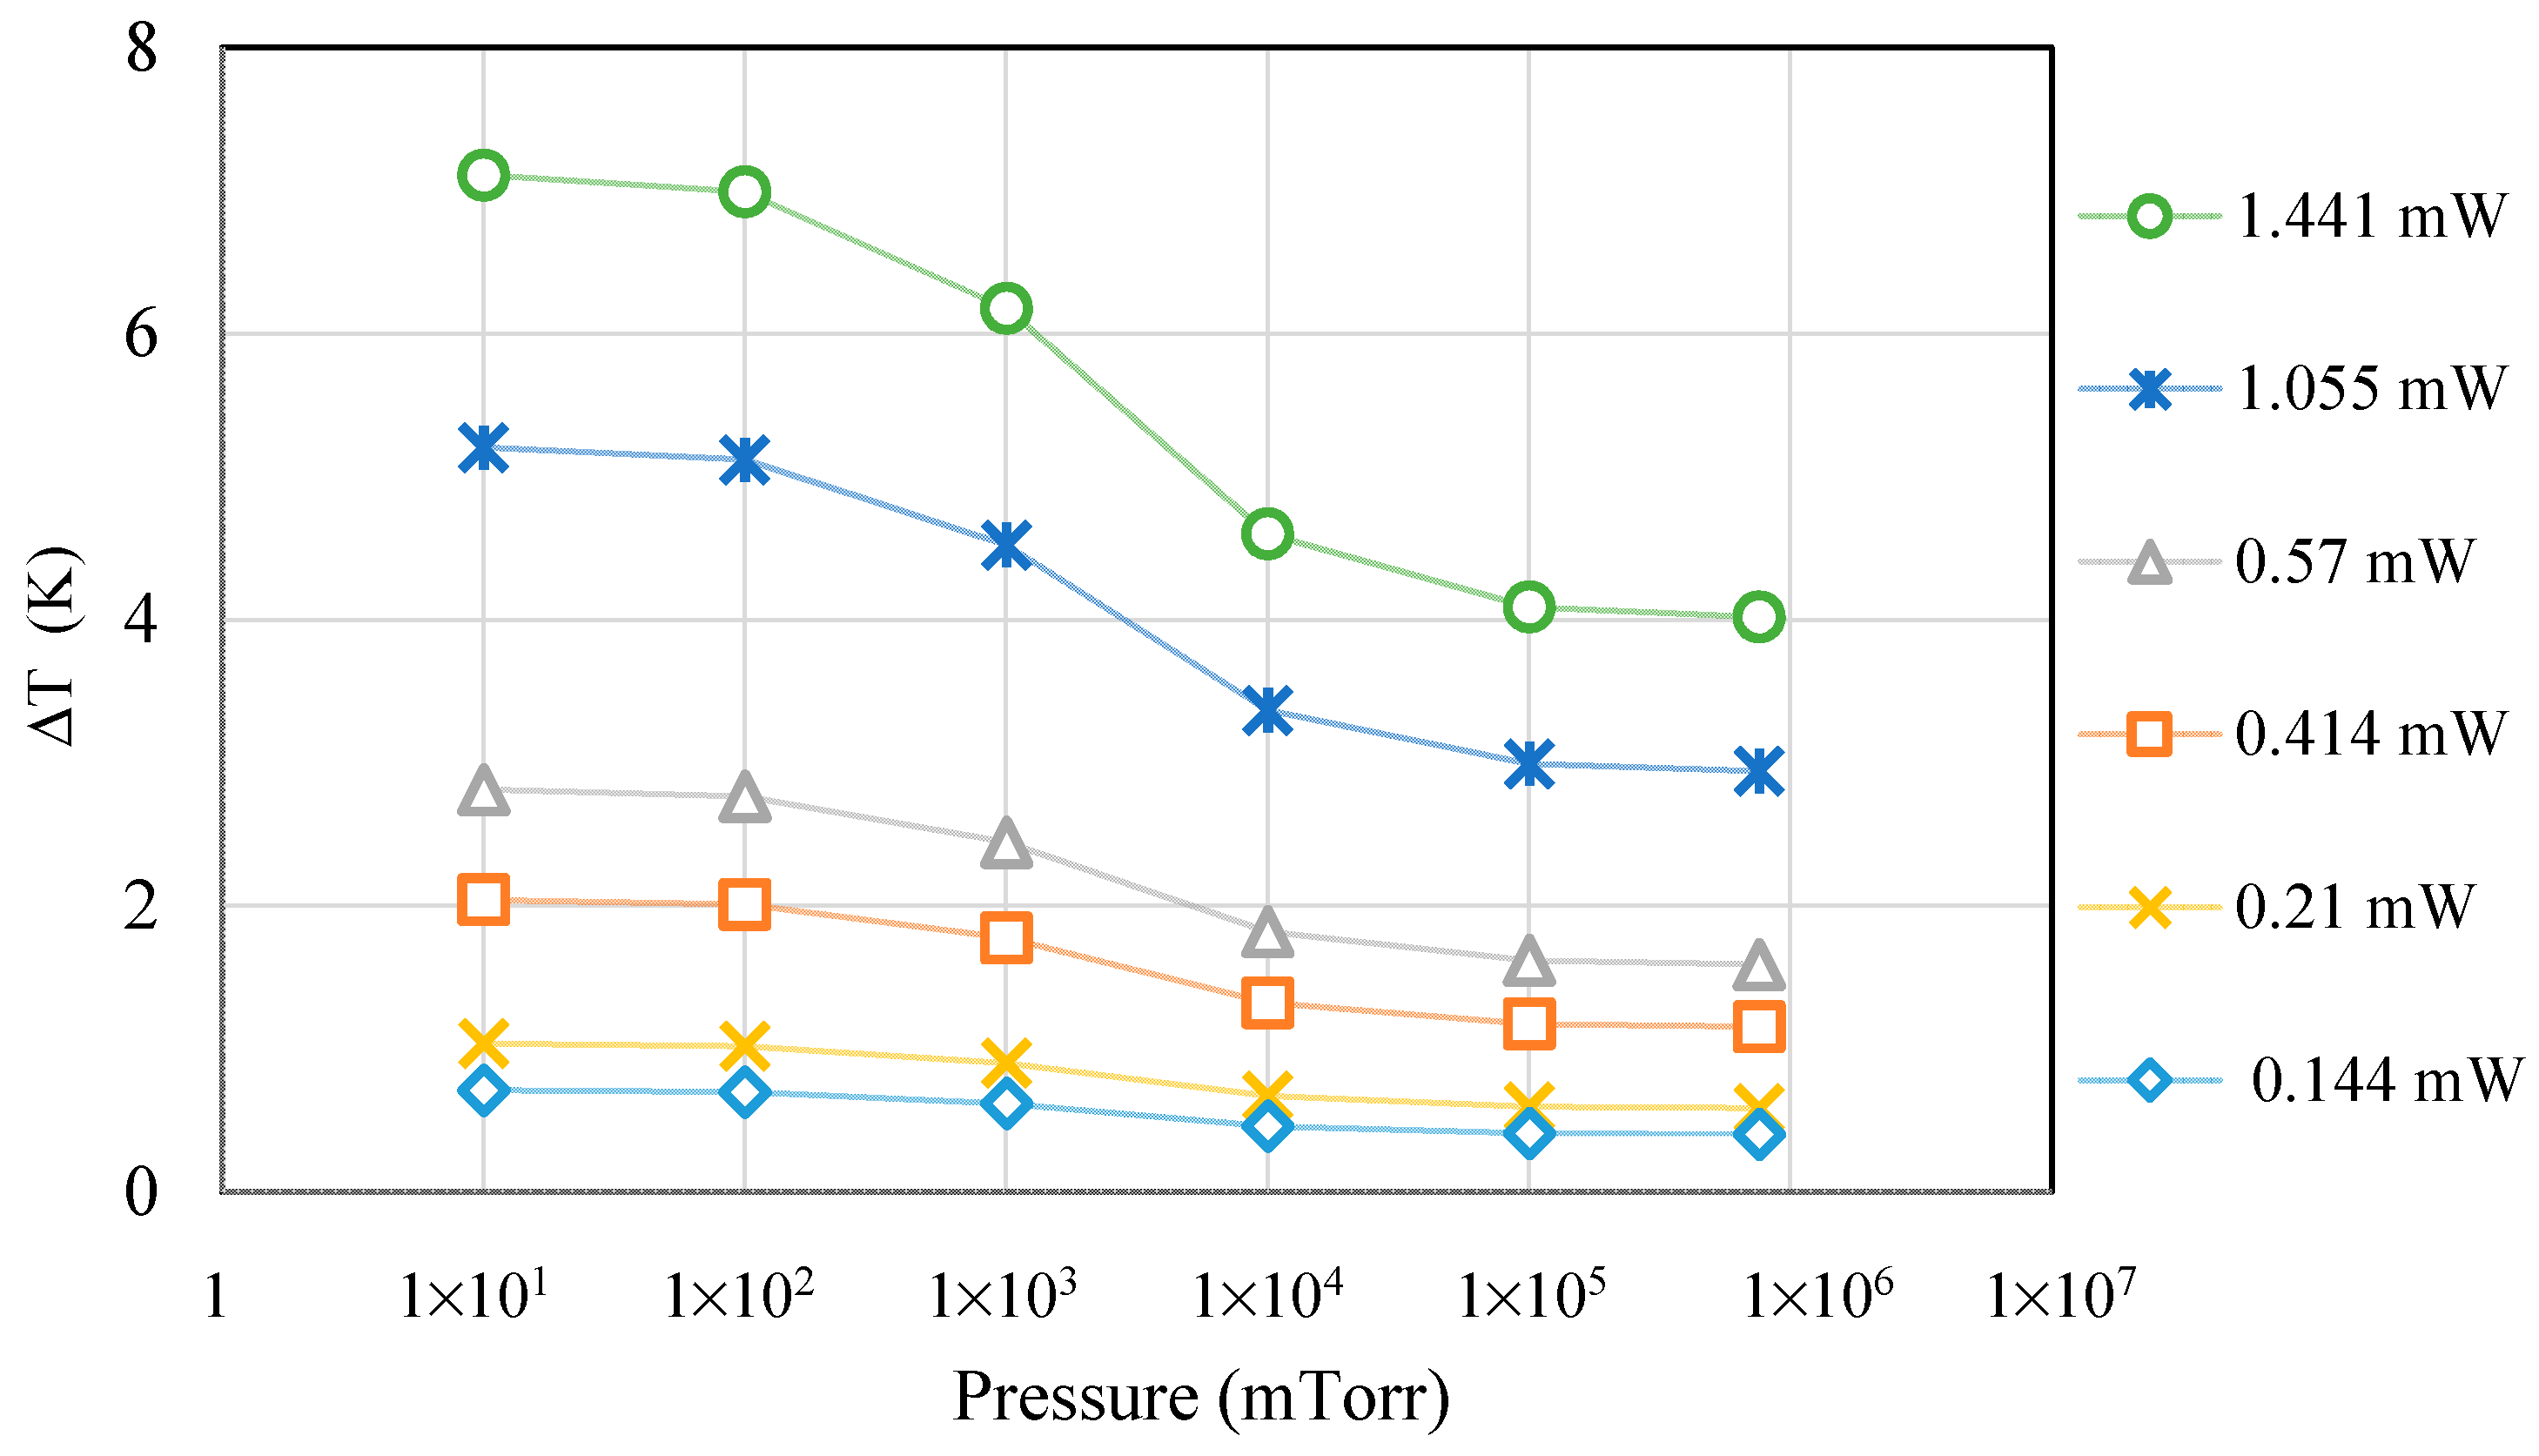
4.3. Validity of Macro-Model for Different Heating Powers

Through the simulation of the temperature rise of the sensor, the relationship between the temperature difference and the actual output voltage signal of the experiment can be obtained. In this way, we can further obtain the actual output voltage signal of the final circuit by simulation. However, under different heating power conditions, the coefficients in the transfer function relationship between the function temperature and the output voltage are different. Therefore, it is expected to improve the macro-model of the thermal sensor for different heating powers, which will be widely used in pressure sensing. For different heating power from 0.144 mW to 1.441 mW, further experiments and simulations are arranged. The simulations was performed under the pressure of 10 mTorr~760 Torr. The flow chart of validity of the macro-model for different heating powers is illustrated in Figure 10 and described below. Before these simulations, using Equations (3)–(6), the gas thermal conductivities were derived by the characteristic length of 49 μm in different vacuum conditions. The simulation results are shown in Figure 11.
Under the same conditions, different heating power by heating for two seconds and cooling for two seconds were still provided to the heater for the measurement. As shown in Figure 12, it is found that the output voltage of the thermal-type vacuum sensor increases as the heating power increases, which is consistent with the simulation results shown in Figure 11.
As shown in Figure 10 with blue arrows, the results of simulation and measurement under different heating powers Ph were compared, and the transfer function relationship between the function temperature and the output voltage is formulated as follows:
V t h = a ( P h ) · Δ T + b ( P h )
where Vth is the output voltage measured by the CMOS-MEMS thermal-type vacuum sensor, and ΔT is the temperature difference simulated by the macro-model of the thermal-type vacuum sensor. a, b are the slope and intercept of the linear equation, respectively, and they are functions of heating power as shown in Equation (12). Then according to Equation (12), the results of simulation and measurement with heating power of 0.144 mW, 0.414 mW, and 1.055 mW were compared to establish the fitting equations between a, b and the heating power, which are shown in Figure 13 and Figure 14, respectively. Based on these operations, a macro-model was established through simulation of the thermal-type vacuum sensor, which can be used to predict the measurement results of different heating powers. The flow of these procedures is shown in Figure 10 with blue arrows.
In the flow of step with red arrows in Figure 10, based on the relational expressions in Figure 13 and Figure 14, the heating power of 0.21 mW, 0.57 mW, and 1.441 mW were adopted to derive the corresponding values of a and b, respectively. At the same time, the simulated temperature difference ΔT from the macro-model under the same conditions was also substituted into Equation (12) to calculate the predicted output voltage Vc. Furthermore, the measured values Vth from the output of the circuit are compared to verify the effectiveness of the macro-model, where the steps are shown with the green arrows in Figure 10. The results are summarized as shown in Table 1, Table 2 and Table 3.
It can be seen that, under different heating power and atmospheric pressure, the comparison of macro-model simulation and the measurement result of the thermal vacuum sensor shows that when the heating power is 0.21 mW and the pressure is 10 Torr, there is the smallest error, which is close to 0.13%. When the heating power is 1.441 mW and the pressure is 10 Torr, the largest error occurs, which is close to 2.45%. Summarizing the analysis under all conditions, the average error value is 1.11%. In related research [41], the characteristic length of the thermal microsensor with V-groove cavity was estimated by using ray tracing software to perform 3-D simulation of heat flow. According to simulation and measurement results, the reported error is 3.07%, and it has not been applied to various heating conditions. These results prove that our proposed macro-model shows excellent feasibility and reliability for different air pressure and heating power conditions.
At the same time, we observe that at 10 mTorr, the heating power increases from 0.21 mW to 1.441 mW, which is about 6.862 times, and the temperature of the sensing area increases from 1.036 K to 7.106 K, which is about 6.859 times. However, when the heating power is increased, the error between simulation and measurement gradually increases. Since the higher the vacuum, the greater the effect of solid heat transfer, thus, the error may be caused by the simplified solid conductance model.
In summary, through the proposed macro-model of gas flow and the method of extracting characteristic length, it is effective to use the simulation software for predicting the measuring results of thermal-type vacuum sensors and improving the timeliness of design and experiment.

5. Conclusions

In this study, a novel macro-model of gas flow for the thermal-type vacuum sensor was established to increase the efficiency and accuracy of simulation analysis. Through theoretical analysis and the model establishment, ANSYS software was used for the simulation. The thermal-type vacuum sensor was designed and manufactured using TSMC 0.35 μm 2P4M CMOS process and MEMS post-process, and an equivalent model was established for the comparison and analysis of simulation and measurement. Under the condition of the heating power 0.414 mW for the heater in the thermoelectric element, the characteristic length of 49 μm for the thermal-type vacuum sensor is obtained through the comparison results between simulation and measurement in this study. According to this characteristic length, the vacuum sensing simulation and measurement under the different heating powers were performed, and it is found that the simulation and measurement results are very consistent. Moreover, the fitting equations through the comparisons between simulation and measurement results were established, which can be used as a reference for the design parameters of vacuum sensor development. The macro-model of gas flow constructed in this research can effectively improve the performance of the simulation software and extend to other related research and applications.

Author Contributions

Conceptualization: S.-J.C.; data curation: S.-J.C.; formal analysis: S.-J.C.; investigation: Y.-C.W.; project administration: S.-J.C.; visualization: Y.-C.W.; writing—original draft: Y.-C.W.; writing—review and editing: S.-J.C. All authors have read and agreed to the published version of the manuscript.

Funding

The authors would like to thank the Ministry of Science and Technology of the Republic of China, Taiwan, for financially supporting this research under contract MOST 108-2221-E-018-006.

Acknowledgments

The authors would also like to thank the Chip Implementation Center of Taiwan for project support and chip implementation.

Conflicts of Interest

The authors declare no conflict of interest.

References

  1. Wilfert, S.; Edelmann, C. Miniaturized vacuum gauges. J. Vac. Sci. Technol. A 2004, 22, 309–320. [Google Scholar] [CrossRef]
  2. Chen, S.J.; Wu, Y.C. Active thermoelectric vacuum sensor based on frequency modulation. Micromachines 2020, 11, 15. [Google Scholar] [CrossRef] [PubMed] [Green Version]
  3. Chen, S.J.; Chen, B. Research on a CMOS-MEMS infrared sensor with reduced graphene oxide. Sensors 2020, 20, 4007. [Google Scholar] [CrossRef] [PubMed]
  4. Ma, B.; Liang, P.Z.; Chen, S.J.; Cheng, Z.X. Coupled-field analysis of a silicon-thermopile-based vacuum sensor. Nanotechnol. Precis. Eng. 2008, 6, 336–342. [Google Scholar]
  5. Weng, P.K.; Shie, J.S. Micro-Pirani vacuum gauge. Rev. Sci. Instrum. 1994, 65, 492–499. [Google Scholar] [CrossRef]
  6. Shie, J.S.; Chou, B.C.; Chen, Y.M. High performance Pirani vacuum gauge. J. Vac. Sci. Technol. A 1995, 13, 2972–2979. [Google Scholar] [CrossRef] [Green Version]
  7. Chen, C.N.; Chen, C.C. Thermal Type Vacuum Gauge. U.S. Patent App. 15/070,276, 21 September 2017. [Google Scholar]
  8. Chen, C.N.; Huang, W.C. A CMOS-MEMS thermopile with low thermal conductance and a near-perfect emissivity in the 8–14-μm wavelength range. IEEE Electron Device Lett. 2010, 32, 96–98. [Google Scholar] [CrossRef]
  9. Wang, X.; Liu, C.; Zhang, Z.; Liu, S.; Luo, X. A micro-machined Pirani gauge for vacuum measurement of ultra-small sized vacuum packaging. Sens. Actuator A Phys. 2010, 161, 108–113. [Google Scholar] [CrossRef]
  10. Puigcorbe, J.; Vogel, D.; Michel, B.; Vila, A.; Gracia, I.; Cane, C.; Morante, J. Thermal and mechanical analysis of micromachined gas sensors. J. Micromech. Microeng. 2003, 13, 548. [Google Scholar] [CrossRef]
  11. Mahdavifar, A.; Aguilar, R.; Peng, Z.; Hesketh, P.J.; Findlay, M.; Stetter, J.R.; Hunter, G.W. Simulation and fabrication of an ultra-low power miniature microbridge thermal conductivity gas sensor. J. Electrochem. Soc. 2014, 161, B55. [Google Scholar] [CrossRef]
  12. He, F.; Huang, Q.-A.; Qin, M. A silicon directly bonded capacitive absolute pressure sensor. Sens. Actuator A Phys. 2007, 135, 507–514. [Google Scholar] [CrossRef]
  13. Shen, C.H.; Chen, S.J.; Guo, Y.T. A novel infrared temperature measurement with dual mode modulation of thermopile sensor. Sensors 2019, 19, 336. [Google Scholar] [CrossRef] [PubMed] [Green Version]
  14. Graf, A.; Arndt, M.; Sauer, M.; Gerlach, G. Review of micromachined thermopiles for infrared detection. Meas. Sci. Technol. 2007, 18, R59. [Google Scholar] [CrossRef]
  15. Van Herwaarden, A.; Sarro, P.; Meijer, H. Integrated vacuum sensor. Sens. Actuators 1985, 8, 187–196. [Google Scholar] [CrossRef]
  16. Van Herwaarden, A.; Sarro, P. Performance of integrated thermopile vacuum sensors. J. Phys. E 1988, 21, 1162. [Google Scholar] [CrossRef]
  17. Van Herwaarden, A.; Van Duyn, D.; Van Oudheusden, B.; Sarro, P. Integrated thermopile sensors. Sens. Actuator A Phys. 1990, 22, 621–630. [Google Scholar] [CrossRef]
  18. Folkmer, B.; Siber, A.; Bley, W.G.; Sandmaier, H.; Lang, W. Improved simulation for strongly coupled micro-electro-mechanical systems: Resonant vacuum sensor optimization. Sens. Actuator A Phys. 1999, 74, 190–192. [Google Scholar] [CrossRef]
  19. Todd, S.T.; Xie, H. An electrothermomechanical lumped element model of an electrothermal bimorph actuator. J. Microelectromech. Syst. 2008, 17, 213–225. [Google Scholar] [CrossRef]
  20. Niessner, M.; Schrag, G.; Iannacci, J.; Wachutka, G. Macromodel-based simulation and measurement of the dynamic pull-in of viscously damped RF-MEMS switches. Sens. Actuator A Phys. 2011, 172, 269–279. [Google Scholar] [CrossRef]
  21. Mele, L.; Rossi, T.; Riccio, M.; Iervolino, E.; Santagata, F.; Irace, A.; Breglio, G.; Creemer, J.; Sarro, P. Electro-thermal analysis of MEMS microhotplates for the optimization of temperature uniformity. Procedia Manuf. 2011, 25, 387–390. [Google Scholar] [CrossRef] [Green Version]
  22. Chen, X.; Wu, Z. Review on macromodels of MEMS sensors and actuators. Microsyst. Technol. 2017, 23, 4319–4332. [Google Scholar] [CrossRef]
  23. Kaczynski, J.; Ranacher, C.; Fleury, C. Computationally efficient model for viscous damping in perforated MEMS structures. Sens. Actuator A Phys. 2020, 314, 112201. [Google Scholar] [CrossRef]
  24. Shah, M.A.; Lee, D.-G.; Hur, S. Design and characteristic analysis of a MEMS piezo-driven recirculating inkjet printhead using lumped element modeling. Micromachines 2019, 10, 757. [Google Scholar] [CrossRef] [PubMed] [Green Version]
  25. Mishra, S.; Balasubramaniam, R.; Chandra, S. Finite element analysis and experimental validation of suppression of span in optical MEMS pressure sensors. Microsyst. Technol. 2019, 25, 3691–3701. [Google Scholar] [CrossRef]
  26. To, A.C.; Liu, W.K.; Olson, G.B.; Belytschko, T.; Chen, W.; Shephard, M.S.; Chung, Y.W.; Ghanem, R.; Voorhees, P.W.; Seidman, D.N.; et al. Materials integrity in microsystems: A framework for a petascale predictive-science-based multiscale modeling and simulation system. Comput. Mech. 2008, 42, 485–510. [Google Scholar] [CrossRef]
  27. Devienne, F. Low density heat transfer. In Advances in Heat Transfer; Elsevier: Amsterdam, The Netherlands, 1965; Volume 2, pp. 271–356. [Google Scholar]
  28. Roy, S.; Raju, R.; Chuang, H.F.; Cruden, B.A.; Meyyappan, M. Modeling gas flow through microchannels and nanopores. J. Appl. Phys. 2003, 93, 4870–4879. [Google Scholar] [CrossRef]
  29. Barber, R.; Emerson, D. The influence of Knudsen number on the hydrodynamic development length within parallel plate micro-channels. WIT Trans. Eng. Sci. 2002, 36, 12. [Google Scholar]
  30. Springer, G.S. Heat transfer in rarefied gases. In Advances in Heat Transfer; Elsevier: Amsterdam, The Netherlands, 1971; Volume 7, pp. 163–218. [Google Scholar]
  31. Roth, A. Vacuum Technology, 3rd ed.; Elsevier: Amsterdam, The Netherlands, 1990; pp. 17–61. [Google Scholar]
  32. Huang, Z.; Wang, J.; Bai, S.; Guan, J.; Zhang, F.; Tang, Z. Size Effect of Heat Transport in Microscale Gas Gap. IEEE Trans. Ind. Electron. 2017, 64, 7387–7391. [Google Scholar] [CrossRef]
  33. Beskok, A.; Karniadakis, G.E. Report: A model for flows in channels, pipes, and ducts at micro and nano scales. Microscale Thermophys. Eng. 1999, 3, 43–77. [Google Scholar]
  34. Dongari, N.; Agrawal, A. Modeling of Navier–Stokes equations for high Knudsen number gas flows. Int. J. Heat Mass Transf. 2012, 55, 4352–4358. [Google Scholar] [CrossRef]
  35. Zhang, Q.; Su, Y.; Wang, W.; Lu, M.; Sheng, G. Gas transport behaviors in shale nanopores based on multiple mechanisms and macroscale modeling. Int. J. Heat Mass Transf. 2018, 125, 845–857. [Google Scholar] [CrossRef]
  36. Harley, J.C.; Huang, Y.; Bau, H.H.; Zemel, J.N. Gas Flow in Micr-Channels. Gas 1994, 9, 2–1994. [Google Scholar]
  37. Reichenauer, G.; Heinemann, U.; Ebert, H.-P. Relationship between pore size and the gas pressure dependence of the gaseous thermal conductivity. Colloids Surf. A Physicochem. Eng. Asp. 2007, 300, 204–210. [Google Scholar] [CrossRef]
  38. Han, M.; Liang, X.G.; Tang, Z. Size effect on heat transfer in micro gas sensors. Sens. Actuator A Phys. 2005, 120, 397–402. [Google Scholar] [CrossRef]
  39. Chen, C.N. Fully quantitative characterization of CMOS–MEMS polysilicon/titanium thermopile infrared sensors. Sens. Actuators B Chem. 2012, 161, 892–900. [Google Scholar] [CrossRef]
  40. Chou, B.C.; Chen, Y.M.; OuYang, M.; Shie, J.-S. A sensitive Pirani vacuum sensor and the electrothermal SPICE modelling. Sens. Actuator A Phys. 1996, 53, 273–277. [Google Scholar] [CrossRef]
  41. Chen, C.N. Characterization of gas conductance of a thermal device with a V-groove cavity. IEEE Electron Device Lett. 2011, 33, 275–277. [Google Scholar] [CrossRef]
  42. Van Herwaarden, A.W. Thermal Vacuum Sensors Based on Integrated Silicon Thermopiles. Ph.D. Thesis, Delft University of Technology, Delft, The Netherlands, 1987. [Google Scholar]
Figure 1. Sensing scheme of the proposed thermal-type vacuum sensor.
Symmetry 12 01604 g001
Figure 2. The flow chart of the extraction of characteristic length and transition pressure.
Symmetry 12 01604 g002
Figure 3. Schematic drawing of the cross-section of the thermopile with the MEMS post-process.
Symmetry 12 01604 g003
Figure 4. Microscope photograph of the proposed CMOS-MEMS thermopile.
Symmetry 12 01604 g004
Figure 5. Architecture of sensing circuit for the proposed CMOS-MEMS thermal-type vacuum sensor.
Symmetry 12 01604 g005
Figure 6. Simulation for temperature difference ΔT vs. pressure under different characteristic lengths.
Symmetry 12 01604 g006
Figure 7. Characteristic length of the sensor vs. transition pressure.
Symmetry 12 01604 g007
Figure 8. Output voltage of the sensor vs. pressure with transition pressure by vacuum measurement.
Symmetry 12 01604 g008
Figure 9. Output voltage of the sensor vs. pressure by vacuum simulation.
Symmetry 12 01604 g009
Figure 10. The flow chart of validity of the macro-model for different heating powers.
Symmetry 12 01604 g010
Figure 11. Temperature different from the macro-model of sensor vs. pressure with the different heating power by simulation.
Symmetry 12 01604 g011
Figure 12. Output voltage of the sensor vs. pressure with the different heating power by measurement.
Symmetry 12 01604 g012
Figure 13. The relationship between a and the heating power.
Symmetry 12 01604 g013
Figure 14. The relationship between b and the heating power.
Symmetry 12 01604 g014
Table 1. A comparison between predicted and measured output voltage (Heating power: 0.21 mW).
Pressure (mTorr)ΔTs (k)Vc (mV)Vth (mV)Error (%)
101.0360.50490.50370.23%
1001.0190.49830.49600.45%
10000.90.45240.45060.40%
10,0000.670.36350.36400.13%
100,0000.5960.33490.33290.60%
760,0000.5850.33070.32860.64%
Table 2. A comparison between predicted and measured output voltage (Heating power: 0.57 mW).
Pressure (mTorr)ΔTs (k)Vc (mV)Vth (mV)Error (%)
102.8111.38411.37230.86%
1002.7651.36601.35241.00%
10002.4431.23941.22441.23%
10,0001.8190.99410.98860.56%
100,0001.6170.91470.90381.20%
760,0001.5890.90370.88921.63%
Table 3. A comparison between predicted and measured output voltage (Heating power: 1.441 mW).
Pressure (mTorr)ΔTs (k)Vc (mV)Vth (mV) Error (%)
107.1063.44703.51651.98%
1006.9893.40143.46381.80%
10006.1763.08443.14411.90%
10,0004.5982.46912.53112.45%
100,0004.0872.26992.30551.54%
760,0004.0172.24262.27291.34%

