Article

Optimization of Flocculation Settling Parameters of Whole Tailings Based on Spatial Difference Algorithm

Key Laboratory of Coal Processing & Efficient Utilization, Ministry of Education, School of Chemical Engineering & Technology, China University of Mining and Technology, Xuzhou 221116, China
*
Author to whom correspondence should be addressed.
Symmetry 2019, 11(11), 1371; https://doi.org/10.3390/sym11111371
Submission received: 5 September 2019 / Revised: 29 October 2019 / Accepted: 29 October 2019 / Published: 5 November 2019

Abstract

:
In order to obtain the optimum parameters of total tailings flocculation settling, an optimization method of total tailings flocculation settling parameters based on the spatial difference algorithm was proposed. Firstly, the input and output factors of the whole tailings flocculation settling parameters are effectively analyzed, and the relevant factors affecting the flocculation settling parameters are obtained. Secondly, the flocculation settling velocity of the whole tailings is optimized by combining the spatial difference algorithm with the mathematical symmetry algorithm, and the optimal value of the flocculation settling velocity of the whole tailings is obtained. The experimental results show that anionic flocculation has the best flocculation settling effect on the whole tailings. The optimal settlement velocity is close to the actual settlement velocity, and the error of settlement velocity is less than 3.5%. The results show that compared with the traditional method, this method is an effective method to optimize the flocculation and settlement parameters of the whole tailings.

1. Introduction

The main problems faced by deep mining are high ground pressure and high temperature, manifestations such as rock burst, rock burst, and deterioration of working environment [1]. Discharging tailings and waste rocks will not only bring environmental pollution, but also cause long-term ecological damage. Industry scholars generally believe that cemented tailings filling is the best way to deal with mining areas.
The concentration of all tailings mortar discharged after beneficiation is generally 10–25%, while the quality concentration of all tailings filling, especially cemented filling, is 68–74%, and paste filling requires higher quality concentration. Therefore, the concentrated settlement of the whole tailings becomes the key factor to restrict the high concentration filling. When the properties of the flocculation are certain, the main factors affecting the settling effect of the whole tailings are the mass fraction of the whole tailings mortar and the dosage of the flocculation [2,3].
(1) When the mass fraction of total tailings mortar is low, the interaction force between tailings particles is small. Flocculation can better act on tailings particles, forming larger flocculation, accelerating settling under gravity, but their settling mass fraction is low, which cannot meet the requirement of releasing sand mass fraction. When the mass fraction of total tailings is high, a higher settling mass fraction can be formed. However, due to the large interaction between tailings particles, the settling speed is slow.
(2) In order to meet the requirement of dynamic sand release in vertical sand silos, it is necessary to increase the dosage of flocculation to accelerate the settling speed of the whole tailings. However, if the flocculation is added excessively, it will not only cause waste of medicines and high cost, but also cause the increase of flocculation content in overflow water and secondary pollution.
Traditional centralized settlement of whole tailings is usually carried out in vertical sand silos, mainly relying on the natural settlement of tailings. Due to the large proportion of fine mud in the whole tailings, the natural settlement of vertical silo tailings is slow, the solid content of overflow water is high, and the concentration of sediment is low, which cannot meet the requirements of industrial water reuse, and the discharge of wastewater exceeds the standard. In order to accelerate settling speed and reduce solid content in overflow water, flocculation can be added to accelerate settling concentration. However, in practical application, the selection of flocculation settling parameters of whole tailings is often based on the experience of other mines. Due to the different properties of whole tailings, the flocculation settling effect is not ideal. For this reason, some scholars have carried out a lot of experimental studies on flocculation settling of whole tailings. However, only through limited laboratory tests can the best flocculation settling parameters be selected, which is ineffective. If we add a large number of experimental groups, it will be time-consuming and laborious, and the results are easily interfered by other factors [4]. At present, cemented filling with full tailings is the development direction of filling mining method in metal mines. Concentration and settlement of full tailings is the key technology to realize continuous and efficient filling in mines. Some scholars have carried out the static flocculation settlement test of the whole tailings and five flocculants in Linglong gold mine, Shandong Province. By controlling the single variable test method and taking the settling speed and the settling underflow concentration as the reference index, the influence of the parameters of flocculants on the flocculation settlement has been studied [5].
In order to solve the problems existing in the traditional methods, this study proposed a new optimization method for the flocculation settling parameters of tailings based on the spatial difference algorithm and mathematical symmetry algorithm. Based on the flocculation settling mechanism, the relevant factors affecting the parameters are analyzed accurately. Spatial difference algorithm is used to optimize the flocculation settling speed in order to obtain the optimal speed. Finally, the validity of this method is proved by experiments.

2. Algorithm Definitions

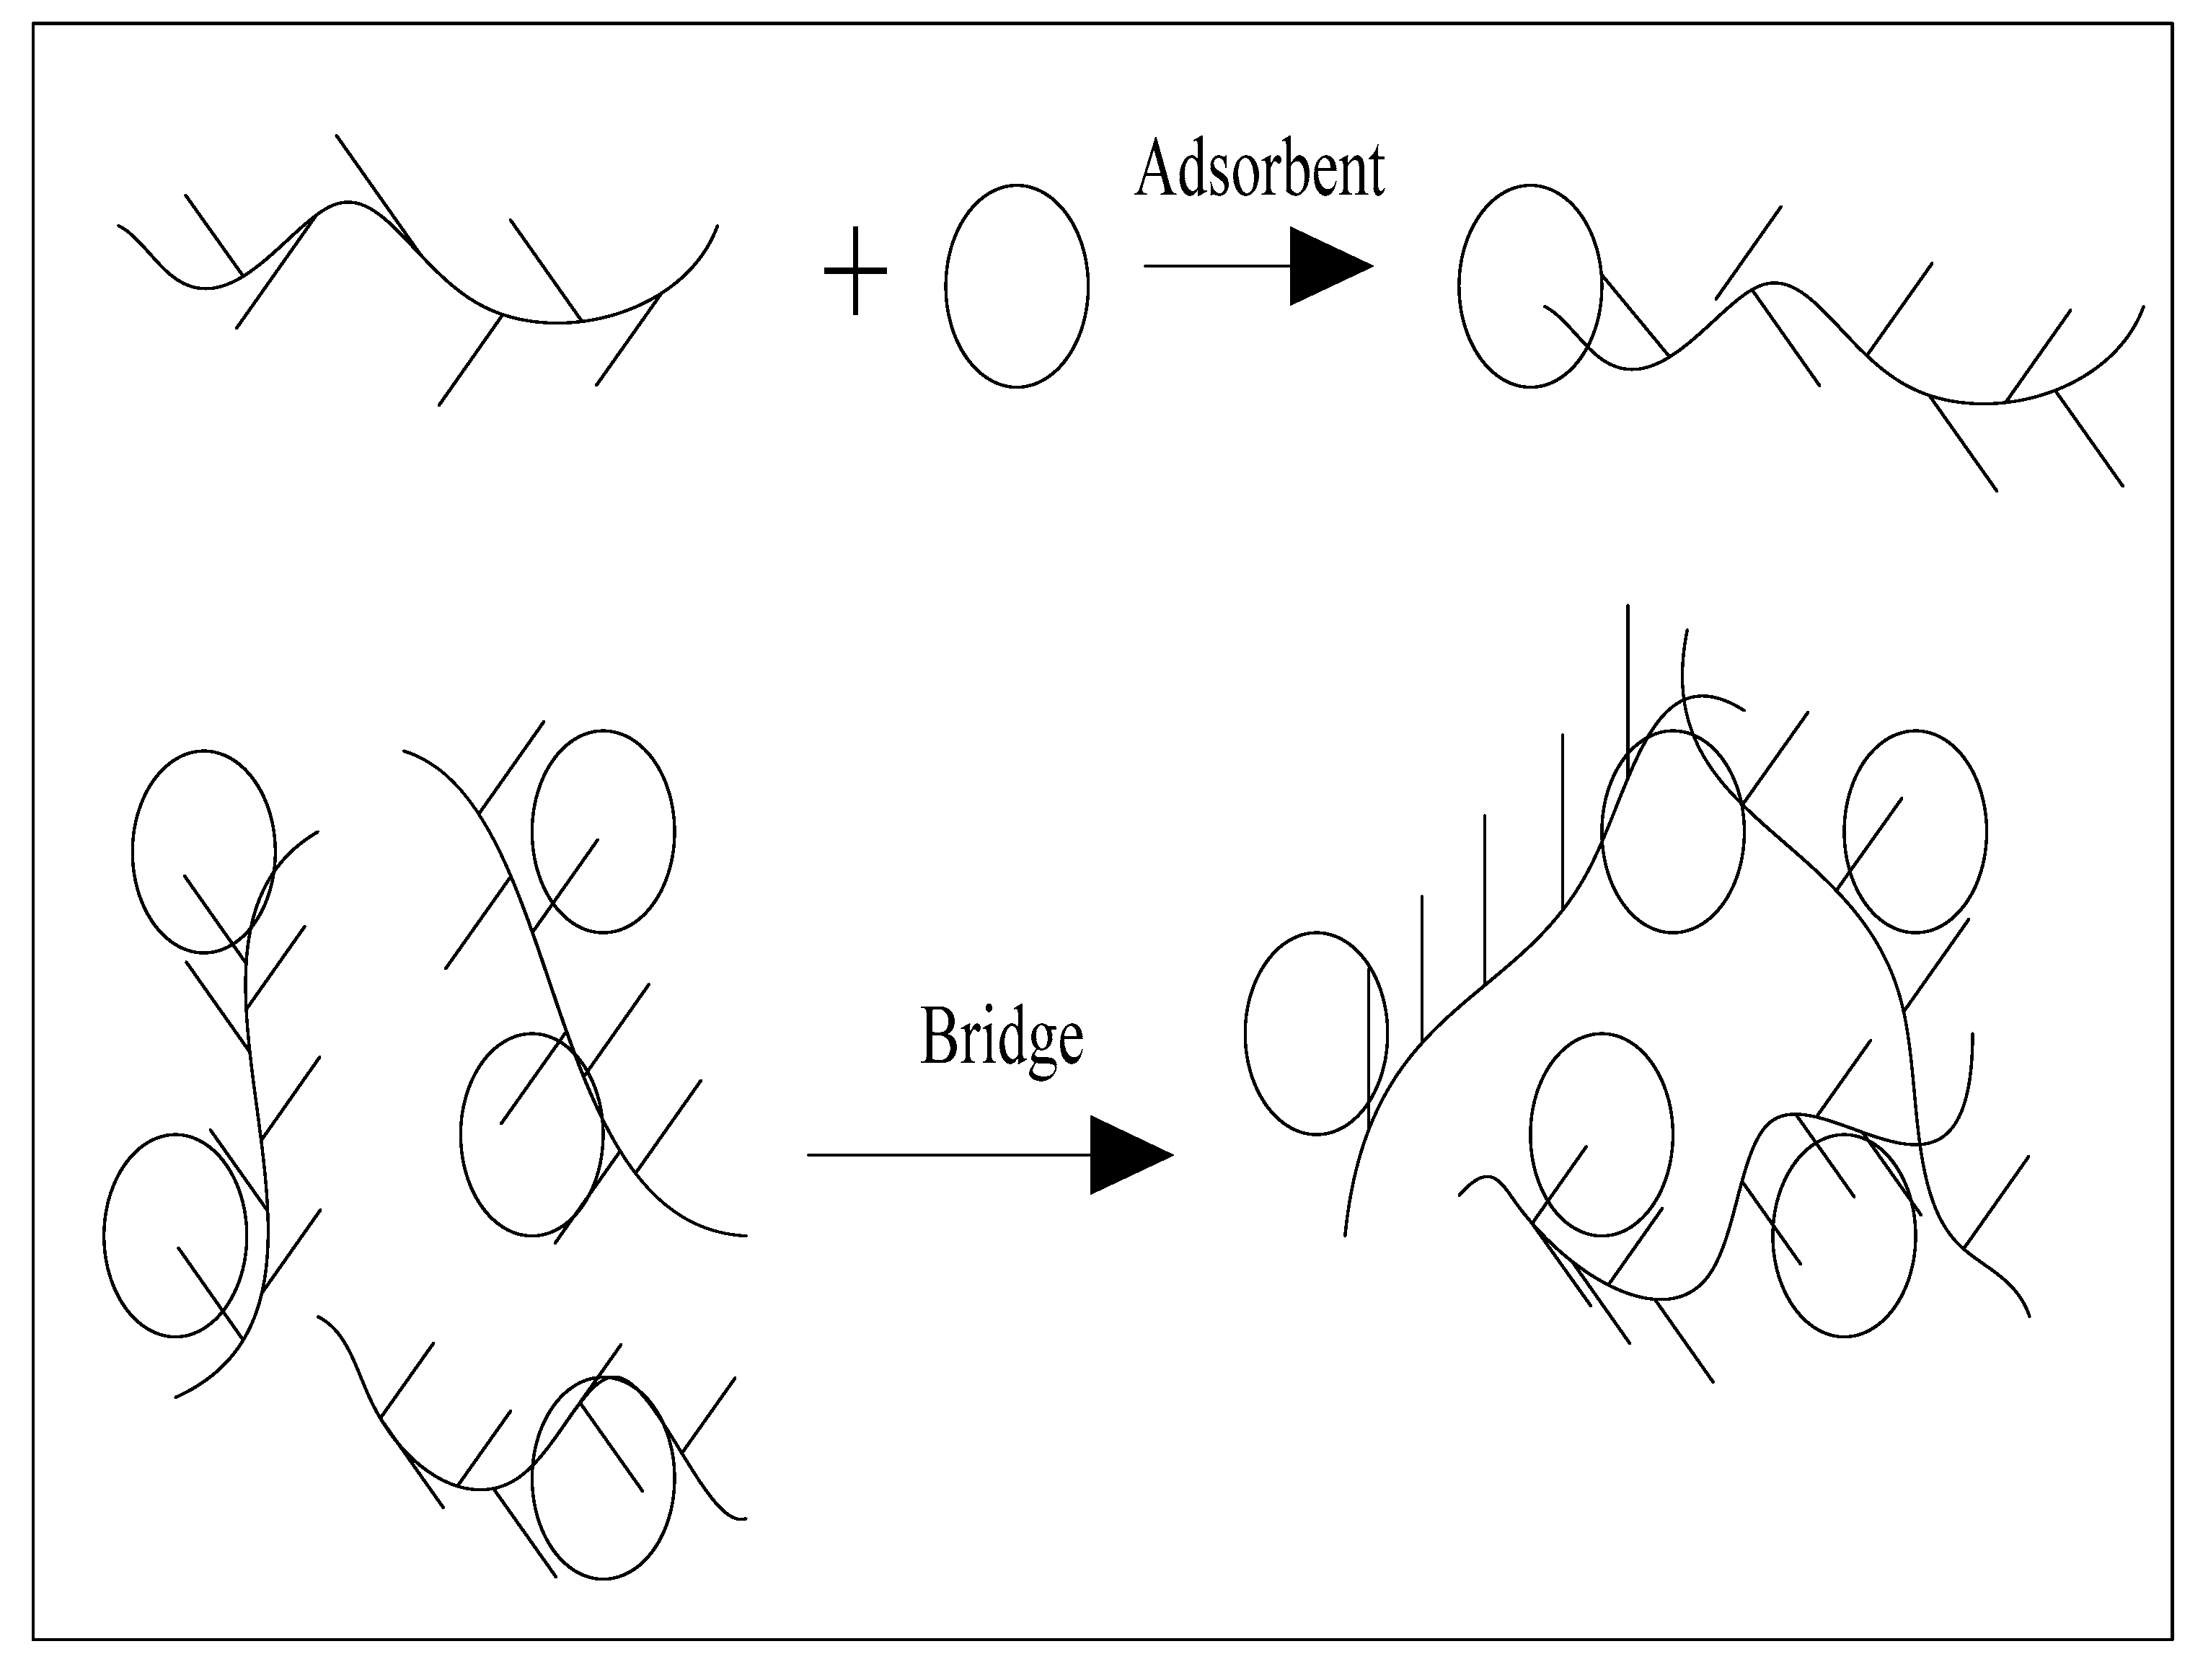
2.1. Mechanism of Flocculation Action

The process of separation of solid particles suspended in a fluid by gravity is called sedimentation. Brownian motion is an important factor affecting the settling process of solid particles. The diffusion caused by Brownian motion hinders the settling of particles in the dispersion system. The larger the particle size, the less obvious the Brownian effect. Therefore, increasing the particle size is an effective way to improve the settling speed. According to Stokes Settlement Law [6], the settling velocity of solid particles in the dispersion system is directly proportional to the square of particle size, the density difference between solid and liquid, and inversely proportional to the viscosity of liquid. That is to say, the bigger the diameter of solid particles, the bigger the density difference between solid and liquid, the smaller the viscosity of liquid, and the faster the settling velocity.
v = g d 2 ( δ 1 δ 2 ) 18 η
In the formula, v is the settling velocity in m/s; g is the gravitational acceleration, 9.8   m / s 2 ; d is the particle size in m; δ 1 is the density of particles in kg / m 3 ; δ 2 is the density of liquids in kg / m 3 , η is the viscosity coefficient of liquids in kg / m 3 gs .
Organic macromolecule flocculation is a linear macromolecule polymer. Its molecular weight is high. Active functional groups on long carbon chains can adsorb particles [7,8] in the dispersion system. Each macromolecule compound can adsorb more than one particle, which plays a role of linking between particles. This role is called bridging effect. The bridging process of organic polymer flocculation is shown in Figure 1. One end of the flocculation adsorbs particles to form unstable adsorbed particles. Many unstable adsorbed particles form stable clusters [9,10] through bridging.
The mechanism of flocculation is to increase the particle size, thereby greatly increasing the settling speed of particles, that is, the whole tailings particles are adsorbed together under the bridge action of the long chain structure of flocculation, forming larger flocs, and achieving a certain size and density, which is conducive to settling and achieving the purpose of turbidity-clearing separation [11,12].
The flocculation settling process can be divided into six stages: Turbulence influence stage, accelerated settling stage, final settling velocity stage, interference settling stage, compaction settling stage, and ultimate settling stage. In the early stage of settling, the slurry undergoes strong agitation, and the particles are affected by turbulence, resulting in coagulation. When the turbulence effect weakens gradually [13], the particles settle naturally under gravity and the velocity increases gradually until the resistance and gravity are balanced to reach the ultimate velocity. When the particles continue to settle, the interference settlement will occur when they contact the decelerated settled particles at the bottom. As the particles continue to settle, the bottom concentration will gradually increase, and the water between the flocs will gradually be extruded. After reaching a certain degree, the water in the flocs will also be extruded, resulting in compaction settlement. When the particle reaches the ultimate settlement concentration, the settlement velocity approaches zero and the settlement process basically ends.

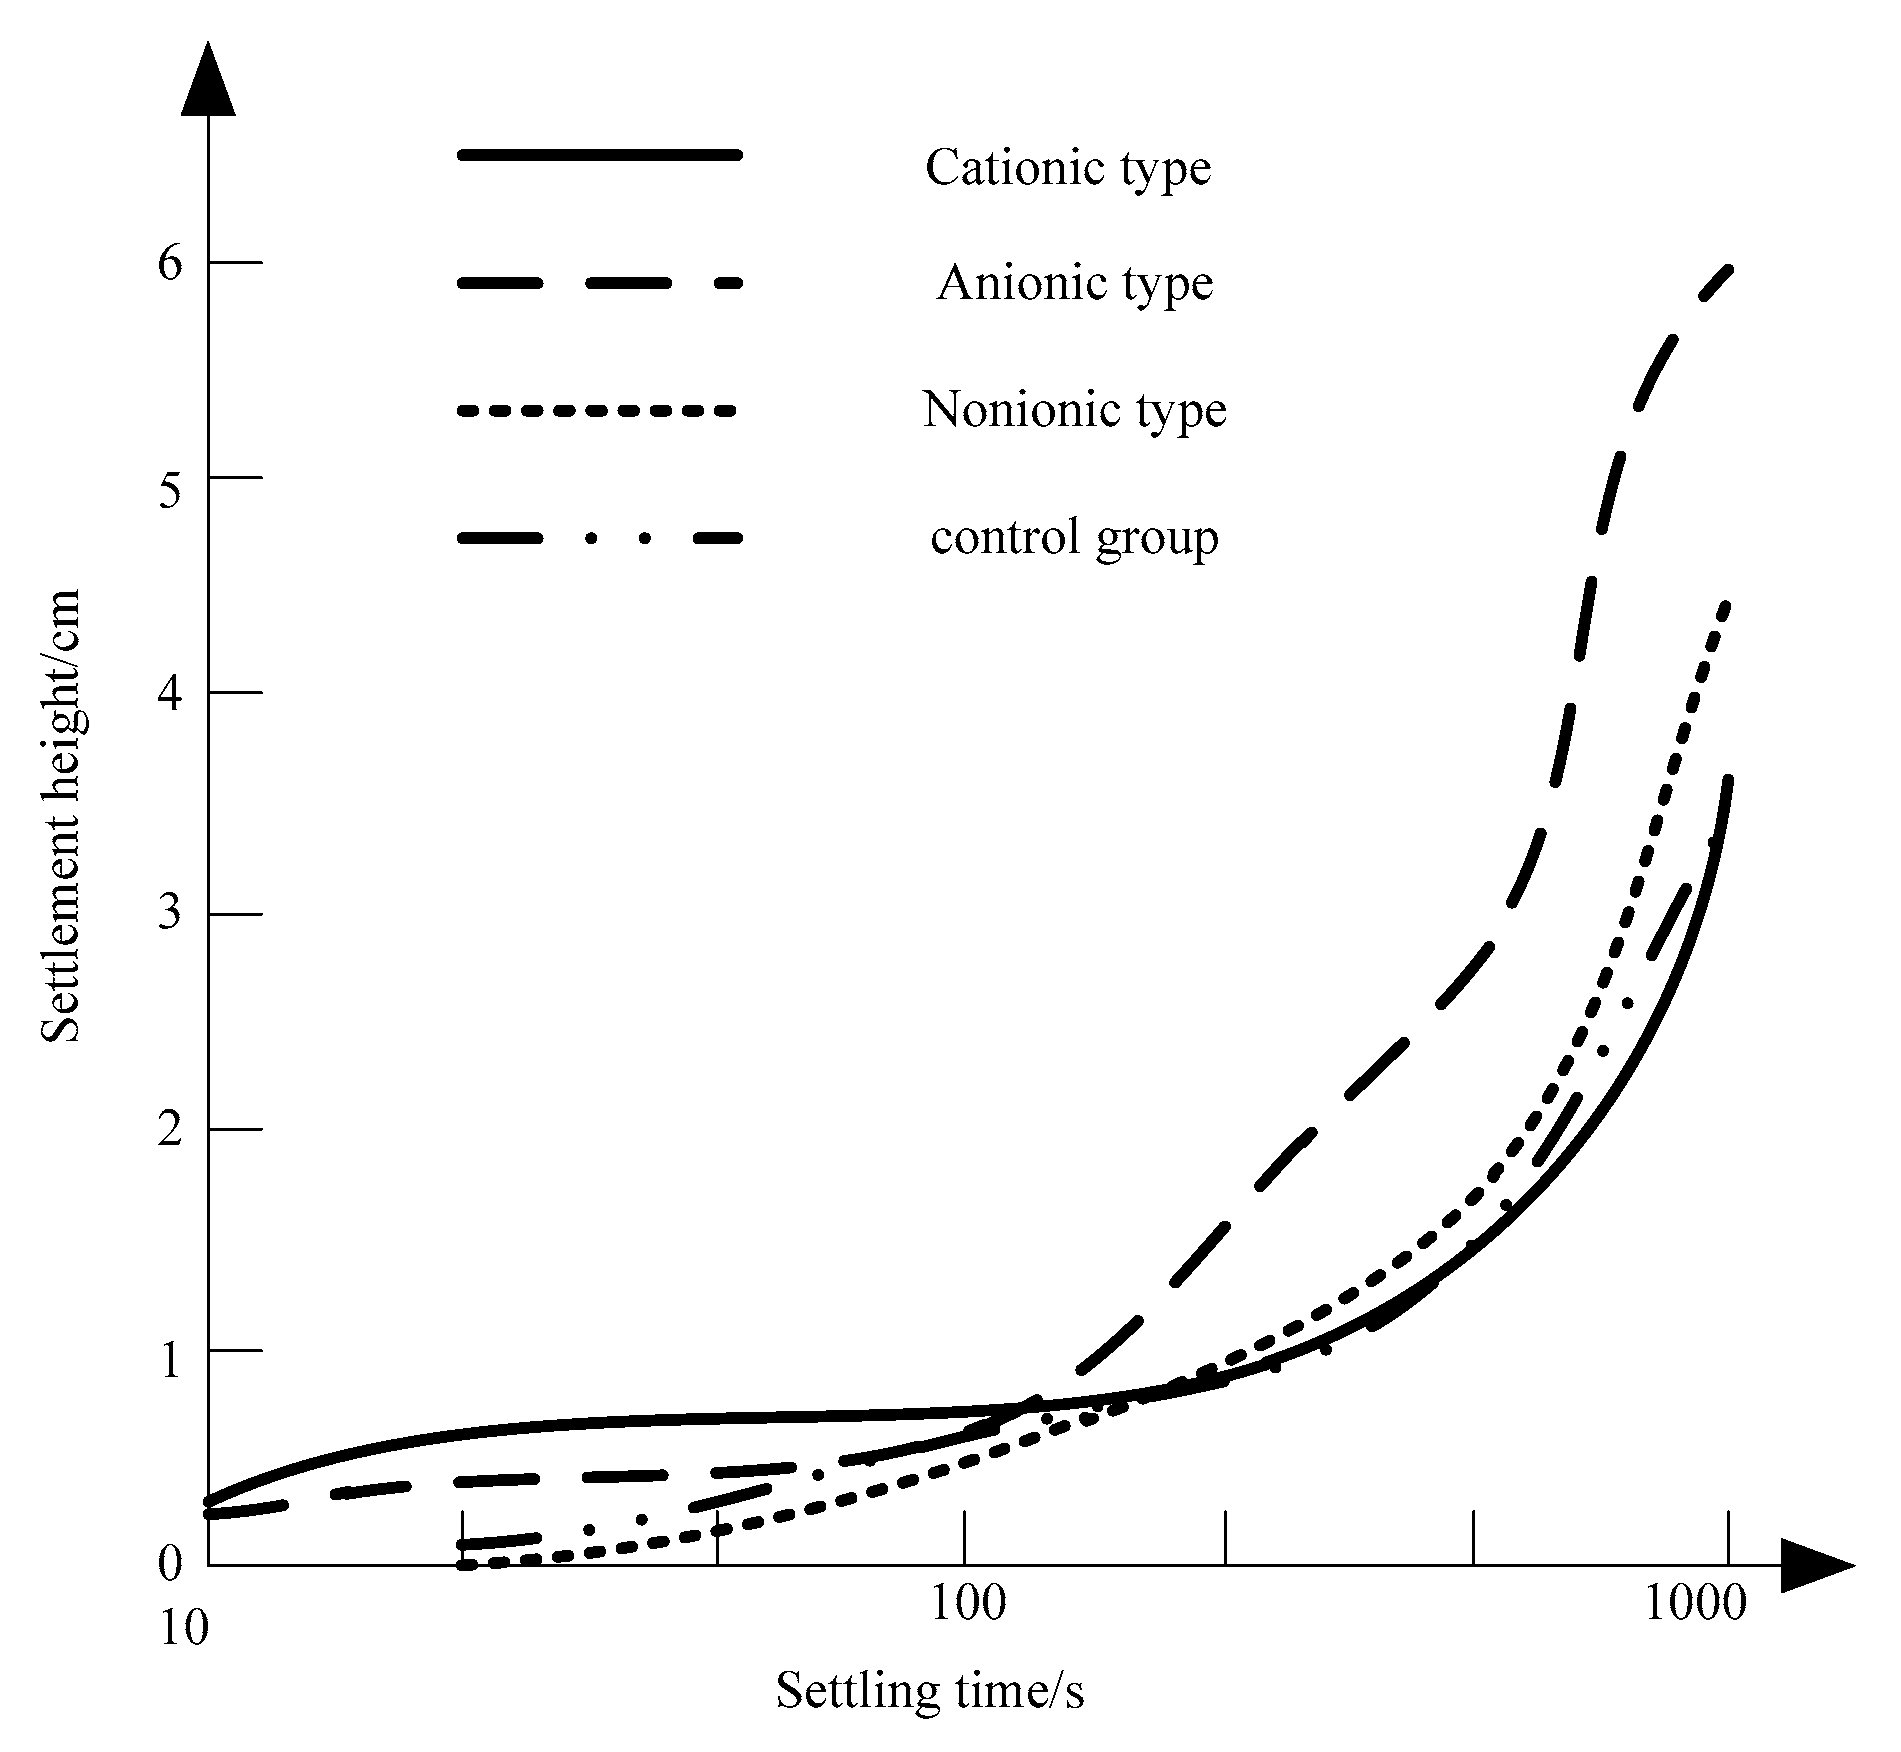
2.2. Input Factor Analysis of Flocculation Settlement Parameters of Whole Tailings

Under certain physical and mechanical properties of tailings and flocculation properties, the concentration of sand supply, flocculation consumption and flocculation concentration, and mortar pH value are the most important factors affecting the flocculation settling effect [14].
(1) The higher the concentration of sand supply, the more solid particles contained, the more flocculation used, and the interaction between tailings particles increases, the settling speed decreases; the lower the concentration of sand supply, the lower the final settling concentration, which cannot meet the requirements of tailings.
(2) The larger the dosage of flocculation, the faster the settling speed of tailings, but the larger the dosage, the higher the cost of reagent [15], and the higher the content of flocculation in overflow water and the difficulty of wastewater treatment; the lower the dosage of flocculation, the slower the settling speed, which cannot meet the requirement of continuous dynamic sand release in vertical sand silo, and the higher the solid content in overflow water, the higher the cost of wastewater treatment [16].
(3) When the concentration of flocculation is high, the viscosity is high, the agitation is difficult, and it is difficult to disperse evenly into the slurry; when the concentration of flocculation is too small, the flocculation dosage per unit volume is small, it is difficult to fully interact with the whole tailings particles per unit volume in a short time, which affects the sedimentation effect.
(4) Although some studies have shown that the pH value of mortar has an effect on the results, increasing the pH adjusting device on the spot will greatly improve the operation difficulty, reduce the accuracy of settlement results, and is not conducive to efficient management. In addition, with the continuous renewal of flocculation, different pH values have corresponding flocculation matching with them [17]. Therefore, it is considered that acidic neutralization and externalization (for pipeline storage) are necessary for the removal of strong acidic slurries. In corrosion, the effect of pH value is not considered.
In summary, the settling parameters of flocculation are mainly determined by the sand concentration C w (mass concentration, %), the flocculation consumption q(g/t) and the flocculation concentration C x (%) which can be used as input factors of the network.

2.3. Analysis of Output Factor of Flocculation Settlement Parameters of Whole Tailings

The evaluation indexes of flocculating settling effect of whole tailings include settling velocity (m/h), sand discharge amount (mass concentration, %), and overflow water concentration (mass concentration, %) as follows:
(1) Settlement velocity. During the laboratory test, the measured settlement velocity of the settlement interface is the tailings settlement velocity. In order to achieve the dynamic settlement of tailings in vertical sand silos and continuous releasing of sand, it is necessary to ensure that the amount of sand stored in the silos remains unchanged, that is, the settling speed of tailings is greater than or equal to the releasing speed. On the premise of ensuring that the amount of sand input is satisfied [18], the settling velocity v of the whole tailings settlement should meet the requirement of the sand releasing capacity Q, which is related to the cross-sectional area S of the vertical sand silo where the tailings are located.
v Q / S
When the filling capacity is designed according to 100   m 3 / h , 76.05   m 3 dry sand is required per h, and the sand release rate is designed to be calculated by Q = 80   m 3 / h . In a vertical sand silo with a diameter of 11 m, S = 94.99   m 2 can achieve dynamic settlement and continuous sand release by means of full tailings settlement velocity v 0.842   m / h . In actual production, under certain cost, the faster settlement speed is required, the better. During the test, the settlement velocity is calculated by measuring the variation of the settlement height with time.
(2) The amount of sand released and the concentration of sand released. That is, the mass concentration of bottom tailings after flocculation settlement. In order to configure high concentration slurry, the higher the concentration of sand release, the better. Generally, the concentration of sand release is more than 50%.
(3) The concentration of overflow water, the mass concentration of overflow water in the process of flocculation and sedimentation, and the solid content of overflow water commonly used in engineering. In vertical silo flocculation settling, if the flocculation performance, concentration, and dosage are fixed, the settling speed will be determined, the amount of sand released and the concentration of sand released will be determined accordingly. Therefore, the settling speed and the amount of sand released [19] and the concentration of sand released are actually three aspects of a problem, which should not be considered repeatedly in the study. The former is chosen in this paper. If the feed concentration is constant and the total mass of slurry and solid tailings remains unchanged in the established vertical sand silo, the following relationship exists:
C w y = C w j m j C w f m f m j m f
In the formula, C w j is the mass concentration of sand feeding; m j is the total mass of sand feeding; C w f is the mass concentration of sand releasing; m f is the total mass of sand releasing; C w y is the mass concentration of overflow water.
The quality concentration of overflow water is contradictory to the amount of sand released. Generally speaking, the larger the amount of sand released, the lower the quality concentration of overflow water, and vice versa. Therefore, when network output is carried out, a comprehensive evaluation output factor must be formulated, taking into account the settling speed, the amount of sand released [20], and the concentration of sand released and the concentration of overflow water. In order to simplify the network system, the settling velocity is taken as a comprehensive evaluation index to evaluate the flocculation settling parameters, which is the only optimization parameter in this study.

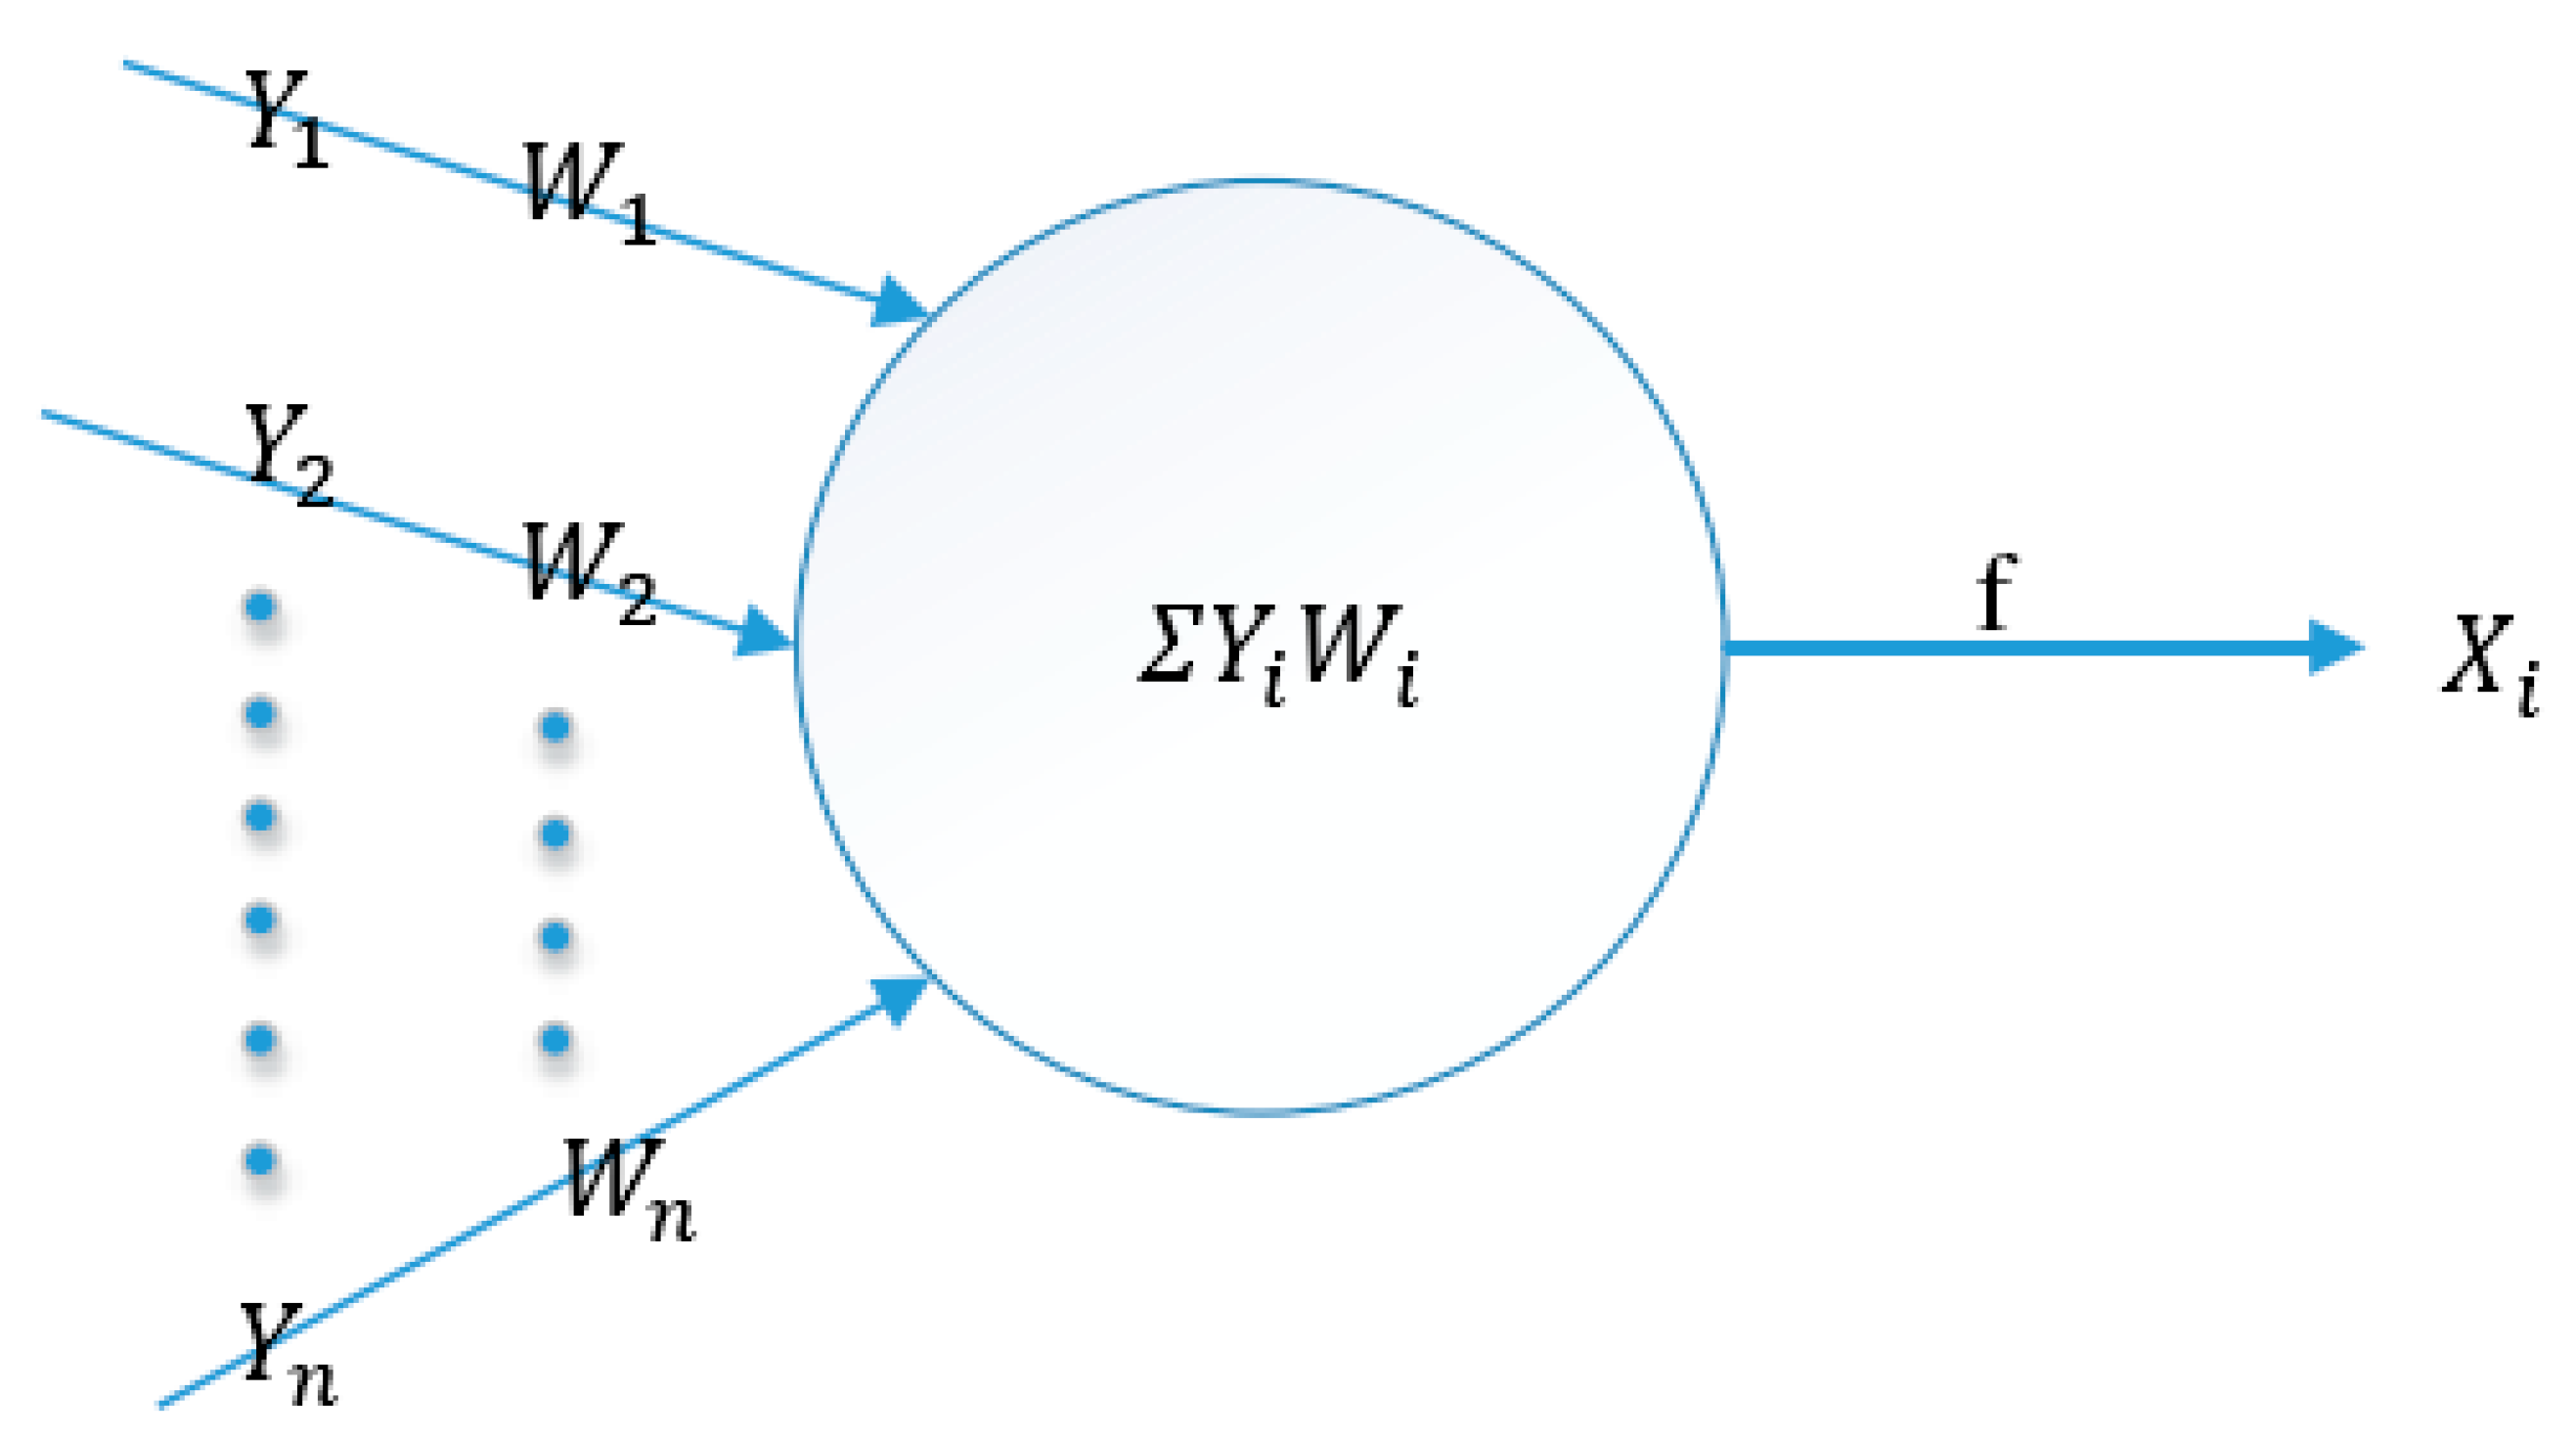
2.4. Parameter Optimization of Spatial Difference Algorithm

2.4.1. Inverse Distance Weighted (IDW) Difference Method

IDW method is a deterministic difference method based on the principle of similar similarity. It is assumed that each sampling point of flocculation settling velocity of tailings has a local influence [21,22]. Some points closest to the sampling point have the greatest contribution to the value of the unsampled point, and their contribution is inversely proportional to the distance. The expression is as follows:
Z = i = 1 n 1 ( d i ) p Z i / i = 1 n 1 ( d i ) p
In the formula: Z is the settlement velocity of the sampling point studied. Z i is the different settlement velocity i ( i = 1 , 2 , , n ) , which is used to evaluate the distance between sampling stations. p is the power parameter defined by analysis, and n represents the number of stations used for evaluation and calculation.
The main factor affecting the accuracy of IDW method is p value, which is linear distance attenuation difference when p equals one, and non-linear distance attenuation difference when p is greater than one. For larger powers, the nearest sampling stations are given a higher weight share; for smaller powers, the weights are evenly distributed to each sampling station. The advantage of this method is that the structure of spatial difference isoline can be adjusted by weight. The disadvantage of this method is that unreasonable weighting will lead to large deviation if we do not understand the structural distribution characteristics of interpolation attributes in the study area, and it is easy to be affected by extreme values. The simulation results of several commonly used p parameters are compared. In addition, the size and number of adjacent points also affect the accuracy of the results. The value of the nearest sampling point is 12, and the range of maximum distance is set to 1.7 m.

2.4.2. Spline Method

Spline method is a method of approaching the surface by mathematical function, which is piecewise polynomial [23] joined together according to certain smoothness requirements. This method has the advantages of small calculation amount, fast speed, retaining local variation characteristics, good visual effect, and is suitable for smooth surface. Generally, it requires continuous first and second derivatives. The disadvantage of this method is that it is difficult to estimate the error of function interpolation, and it is difficult for spline method to meet the requirements of interpolation accuracy when simulating limited monitoring data.
Z = i = 1 n λ i R ( r i ) + T ( x , y )
In the formula, Z is used to study the settlement velocity of sampling points; n is the number of stations; λ is the coefficient of solutions of a series of linear equations; r i is the distance between estimated points and i stations; R i ( r i ) and T ( x , y ) are expressed as follows:
R i ( r i ) = r i 2 4 [ ln ( r i 2 π ) + c 1 ] + τ 2 [ k 0 ( r i τ ) + c + ln ( r i 2 π ) ] 2 π
T ( x , y ) = a 1 + a 2 x + a 3 y
In the formula, τ is the weight coefficient, k 0 is the modified Bessel function, c is the constant, a is the number of linear equations. Two types of spline interpolation methods, regularized and tension, were used to verify the interpolation. The weight coefficient was 0.1 and the number of model samples was 12.

2.4.3. Kriging Method

Kriging method is an interpolation method based on geostatistics. It is based on regionalized variable theory [24,25,26]. It considers that any attributes that change continuously in space are irregular. It cannot be simulated by simple smooth mathematical functions, and can be described appropriately by random surface. Kriging method focuses on the determination of weight coefficients, thus providing the best linear unbiased estimation for the variable values of blank stations.
Z ( x 0 ) = i = 1 n λ i Z ( x i ) i = 1 , 2 , , n
In formula: λ i is the weight coefficient of the settlement velocity Z ( x i ) of station i, indicating the contribution of the settlement velocity Z ( x i ) of each station to the estimated value Z ( x 0 ) . In order to achieve linear unbiased estimation and minimize the variance of estimation, the weight coefficients are obtained from the equations.
{ i = 1 n λ i C ( x i , y i ) μ = C ( x i , x 0 ) i = 1 n λ i = 1
In the formula, C ( x i , y i ) is the covariance between the sample points, C ( x i , x 0 ) is the covariance between the sample points and the interpolation points, and μ is the Lagrange multiplier.
The spatial structure characteristics of interpolated data are expressed by semi-variogram γ ( h ) as follows:
γ ( h ) = 1 2 n i = 1 n [ Z ( x i ) Z ( x i + h ) ] 2
In the formula, Z ( x i ) is the settlement velocity of station i; Z ( x i + h ) is the settlement velocity of point h from station i; n represents the number of paired stations with distance h. According to the experimental semi-variogram, a reasonable theoretical model of variogram is determined. Five variogram models, spherical, circular, exponential, Guassian and linear, were used to verify the validity. The latest sampling point was 12 and the range was set to maximum distance of 1.7.

2.5. Verification of the Accuracy of the Results of Spatial Difference Optimization Model

Combined with the depth learning algorithm, the optimization effect of each difference model is verified by cross-test. The principle is to remove the settlement velocity of each monitoring station once from the data column [27]. In-depth learning algorithm, unsupervised learning is used to train layer by layer, mapping high-dimensional and non-linear data features into low-dimensional feature space, automatically establishing dimension mapping relationship and acquiring hierarchical feature representation, so as to obtain better feature expression and classification. The self-coding network model in deep learning is used to extract network features, and the feature data are classified by soft Max classifier to optimize the difference model. The structure of deep network in deep learning is consistent with that of neural network. The neuron model is shown in Figure 2. Among them, Y i represents input signals transmitted by neurons, X i represents cumulative output, W i represents the weight of the current neuron, and a formula is obtained:
X i = f ( n e t i ) = f ( Y i W i )
Based on the neuron model, the settlement velocity is estimated by the difference between the measured values of surrounding stations, and then the error between the optimized values and the measured values is calculated to obtain the optimized settling velocity of the whole tailings flocculation [28]. Pearson correlation coefficient (Corr), mean error (ME), mean absolute error (MAE), and mean square error (RMSE) of optimized and measured values were used as criteria for evaluating the difference method. Corr reflects the degree of coincidence between validation value and optimization value, ME reflects the error of overall optimization value, MAE reflects the possible error range of optimization value, RMSE reflects the sensitivity and extremum effect of optimization value. The formulas are as follows:
C o r r = Z ^ Z Z ^ Z N [ Z ^ 2 ( Z ^ ) 2 N ] [ Z 2 ( Z ) 2 N ]
M E = 1 n i = 1 n Z ^ ( x i ) Z ( x i )
M A E = 1 n i = 1 n | Z ^ ( x i ) Z ( x i ) |
R M S E = 1 n i = 1 n [ Z ^ ( x i ) Z ( x i ) ] 2
In the formula, Z ^ ( x i ) represents the optimal settlement velocity value of monitoring station, and Z ( x i ) represents the actual settlement velocity value of monitoring station.
The difference of settlement velocity measured by the optimal difference model is compared with RI.
R I = 100 × ( R M S E b e s t R M S E c u r r e n t ) R M S E b e s t
When the RI value is between zero and one, the difference between the optimized settlement velocity and the actual settlement velocity is small and the similarity is high. When the value is greater than one or less than zero, the difference between the optimized settlement velocity and the actual settlement velocity is large.
Taking the whole tailings filling system of an Iron Mine as an example, this method is used to optimize the settling speed of the whole tailings. A large number of studies have shown that the dosage of flocculation and the concentration of tailings are the main factors affecting the flocculation settling effect when the physical and mechanical properties of tailings and flocculation characteristics are certain [29]. The main factors influencing the settling parameters of flocculation are the consumption of flocculation Q and the concentration of tailings c w (mass concentration, %). The comparison index of the experiment is the relationship between the settling parameters of the whole tailings and the settling velocity v, and the results obtained are compared with the actual situation. In order to realize dynamic releasing of tailings in vertical silos, the settling velocity should be greater than or equal to the releasing velocity. The control group did not consider the effect of flocculation dosage and tailings concentration on the settling speed. The genetic algorithm is used to solve the settlement velocity of the whole tailings.

3. Results

3.1. Physical Properties of Whole Tailings

Through the sampling of tailings at different distance on the sedimentary beach, the particle size of tailings at different distance is obtained through the particle analysis test. The mass fraction composition of different particle sizes of the selected iron ore tailings is shown in Table 1. The results of main physical and mechanical properties are shown in Table 2. It can be seen from Table 2 that the particle size of tailings is too fine, the specific surface area is large, and the combined water film formed in the water is rich, resulting in the natural settlement of tailings in the water. The speed is very small; the natural settlement alone cannot satisfy the requirement of dynamic sand release. Flocculation settlement must be adopted.
Settlement velocity is equal to the ratio of sand releasing capacity to settlement area. The section of vertical sand silo is 94.99 m2. If the sand releasing capacity is not less than 100 m3/h, the settlement velocity should be greater than or equal to 1.05 m/h.
The settling velocity curves of cationic flocculation, anionic flocculation, non-ionic flocculation, and normal settling are shown in Figure 3. Due to the large molecular weight of the negative flocculant, a flocculant molecule can combine with several suspended particles at the same time, form a network structure, and deposit rapidly under suitable conditions, thus showing a strong flocculation ability. The settling velocity of the three flocculation in the initial settling stage is slower than that of the control group, but the initial settling speed of the cationic flocculation is relatively faster. After 100 s, the settling speed of the anionic flocculation is gradually accelerated. The sedimentation rate of the agent increased most obviously. Within 6–12 h, the settling height of the three groups of samples gradually stabilized. The tailings with anionic flocculation took the shortest time, followed by non-ionic ones and cationic ones. After 24 h, the settlement heights of three groups of tailings were basically the same. After 100 s, the settling speed of cationic tailings gradually approached the natural settling speed, and the time needed to reach the final settling amount was close to the natural settling time. The effect of flocculation was not obvious. The initial settling speed of anionic flocculation is slower, but after 100 s, the settling speed increases sharply, and the settling amount is the most obvious. After 30 min, the settling height is 1.9 cm higher than the natural settling height, which is 61% higher, and the maximum settling amount is basically reached in 6 h of settling. The settling velocity of non-ionic type in the early stage increased slightly compared with that of natural settling group in the late stage, which was better than that of cationic type and worse than that of anionic type. Through analysis, it can be seen that anionic flocculation has more advantages in the application of this mine.

3.2. Establishment of the Sample Set

In actual mine production, the concentration of total tailings mortar directly discharged from concentrator is usually 10–25%. When the whole tailings are concentrated and dewatered, the proportion of flocculation added is generally 5–20 g per ton of dry tailings. Considering comprehensively the properties of iron ore whole tailings, four typical combinations of flocculation consumption q and tailings concentration c w were selected for orthogonal test. The uniform design method is adopted, taking the unit consumption of flocculant and the concentration of tailings as the influencing factors, the experimental scheme of uniform design of two factors and four levels is established. The test level was shown in Table 3.
According to the experimental design, the settling velocity was measured by measuring the cylinder test in the laboratory. During the experiment, the settlement velocity was calculated by measuring the height of the settlement interface at different time, and the sample data were obtained as listed in Table 4. Sample data are normalized and the results are listed in Table 5.

3.3. Parameter Optimization Model of Spatial Difference Algorithm
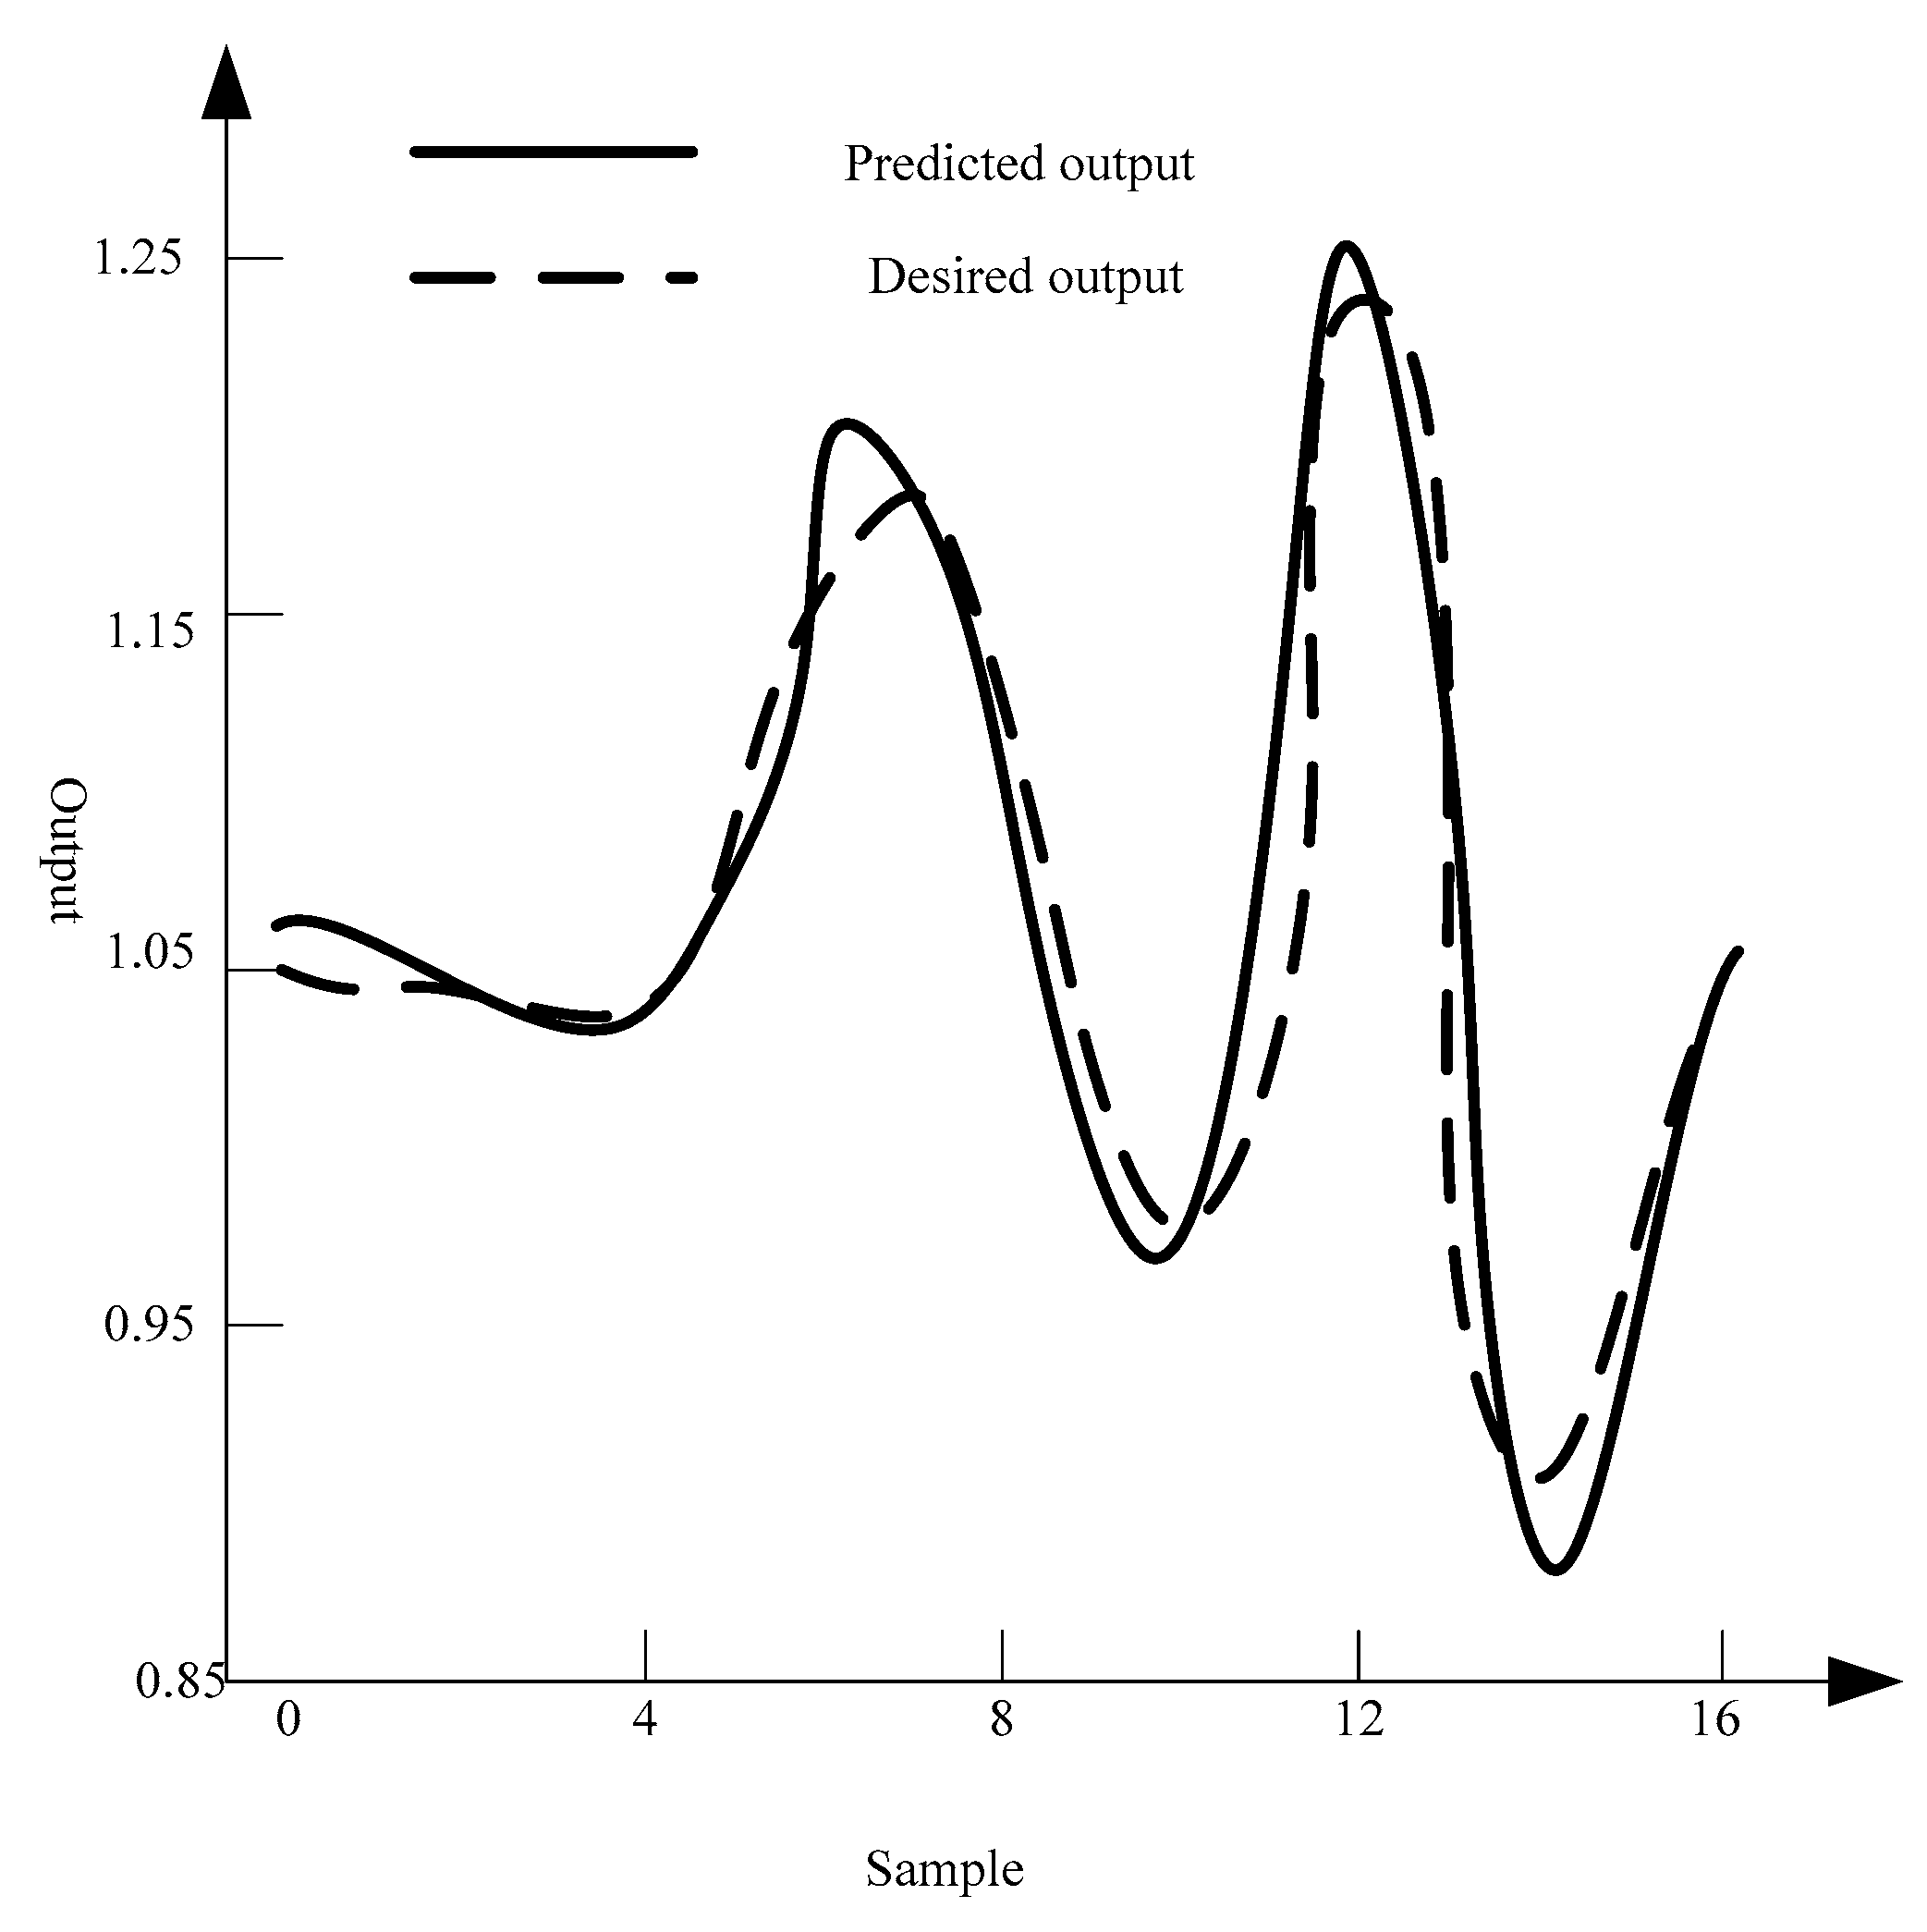
According to the principle of spatial difference algorithm, the optimum model of flocculation settling velocity of whole tailings is obtained. According to the experimental data in Table 5, the optimum model of flocculation settling velocity of whole tailings is calculated by using MATLAB, and the comparison curve between the optimum output and expected output is obtained. The comparison between the optimized production and the expected production is shown in Figure 4.
As can be seen from Figure 4, the fitting results of the model are good, the error between the optimized results and the actual values is small, and the optimization accuracy of the model is high. The settling velocity of the whole tailings is not linear with the flocculation consumption and the tailings concentration. When the flocculation consumption is small, the settling velocity decreases with the increase of the flocculation concentration. When the tailings concentration is high, the settling velocity increases with the increase of flocculation dosage. Increasing flocculation consumption and reducing tailings concentration alone cannot meet the requirement of increasing settling speed.
The iteration times of the genetic algorithm are 50 times, the population size is 20, the probability of intersection and variation is 0.2, and the probability of intersection and variation is 0.1. The floating-point code is adopted with the individual length of 2. The individual fitness curve of the optimal settlement velocity in the optimization process is shown in Figure 5.
In order to meet the needs of the whole tailings filling system, the settling velocity of the whole tailings should be greater than 1.25 m/h. On this premise, the minimum consumption of flocculation was optimized. The genetic algorithm is used to solve the optimization model of the whole tailings flocculation settling. From Figure 5, it can be seen that the optimal solution of the optimization model is very close to the actual maximum value, which shows the effectiveness of the method. The optimal solution is 8.6 g/t of flocculation and 18% of tailings concentration. At this time, the settling speed of the whole tailings can reach 1.31 m/h, which can meet the production demand. The flocculation settling parameters provided by the optimized model are used as experimental data. The settling speed obtained from the experimental results is 1.32 m/h, which is basically consistent with the optimized model.

3.4. Error Analysis

In order to verify the reliability of the results of the optimization model, 16 groups of flocculation settling parameters optimized by this model were tested in laboratory, and the relative errors between the experimental values and the optimization values were analyzed, as shown in Table 6. The error calculation formula is as follows:
δ = | a A | / A L × 100 %
In the upper form, δ represents the actual relative error. L indicates the true value. A is the approximate number, a is the exact number of the approximate number.
The results show that the fitting result of the optimized model is good. The error between the optimized model and the actual value is small, which can be controlled below 3.5%, and the precision of the optimized model is high.

4. Discussions

Through the analysis of the mass fraction composition of different particle sizes of the whole tailings in Table 1 and the results of physical and mechanical properties in Table 2, it can be concluded that it is difficult to hide the need of dynamic sand release by natural settling of the whole tailings in water, so it is necessary to interfere with the settling by flocculation. According to the analysis of the settling velocity of cationic flocculation, anionic flocculation, non-ionic flocculation, and normal settling in Figure 2, the settling effect of any flocculation is better than that of natural settling, and the settling speed of three flocculation is slower at the initial settling stage, but the initial settling speed of cationic flocculation is relatively fast with the settling activity proceeding [29]. The settling speed of anionic flocculation began to increase, and the final results showed that the anionic flocculation had the best flocculation settling effect on the whole tailings. Analyzing the results of the optimization model calculation of the flocculation settling velocity of the whole tailings by MATLAB in Figure 3, we can see that the contrast curve between the optimized output and the expected output of the settling velocity is almost the same, and according to the genetic algorithm optimization process, the individual fitness curve of the optimal settling velocity is obtained, which shows that the settling velocity of the whole tailings should be greater than 1.25 m/h. On this premise, the flocculation consumption is also the smallest. According to the result of error analysis in Table 6, the error between the optimized results and the actual experimental values is less than 3.5%. This shows that the precision of the optimized results of the whole tailings flocculation settling parameters based on the spatial difference algorithm in this paper is higher.
The limitation of the above-mentioned optimization is that the research on the influence of flocculant concentration on settling speed and ultimate speed is not enough, and the influence of flocculant parameters on settling effect cannot be revealed.

5. Conclusions

Based on the spatial difference algorithm, the flocculation settling parameters of the whole tailings are optimized, the flocculation settling speed of the whole tailings is effectively optimized, and the ecological environment pollution is reduced. Compared with thousands of tailings, the technology will dehydrate and consolidate the whole tailings, avoiding the environmental pollution problems of thousands of tailings such as mud, collapse, and dust. Therefore, the method of concentration and consolidation is used to treat the whole tailings, so as to realize the clean discharge of the whole tailings and reduce the environmental pollution. The results of this study provide a new idea for the selection of parameters of flocculation and settlement of tailings.

Author Contributions

Y.H. carried out an optimization method of total tailings flocculation settling parameters based on the spatial difference algorithm, and analyzed the input and output factors of the whole tailings flocculation settling parameters. J.C. studied the algorithm in order to optimize the flocculation settling velocity of the whole tailings. C.W. did the experiments, recorded data, and created manuscripts. All authors read and approved the final manuscript.

Funding

This research received no external funding.

Conflicts of Interest

The authors declare no conflict of interest.

References

  1. Çırak, M.; Çetin, H. Optimization of Coagulation-Flocculation Process for Treatment of a Colloidal Suspension Containing Dolomite/Clay/Borax. Int. J. Min. Process. 2017, 159, 30–41. [Google Scholar] [CrossRef]
  2. Lu, Q.; Yan, B.; Xie, L. A Two-Step Flocculation Process on Oil Sands Tailings Treatment Using Oppositely Charged Polymer Flocculation. Sci. Total. Environ. 2016, 565, 369–375. [Google Scholar] [CrossRef] [PubMed]
  3. Angle, W.; Gharib, S. Effects of Sand and Flocculation on Dewaterability of Kaolin Slurries Aimed at Treating Mature Oil Sands Tailings. Chem. Eng. Res. Des. 2017, 125, 306–318. [Google Scholar] [CrossRef]
  4. Botha, L.; Soares, P. The Influence of Tailings Composition on Flocculation. Can. J. Chem. Eng. 2015, 93, 1514–1523. [Google Scholar] [CrossRef]
  5. Demoz, A. Scaling Inline Static Mixers for Flocculation of Oil Sand Mature Fine Tailings. AIChE J. 2015, 61, 1747–1757. [Google Scholar] [CrossRef]
  6. Mandik, I.; Cheirsilp, B.; Boonsawang, P.; Prasertsan, P. Optimization of Flocculation Efficiency of Lipid-Rich Marine Chlorella sp. Biomass and Evaluation of Its Composition in Different Cultivation Modes. Bioresource Technol. 2015, 182, 89–97. [Google Scholar] [CrossRef]
  7. Agbovi, K.; Wilson, D. Flocculation Optimization of Orthophosphate with FeCl3 and Alginate Using the Box–Behnken Response Surface Methodology. Ind. Eng. Chem. Res. 2017, 56, 3145–3155. [Google Scholar] [CrossRef]
  8. Quinlan, J.; Tam, C. Water Treatment Technologies for the Remediation of Naphthenic Acids in Oil Sands Process-Affected Water. Chem. Eng. J. 2015, 279, 696–714. [Google Scholar] [CrossRef]
  9. Wang, L.; Wan, L.; Zhang, Y.; Lee, D.; Liu, X.; Chen, X.; Tay, J. Mechanism of Enhanced Sb(V) Removal from Aqueous Solution Using Chemically Modified Aerobic Granules. J. Hazard Mater. 2015, 284, 43–49. [Google Scholar] [CrossRef]
  10. Bayabil, K.; Stoof, R.; Lehmann, C.; Yitaferu, B.; Steenhuis, T. Assessing the Potential of Biochar and Charcoal to Improve Soil Hydraulic Properties in the Humid Ethiopian Highlands: The Anjeni Watershed. Geoderma 2015, 243–244, 115–123. [Google Scholar] [CrossRef]
  11. Hashemzadeh, F.; Gaffarinejad, A.; Rahimi, R. Porous p-NiO/n-Nb2O5 Nanocomposites Prepared by an EISA Route with Enhanced Photocatalytic Activity in Simultaneous Cr(VI) Reduction and Methyl Orange Decolorization under Visible Light Irradiation. J. Hazard Mater. 2015, 286, 64–74. [Google Scholar] [CrossRef] [PubMed]
  12. Oladipo, A.; Gazi, M.; Yilmaz, E. Single and Binary Adsorption of Azo and Anthraquinone Dyes by Chitosan-Based Hydrogel: Selectivity Factor and Box-Behnken Process Design. Chem. Eng. Res. Des. 2015, 104, 264–279. [Google Scholar] [CrossRef]
  13. Motta, L.; Gaikwad, R.; Botha, L.; Soares, J. Quantifying the Effect of Polyacrylamide Dosage, Na+ and Ca2+ Concentrations, and Clay Particle Size on the Flocculation of Mature Fine Tailings with Robust Statistical Methods. Chemosphere 2018, 208, 263–272. [Google Scholar] [CrossRef] [PubMed]
  14. Botha, L.; Davey, S.; Nguyen, B.; Swarnakar, A.; Rivard, E.; Soares, J. Flocculation of Oil Sands Tailings by Hyperbranched Functionalized Polyethylenes (HBfPE). Miner. Eng. 2017, 108, 71–82. [Google Scholar] [CrossRef]
  15. Reis, G.; Oliveira, S.; Palhares, N.; Spinelli, L.; Lucas, E.; Vedoy, D.; Asare, E.; Soares, J. Using Acrylamide/Propylene Oxide Copolymers to Dewater and Densify Mature Fine Tailings. Miner. Eng. 2016, 95, 29–39. [Google Scholar] [CrossRef]
  16. Nassar, N.; Betancur, S.; Acevedo, S.; Franco, C.; Cortés, F. Development of a Population Balance Model to Describe the Influence of Shear and Nanoparticles on the Aggregation and Fragmentation of Asphaltene Aggregates. Ind. Eng. Chem. Res. 2015, 55, 146–148. [Google Scholar] [CrossRef]
  17. Ochando-Pulido, M.; Stoller, M.; Palma, D.; Martínez-Ferez, A. On the Optimization of a Flocculation Process as Fouling Inhibiting Pretreatment on an Ultrafiltration Membrane during Olive Mill Effluents Treatment. Desalination 2016, 393, 151–158. [Google Scholar] [CrossRef]
  18. Xiao, S.; Song, Y.; Tian, Z.; Tu, X.; Hu, X.; Liu, R. Enhanced Mineralization of Antibiotic Berberine by the Photoelectrochemical Process in Presence of Chlorides and Its Optimization by Response Surface Methodology. Environ. Earth Sci. 2015, 73, 4947–4955. [Google Scholar] [CrossRef]
  19. Li, Y.; Xu, Y.; Liu, L.; Jiang, X.; Zhang, K.; Zheng, T.; Wang, H. First Evidence of Bioflocculation from ShinellaAlbus with Flocculation Activity on Harvesting of Chlorella Vulgaris Biomass. Bioresource Technol. 2016, 218, 807–815. [Google Scholar] [CrossRef]
  20. Buyel, F.; Fischer, R. A Juice Extractor Can Simplify the Downstream Processing of Plant-Derived Biopharmaceutical Proteins Compared to Blade-Based Homogenizers. Process.Biochem. 2015, 50, 859–866. [Google Scholar] [CrossRef]
  21. Mnak, G.; Altun, I.; Olgun, M. Fixed Points of f-contractive Type Fuzzy Mappings. J. Intell. Fuzzy Syst. 2017, 33, 1435–1439. [Google Scholar] [CrossRef]
  22. Li, P. Content Aware Scheduling Algorithm for SVC Streaming over OFDM. J. ChinaAcad. Electron. Inf. Technol. 2015, 10, 169–174. [Google Scholar]
  23. Wang, T.; Cai, T.; Duan, X. Digital Realization of Simplified Three-Level SVM for Vienna Rectifier. J. Power Supply 2017, 15, 72–79. [Google Scholar]
  24. Dewasurendra, M.; Vajravelu, K. On the Method of Inverse Mapping for Solutions of Coupled Systems of Nonlinear Differential Equations Arising in Nanofluid Flow, Heat and Mass Transfer. Appl. Math. Nonlinear Sci. 2018, 3, 1–14. [Google Scholar] [CrossRef]
  25. Delgado, J.; Peña, J.M. Monotonicity Preserving Representations of Curves and Surfaces. Appl. Math. Nonlinear Sci. 2016, 1, 517–528. [Google Scholar] [CrossRef]
  26. Tan, S.; Wang, H.; Huang, Q. Implement of Five-Level Inverter SVPWM Algorithm Based on FPGA. Chin. J. Power Sources 2015, 39, 2240–2243. [Google Scholar]
  27. Yao, T.; Zheng, S. FPGA Design Space Circular Interpolation Controller and Implementation. Autom.Instrum. 2015, 1, 161–163. [Google Scholar]
  28. Wu, F.; Lv, L.; Chen, R. Based on Analysis of Time Scale Cloud Space Grid Resource Scheduling Algorithm. Compu. Simul. 2015, 32, 131–135. [Google Scholar]
  29. Gao, W.; Wang, W. New Isolated Toughness Condition for Fractional (g, f, n)—Critical Graph. Colloq. Math. 2017, 147, 55–65. [Google Scholar] [CrossRef]
Figure 1. Bridging effect in the flocculation process.
Symmetry 11 01371 g001
Figure 2. Neuron model.
Symmetry 11 01371 g002
Figure 3. Settlement curves of three types of flocculation in total tailings.
Symmetry 11 01371 g003
Figure 4. Comparison of optimized output and expected output.
Symmetry 11 01371 g004
Figure 5. Fitness change curve.
Symmetry 11 01371 g005
Table 1. Particle size composition of unclassified tailings.
Particle Size/mmThe Mass Fraction/%
> 5.000-
2.000 < size ≤ 5.0001.5
0.500 < size ≤ 2.00010.7
0.075 < size ≤ 0.25010.9
0.050 < size ≤ 0.07515.3
0.005 < size ≤ 0.05054.8
≤ 0.0055.2
Table 2. Physical and mechanical properties of unclassified tailings.
ParameterThe Numerical
The proportion of2.79
The median grain d50/mm0.034
Particle size < 74 μm Particle mass fraction75.20
Effective particle size d100.08
Coefficient of unevenness Cu4.7
The permeability coefficient2.8
Table 3. Factor and levels in test.
LevelInfluencing Factor
Flocculation Consumption/(g·t−1) Tailings   Concentration c w / %
T11015
T21520
T32025
T42530
Table 4. Optimization test result of parameters (samples of training).
Experiment No.Flocculent Unit Consumption q/(g·t−1) Tailings   Concentration c w / % Sedimentation Velocity v/(m·h−1)
110151.06
215151.09
320151.07
425151.04
510201.14
615201.22
720201.17
825201.10
910251.00
1015251.30
1120251.27
1225251.14
1310300.90
1415301.12
1520301.02
1625300.99
Table 5. Date of normalization.
Experiment No.Flocculent Unit Consumption q/(g·t−1) Tailings   Concentration   c w / % Sedimentation Velocity v/(m·h−1)
10.1710.3790.008
20.3890.3790.009
30.5860.3790.008
40.7940.3790.007
50.1710.5860.011
60.3890.5860.014
70.5860.5860.012
80.7940.5860.009
90.1710.7940.005
100.3790.7940.018
110.5860.7940.016
120.7940.7940.011
130.1711.0000.000
140.3791.0000.010
150.5861.0000.060
160.7941.0000.005
Table 6. Relative error (%) between the experimental value and the model optimization value.
Serial NumberActual Value of Settlement Velocity/(cm·h−1)Optimum Settlement Velocity Value/(cm·h−1)Relative Error/%
1302.65313.233.5
2167.87172.452.7
3112.56111.321.1
4156.76155.430.8
5213.45215.651.0
6222.45219.891.5
7324.56325.760.3
8325.67332.542.1
9312.35315.260.9
11265.45270.211.7
12225.65228.651.3
13314.32318.211.2
14253.76256.341.0
15235.65237.650.8
16218.76220.120.6

