1. Introduction
The concept of accessibility, which is the opportunity for nodes in network traffic to interact with one another, was firstly proposed by Hansen in 1959 [
1]. From then on, a lot of attention has been paid to researching traffic accessibility in many scientific and professional fields such as economic geography, urban and rural planning, and transportation engineering [
2,
3,
4]. Although there are differences in the theoretical perspectives of different subjects, there is a general definition for traffic accessibility. That is, the degree of convenience of travelling from one place to another by means of a specific mode of transportation.
With reference to spatial scale and research objects, research on traffic accessibility can be divided into two categories: Regional traffic accessibility, and the accessibility of urban public service facilities [
5]. Comparatively speaking, research on the spatial pattern and the temporal and spatial evolution of regional transportation accessibility has made significant progress in China and other countries [
6,
7]; however, relevant research on the transportation accessibility of urban public service facilities started relatively late in China [
8]. As urbanization in China is speeding up, it has become an important and urgent task to evaluate the rationality of the spatial layout of various urban public service facilities or the planning of urban transportation systems based on the measure of traffic accessibility, to promote the optimization of urban development.
The traffic accessibility of hospitals, one of the most fundamental service facilities in the city, is an important aspect to consider when measuring the fairness of the allocation of medical service facilities in the city. In other countries, Higgs and Gould [
9] made evaluations on the traffic accessibility of hospitals by selecting factors such as the number of beds, the number of doctors, transportation supply and population density. Joseph [
10] put forward a potential model when studying hospital accessibility in Wellington Formation of Noble Country, Oklahoma, which was used to characterize the space competition effect on supply and demand. In China, Wang and Zhang [
11] used the Thiessen Polygon Method to initially determine the nearest service area of each residential area in Pudong New District in Shanghai, with the support of a GIS platform. Following this they put the actual layout of the hospitals into these service areas to obtain the accessibility of each hospital. Song [
12] and others revealed the difference in the spatial accessibility of the Hospital of Rudong County in Jiangsu province through the appropriate selection of travel friction coefficients, and the potential model was supplemented with GIS technology. Hou and Jiang [
13] discussed the temporal and spatial distribution characteristics of accessibility between residential districts and hospitals in Changchun city by using the ArcGIS Network Analysis method, and the shortest accessible time and public transportation service frequency were set as evaluation indexes for the characteristics of traffic conditions during off-peak and peak periods.
Currently, eminent progress has been made in Chinese research on hospital traffic accessibility. However, few special studies on hospitalizing accessibility for the elderly focus on the theoretical framework construction and analysis model. With the gradual aging of the Chinese society, the elderly urban population is getting larger [
14], and its health condition is declining every day. As a result, the elderly are bound to become the most urban travel population with the greatest demand for medical services. Meanwhile, the elderly population is still situated at a weak position among other users of the urban transportation system, as their declining physical strength and energy determines their gradual inability to drive both motor and non-motor vehicles. Thus, the elderly have less of a choice when choosing their mode of transportation in comparison with other urban populations.
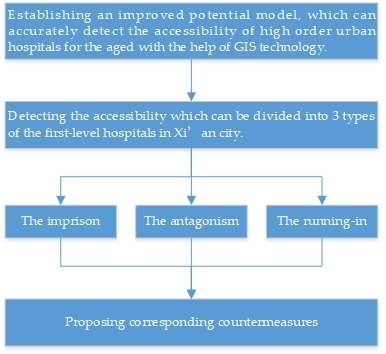
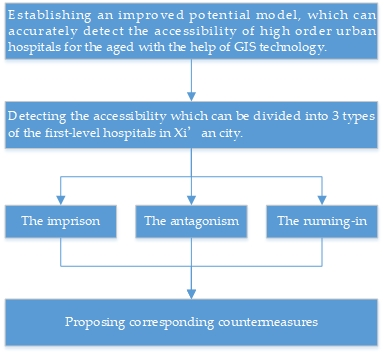
With the aim of paying attention to the disadvantaged elderly groups that are affected by both urban transportation and the construction of a people-oriented urban medical service system, the elderly population was set as a research object for hospitalizing accessibility, and was used to explore the traffic mode preference and travel time characteristics of the elderly. In the secondary development of the Arc-GIS platform and in the specific case of Xi’an City, an effective evaluation method was built for the traffic accessibility of high order urban hospitals (HOUHs) in the city, with the aim of serving the elderly.
This paper tries to establish a new evaluation method for hospitalizing accessibility by adding the trip influences of specific population groups to the traditional model, based on travel facilities. The case study of 45 blocks and 17 HOUHs in Xi’an City shows that the well-served spatial pattern of hospitalizing accessibility for the elderly has been formed. On the other hand, accessibility constraints can still be found for the following reasons: To ensure that targeted countermeasures with regards to urban planning and administration, are taken. However, little consideration is given to population groups other than the elderly (e.g., children and the disabled) in this study, while there is also a lack of sub-classifications of the elderly. Both should be considered in future studies.
2. Background and Concepts
2.1. Potential Model
The potential model is a classic model that uses the laws of gravitation as reference points to study the spatial interaction of social and economic activities. The general connotation is that the energy produced in the system by Object A to Object B is directly proportional to the scale of activity of Object A at its own position, and is inversely proportional to the trip impedance (e.g., distance or time) between the locations of Object A and Object B, while the potential of any point in the system is equal to the sum of the potential produced by each object to that point [
15]. The formulas for applying the potential model to study hospitalizing accessibility are:
In Formula (1) Ati is the cumulative attraction value for all the hospitals in the research area to the research unit i; Mj stands for the service ability of the hospital, which is mostly expressed by the number of health personnel or beds in the hospital; Dkj stands for trip impedance between the research unit i (such as residential area or block) and the hospital (j), which can be described by the travel distance or travel time between the origin and the destination; Pk indicates the number of populations for research unit k; Vj stands for the influencing factor of the population size; β denotes the travel friction coefficient; and n and m, respectively, represent the number of hospitals and research units. The greater the value of Ati is, the better the spatial accessibility will be. Therefore, as trip impedance (Dkj) increases, Ati will decrease accordingly.
2.2. Trip Impedance
How to measure trip impedance is the key to building a traffic accessibility evaluation method based on a potential model. When measuring regional accessibility [
16,
17], due to the large research scale, the research object can usually be abstracted as a particle, and the linear distance between point pairs can be used to approximately calculate the degree of trip impedance. The difference is that travel paths are usually blocked by various buildings and occur on many tortuous urban roads on the microscopic interior scale of the city. Therefore, some researchers [
18,
19] have proposed a method to define trip impedance by searching the shortest path of urban roads. In addition, some researchers [
20,
21] have noticed that factors such as city road grades and road conditions may affect the traffic speed of the road itself, which may in turn influence the traffic accessibility measurement. Thus, it is suggested that the travel time obtained by stacking the travel distance and the travel speed, should be the fundamental basis for determining trip impedance.
There are two main characteristics for the urban elderly traveling to HOUHs [
22]. Firstly, they usually take vehicles that do not require autonomous operation. In the case of major diseases, the elderly need to take public transportation to HOUHs for medical treatment. In other cases, they will walk to low-grade hospitals or clinics for treatment when they have ailments. Secondly, the travel time distribution does not coincide with the morning and evening peaks of urban vehicles. With the widespread promotion of expert online appointment registrations in HOUHs, the elderly are more inclined to decide their appointment time for medical treatment hospitals accord to their daily schedules.
Under the constraints of the above travel characteristics, not only must the simple representation method for measuring the linear distance be eliminated, but also the idea of measuring the shortest path or the travel time on urban roads cannot be adopted to determine trip impedance because public transport cannot completely follow the shortest route to enable the elderly to go to HOUHs. On account of safety, buses are also required to pass on various grades of urban roads at stable, medium, and low speed. Only when there is traffic congestion during rush hour in the morning or evening, will there be an obvious reduction in speed. For this sake, the distribution of public transportation lines is used as the basis for studying trip impedance, and a traffic accessibility evaluation model is set up for HOUHs which serve the elderly.
2.3. The Improved Potential Model Based on the Trip Impedance of Public Transportation
The calculation formula of trip impedance expressed by public transportation lines is:
In Formula (2) ai indicates the length of the i-th bus line from the target hospital to the target research unit, wherein the bigger ai is, the longer the length between the hospitals to the target research unit is, and the stronger road resistance will be; bi stands for the length of the bus line inside the target research unit, wherein the bigger bi is, the longer the length of the bus line inside the target research unit will be and the weaker the road resistance will be; L indicates the total length of the roads that the public transportation lines can pass through in the target research unit; bi/L indicates the overall usage of the roads that public transportation lines pass through in the target research unit; and m indicates the number of bus lines connecting the target hospital to the target research unit.
If there is no direct bus line to the hospital in the target research unit, the elderly in the research unit will need to transfer to other research units for public bus lines when seeking medical treatment. At this time, the trip impedance of the current target research unit will be converted from the trip impedance of other research units. The calculation formula is:
In Formula (3), when the transfer condition coefficient T1 = 1.5, it indicates that the bus line cannot reach the target research unit directly from the target hospital, but that it can reach the adjacent research unit of the target research unit. The trip impedance of the target research unit is converted from the road resistance (D′bus) of the research unit with the largest number of bus lines to the adjacent research unit. When the transfer condition coefficient T2 = 2, it indicates that there is no bus route from either the target hospital to the target research unit or to neighboring research units. The trip impedance of the target research unit is converted from the road resistance (D″bus) of the research unit that is the nearest to its geometric center, where there is a bus route to the target hospital. The values of D′bus and D″bus are still calculated according to Formula (2).
According to the analysis and improvement of trip impedance, the potential model for the traffic accessibility evaluation based on trip impedance is:
In Formula (4) Aci indicates the traffic accessibility of the HOUHs, which serve the elderly population in research unit I; Mj indicates the number of beds in high order urban hospitals (j); Dbus-ij indicates the bus trip impedance between research unit i and the high order urban hospital; Pk indicates the number of elderly population in research unit k; Vj indicates the influence of the coefficient on the size of the population; and n and m, respectively, represent the number of HOUHs and research units.
4. Results and Discussion
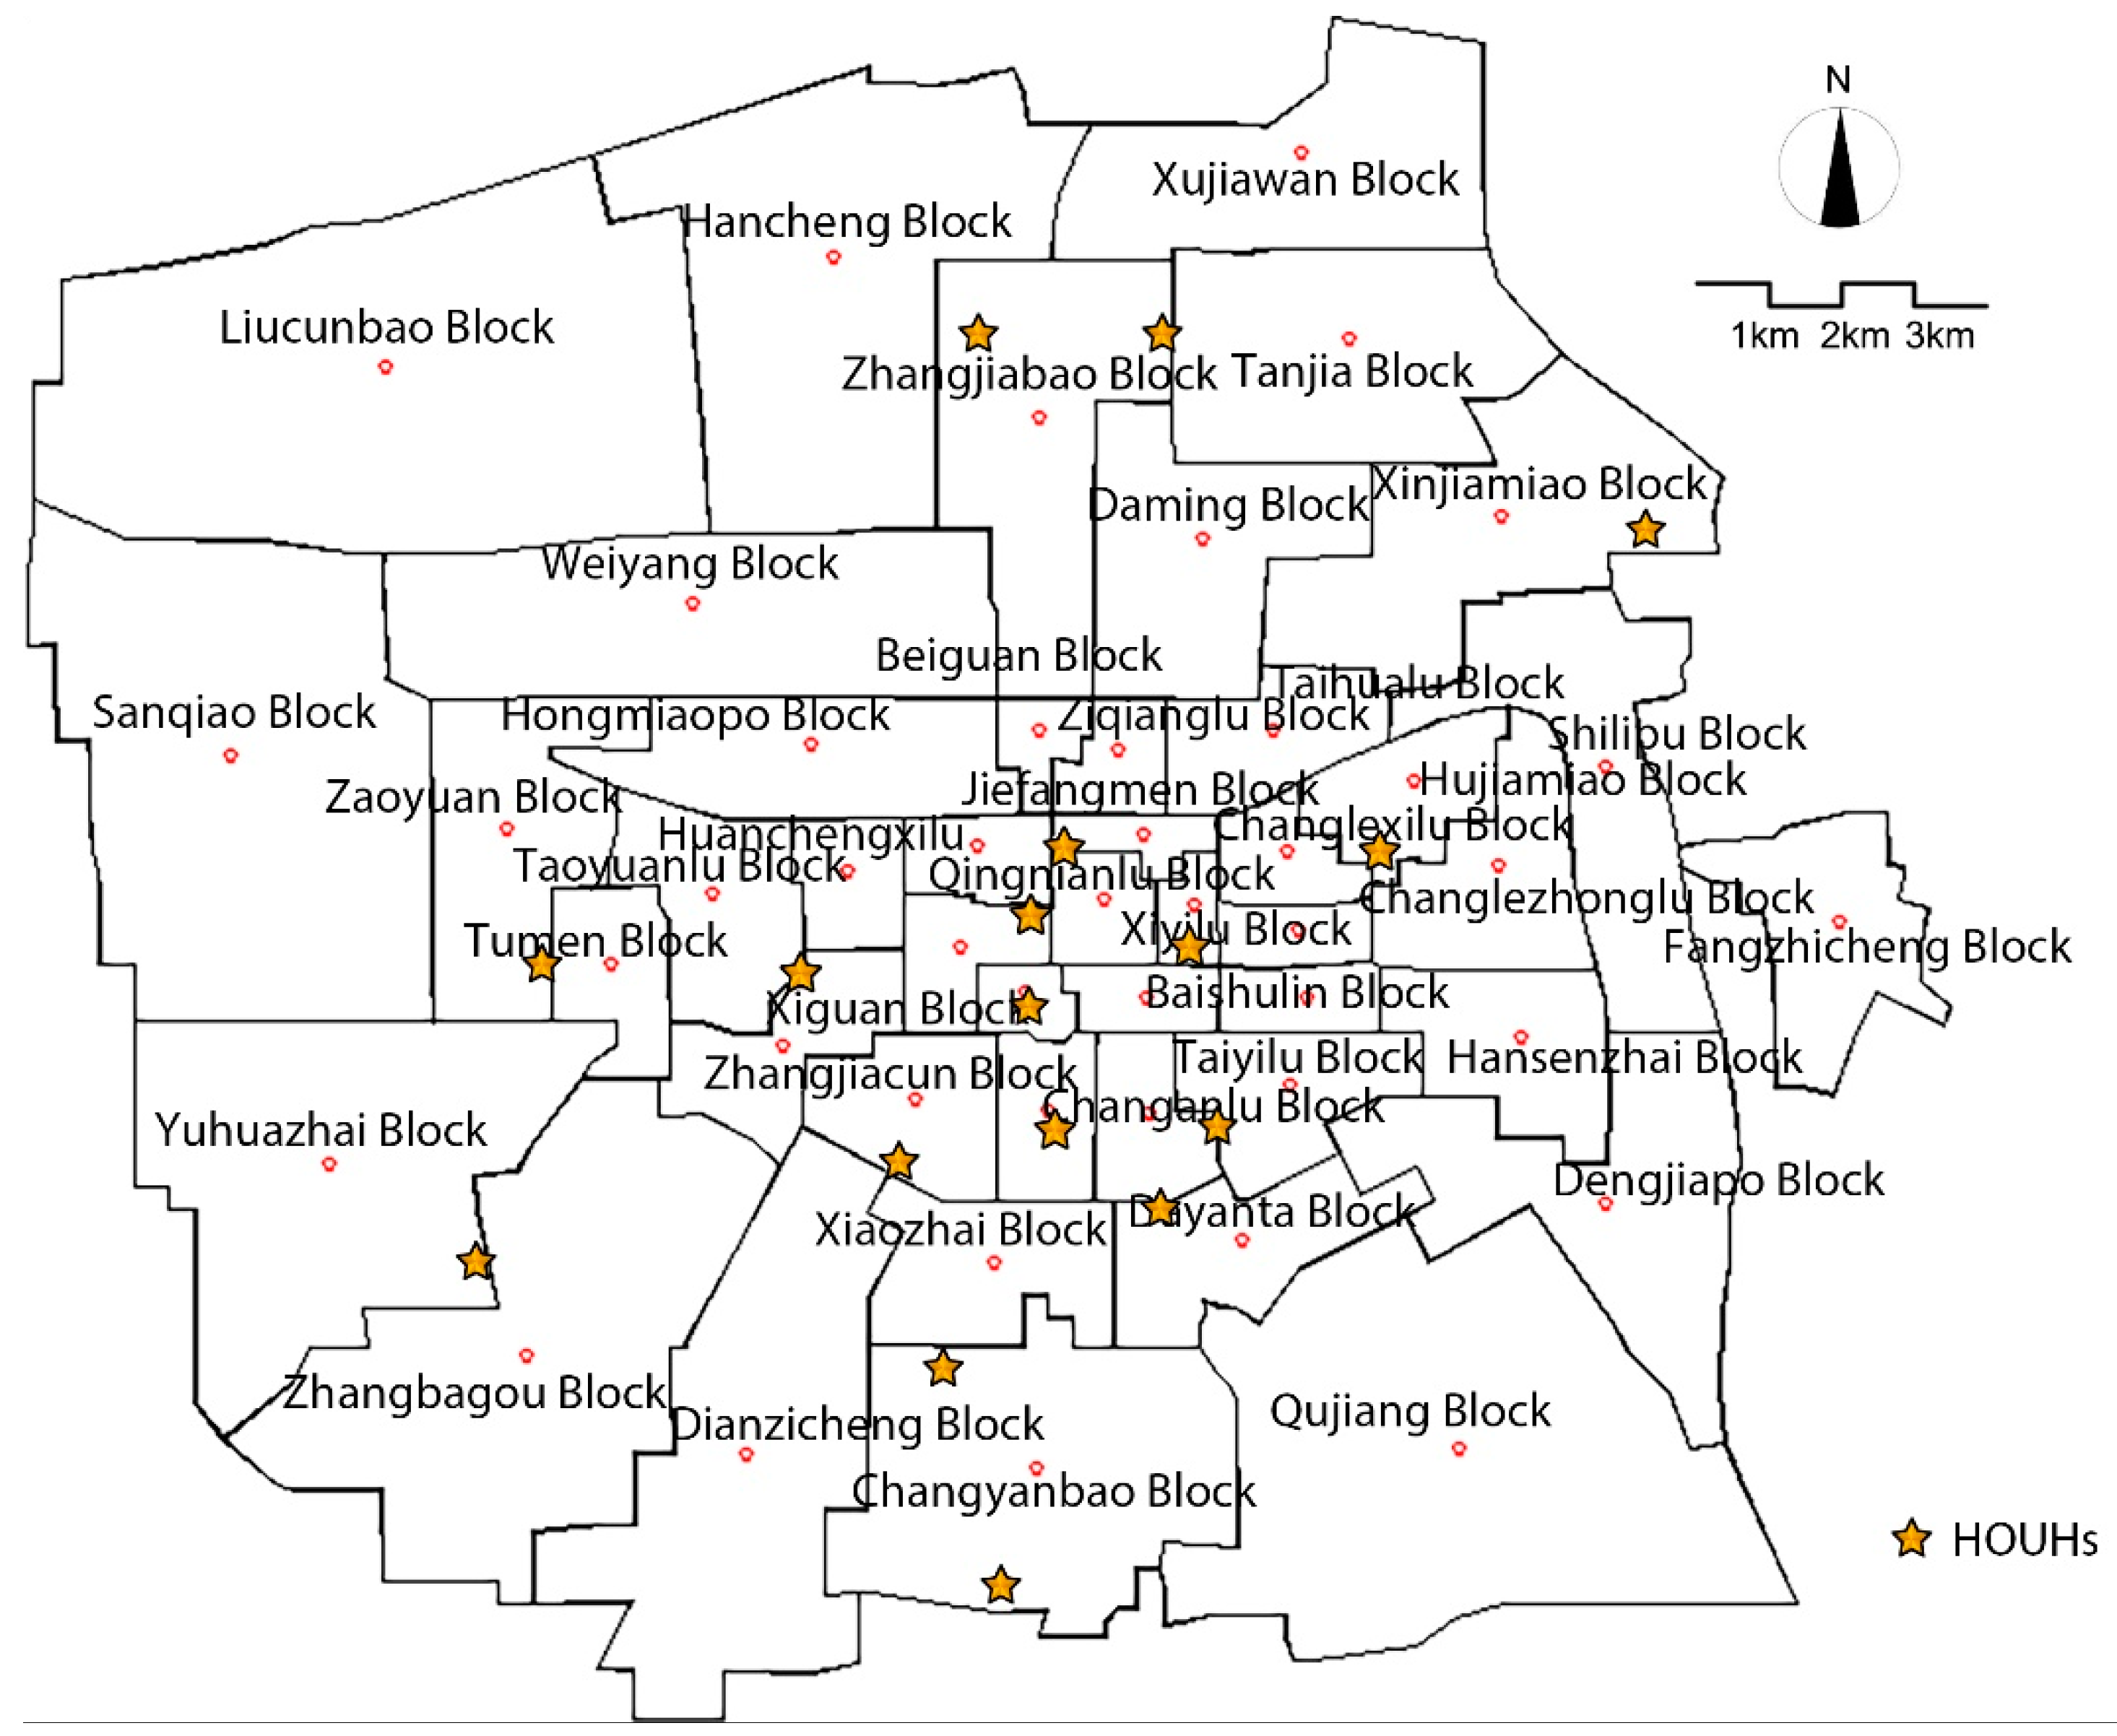
4.1. The Traffic Accessibility is Significantly Attenuated from the Center of the City Based on Linear DistanceTrip Impedance
The hospital location data set up in
Section 2.2 were imported into the common potential model of Formula (1) to measure the traffic accessibility level of HOUHs based on linear distance trip impedance. This was used as a basis and a reference point for further analysis. Linear distance impedance was calculated by using ArcGIS engine and using c# language under the net environment. Then, ArcGIS desktop products were used to solve elements related to accessibility, and visually expressed them. The results are shown in
Figure 2.
Under the condition that trip impedance is characterized by a straight-line distance, the common potential model reveals that the traffic accessibility of HOUHs in Xi’an is significantly attenuated from the center of the city. Research units with intermediate and higher accessibility levels in the inner urban area become smaller, and overall traffic accessibility of the peripheral urban research units is poor. However, the blocks in the southern part of the city have slightly higher accessibility.
The reason for this phenomenon is that Xi’an has formed a typical single-core urban spatial structure in its urbanization [
26], which has led to the concentration of HOUHs in mature areas to undergo long-term urbanization development. Once a hospital is far away from the core areas in Xi’an, accessibility decreases rapidly. In addition, it should be noted that the planning and construction of HOUHs usually lags behind the development of cities. In newly urbanized areas, although land use planning includes land use arrangements for hospitals, most of the newly established hospitals cannot become HOUHs in a short period of time and have to experience long-term construction. Therefore, solely increasing the projected location of hospitals alone cannot completely solve the unfavorable situation of the low accessibility of HOUHs in cities. Thus, it is still necessary to study advantageous countermeasures using other factors.
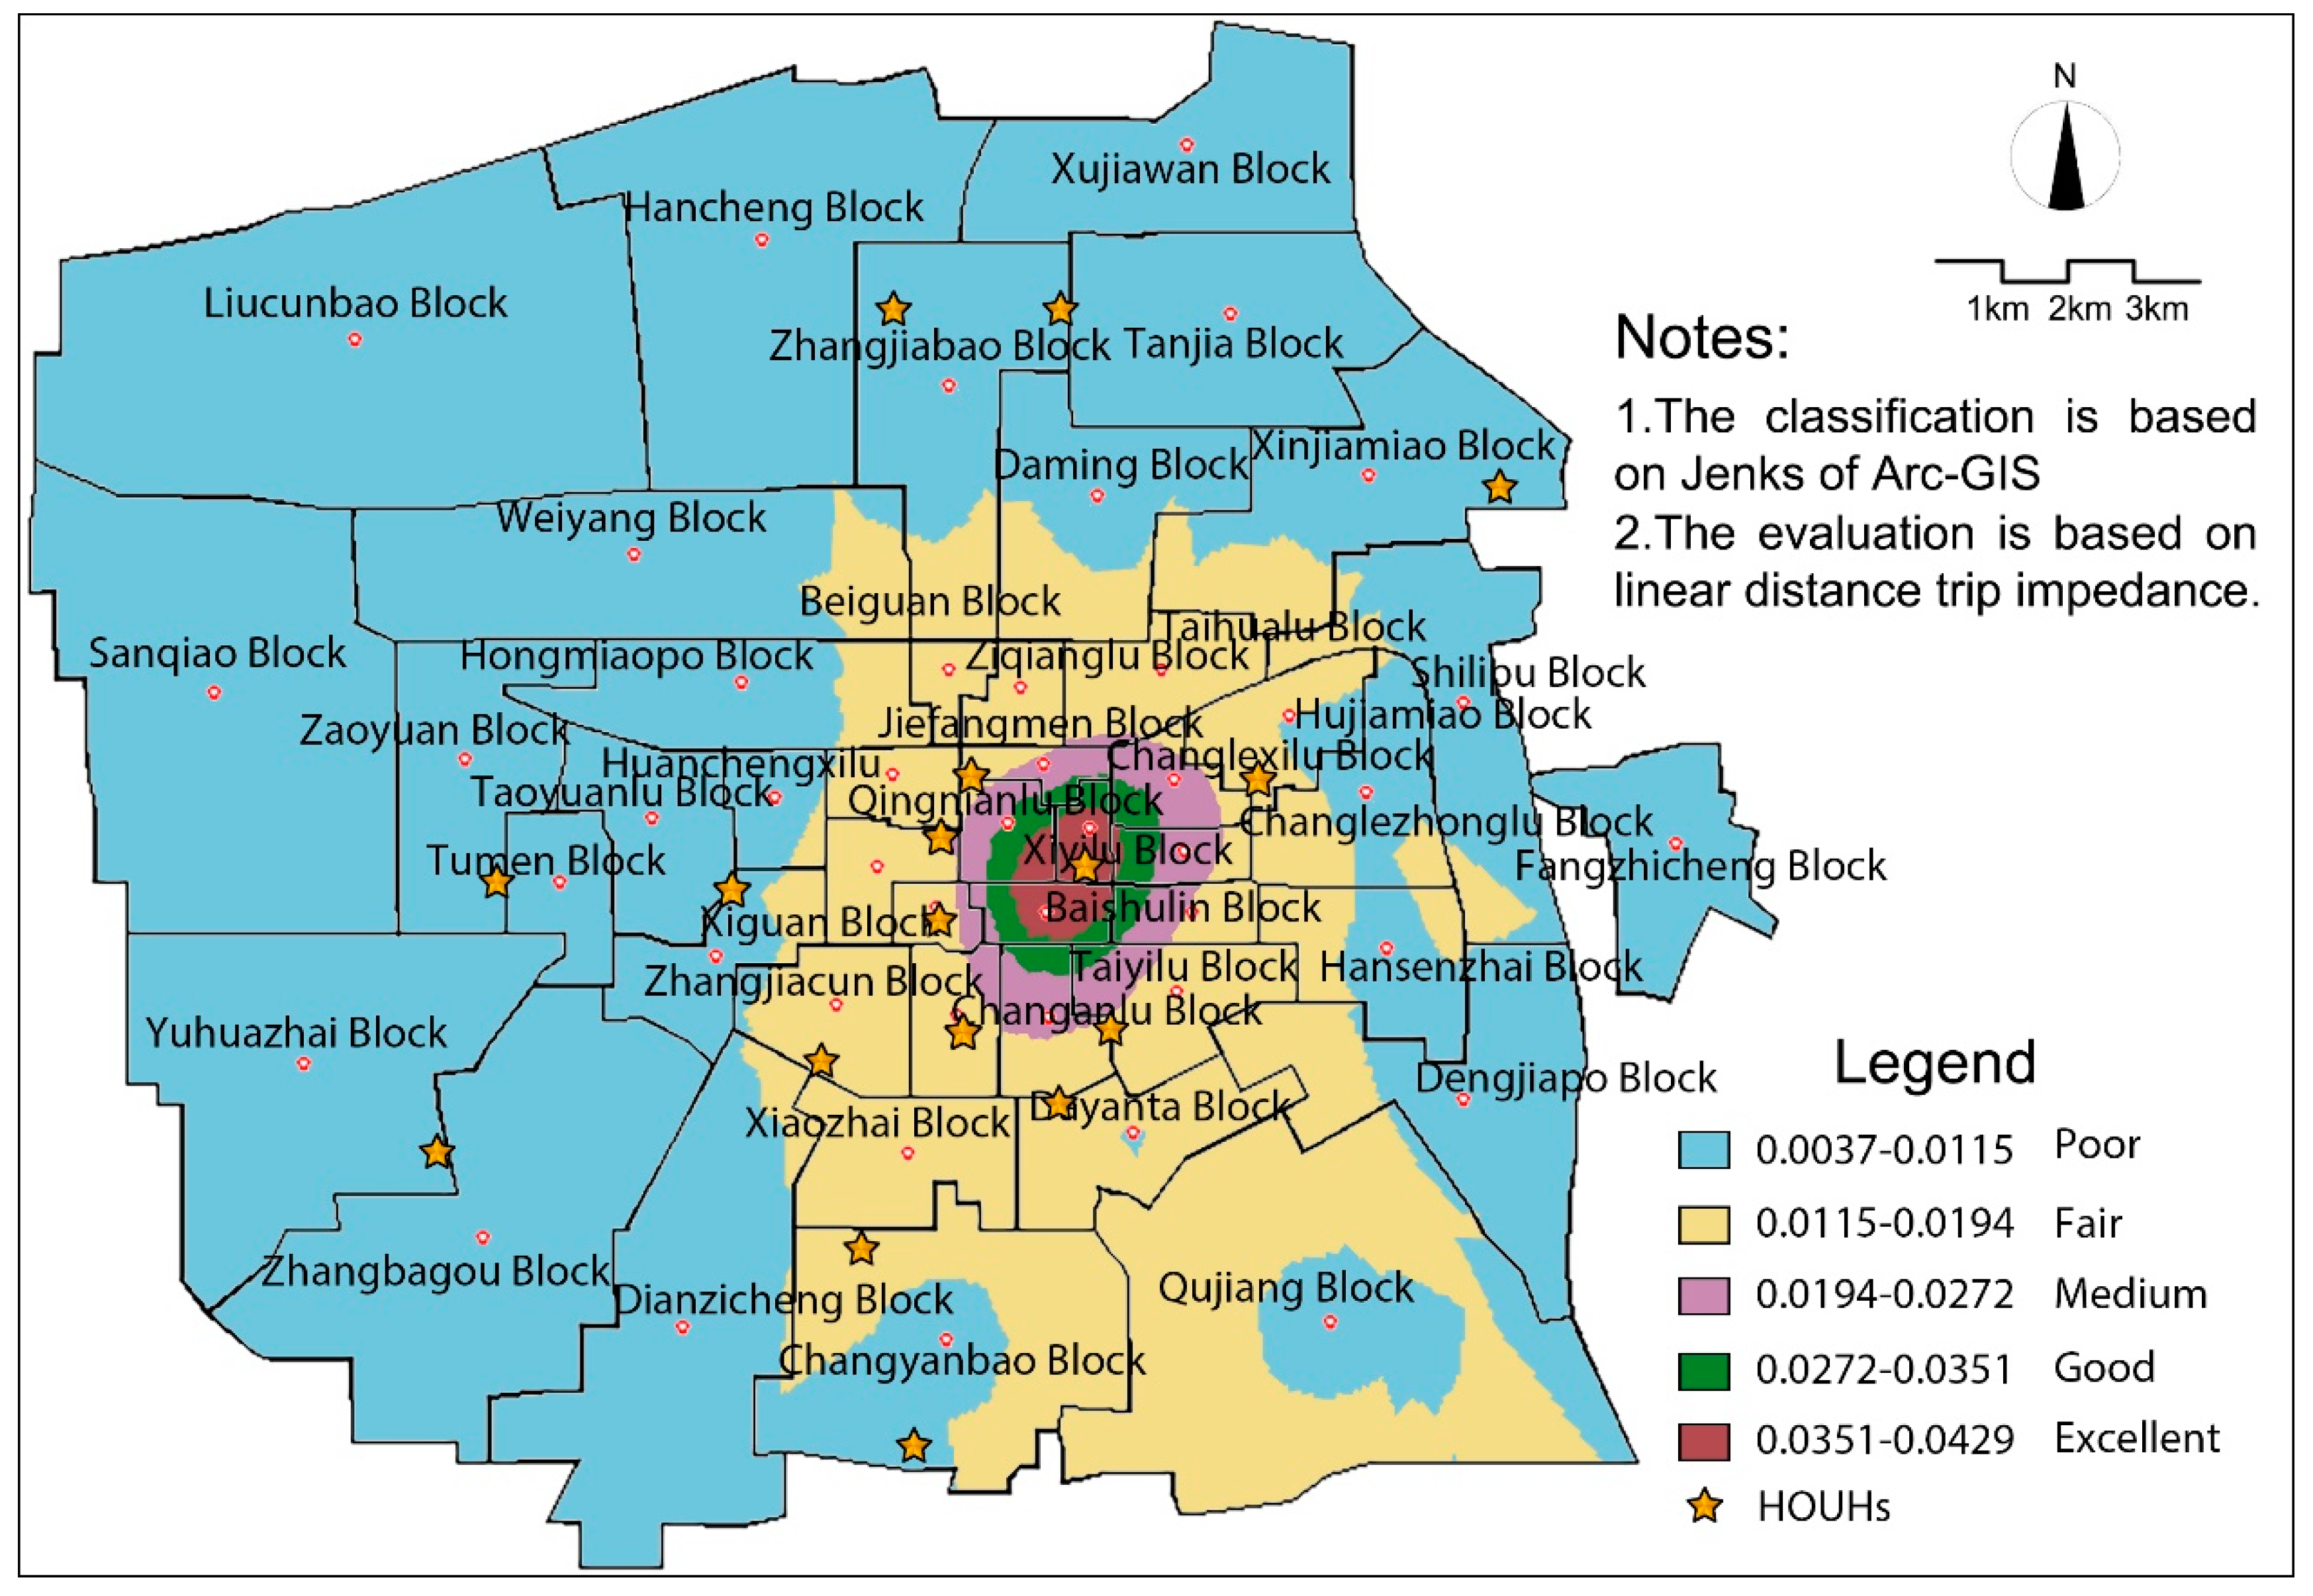
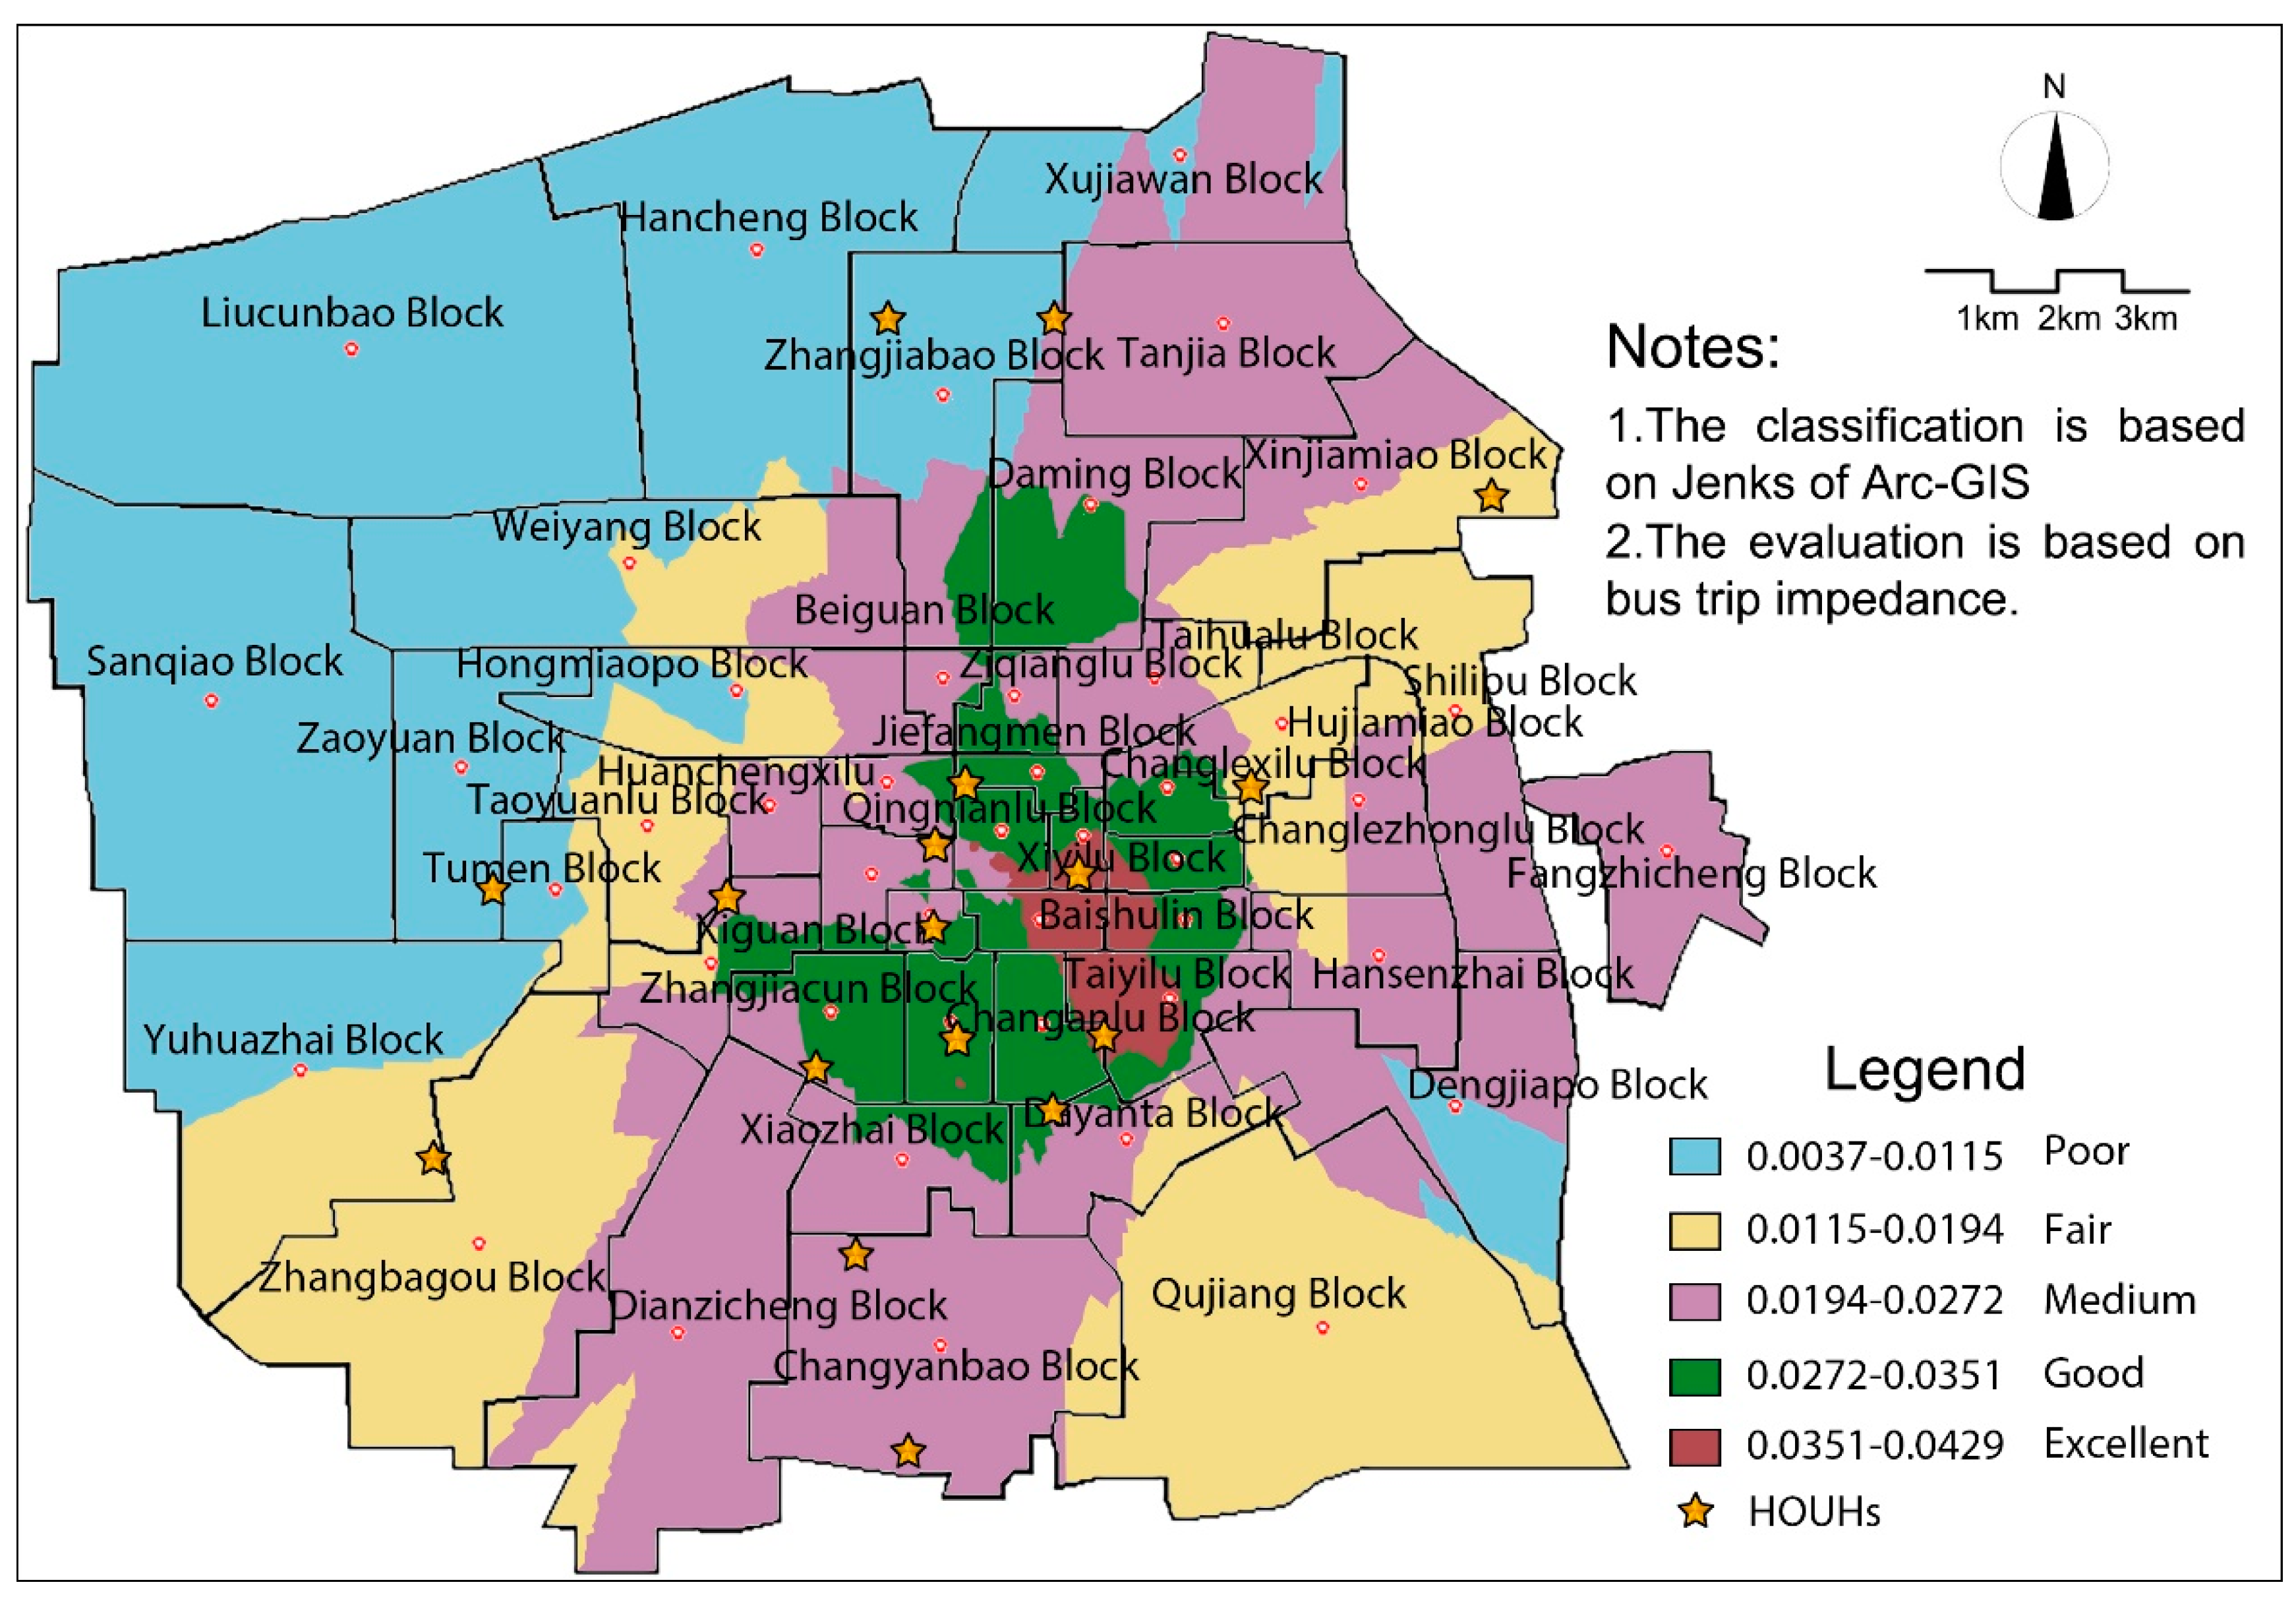
4.2. “North–South Connectivity and Eastward Extension” Is Formed Based on Bus Trip Impedance
In order to accurately measure the traffic level of hospitalizing accessibility for the elderly, a program was created to determine bus trip impedance parameters by Microsoft Visual Studio 2018, a secondary development platform based on GIS. Using this, various related parameters were imported into the improved potential model of Formula (4), after which the ArcGIS software platform was used to solve and visually express traffic accessibility. The results are shown in
Figure 3.
Under the condition that public transportation lines are used to represent trip impedance, the distribution pattern of traffic accessibility to HOUHs no longer presents circle-shaped characteristics, which can be reflected by the measurement results of the improved potential model. Instead, research units with medium or high accessibility levels generally form a new spatial pattern of “North–South Connectivity and Eastward Extension” (
Figure 3). The formation of this pattern has benefited from a recent and vigorously promoted strategy—“Public Transportation Metropolis”, which was set up by Xi’an. Due to the increasing number of public transportation services, it is convenient for the elderly to take public transportation to HOUHs for medical treatment using the urban transportation system in Xi’an. Although the location has not changed, the transportation accessibility of HOUHs for the elderly has still greatly improved.
In the empirical study of accessibility which is based on bus trip impedance, some blocks’ accessibility is still below the medium level. Due to urban planning and construction, the causes are classified as low accessibility.
The first type of accessibility is the imprisonment. This research unit is in fact a non-developable area (e.g., a humanity or nature relics reserve) in which infrastructure construction such as roads and so on, are restricted. As a result, there are no conditions for large-scale operations of public transport vehicles, nor are there any locations of HOUHs.
The second category is the antagonism. Most of the research units of this type are newly developed areas in the city. Various municipal infrastructure constructions including urban roads, should still be improved, otherwise this may hinder the future allocation of medical service facilities, and the operational planning of public transportation lines.
The third category is the running-in. This unit is a new urban area with certain developments, in which internal municipal infrastructure construction is relatively complete. However, the hospitals and public transportation services in this area have not yet matched the level of development and infrastructure construction in urban areas, and still need to be improved.
Based on the analysis of the causes and types of low-value performance of traffic accessibility in the HOUHs above, the block units with a poor accessibility evaluation in Xi’an (shown in
Figure 3) can be classified, after which valid countermeasures can be put forward, as shown in
Table 1.
5. Conclusions and Prospect
As the elderly, a weak group in the urban transportation system, is considered, a traffic accessibility evaluation method for HOUHs is proposed, based on the principle characteristics of their hospitalizing trip. In this theory, bus trip impedance is set as the core improvement content, and the first-level hospitals in Xi’an are used as examples to carry out the corresponding empirical research. Research shows that the location of the hospital determines the level of accessibility, however, the traffic conditions connecting the hospital to its patients are also important aspects that cannot be ignored in the accessibility evaluation. Due to the lack of travel approaches for medical treatment and the elderly’s high dependence on hospitals, it is important to effectively detect and improve the public transportation links between the blocks in which the elderly live and HOUHs, in order to implement a “people-oriented” principle in urban transportation planning. Through the empirical study of Xi’an City, various factors which restricted the rise of hospitalizing accessibility were resolved, and categorizing urban blocks based on these factors has become an important basis for adopting planning methods to deal with the problem of low accessibility.
Compared with other research [
27], more historical and cultural textures of Xi’an were employed to evaluate and analyze the accessibility calculation results in this paper, including the control and relocation to the site of Chang’an of the Han Dynasty according to world culture heritage protection. Meanwhile, the methods were designed in theory for the trip characteristics of special population groups, and also to fill in the missing data of accessibility measurements for metropolitan hospitals in Western China. Moreover, the traditional accessibility studies which were only based on travel facilities, was improved through paying attention to the influence of specific population groups and their modes of travel. Thus, current knowledge of traffic accessibility was refined through writing this paper.
However, little consideration was given to population groups (e.g., children and the disabled) other than the elderly when choosing the HOUHs for medical treatment. Additionally, walking to adjacent primary medical institutions may be more apt for the elderly when they develop common ailments. Therefore, with an increasing number of specific population groups, exploring the traffic accessibility measurement method for community health institutions which serve the elderly, should be carried out in future studies.


