Article

Spatiotemporal Heterogeneity and Influencing Factor of Trade-Offs and Synergies Among Land-Use Multifunctions in the Long March National Cultural Park, China

1
College of Landscape and Horticulture, Yunnan Agricultural University, Kunming 650201, China
2
School of Urban Construction and Ecological Technology, Shanghai Institute of Technology, Shanghai 201418, China
*
Author to whom correspondence should be addressed.
Land 2026, 15(4), 551; https://doi.org/10.3390/land15040551
Submission received: 23 February 2026 / Revised: 24 March 2026 / Accepted: 25 March 2026 / Published: 27 March 2026
(This article belongs to the Special Issue National Parks and Natural Protected Area Systems)

Abstract

Spatiotemporal heterogeneity of land-use multifunction (LUMF) is crucial for the preservation and management of large-scale national cultural parks in alleviating potential human-land conflicts. Using 28 multidimensional indicators across economic, social, and environmental dimensions, this study established an LUMF index system for the Long March National Cultural Park of China (CLMNCP). LUMF values for 77 prefecture-level cities were quantified from 2008 to 2023, and their spatiotemporal heterogeneity was examined using a spatial autocorrelation model. Subsequently, the Optimal Parameters-based GeoDetector (OPGD) model was applied to identify key driving factors. The main findings are as follows: (1) From 2008 to 2023, the total, economic (EF), social (SF), and environmental (EnF) functions in the CLMNCP exhibited a consistent upward trend. (2) Significant spatial heterogeneity characterized the trade-offs and synergies among these functions. The EF-EnF interaction displayed a concave synergistic relationship, while the EF-SF and SF-EnF interactions showed convex, fluctuating patterns during their transitions between trade-off and synergy. (3) The primary drivers varied across function pairs. The EF-SF synergy was predominantly influenced by agricultural production, resource supply, and cultural service factors. The EF-EnF interaction was mainly shaped by natural conditions and environmental improvement factors. In contrast, the SF-EnF interaction was primarily driven by economic development, cultural services, and resource supply. These findings support functional zoning and targeted management of large-scale national cultural park to balance development and conservation while reducing human-land conflicts.

1. Introduction

The national cultural park of China (CNCP) represents a seminal initiative in constructing a national symbolic system, synthesizing the nation’s profound historical heritage and extensive cultural continuity. As one of the first five such parks, the Long March National Cultural Park (CLMNCP) is conceptualized as a linear cultural landscape grounded in the historical authenticity of the Chinese Red Army’s Long March and spatially defined by its route and associated heritage assets. Since its inception in 2019 under The Long March National Cultural Park Construction and Protection Plan [1], the 15 provincial-level administrative divisions involved have pursued integrated conservation through inter-regional synergy, with development efforts strategically directed towards four principal functional zones: conservation and management, thematic interpretation, cultural-tourism integration, and traditional utilization.
In practice, the coordination and optimization of these thematic functional zones confront persistent dilemmas. The vagueness of protection boundaries caused by the overlapping of thematic functional areas has overwhelmingly dominated the dilemmas of preservation and development confronting this unique national cultural park of China [2]. Even qualitative analysis methods remain the dominant approach for exploring the spatial relationships of thematic functional zonation in the CLMNCP [3], while optimization and management strategies based on quantitative geo-statistical spatial analysis of multiple land functions are rare. However, the coordination and optimization of thematic functional zones in the CLMNCP must be fundamentally supported by the evaluation of land use multifunction (LUMF) [2,4]. While a mature methodological framework integrating Entropy-TOPSIS, GeoDetector, and spatial autocorrelation has been explicitly applied in LUMF research [5,6,7,8,9], its application to CNCP has remained largely unexplored. Empirically, although quantitative tools, including Coupling Coordination Degree Model (CCDM), Minimum Cumulative Resistance Model, and Circuit Theory have recently been introduced into CNCP or large-scale cultural landscape studies [10,11,12], their application has been fragmented and predominantly focused on planning-oriented functions (e.g., conservation, presentation, tourism). Critically, the dynamic trade-offs/synergies among multiple functions underlying park zoning lack quantitative attribution analysis. Consequently, a fully integrated analytical chain—evaluation, diagnosis, attribution, and optimization—remains absent in CNCP scholarship. Therefore, this research gap highlights an urgent need for novel models to extensively quantify and scientifically analyze LUMF at the cross-regional scale that this national park encompasses.
Globally, protected areas—whether iconic national parks like Yosemite, heritage corridors like the Camino de Santiago, or transnational routes like the Silk Roads—face a persistent dilemma: balancing heritage preservation and ecological integrity against mounting pressures from tourism, infrastructure, and local communities [13,14]. These pressures trigger profound ecological consequences—habitat fragmentation, disrupted wildlife corridors, soil erosion, and vegetation degradation—undermining their function as socio-ecological systems [15,16]. National parks worldwide exemplify management challenges directly aligned with this study’s core problem: the tension between visitor access and ecological carrying capacity [17]; tourism encroachment into core zones [18]; landscape connectivity under land-use change [19]; and conflicts between conservation and local livelihoods [20]. These challenges intensify in linear parks, where administrative fragmentation impedes integrated management [21]—a predicament that resonates with the cross-regional governance structure of the CLMNCP.
Critically, these global challenges reflect trade-offs and synergies among competing land use functions—the core analytical domain of LUMF. From habitat-protection conflicts in Yosemite to cross-regional dilemmas in the Silk Roads, each case fundamentally involves optimizing ecological, social, economic, and cultural functions across heterogeneous landscapes. A persistent gap across protected areas is the lack of quantitative tools to anticipate functional conflicts before they emerge. Traditional qualitative approaches remain reactive—addressing degradation after occurrence—creating a temporal disconnect between landscape change and management response [22]. The analytical utility of LUMF transcends any single national policy context. Its core categories—ecological, social, economic, and cultural functions [7,8]—constitute universally recognizable constructs applicable to any protected landscape or heritage corridor. Although the nomenclature of functional zones varies (e.g., “recreation zone” in US National Parks, “buffer zone” in UNESCO World Heritage sites, versus “cultural-tourism integration zone” in China), the underlying functional trade-offs remain analytically analogous. Whether mitigating visitor pressure in UNESCO World Heritage sites, negotiating local livelihoods with conservation imperatives in European cultural routes, or managing infrastructural encroachment along heritage corridors in North America, practitioners grapple with a fundamental optimization problem: the allocation of competing land uses across space and time. Consequently, the LUMF framework functions as a universal analytical lexicon—translating context-specific management dilemmas into measurable, comparable, and modelable scientific variables amenable to cross-cultural and cross-geographical interrogation. This study addresses that gap by integrating Entropy-TOPSIS, spatial autocorrelation, and Geo-Detector to quantify the spatiotemporal dynamics of LUMF trade-offs and synergies. The result is a transferable analytical framework that converts complex challenges into measurable, spatially explicit, and causally tractable assessments—empowering managers with a proactive tool for adaptive governance.
The intrinsic conceptual alignment between CNCP attributes and LUMF theory renders the latter particularly applicable for the Chinese context. As composite spatial governance units, CNCP are endowed with intersecting mandates—heritage conservation, interpretation, education, and cultural tourism—necessitating that land concurrently support multiple socio-cultural and ecological functions [23]. LUMF provides the requisite methodology to articulate, measure, and optimize these composite functions. Practically, optimizing CNCP’s four principal functional zones fundamentally entails differentiated spatial allocation of land use functions [2]: the conservation zone prioritizes ecological and cultural preservation, while the thematic interpretation zone emphasizes socio-cultural services—precisely the core research agenda within LUMF. Managerially, intractable tensions—heritage preservation versus tourism development, economic imperatives versus landscape continuity—manifest as trade-offs among competing land use functions. Furthermore, LUMF shares deep intellectual roots with cultural heritage conservation and cultural landscape management (CLM), grounded in the premise that landscape is an adaptive, organically evolving system shaped by the complex interaction between natural processes and human activity [24]. Both paradigms move beyond isolated, static conservation. Cultural landscape theory conceives heritage as “combined works of nature and human” [24], a holistic epistemology operationalized by LUMF, which frames land as a socio-ecological arena delivering ecological, productive, and socio-cultural functions [25]. Regarding organic evolution, CLM advocates “managing change” to sustain heritage values [26,27], a doctrine concomitantly operationalized by LUMF through analyzing evolving trade-offs and synergies among land-use functions [5,6,25]. Consequently, integrating LUMF into CNCP research represents not merely a theoretical extension but a pragmatic intervention responsive to the exigencies of park governance.
This study addresses the identified gaps by integrating Entropy-TOPSIS, spatial autocorrelation, and GeoDetector to quantify the spatiotemporal dynamics of LUMF trade-offs and synergies within the CLMNCP. Methodologically, the “evaluation-coupling-detection” paradigm—comprising Entropy-TOPSIS, CCDM, and GeoDetector—has been systematically established in LUMF research to address three fundamental questions: functional performance, functional interactions, and drivers of spatial heterogeneity [5,6,7,8,9,28]. This study constructs a fully integrated analytical chain specifically tailored to the linear heritage characteristics of the CLMNCP, converting complex governance challenges into measurable, spatially explicit, and causally tractable assessments—empowering managers with a proactive tool for adaptive governance.
In summary, this study used the CLMNCP as a case study and integrated the improved entropy-weighted TOPSIS model, Spearman correlation analysis, spatial autocorrelation model, and Optimal Parameters-based GeoDetector model to explore the spatiotemporal heterogeneities of land-use multifunctional trade-offs/synergies and their influencing factors. The specific research aims include: (1) To quantify and evaluate the spatiotemporal variation characteristics of land-use multifunction (LUMF) in the CLMNCP from 2008 to 2023; (2) To elucidate the spatiotemporal heterogeneities of LUMF trade-offs/synergies; (3) To identify the dominant influencing factors of LUMF trade-offs/synergies in the CLMNCP.

2. Study Area and Data Source

2.1. Study Area

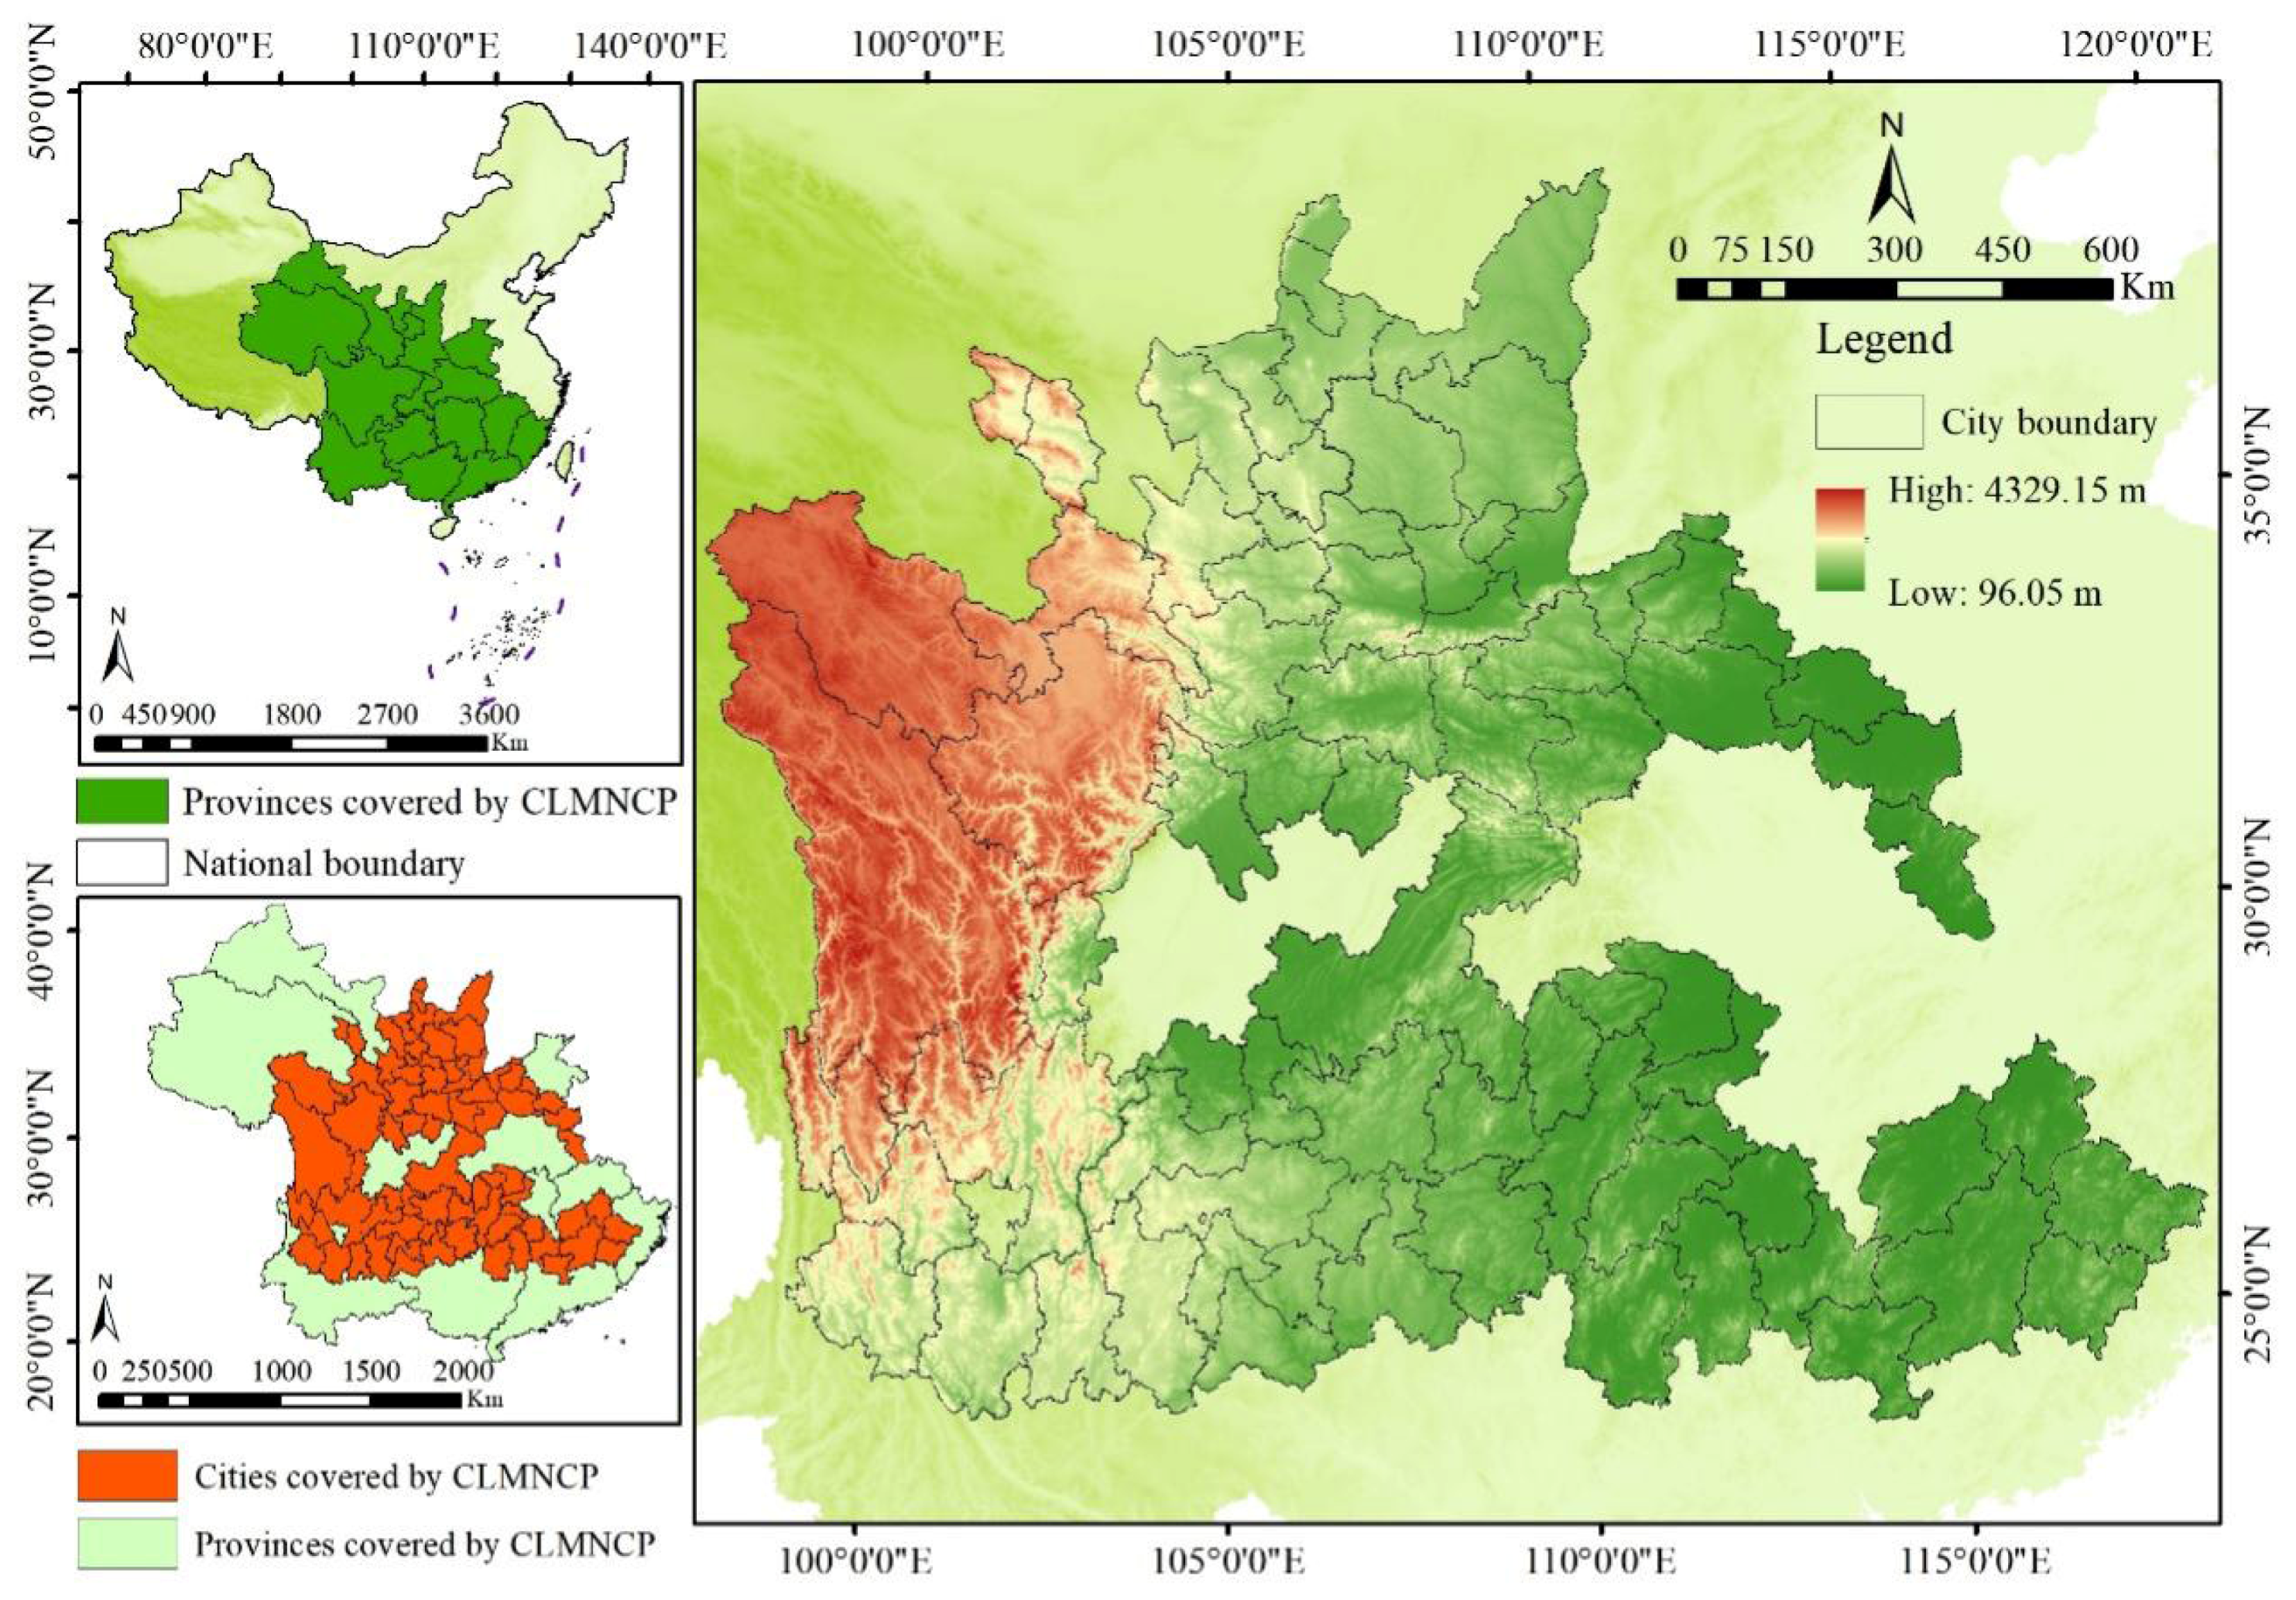
Located in central and southwestern China (99°45′ E–118°39′ E, 23°27′ N–39°34′ N), the CLMNCP spans 15 provinces and 77 prefecture-level cities, covering approximately 1,803,456.03 km2. This area encompasses a complex geographic environment that traverses China’s three-tiered terrains, including the Yunnan-Guizhou Plateau, the middle reaches of the Yangtze River Plain, and the intersections of the Tibetan Plateau with the Shanxi-Shaanxi Loess Plateau, thereby fostering the richest and most diverse ethnic and regional cultures (Figure 1).
The elevation of the park increases from 96.05 m in Henan Province in the northeast to 4329.15 m in Qinghai Province in the northwest, characterized by substantial elevational differences and diverse topographic features that can be categorized into three types: alpine zones, mountainous or hilly areas, and plains/basins. Furthermore, the study area is located within the crucial Yangtze River Basin, playing a pivotal role as a key ecological control and optimization zone for national ecological security. It is also home to numerous large plateau and plain lakes, including Qinghai Lake, Poyang Lake, and Dongting Lake, as well as river basins such as the Yangtze River, Yellow River, Xiang River, and their tributaries. This district enjoys a relatively mild climate, with an annual average temperature ranging from 6.59 °C to 24.82 °C and annual average precipitation ranging from 143.69 mm to 1824.83 mm. Specifically, as a crucial area within China’s Yangtze River Economic Belt, the rapid urbanization, economic growth, and high-intensity human activities have profoundly affected its land use forms and structures. Agricultural and eco-environmental lands have been gradually encroached upon by urban construction and socio-cultural service infrastructures, leading to ecological fragility and fragmented farmland, and posing tremendous challenges to the coordinated development of various land-use multifunctions.
The CLMNCP exemplifies these global challenges. As a linear cultural landscape spanning 15 provinces, it embodies the cross-regional coordination complexities inherent to heritage corridors—a governance predicament pervasive in multi-jurisdictional protected areas worldwide. Its mandate, integrating conservation, interpretation, tourism, and traditional use, encapsulates the preservation-utilization paradox confronting protected areas from Yosemite to the Camino de Santiago [18,29]. Intensifying pressures from infrastructure, tourism, and urbanization [29,30,31,32] mirror the “lagging issue”—the temporal disjuncture between landscape change and managerial response [33,34,35,36]—driving encroachment into agricultural and ecological lands and generating precisely the functional trade-offs this study diagnoses. Its explicit functional zonation thus offers an ideal laboratory for operationalizing LUMF frameworks to quantify and optimize trade-offs among sociocultral and natural functions. It is therefore essential not only for the CLMNCP’s sustainable preservation, but also for informing adaptive governance of multifunctional landscapes in analogous protected area systems worldwide.

2.2. Data Source

This study incorporated multiple data types, including socioeconomic, meteorological, demographic, remote sensing (DEM), air and environmental quality, water resource, and land use data. Detailed information on data sources is provided in Table 1.

3. Theoretical Concept and Research Methods

3.1. Theoretical Concept of LUMF

3.1.1. Identification of LUMF

Land-use Multifunction represents a tangible expression of the composition and structure of the man-earth areal system [25]. It refers to the goods and services provided by different land uses, encompassing the most relevant economic, social, and environmental issues of a specific region [37]. LUMF is typically classified into three main functions: economic, social, and environmental [38], or, alternatively, into producing, living, and ecological functions as conceptualized in the European project “SENSOR” [39]. This concept has rapidly expanded into the realms of ecosystem services [40,41], cultural services, and landscape functions [42,43,44], and has emerged as a new hotspot in land change science and sustainable development research [6,45].
Presently, rapid urbanization has exacerbated tense human-land relationships through the conversion of various land uses and structures [46,47], leading to a series of developmental constraints, such as excessive urban expansion, farmland loss, habitat fragmentation, and environmental deterioration [48,49]. These problems, occurring in both rural and urban areas, are considered to be related to the segregation and conflicts among LUMF [50,51]. This is particularly evident in the underdeveloped areas of the CLMNCP, where rural and urban landscapes are inextricably intertwined, posing significant challenges to local land sustainability [6]. These issues underscore an urgent need to understand LUMF interactions and to manage the complex relationships among them.
The LUMF system exhibits pronounced state-dependent dynamics, wherein the current functional state serves as the initial condition and constraint boundary shaping future evolution, including trade-offs and synergies among functions, specifically the ecological functional baseline exerts a decisive influence on these relationships [52]. Consequently, investigating the drivers of multifunctional trade-offs and synergies among LUMF necessitates the inclusion of functional baseline variables to capture internal feedback mechanisms and path-dependent processes within the system.

3.1.2. Trade-Offs and Synergies Among LUMF

Various LUMF are simultaneously produced through land use processes and interact with each other across space, time, and reversibility [25,53]. Even when geographical environments and involved human civilizations are similar, the interactions among LUMF may be unevenly distributed in space and time [7,25]. These interactions are primarily characterized by trade-offs, where a gain in one function comes at the expense of another, and synergies, where functions either co-evolve or decline together [8,9,54]. Furthermore, LUMF trade-offs/synergies exhibit a coupled interactive relationship, in which they mutually promote or restrain one another, featuring complex nonlinear characteristics and significant spatial heterogeneities [55,56].

3.2. Research Methods

3.2.1. Overall Research Ideas

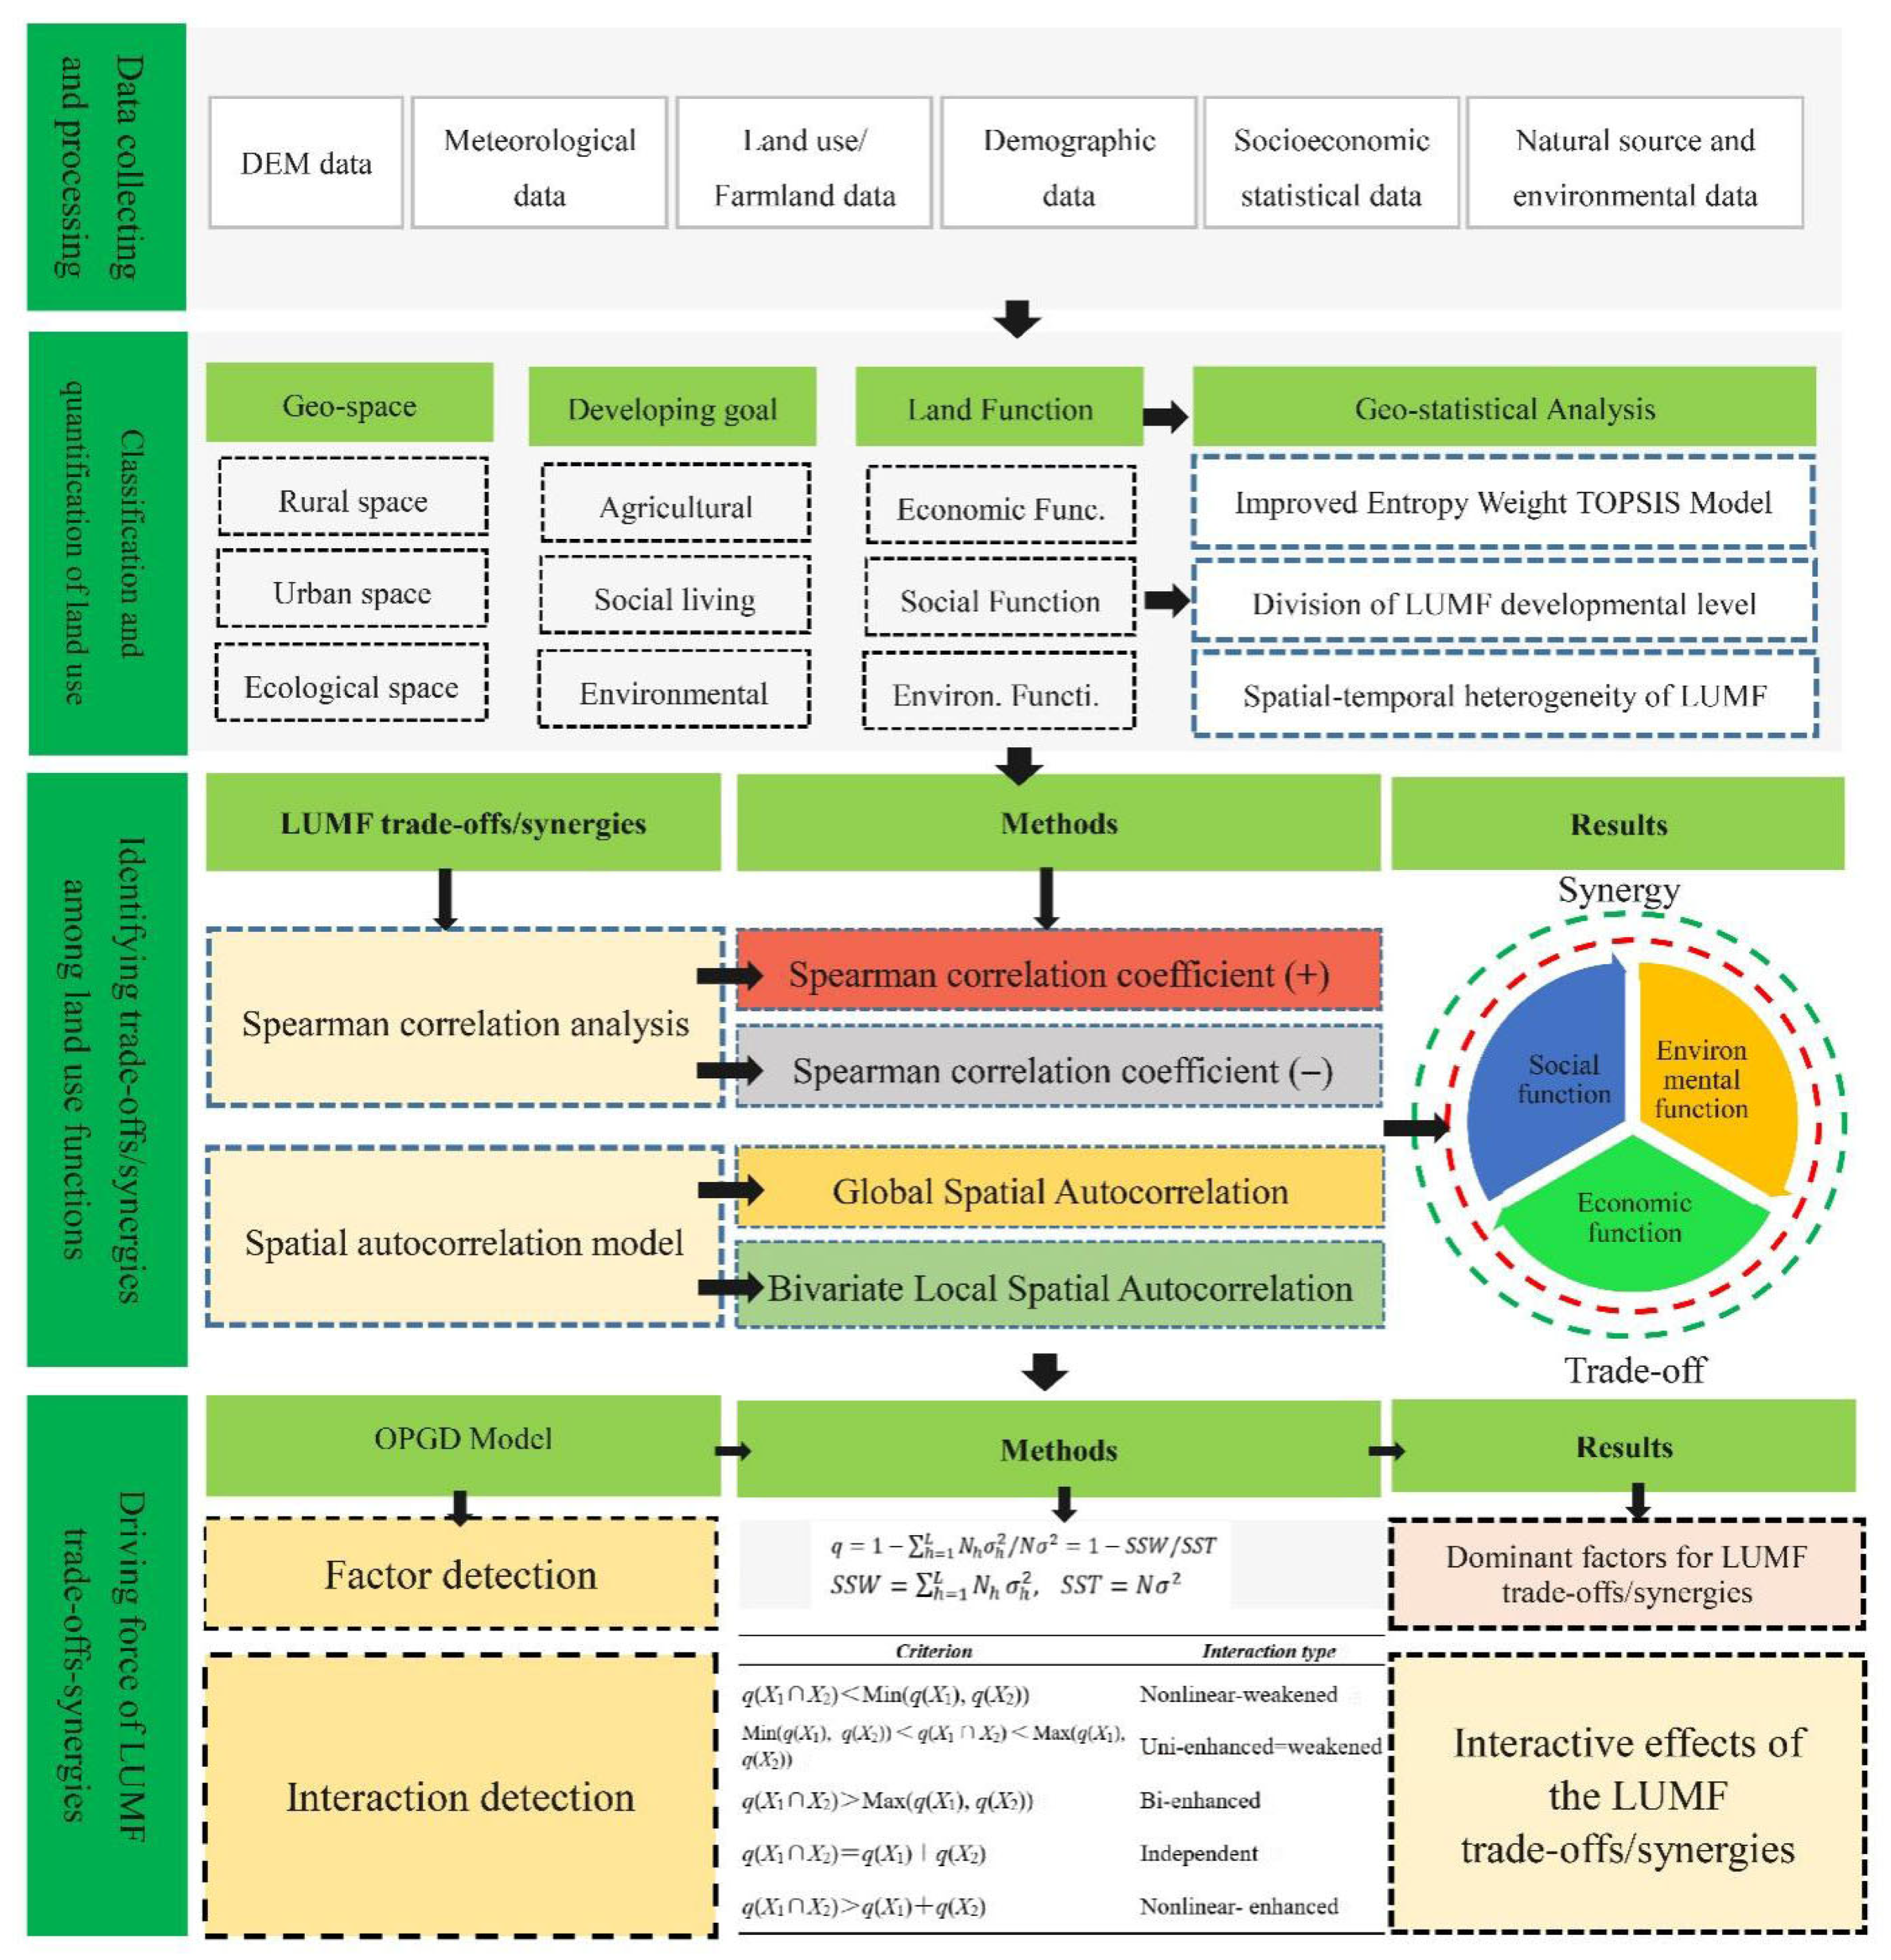
The research framework of this study, as illustrated in Figure 2, comprises the following steps:
(1)
An index system for classification and quantification, incorporating economic, social, and environmental dimensions linked to various land uses, is established. The improved entropy-weighted TOPSIS model is then applied to measure LUMF in the CLMNCP from 2008 to 2023. In LUMF research, results are typically presented at five-year intervals due to data availability, analytical efficiency, and the gradual pace of landscape change. Given the slow-evolving nature of land use functions, annual analysis yields diminishing returns while imposing unnecessary computational costs. A five-year resolution effectively smooths short-term anomalies, highlights long-term trends, and enables meaningful observation of medium-term dynamics without information overload, thereby enhancing the clarity of spatiotemporal communication.
(2)
Spearman correlation analysis and bivariate local spatial autocorrelation model are employed to examine the spatiotemporal heterogeneity and nonlinear interaction characteristics of LUMF trade-offs/synergies within this cross-regional national cultural park.
(3)
The Optimal Parameters-based GeoDetector (OPGD) model is utilized to identify the dominant factors influencing LUMF trade-offs/synergies in the study area, with the aim of optimizing thematic functional zonation and informing national cultural park management.

3.2.2. Classification and Quantification of LUMF

(1)
The indicators of LUMF
LUMF are influenced by the complex interplay of various land use structures within specific spatial and temporal bounds [57]. The “Territorial Space Planning Outline of China (2016–2030),” published in 2017, divides territorial space into three types: agricultural, urban, and ecological space [6]. The dominant LUMF vary among these territorial space types due to differences in land use structures and spatial development goals [58]. To ensure the efficient use and protection of land resources and to promote coordinated economic and social development, it is essential to align LUMF classification with agricultural, urban, and ecological spaces [25]. Accordingly, this study categorizes LUMF into three primary functions: producing (economic), living (social), and ecological (environmental) [7]. A comprehensive index system for LUMF evaluation was established based on actual land use status, the principles of dominance and feasibility, and an integration of previous research findings [25,50,51]. This system specifically emphasizes the integration of “socio-cultural” and “ecological-perpetuating” values as revealed by various land use forms in the study area. The specific indicators and quantification methods are presented in Table 2.
In this study, the economic function primarily refers to agricultural production, economic development, and transportation. Given that agricultural production consolidates the foundation of the land use system, it is mainly represented by grain yield and meat output. Due to the strong correlation between economic development and the added value of the secondary and tertiary industries, the per capita added value of these industries was adopted to reflect the local economic development level. The social function is embodied in its role as a carrying space for human survival and for socio-cultural improvements in urban areas. It is subdivided into residential care, employment support, social security, and cultural service functions. Among these, the indicators of cultural expenditure per capita and the number of cultural facilities per million people specifically reflect the cultural and spiritual values embedded in concrete land use forms. Meanwhile, indicators such as urban park area per capita, green coverage rate of built-up areas, and excellent air quality rate reveal the health and recreational functions of land use. The environmental function refers to the capacity of the eco-environment to maintain ecological balance and biodiversity, and to perpetually supply both biotic and abiotic resources for human beings. Considering the key factors that significantly affect ecological balance and biodiversity, four positive representative indicators were selected to evaluate the environmental function of the land use system: forestry coverage ratio, wetland-to-urban area ratio, ecological land-to-urban area ratio, and ecological land structure coefficient.
(2)
Improved Entropy Weight TOPSIS Model
The improved entropy-weighted TOPSIS model has been widely used for comprehensive evaluations, as it effectively avoids the interference of subjective factors and objectively reflects the development and changes among influencing factors. It has been extensively applied in assessing land use performance [5,59,60]. This study employs the improved entropy-weighted TOPSIS method to determine indicator weights and to quantify the three primary LUMF. The operational framework and calculation formulas are as follows:
Standardized Evaluation Matrix and Indicator Data Matrix
This methodology establishes a standardized evaluation matrix and an indicator data matrix based on land use sample data related to LUMF in the CLMNCP. It then assesses the positive or negative characteristics of these indicators, which reflect the development level of LUMF within the national cultural park.
Using the Min-Max method to standardize the m × n original decision matrix {Xij} to facilitate subsequent logarithmic calculations:
Positive   index :   X = x i j x i j   m i n / x i j m a x x i j   m i n
Negative   index :   X =   x i j   m a x x i j / x i j   m a x x i j   m i n
( i = 1 ,   2 ,   ,   m ;   j = 1 ,   2 ,   ,   n )
where i denotes the quantity of evaluation indicators, and j represents the year being evaluated.
Information Entropy and Weight Values
The calculation formula for i information entropy value ei is as follows:
e i   = k j = 1 n p i j ln p i j ( i = 1 , 2 ,   3 , , m ;   j = 1 ,   2 ,   3 , , n )
P ij = X i j / j = 1 n X i j
where k = 1/ ln n , Pij is the normalization index value, and 0 ≤ e i ≤ 1.
The weight of the index value W i is determined as follows:
W i   =   g i / i = 1 m g i   ( i = 1 , 2 , 3   m )
g i = 1 e i   ( i = 1 , 2 , 3   m )
Normalized Standard Matrix
This study used r i j = w i · P i j to establish the comprehensive decision matrix in Equation (7), where Wi = ( w 1 , w 2 , w 3 , …,   w m ) is calculated by Equations (5) and (6), P i j is obtained by Equation (4), and satisfies i = 1 m w i   = 1.
R = ( r i j ) m × n
Positive and Negative Ideal Solutions
Considering the decision objectives and attribute characteristics, this study made the selection of positive and negative ideal solutions. The calculation formula is as follows:
R +   =   { m a x r i j | i = 1 ,   2 ,   3 m } = { r 1 + , r 2 + , r 3 + ,   r m + }
R   = { m i n r i j | i = 1 ,   2 ,   3 m } = { r 1 , r 2 , r 3 ,   r m }
where r i + represents the positive ideal solution for each indicator, and r i   denotes the negative ideal solution for each indicator.
Euclidean Distance
This study calculated the distance of each alternative to Positive Idea Solution and Negative Idea Solution based on Equations (10) and (11).
      D i + = i = 1 m ( r i j r j + ) 2
D i = i = 1 m ( r i j r j ) 2
where D+ represents the distance to the optimal (positive ideal) solution, and D denotes the distance to the worst (negative ideal) solution.
Proximity Value
This study calculated the proximity of each evaluation index to the optimal (positive ideal) solution. The specific formula is as follows:
O i = D i / ( D i + + D i ) =   D i / ( D i + + D i )
where Oi is the approximation value that indicates the closeness of LUMF in the national cultural park of evaluation indicator i to the ideal solution in the range of [0, 1].
Division of Thresholds for the developmental level of LUMF
Based on the Improved Entropy Weighted TOPSIS Model, proximity was divided into five levels to evaluate the development level of LUMF in CLMNCP (Table 3).

3.2.3. Measurement Method of Trade-Offs and Synergies Among LUMF

(1)
Spearman correlation analysis
As a widely used non-parametric statistical method for measuring correlation between two variables, the Spearman correlation coefficient is particularly suitable for data that do not necessarily conform to a normal distribution [61,62]. This study employs the Spearman correlation coefficient to analyze the facilitative or inhibitory relationships between pairs of land use functions. A positive coefficient indicates a synergistic relationship, whereas a negative coefficient indicates a trade-off [63].
(2)
Spatial autocorrelation model
This study applied a spatial autocorrelation model using GeoDa software 1.22 to examine the spatial clustering patterns of LUMF in the CLMNCP, and to elucidate their spatial correlation characteristics and heterogeneities [6,9].
Global Spatial Autocorrelation
This study used the Global Spatial Autocorrelation model to illuminate the overall spatial correlation between two LUMFs in CLMNCP. The values were in the range of [−1, 1]. If I > 0, it means a synergistic relationship between two variables; while I < 0, a trade-off relationship between them. The calculation formula is as follows:
I   =   n i = 1 n j = 1 n W i j ( x i x ¯ ) ( x j x ¯ ) i = 1 n ( x i x ¯ ) i = 1 n j = 1 n W i j
where I denotes the bivariate global spatial autocorrelation index. n denotes the number of grids. x i and x j   denote the attribute values of grids i and j. x ¯ denotes the mean value of the attribute, and w i j denotes the spatial weighting matrix.
Bivariate Local Spatial Autocorrelation
Particularly, this study used the Bivariate Local Spatial Autocorrelation model to reveal spatial variations in trade-off/synergy relationships at different locations in research areas through the LISA aggregation mapping. The calculation formula is as follows:
I i   =   ( x j x ¯ ) j = 1 n W i j ( x j x ¯ ) j = 1 n ( x i x ¯ ) 2 / n
where I i denotes the local spatial autocorrelation index. x i ,   x j , x ¯ and W i j denote the same meaning as the Formula (13).

3.2.4. Driving Forces Analysis for Trade-Offs and Synergies Among LUMF

(1)
Selection of influencing factors
The dynamics of regional natural environmental factors and the trajectory of socio-economic development collectively shape the structure and development path of the human-land relationship system [6,64], significantly influencing LUMF changes and, consequently, the trade-offs and synergies among them [25].
Considering the regional characteristics of land use, data availability, and previous research [47,65,66,67], this study selected 32 potential influencing factors across 10 facets (Table 4) to examine their overall contributions to LUMF trade-offs and synergies in the CLMNCP.
(2)
Optimal Parameters Geo-Detector Model
The Optimal Parameters-based GeoDetector (OPGD) model is an improved version of the standard GeoDetector model, capable of spatially exploring potential influencing factors and their interactions between two geographical variables [66,67,68]. This study employs the factor detector module of the OPGD model to identify the dominant factors influencing the spatial heterogeneity of LUMF trade-offs and synergies in the CLMNCP. In addition, the interaction detector module is used to reveal the interactive effects between pairs of influencing factors within the national cultural park.
Specifically, the Geo-detector fundamentally differs from traditional regression models in its approach to relationship identification. While conventional regression emphasizes fitting numerical linear relationships between variables and is susceptible to multicollinearity, the Geo-detector identifies determinants by examining the consistency of spatial stratification patterns between independent and dependent variables through the q-statistic, rather than capturing direct numerical dependencies [69]. Its core mechanism lies in detecting spatial distribution coupling [69]. This methodological distinction enables effective handling of nonlinear associations and ensures robustness against variable overlap [69,70]. A higher q value signifies greater explanatory power of an independent variable’s spatial pattern in accounting for the dependent variable’s spatial heterogeneity [71].
Factor detection
We used the factor detector module of the OPGD model to analyze the dominant influencing factors of spatial differentiations of LUMF trade-offs/synergies. The model formula is as follows:
q = 1 h = 1 L N h σ h 2 / N σ 2 = 1 S S W / S S T
S S W = h = 1 L N h σ h 2 ,         S S T = N σ 2
where the q value ranging from 0 to 1 indicates the factor explains the spatial differentiations of q × 100% dependent variable; h is the number of layers of the influence factor, Nh and N are the sample numbers of layer h of the influence factor and the whole study area, and σh and σ are the variance of layer h and the whole study area, respectively. SSW is the sum of variances within layers; SST is the total variance of the study area [66].
Interaction detection
The interaction detector is used to identify the interaction between two influencing factors, aiming at evaluating the combined effect of two factors (enhanced or weakened) on the dependent variable. The criteria for the various interaction types are shown in Table 5.

3.2.5. Test of Independence

To assess the degree of information overlap between the independent and dependent variables, the following tests were conducted in this study.
Correlation Analysis: The dependent variable—a trade-off/synergy index derived from two land use functional metrics—was tested for linear association with the independent variables using Pearson correlation. Across all study years, the absolute correlation coefficients were below 0.39 (Table 6), indicating a weak linear relationship and limited information overlap.
Robustness Test for Interaction Effects: Inspired by robustness testing practices in Geo-detector studies [68], we conducted repeated interaction analyses by altering the discretization schemes of continuous independent variables—namely, natural breaks (4–6 categories) and quantile methods (4–7 levels)—to assess the stability of interaction types among core factor pairs. Consistent interaction types across different discretization settings indicate that the identified interaction mechanisms are robust.

4. Results

4.1. Spatiotemporal Heterogeneity Characteristics of LUMF

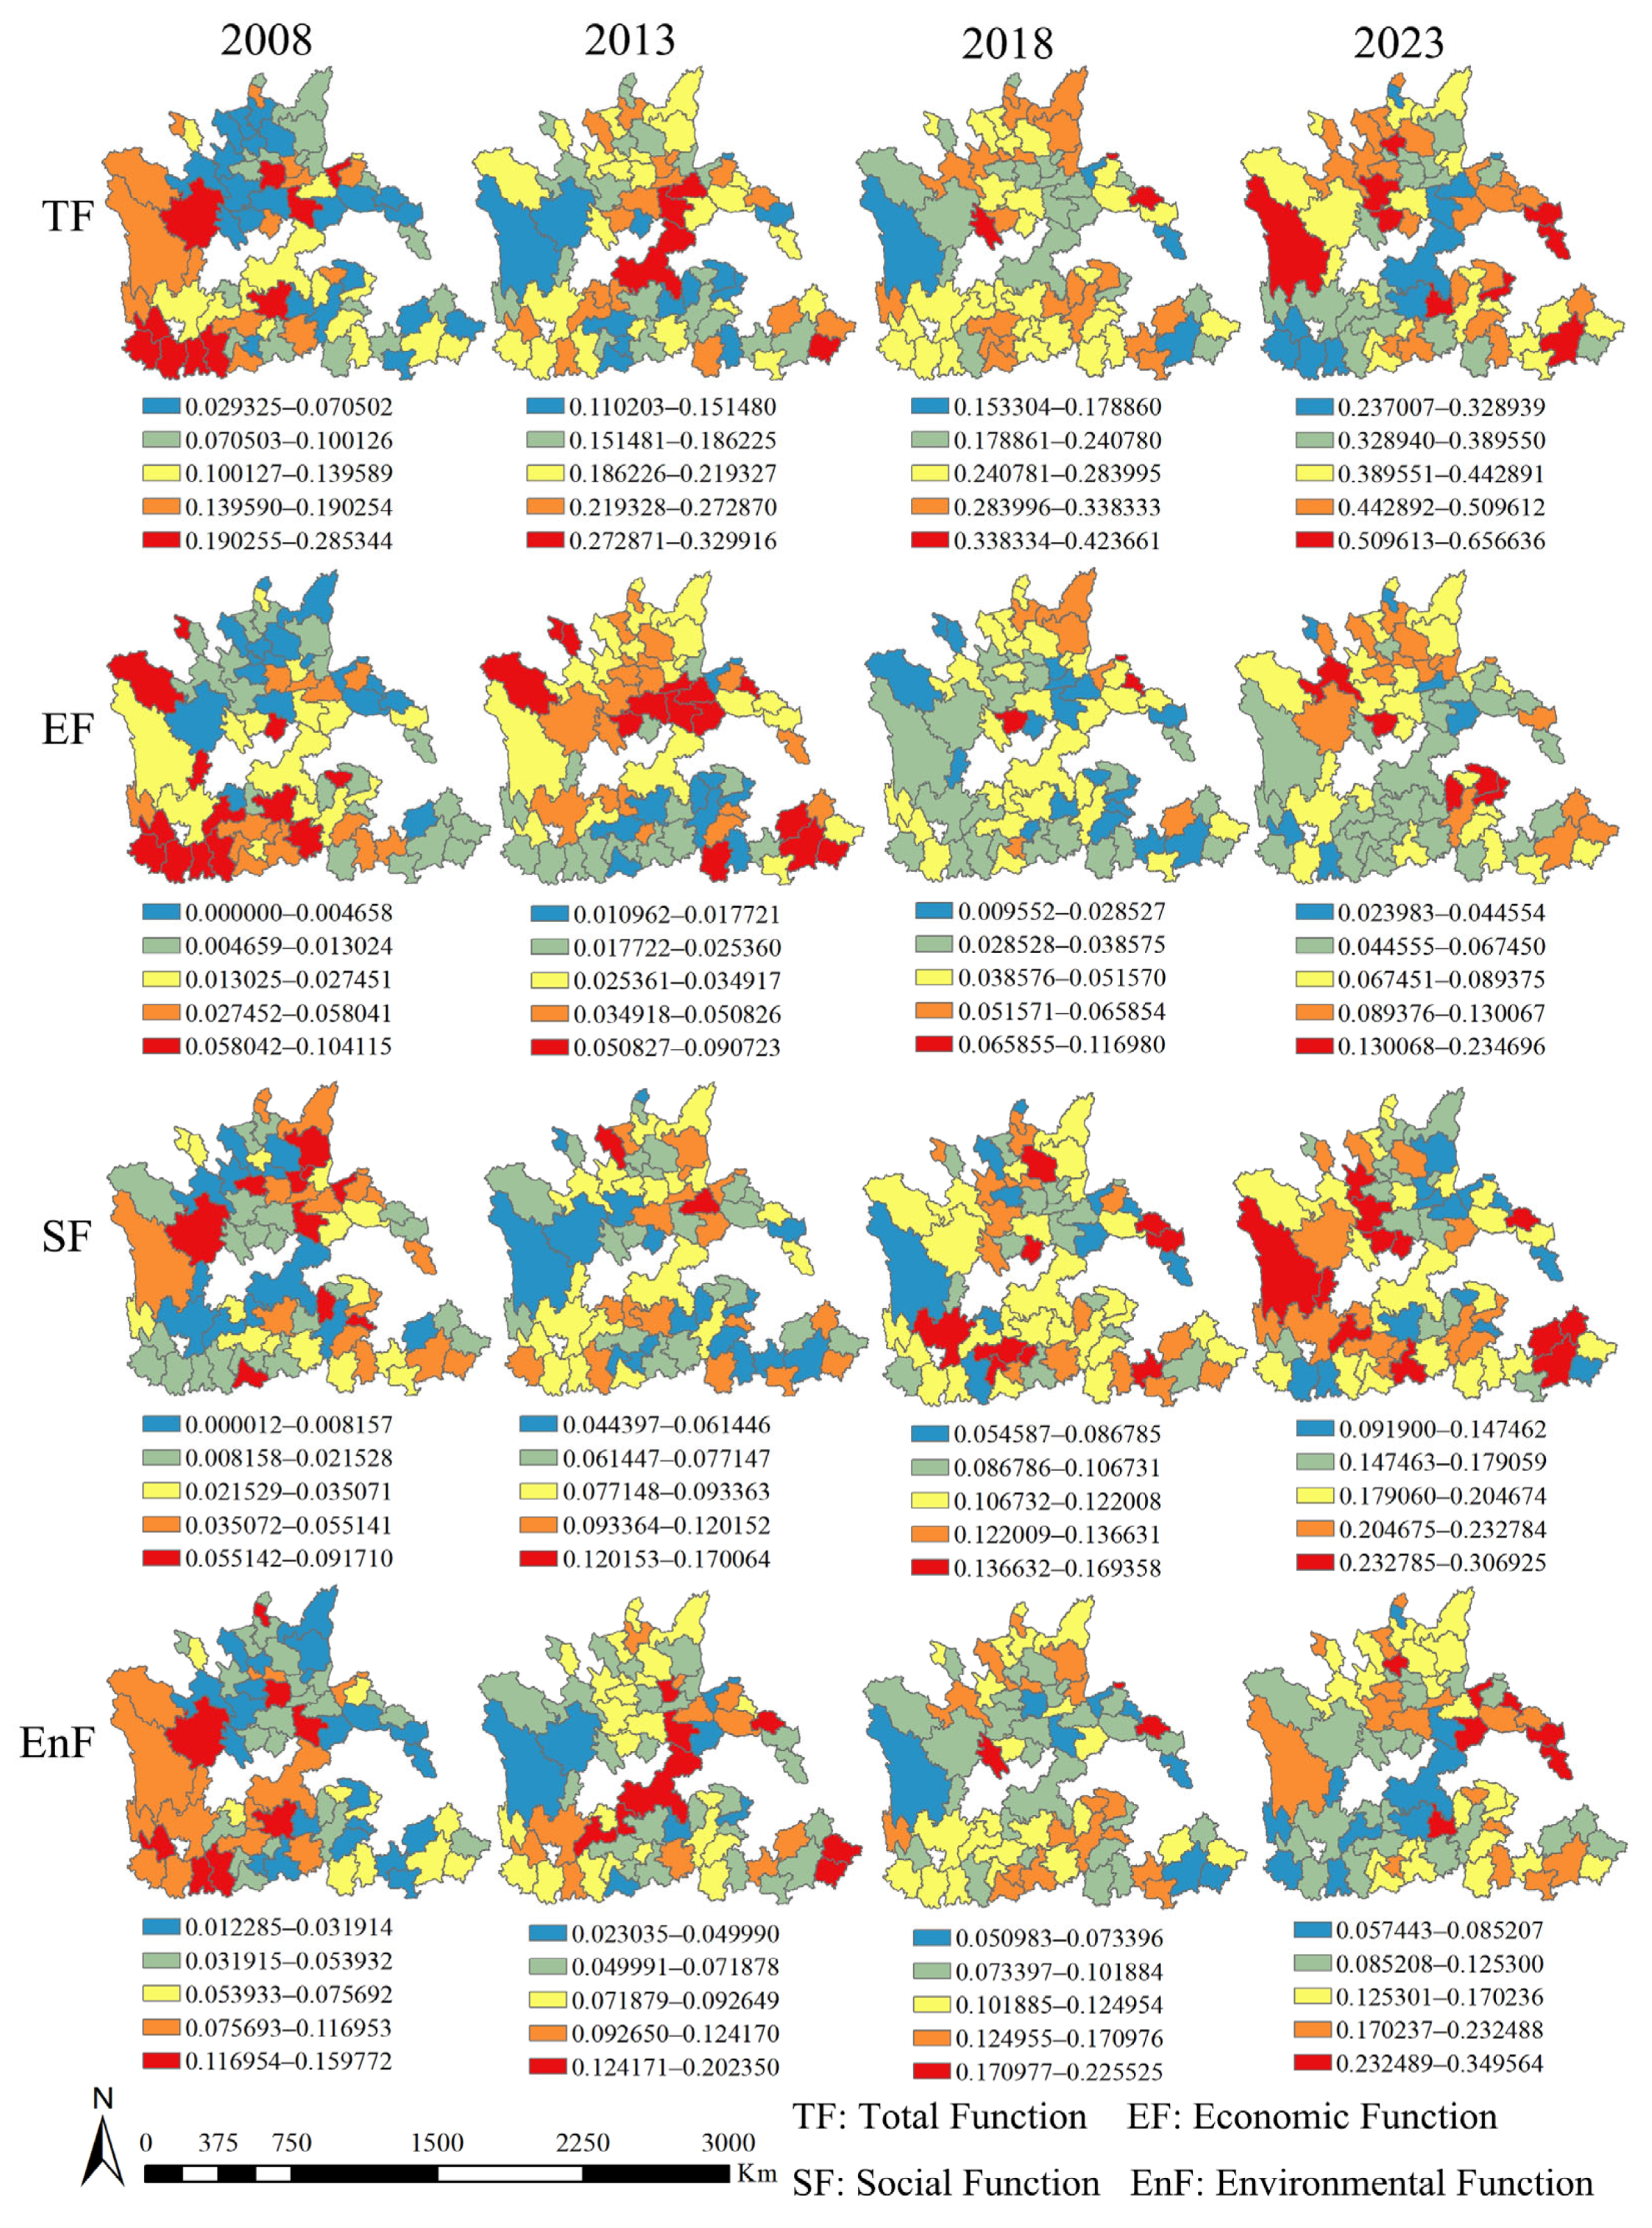
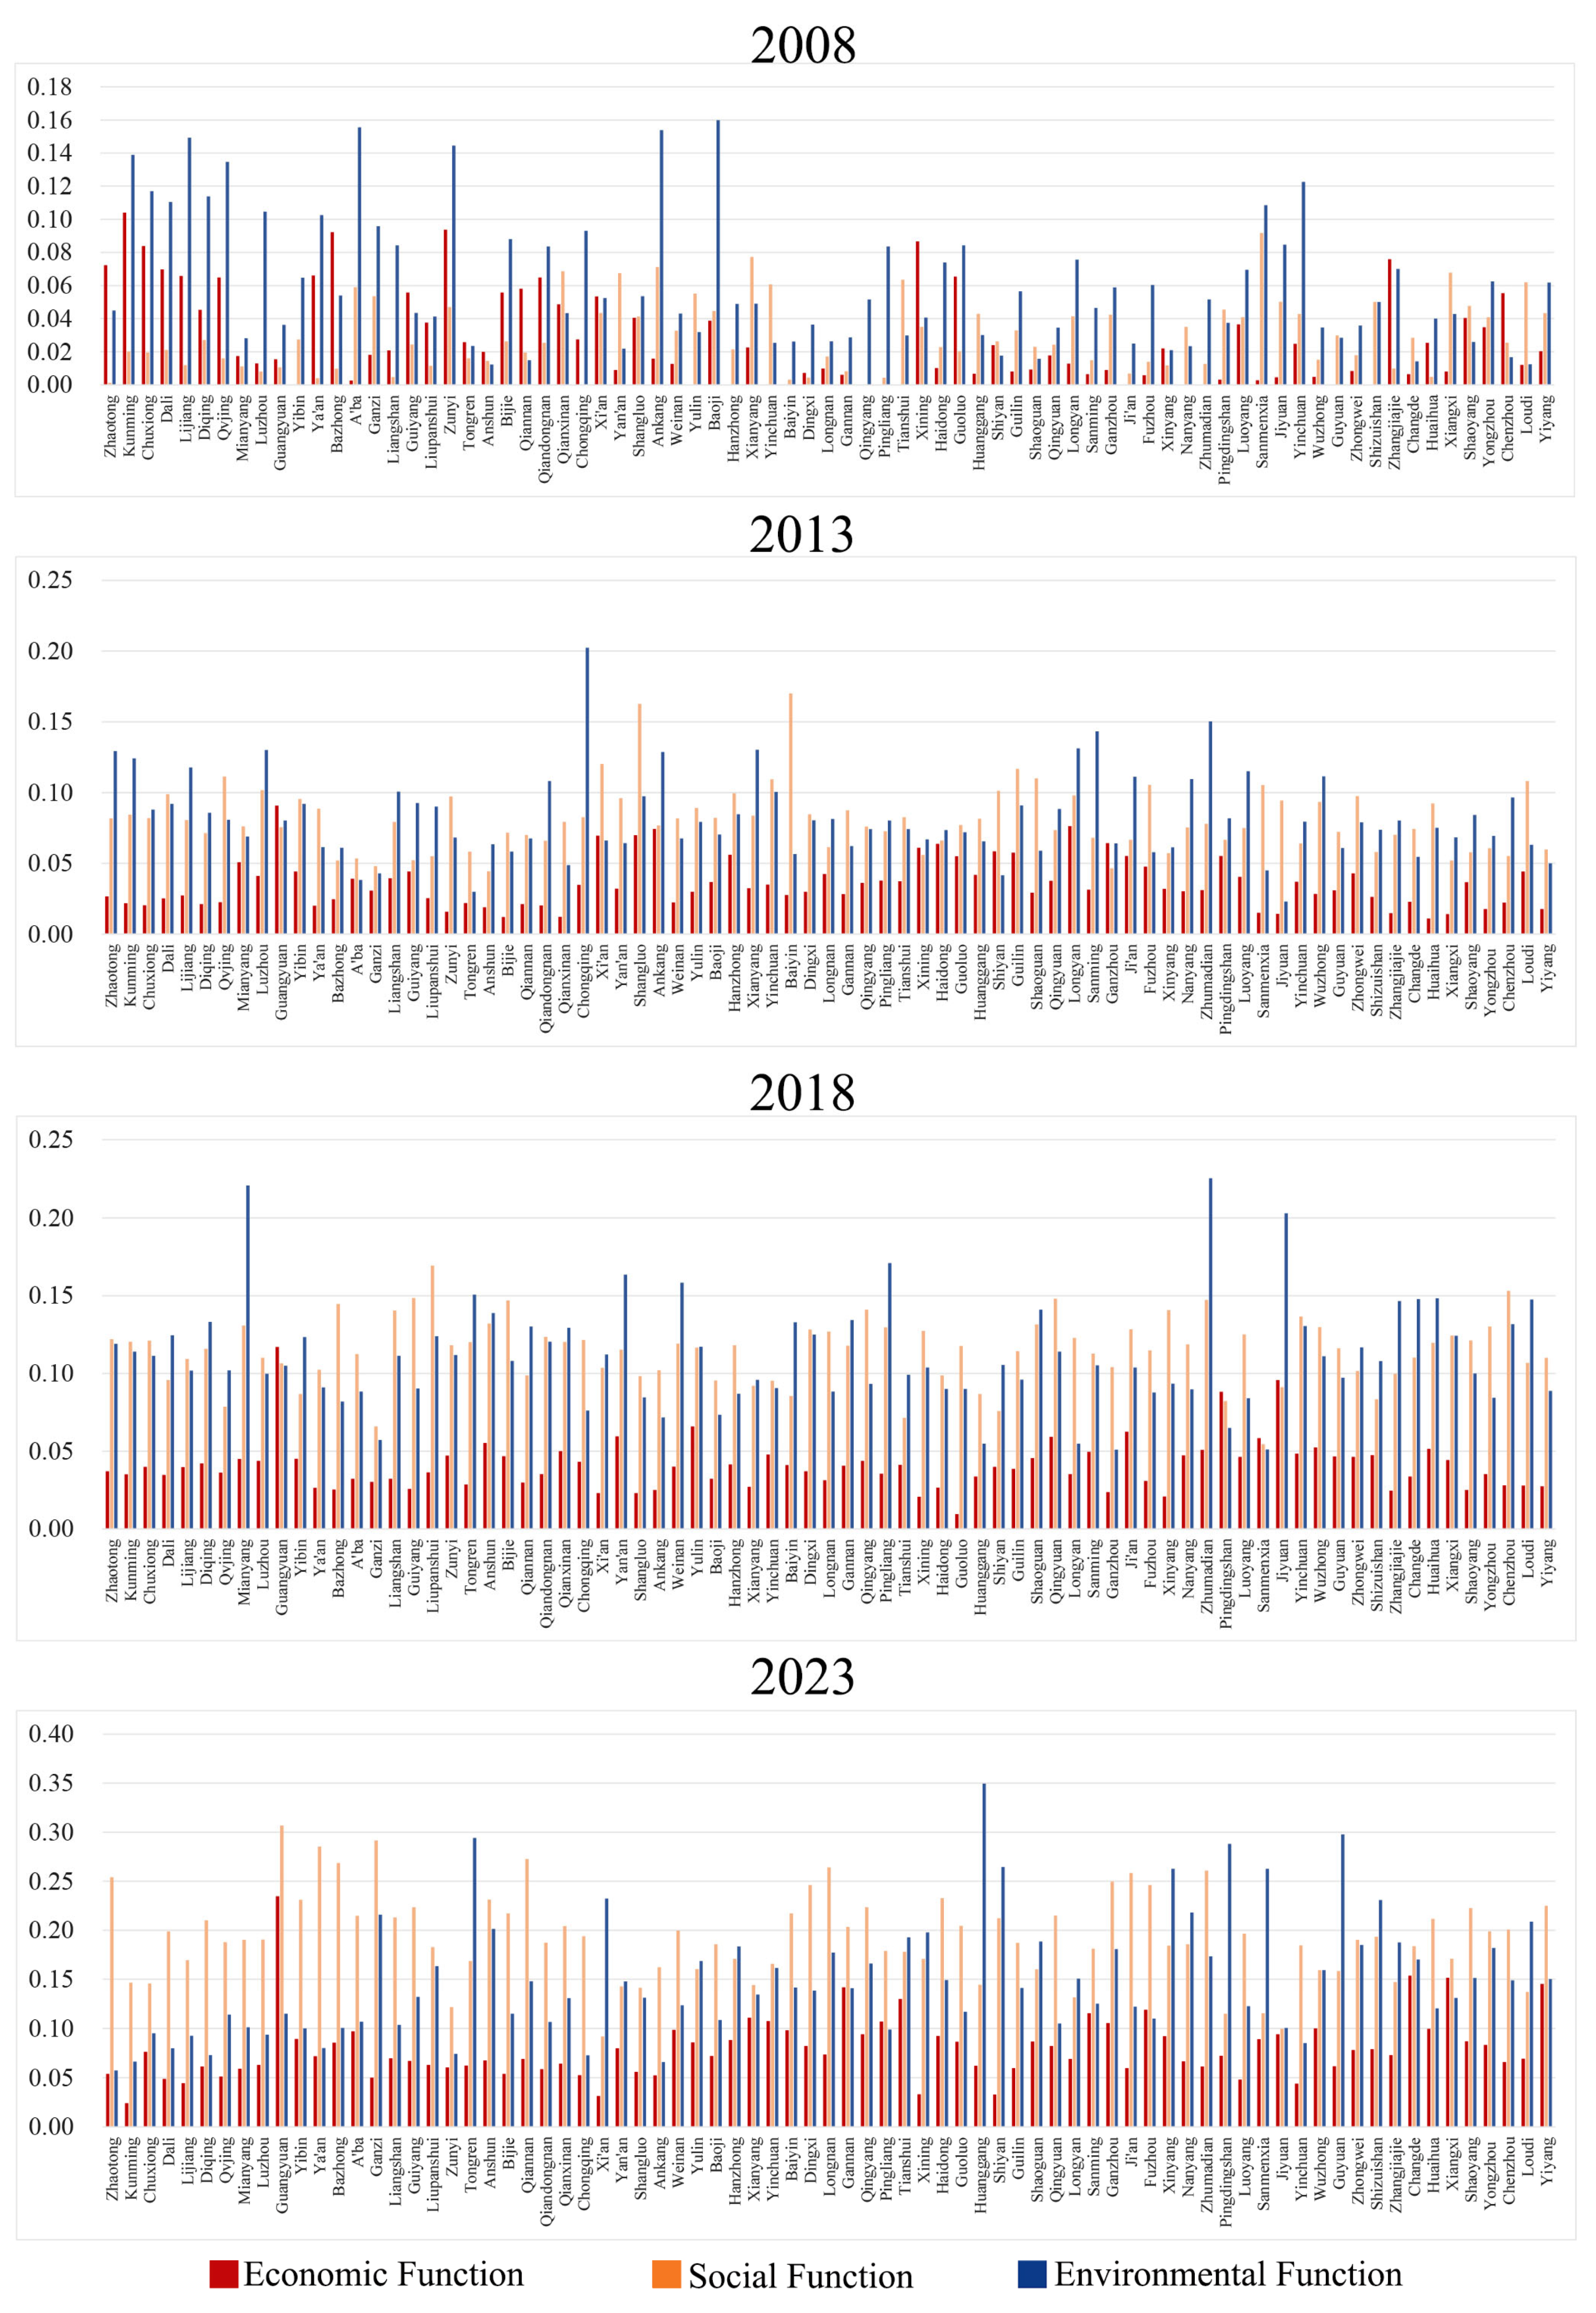
The spatiotemporal distributions and dynamics of the three main LUMF in the CLMNCP from 2008 to 2023 exhibited distinct spatial patterns, with significant regional variability and spatial heterogeneity across the national cultural park (Figure 3 and Figure 4).
From 2008 to 2023, the total LUMF value in the CLMNCP increased from a rudimentary level of less than 0.1 in 2008 to a more developed level exceeding 0.6 in 2023. In 2008 and 2013, high-value areas of total function were concentrated in the southwestern parts and the central agglomeration of the park—regions characterized by mountainous or hilly terrain, relatively scarce cultivated land, and low grain yields. However, under accelerating urbanization, these concentrations gradually shifted northward and middle-eastward. By 2023, the concentrations had extensively shifted to the northern and middle-eastern regions. Overall, from 2008 to 2023, the high-value areas of total function gradually shifted from the southwest to the north and east, indicating a prominent expansion trend.
In 2008, high-value areas of EF were located in the southwestern parts of the national cultural park, covering the intersections of Yunnan, Guizhou, and Hunan provinces, and remained at a rudimentary level. By 2013, these areas had gradually shifted northward to encompass large parts of Henan, Shanxi, Gansu, and Qinghai provinces, though they still exhibited low land-use functional levels. This shift reflects the significant impact of accelerated urbanization on land-use functional structures. In 2023, high-value areas of EF were still observed in the northern parts of the CLMNCP, with a modest increase to an intermediate level. However, a gap remained when compared with the levels of social and environmental functions in the same year.
From 2008 to 2023, SF exhibited no prominent concentrations across the study area, remaining largely scattered throughout large parts of the national cultural park. Notably, by 2023, SF had increased to an intermediate level exceeding 0.3, emerging in the southwestern intersections of Yunnan, Guizhou, and Sichuan provinces. This distribution pattern reflects the significant coordinated development between socio-cultural and economic factors in both urban and rural areas of the CLMNCP, where key socio-cultural infrastructures—such as those for healthy recreation, cultural education, and medical care—are located.
In 2008, the environmental function exhibited a relatively dense pattern in the southwestern mountainous and hilly areas of Yunnan, Guizhou, and Sichuan provinces. These areas, characterized by steep terrain and high elevation with relatively sparse human activity, hosted high-quality ecological environments due to their natural terrain features. In contrast, lower EnF values were distributed in the northern and eastern parts of the CLMNCP, where rich land resources and convenient transportation are available. By 2013, high-value areas of EnF had become agglomerated in the central parts of the national cultural park. By 2023, they were sparsely situated in the northeastern regions. The peak value of environmental function increased from 0.16 in 2008 to 0.349 in 2023, indicating an overall ameliorating trend. Overall, high-value areas of environmental function shifted from being scattered around the southwestern mountainous and natural scenic areas to the northeastern plain and hilly areas.

4.2. Spatiotemporal Pattern of Trade-Offs and Synergies Among LUMF

4.2.1. Spearman Correlation Analysis

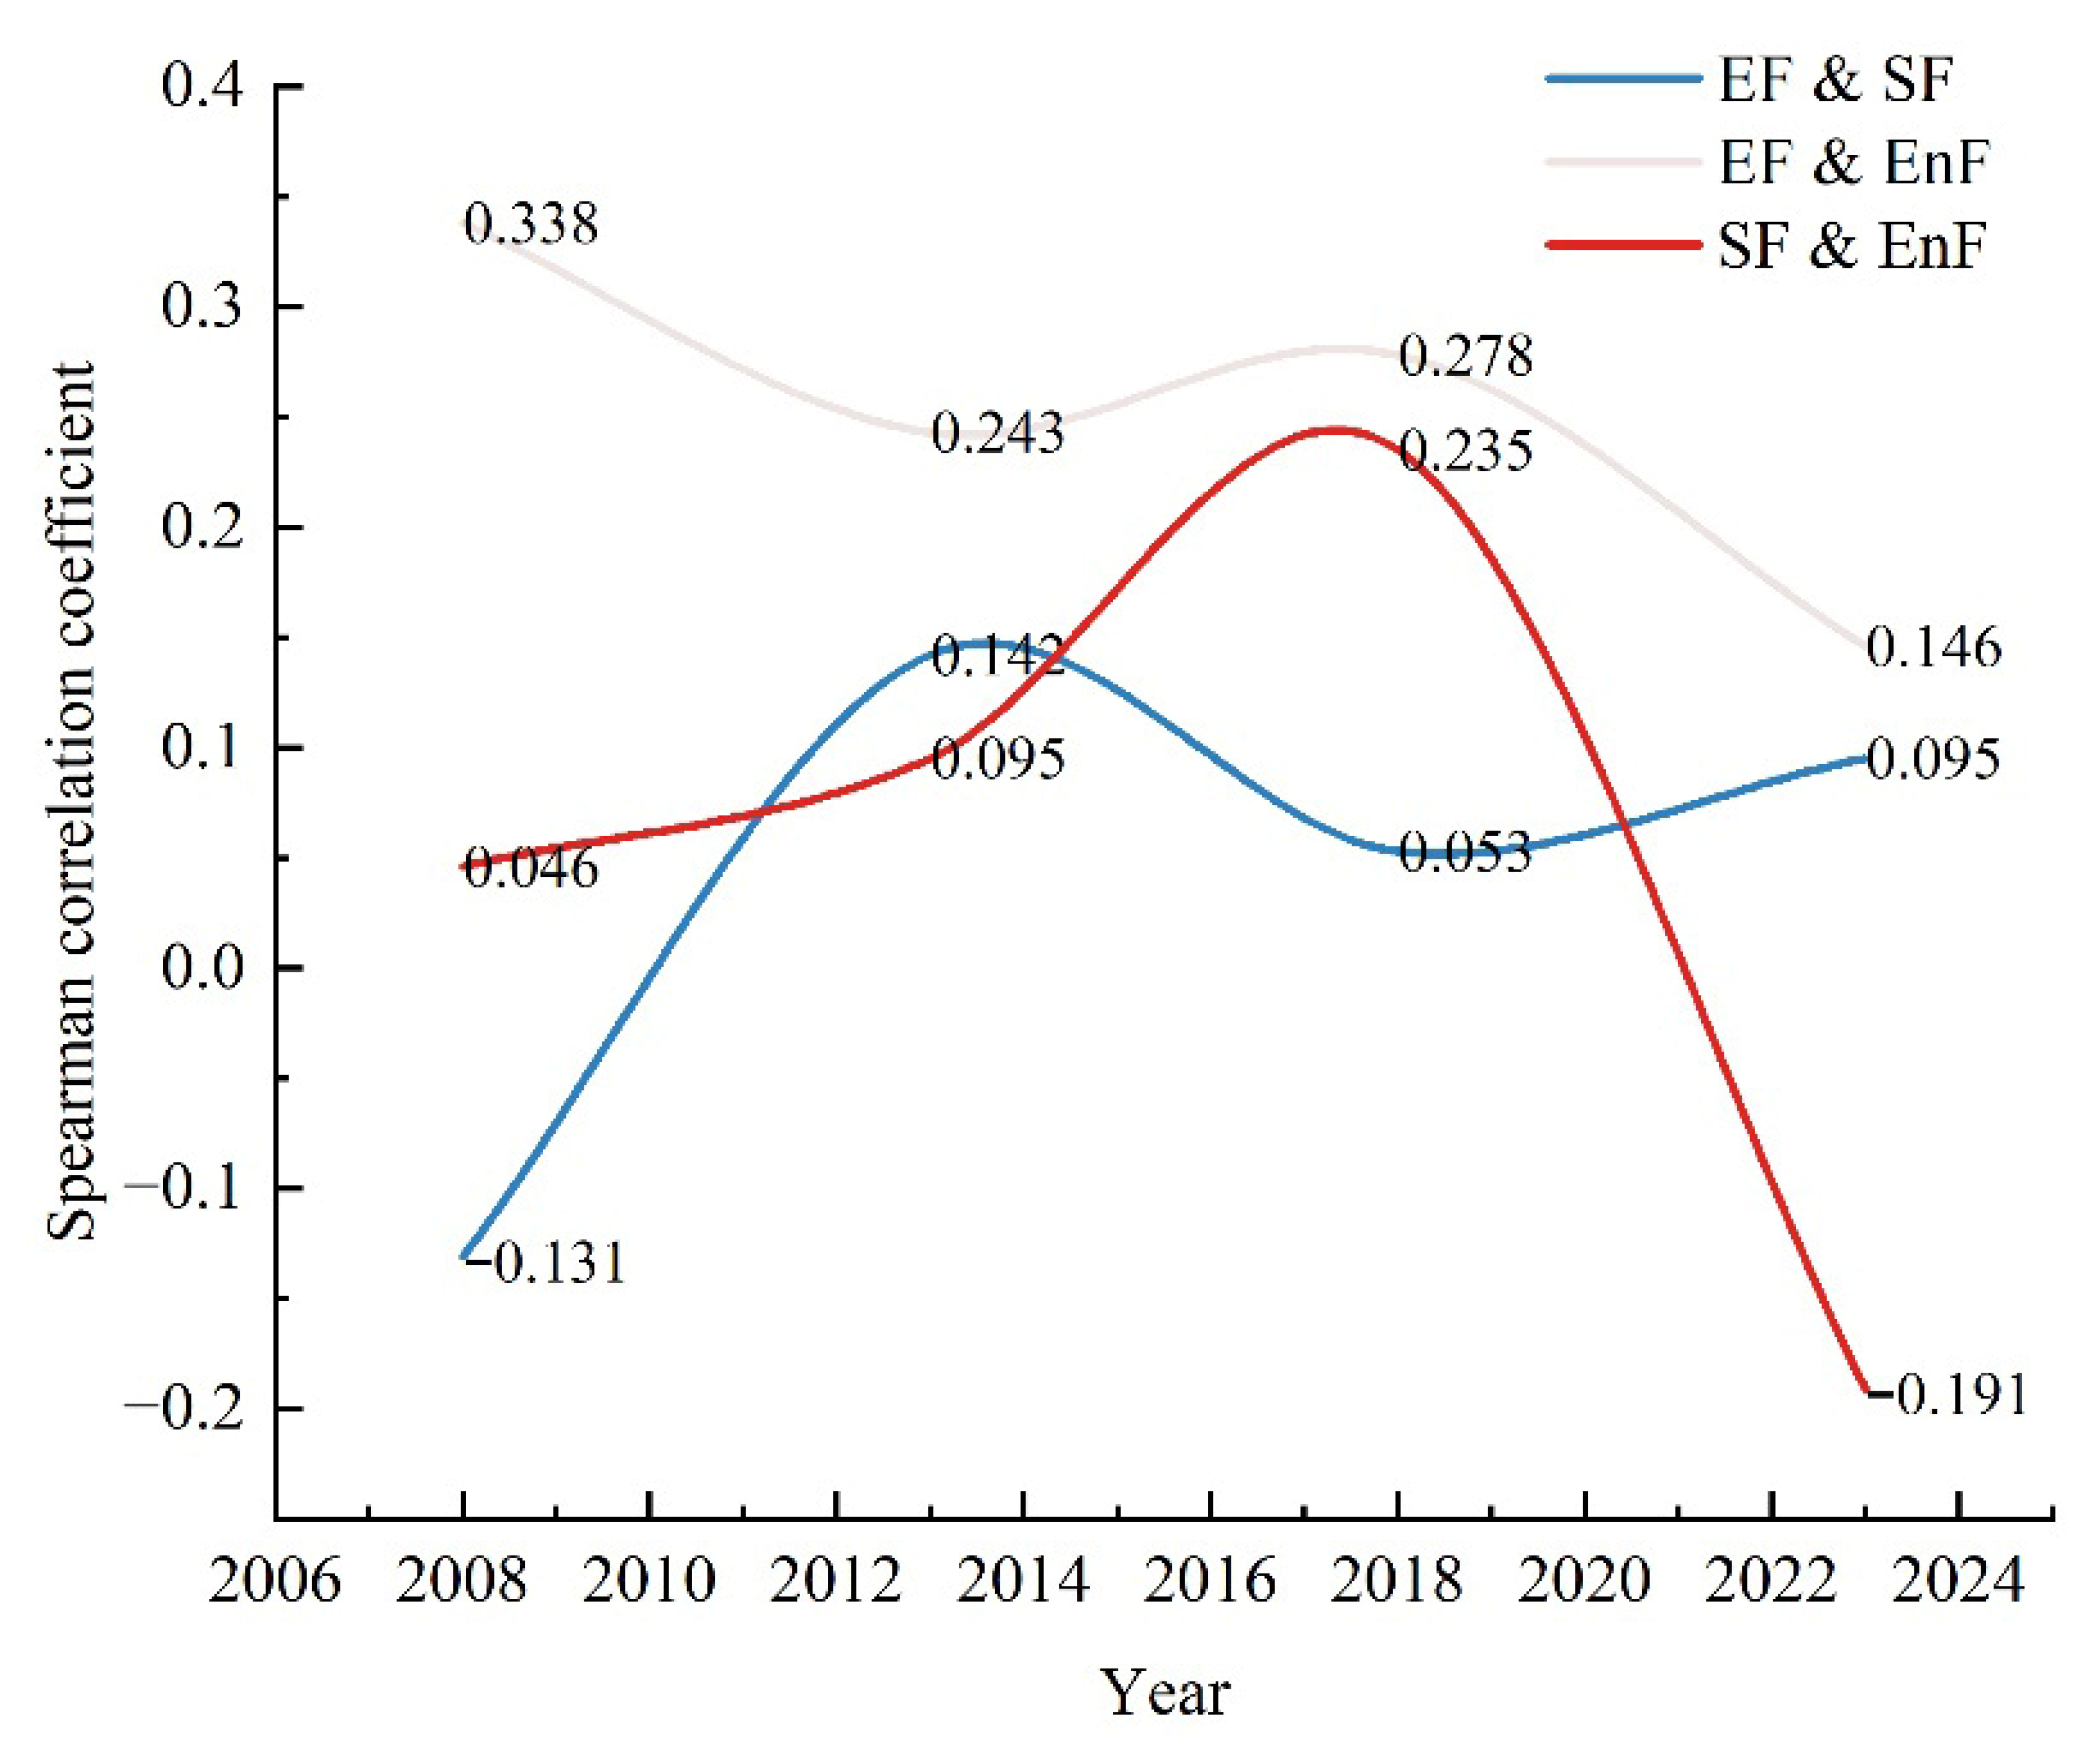
Table 7 and Figure 5 showed the Spearman correlation results among LUMF of EF (economic function), SF (social function), and EnF (environmental function) in CLMNCP from 2008 to 2023.
The study found that almost all correlations between EF and EnF were statistically significant (p ≤ 0.05). The correlation coefficient (ρ) between EF and EnF decreased over the study period, remaining positive throughout and indicating a synergistic relationship with a fluctuating downward trend. Conversely, the correlation coefficient between EF and SF increased from 2008 to 2023, exhibiting an overall fluctuating upward trend. This trend indicates a progressive transition from trade-off to synergy, although none of these correlations were statistically significant. The correlation coefficient between SF and EnF showed a downward trend with shifting from synergy to trade-off. Notably, a synergistic relationship between SF and EnF persisted from 2008 to 2018, while declining sharply to a trade-off by 2023. This shift is primarily attributed to rapid urbanization since 2018 in the CLMNCP, which has driven the expansion of urban space to meet growing social demands for a better quality of life, gradually encroaching upon natural environmental spaces.

4.2.2. Spatial Autocorrelation Analysis

(1)
Global spatial autocorrelation
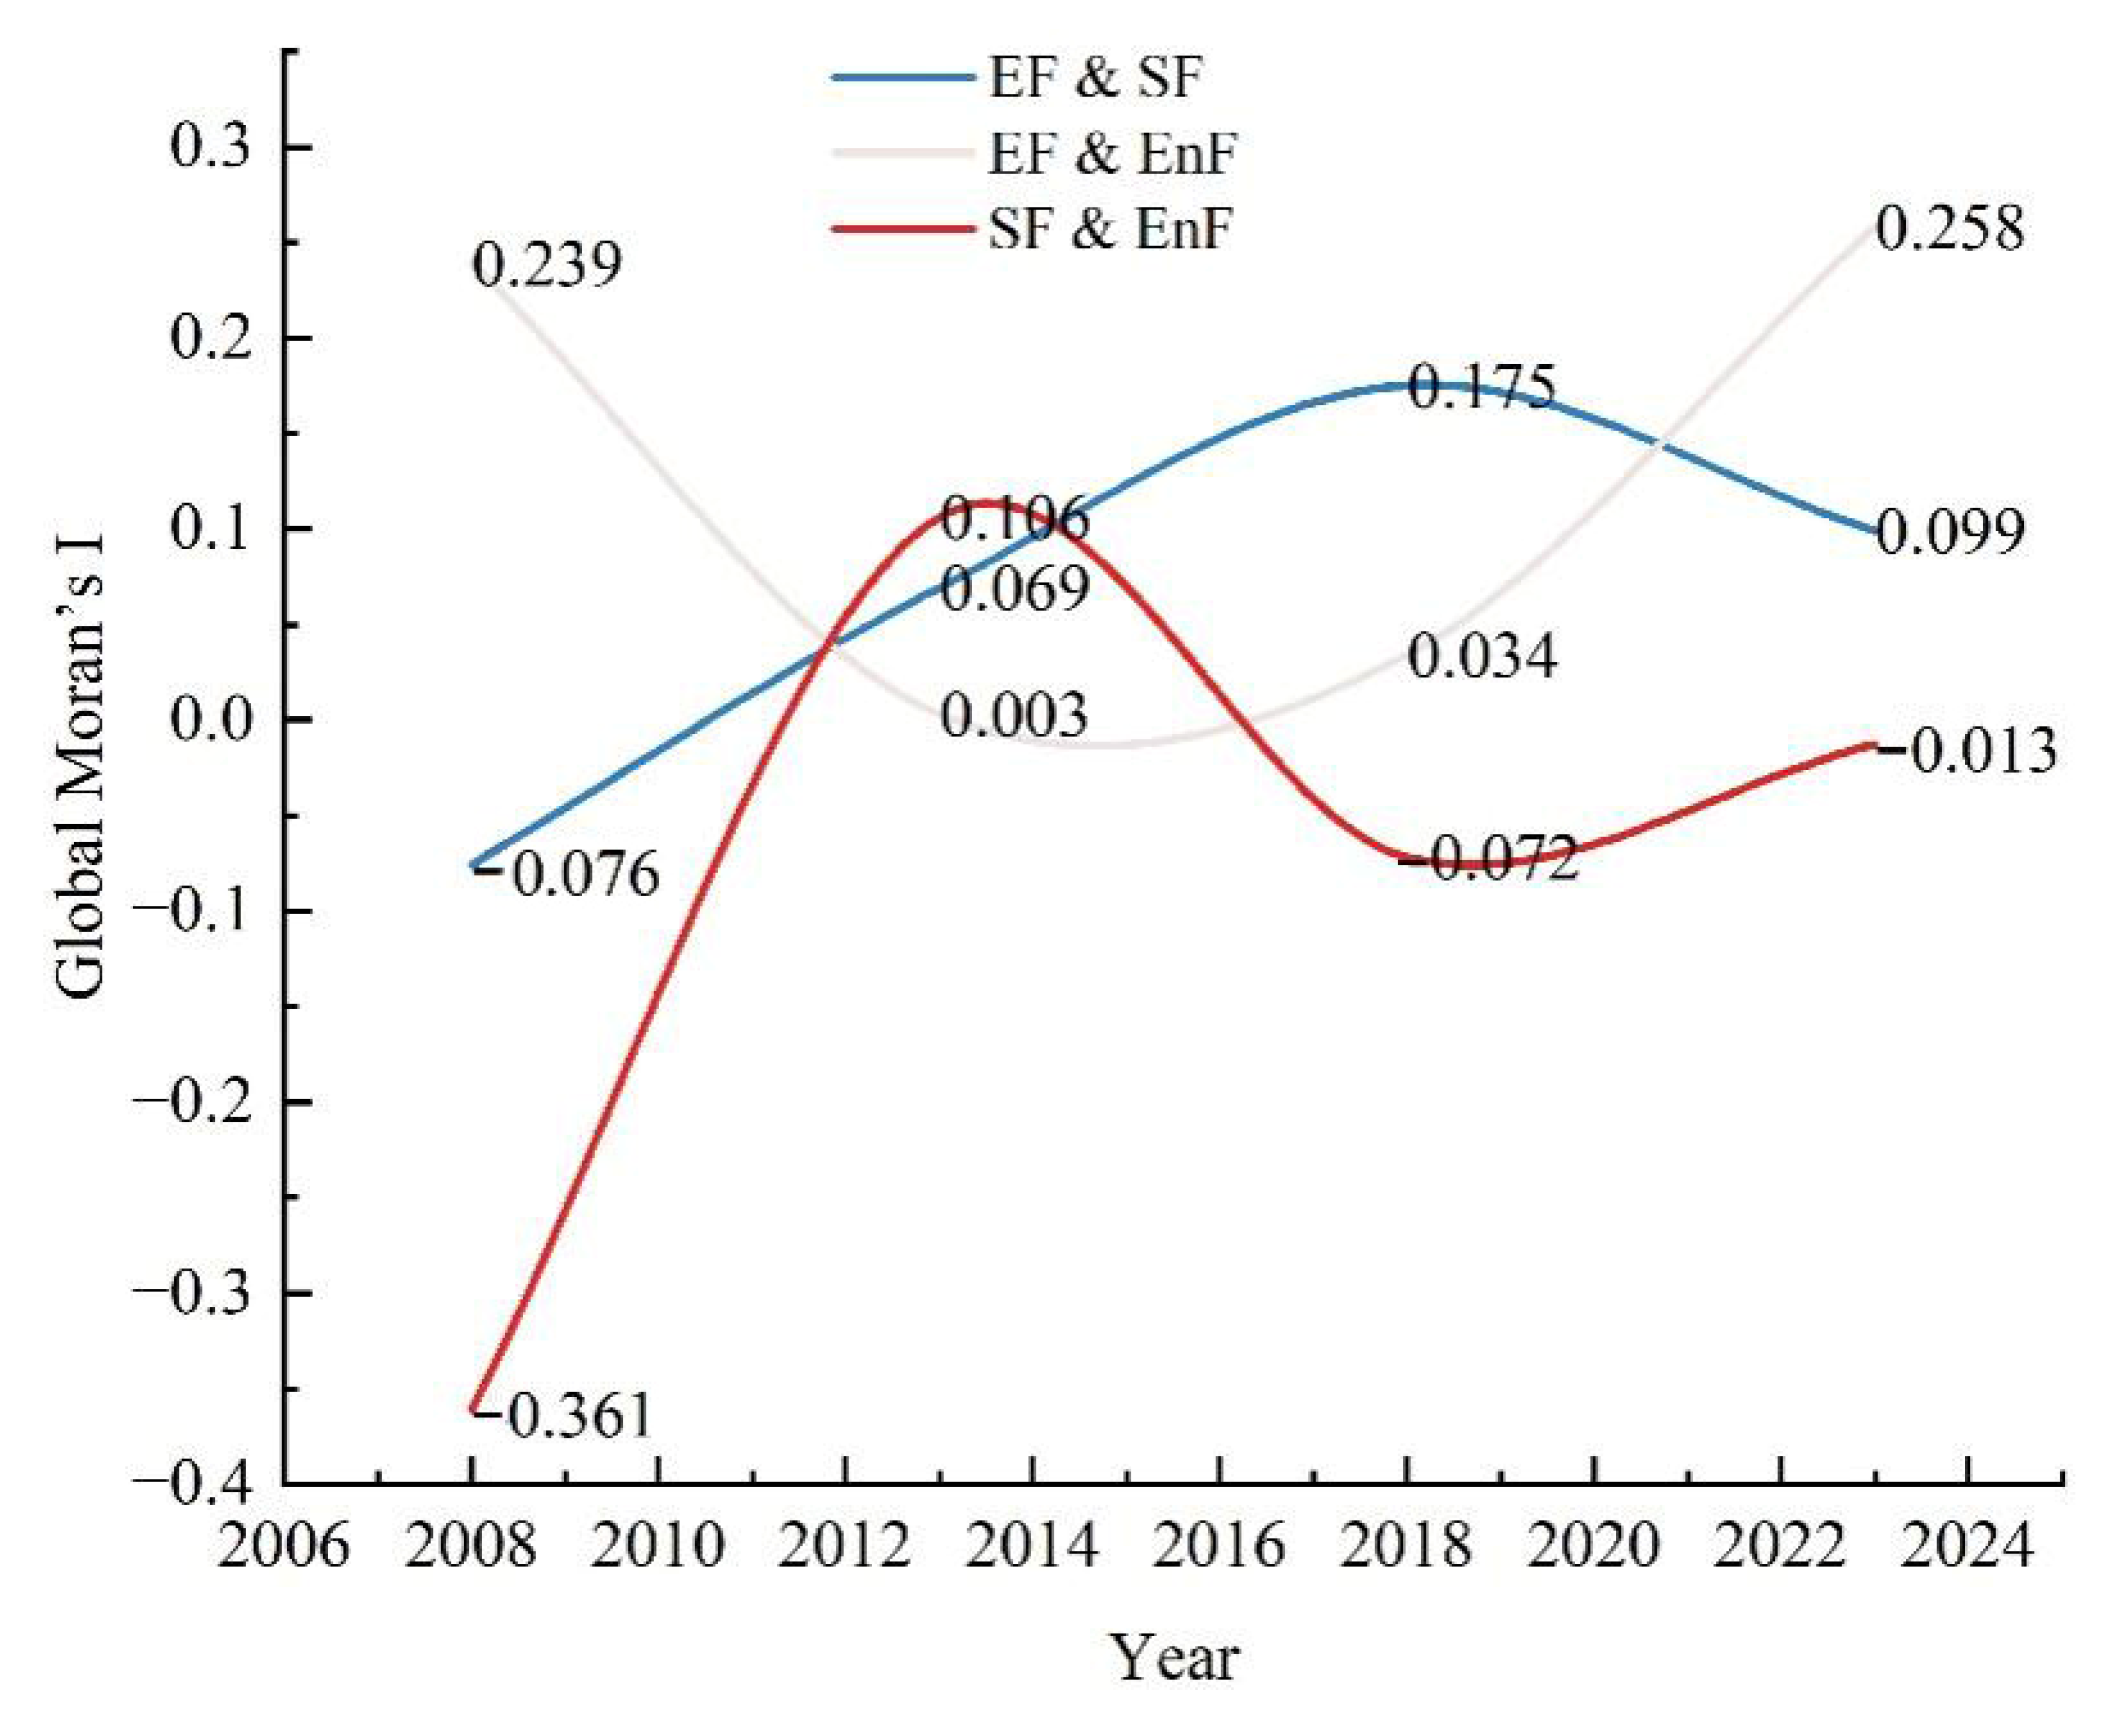
The results of the global spatial autocorrelation analysis (Figure 6) indicate that the global Moran’s Index between EF and EnF remained positive throughout the study period. In contrast, the EF-SF interaction showed a mild increase from negative to positive before 2018, but with a slight decline after 2018. Regarding the SF-EnF interaction, a predominantly fluctuating trend was observed from 2008 to 2023, with a peak value of 0.106 in 2013, indicating a synergistic relationship.
(2)
Bivariate local spatial autocorrelation
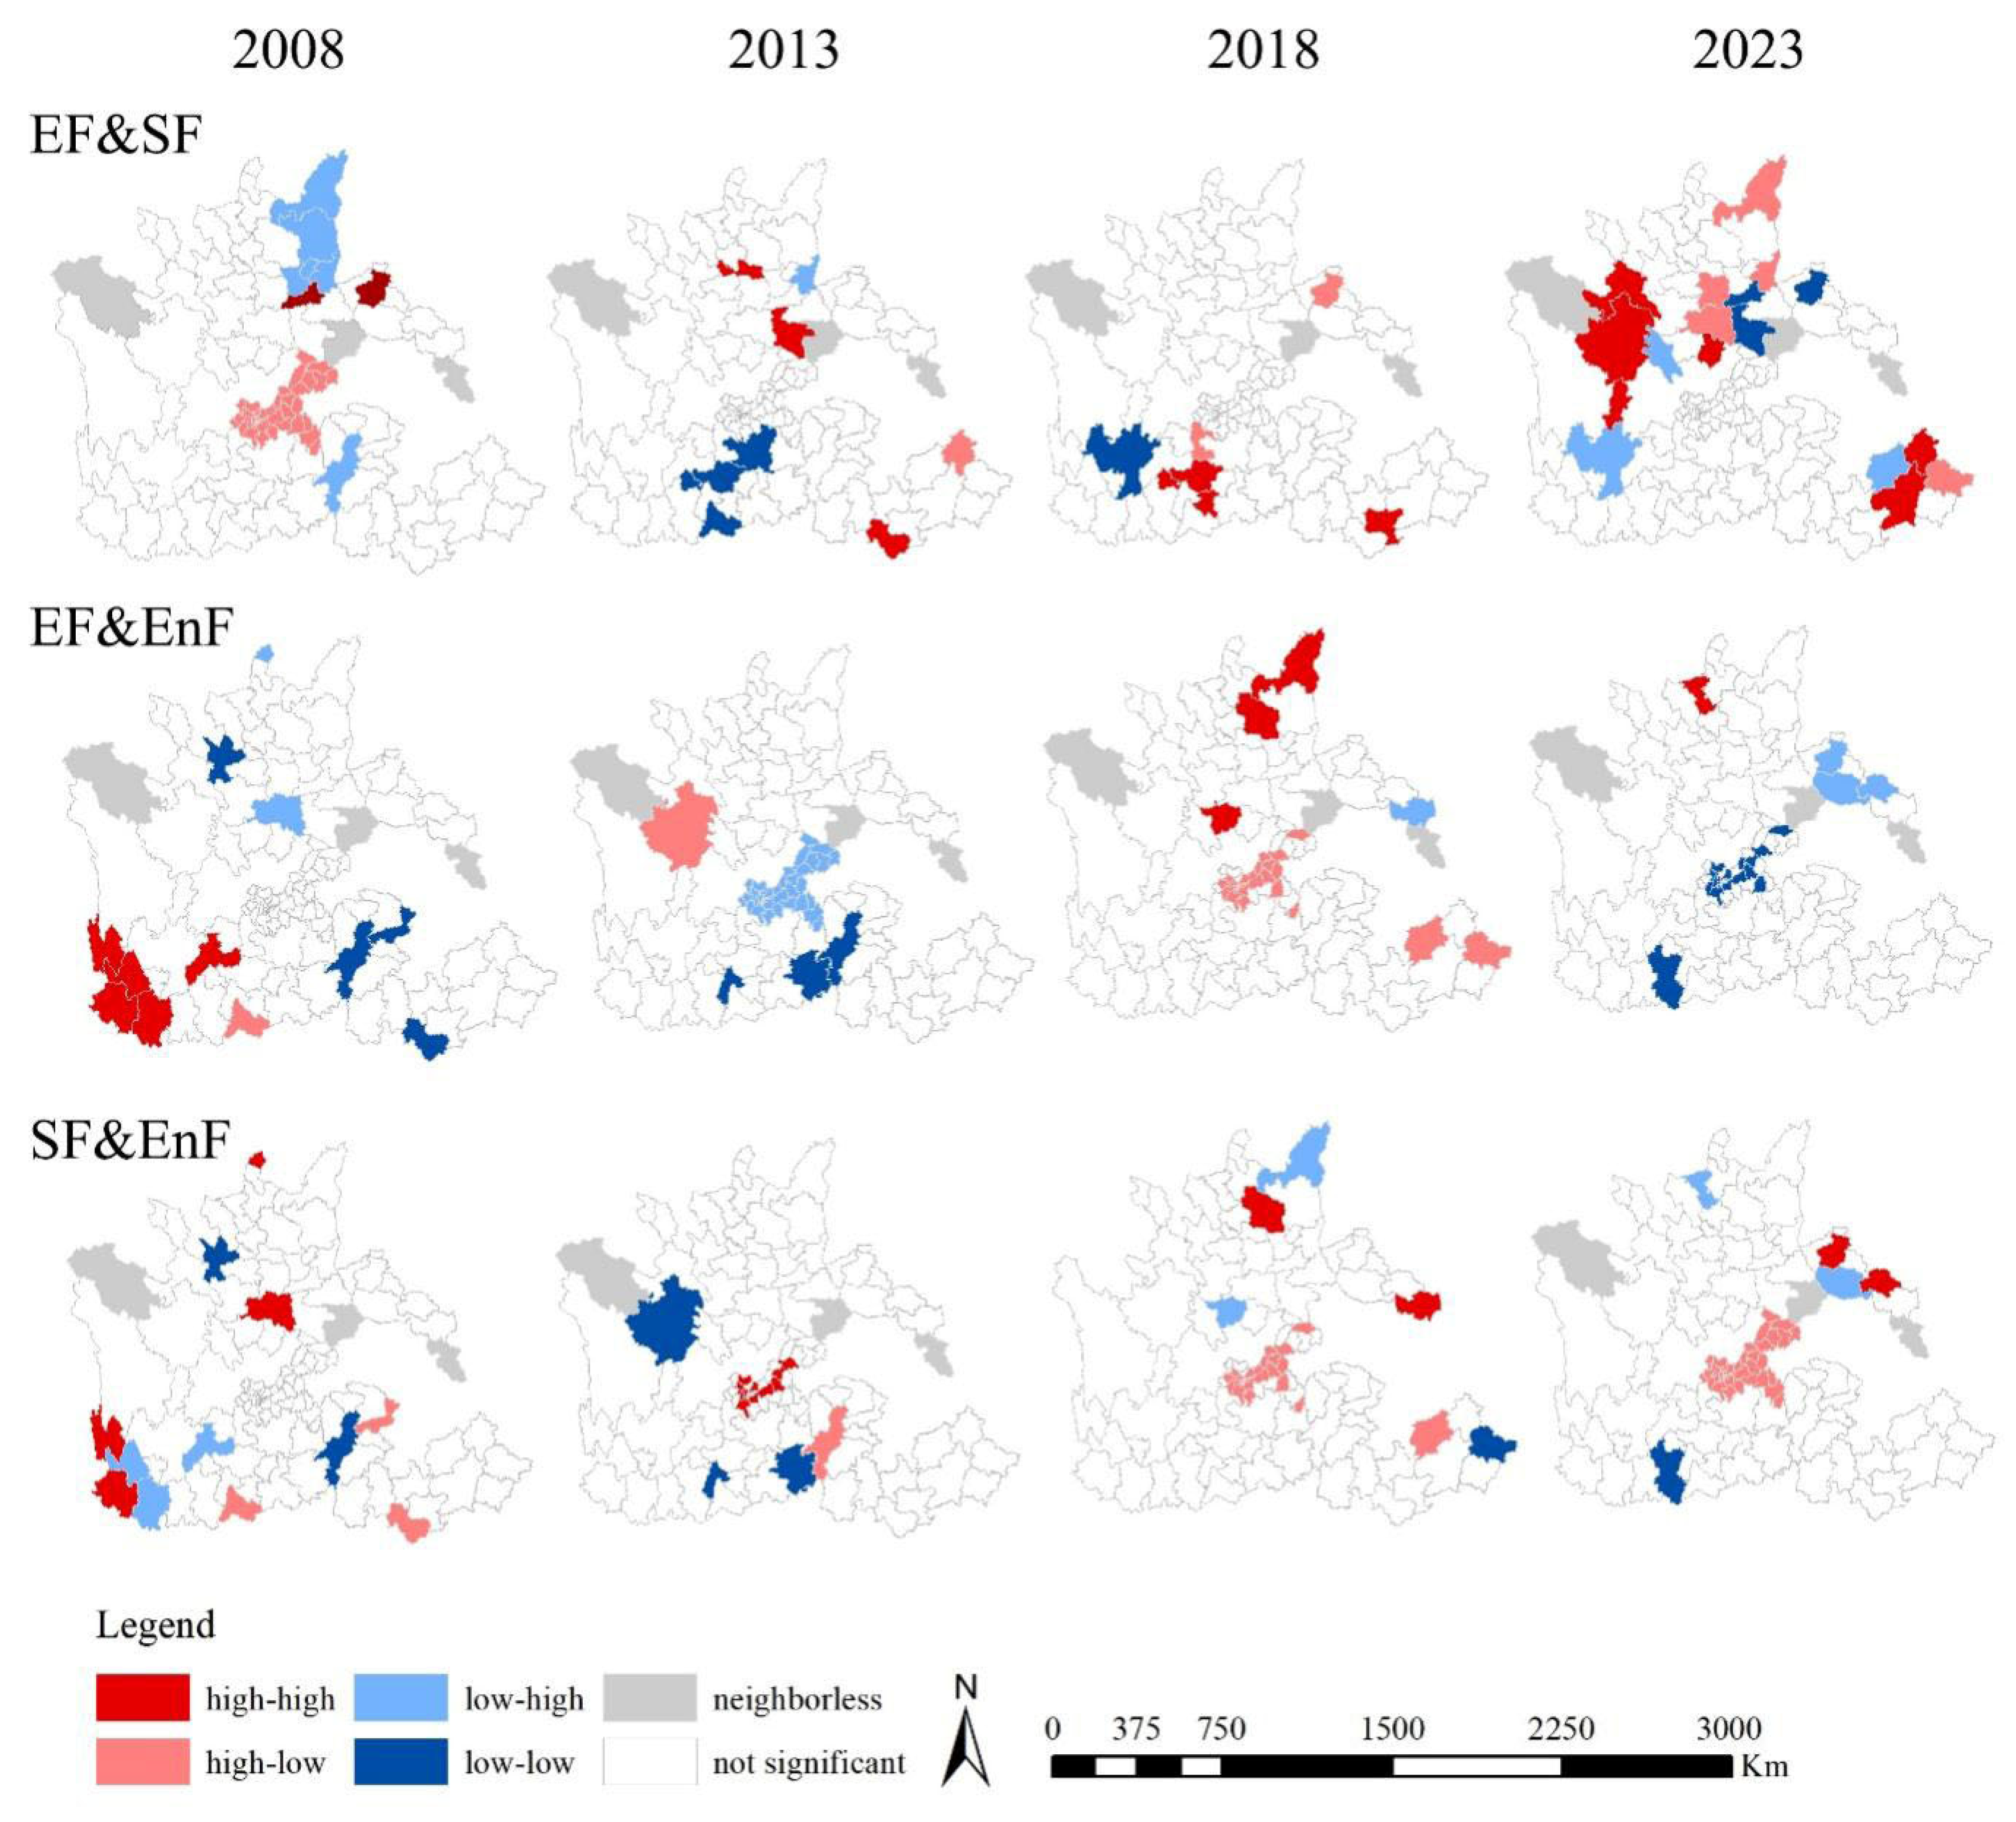
To further explore the spatial heterogeneity of LUMF trade-offs/synergies in the CLMNCP from 2008 to 2023, this study employed a bivariate local spatial autocorrelation model to calculate the spatial interactions among economic, social, and environmental functions. The results that passed the significance test (p ≤ 0.05) were spatialized, and distinct spatial patterns were identified (Figure 7).
Regarding the interaction between EF and SF, a dominant trend was observed: from 2013 to 2023, synergy between EF and SF was more spatially prevalent than trade-off, whereas trade-off dominated in 2008. Initially, synergies were primarily scattered in the central and southern parts of the national cultural park (e.g., Shanxi, Henan, and Guizhou provinces). Over time, they expanded to the northwestern and southwestern parts of the park, particularly in historic districts (e.g., Jiangxi, Fujian, and Hunan provinces), where economic and social functions increased simultaneously. Trade-offs were significantly observed in Sichuan, Gansu, and Shanxi provinces, indicating an obvious trend of gradual expansion from the center to the periphery—areas where economic function increased notably while social function decreased.
Regarding the interaction between EF and EnF, a prominent fluctuating trend in the spatial distribution ratio of trade-offs and synergies was observed over the study period. From 2013 to 2018, the spatial distribution ratio of trade-offs between EF and EnF was significantly higher than that of synergies and exhibited a downward trend, whereas synergies dominated in 2008 and 2023. Trade-off areas were concentrated in the central parts of the study area and gradually expanded to the periphery during the study period. Synergistic areas were initially scattered in the southern parts of the national cultural park in a “block-like” manner and gradually became agglomerated in central metropolises (such as Chongqing). Consequently, EF-EnF synergies exhibited an overall upward trend with a relatively moderate growth rate, despite experiencing a fluctuating decline in the middle years of the study period. In contrast, trade-offs between EF and EnF became prevalent from 2013 to 2018, indicating that environmental functions of land were temporarily sacrificed in pursuit of economic growth.
Regarding the relationship between social and environmental functions, trade-off areas were mainly concentrated in the southern parts of the study area and gradually migrated northward over the study period. In contrast, synergies dominated over trade-offs after experiencing a slight increase from 2008 to 2013. Consequently, the social and environmental effects of land functions in the study area exhibited a waxing and waning trend, with environmental-ecological functions being increasingly encroached upon by the expansion of socio-cultural service provisions.

4.3. Driving Factors of Trade-Offs and Synergies Among LUMF

4.3.1. Identification of Dominant Factors for Trade-Offs and Synergies Among LUMF

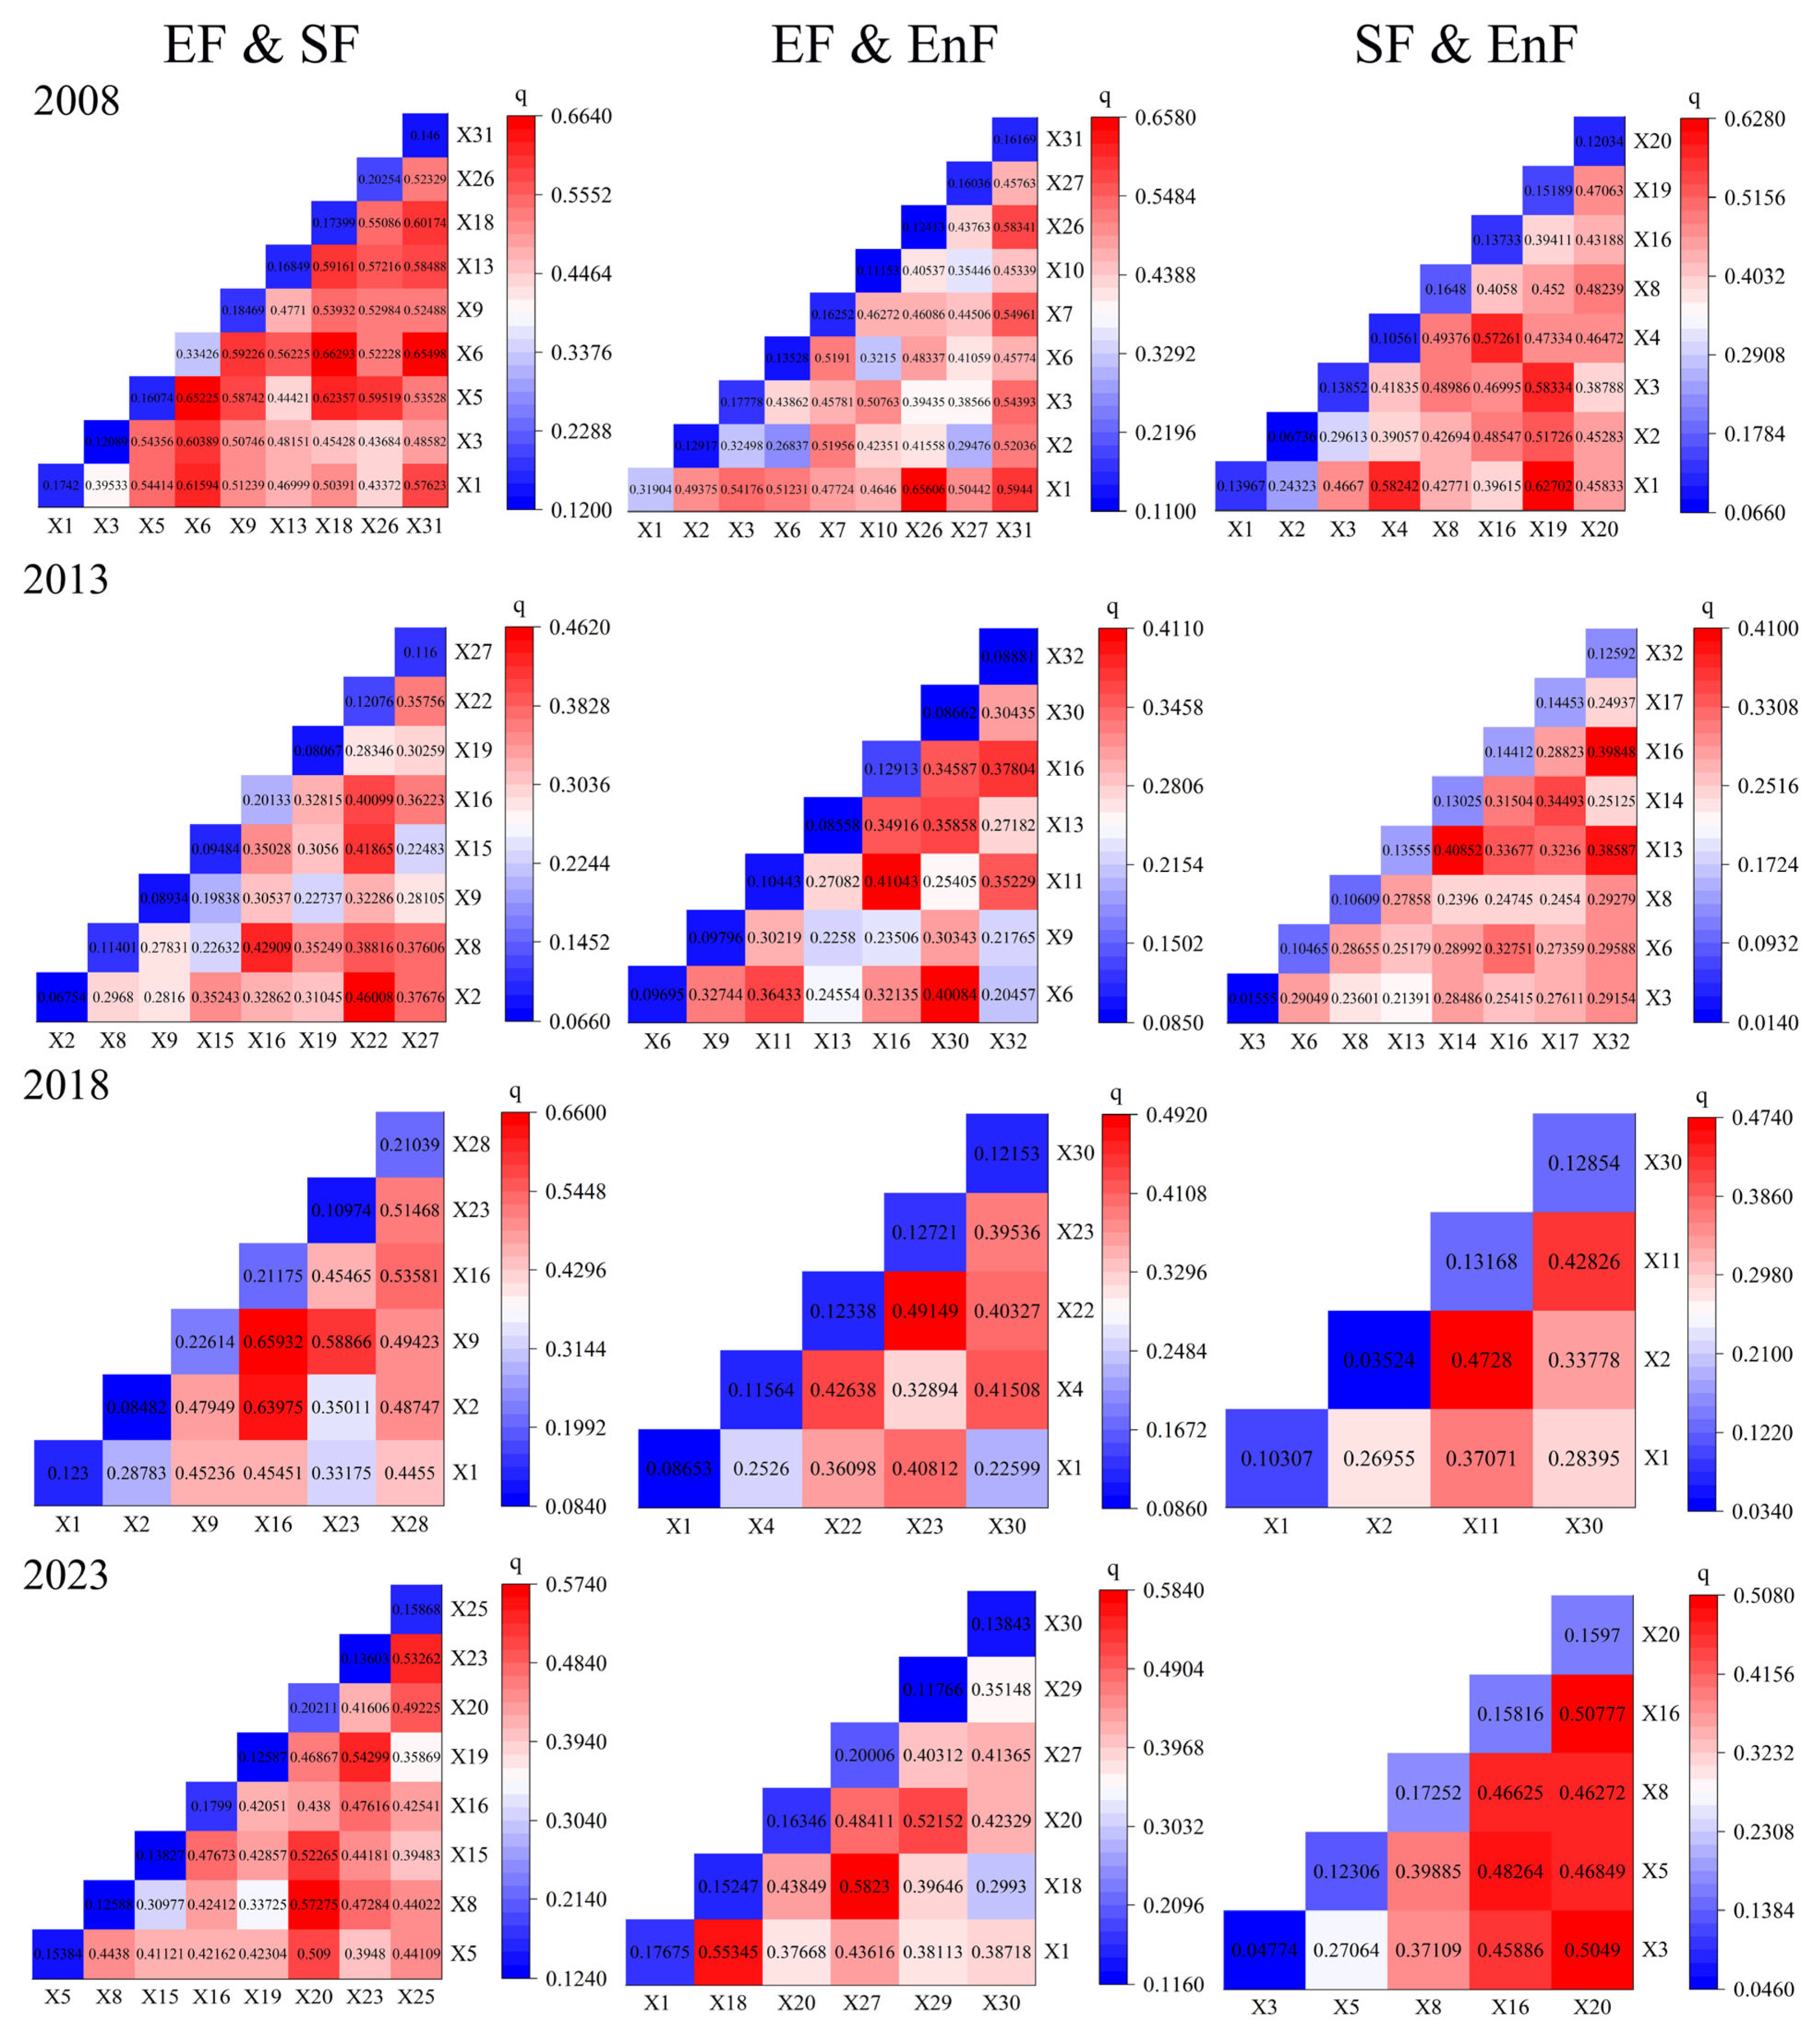
Table 8 presents the explanatory power (q-value), two-tailed significance levels, and rankings of the 32 factors influencing the trade-offs and synergies among LUMF in the CLMNCP from 2008 to 2023, as derived from the GeoDetector model.
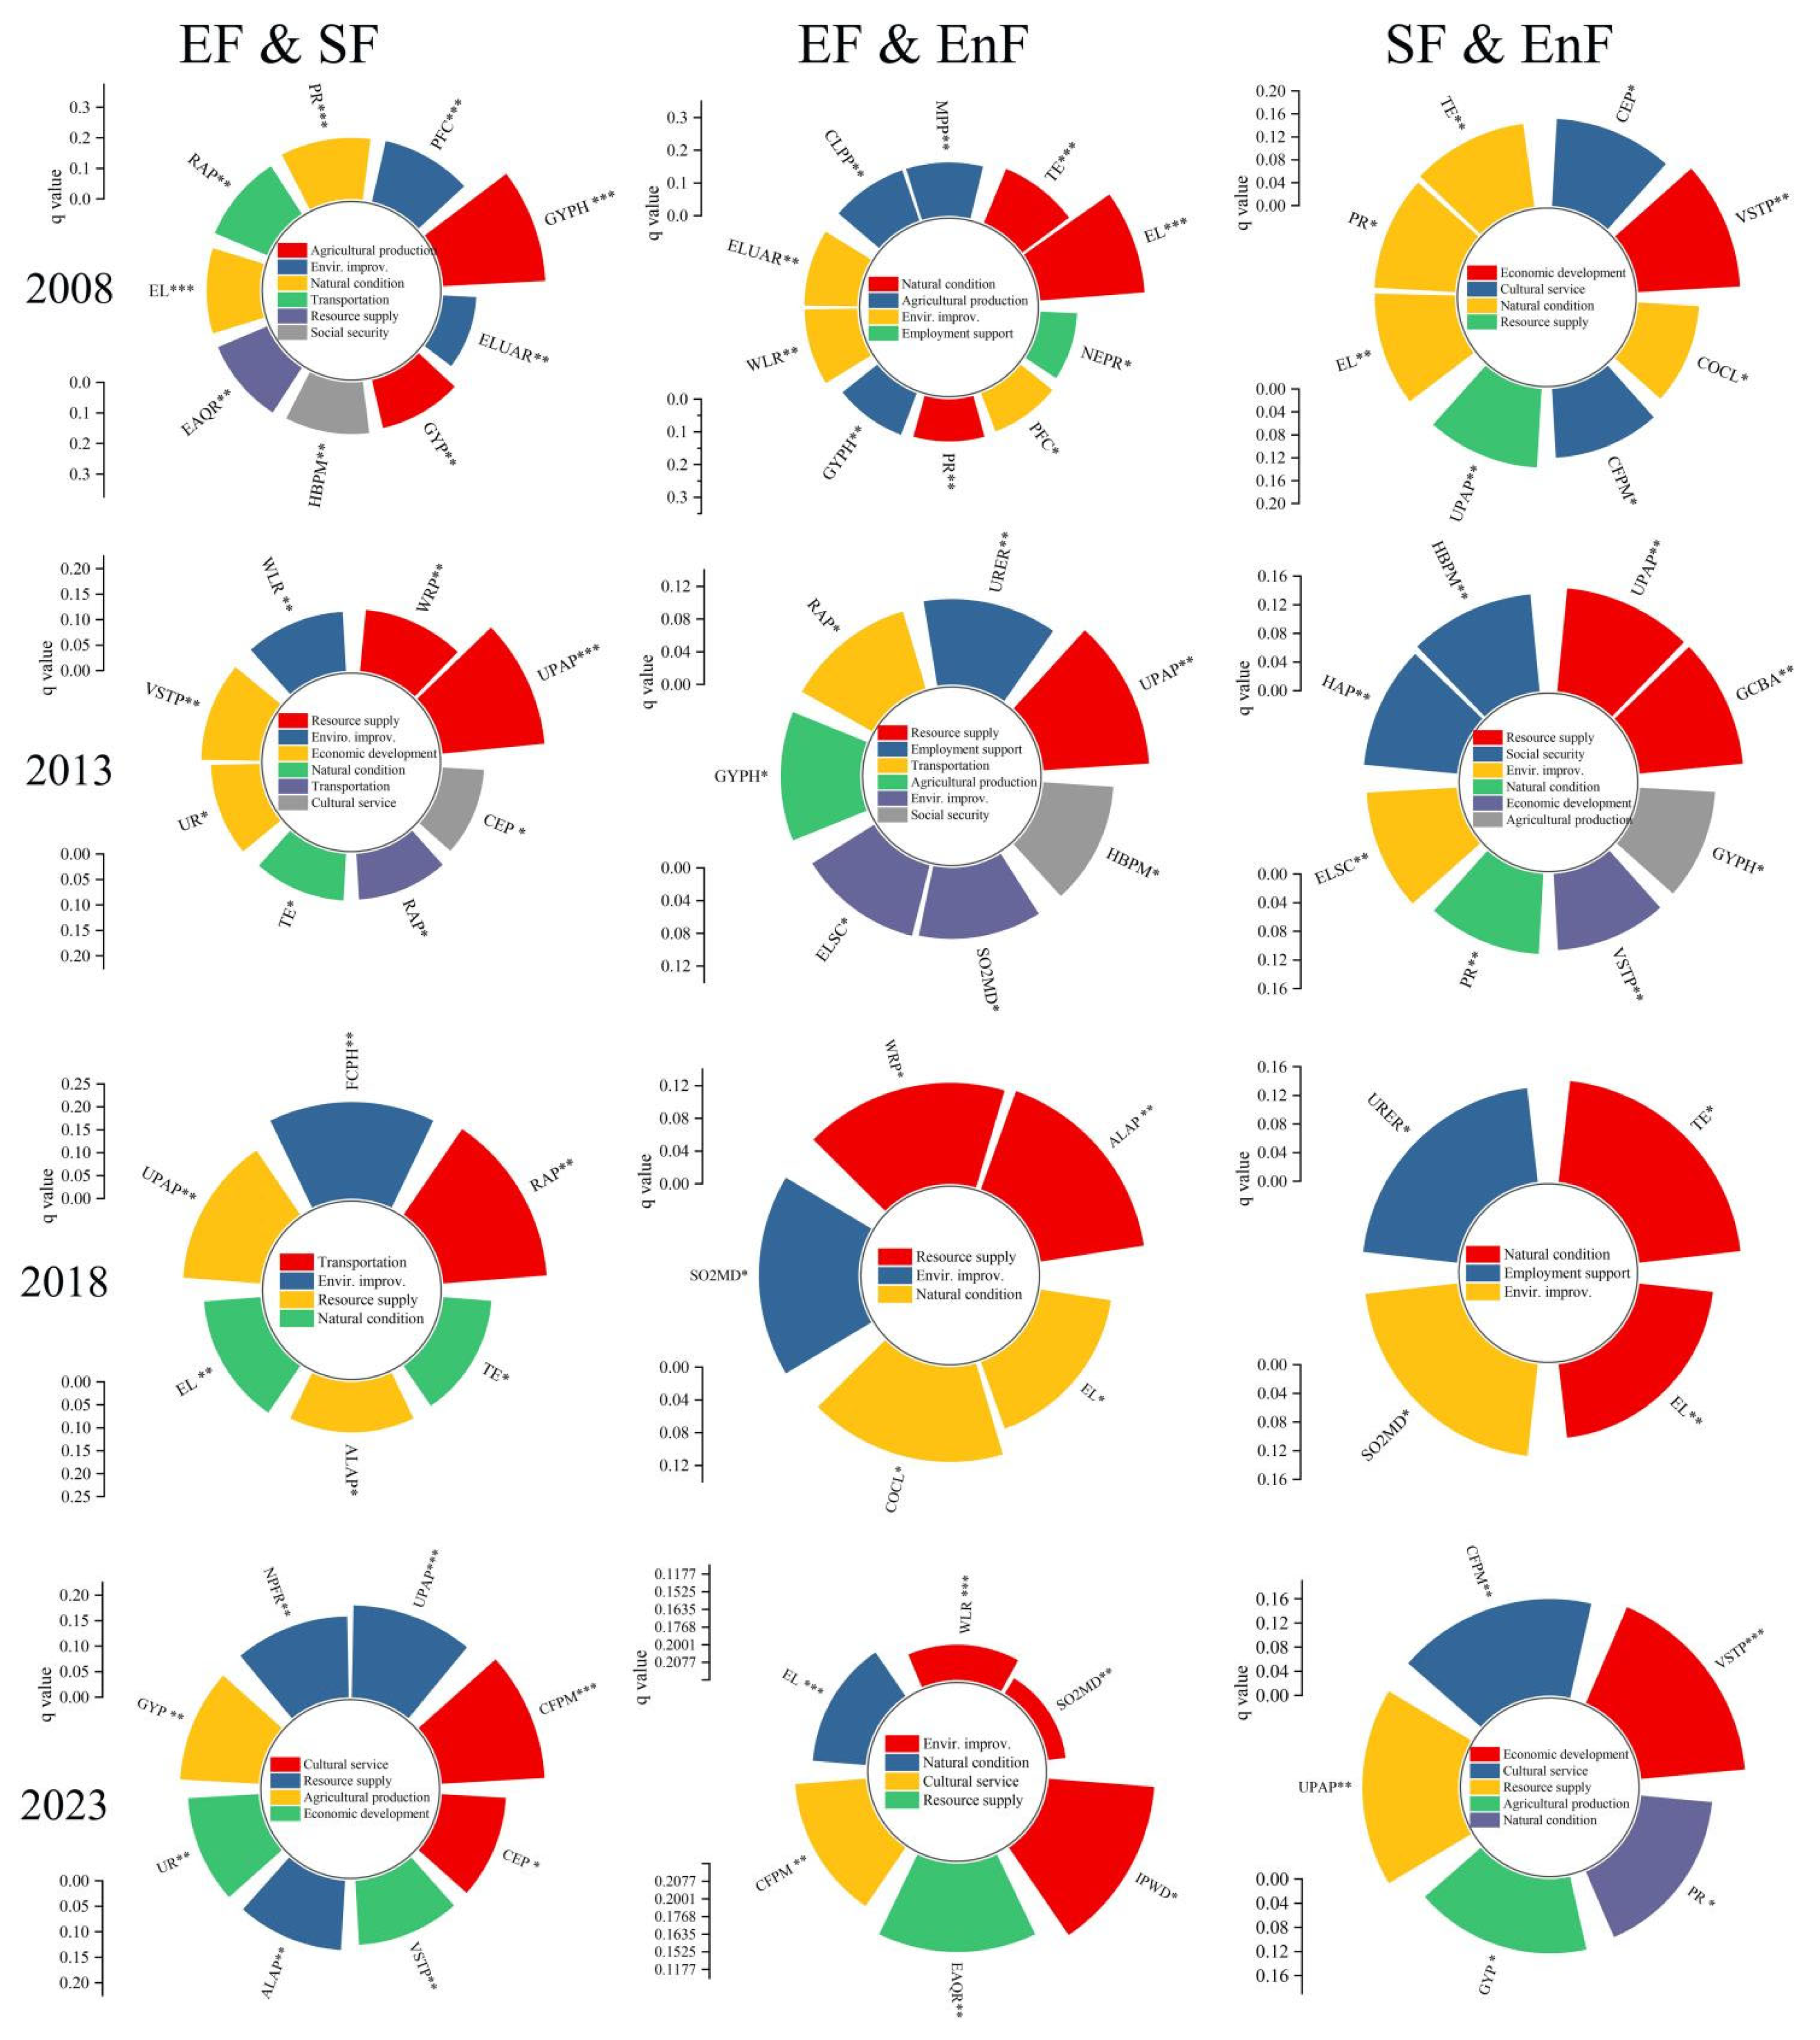
The results of factor detection illustrate the relative importance of multidimensional influencing factors on LUMF trade-offs/synergies in the CLMNCP from 2008 to 2023 (Figure 8).
As shown in Table 8 and Figure 8, the primary factors influencing the synergistic relationship between EF and SF in the CLMNCP from 2008 to 2023 were mainly concentrated in the dimensions of resource supply, agricultural production, cultural services, environmental improvement, transportation, natural conditions, and social security. Factor detection results indicated that the dominant factors (q > 0.2) affecting EF-SF synergies included the CFPM, RAP, FCPH, UPAP, PFC, and GYPH. The peak explanatory power occurred in 2008 with GYPH. These findings suggested that factors related to agricultural production, resource supply, environmental improvement, and cultural services exerted substantial influence on EF-SF synergies. In particular, factors within the dimensions of agricultural production, resource supply, and cultural services—namely GYPH, UPAP, RAP, PFC, and CFPM—emerged as the most influential drivers of the synergies between economic development and social improvements in the CLMNCP.
Regarding the EF-EnF interaction, the key influencing factors (q > 0.15) spanned the dimensions of natural conditions, agricultural production, environmental improvement, and cultural services. These included SO2MD, WLR, EL, CFPM, TE, MPP, and ELUAR. Among them, EL exhibited the greatest influence in 2008. These results demonstrate that factors related to natural conditions and environmental improvement played a crucial role in shaping the synergies between economic and environmental functions in the CLMNCP. Specifically, no individual factor achieved a strong explanatory power (q > 0.15) or exerted a substantial influence on EF-EnF interactions in 2013 and 2018.
Regarding the SF-EnF synergies, the dominant factors (q > 0.15) were concentrated in the dimensions of economic development, cultural services, and resource supply. These included VSTP, CFPM, UPAP, as well as CEP. However, no individual factor achieved a strong explanatory power (q > 0.15) or exerted a prominent influence on SF-EnF synergistic relationships in 2013 and 2018. Overall, economic development, cultural services, and resource supply emerged as strong contributors to the synergies between social and environmental functions in the CLMNCP.

4.3.2. Interaction Between Explanatory Variables

The results of interaction detection demonstrate that the interaction between explanatory variables substantially improved the explanatory power for LUMF trade-offs/synergies in the CLMNCP. Moreover, multi-factor combinations played a key role in driving the transitions of LUMF trade-off/synergistic relationships within the national cultural park (Table 9, Figure 9). Interaction detection revealed that multi-factor combinations substantially enhanced the explanatory power. While the explanatory power of all individual factors remained below 0.4, multi-factor interactions significantly amplified it to exceed 0.5.
The Robustness test results (Table 10) demonstrate that the interaction types of the core factor pairs remain fundamentally unchanged across various discretization parameter settings (consistently classified as “Bi-enhanced” or “Nonlinear-enhanced”). This finding indicates that, despite the presence of overlap among variables, the core interaction-driven mechanisms identified in this study are insensitive to variations in discretization parameters, confirming the robustness of the results.
In 2008, interactions among factors related to natural conditions, agricultural production, and environmental improvement significantly influenced EF-SF synergies in the CLMNCP. These factors included GYP, GYPH, EAQR, PFC, and ELUAR. In 2013, interactions among factors within the dimensions of resource supply and economic development exhibited comparatively lower explanatory power. These included WRP, UPAP, and VSTP. By 2018, the most influential multi-factor interactions for EF-SF trade-offs/synergies had shifted to combinations involving factors from the resource supply dimension (e.g., UPAP) paired with either natural conditions (TE) or transportation (RAP). In 2023, EF-SF trade-offs/synergies were strongly driven by interactions between CFPM and VSTP, indicating that economic development significantly stimulated socio-cultural service improvements. Concurrently, interactions among UR, GYP, and CFPM also substantially contributed to economic-social function synergies. Overall, a prominent transition was observed in the factor interactions substantially affecting EF-SF trade-offs/synergies: from interactions among factors related to natural conditions, agricultural production, and environmental improvement to those involving cultural services, resource supply, and environmental improvement.
In 2023, the interactions between EAQR and EL, as well as between EAQR and WLR, exerted the strongest influence on EF-EnF trade-offs/synergies. Both pairs of factors fall within the dimensions of environmental improvement and natural conditions. Additionally, the interaction between CFPM and IPWD significantly affected EF-EnF trade-offs/synergies, indicating that factors from the cultural service dimension also contributed to EF-EnF synergies. In 2018, interactions among WRP, ALAP, COCL, and SO2MD had notable effects on EF-EnF trade-offs/synergies, although their explanatory powers remained lower. In 2008, a clear trend was observed: interactions among factors related to natural conditions and environmental improvement exerted significant influences on EF-EnF trade-offs/synergies. Interactions among factors within the dimensions of environmental improvement, resource supply, and natural conditions substantially affected EF-EnF trade-offs/synergies. In particular, the interplay between natural conditions and environmental improvement factors demonstrated the most prominent influence.
Interaction detection for SF-EnF trade-offs/synergies in the CLMNCP in 2023 revealed that interactions between UPAP and CFPM, as well as between UPAP and GYP, and between PR and CFPM, significantly increased the explanatory power. These interacting factors belong to the dimensions of natural conditions, cultural services, and resource supply. In contrast, factor interactions had little effect on SF-EnF trade-offs/synergies in 2018 and 2013. In 2008, prominent influences on SF-EnF trade-offs/synergies were achieved through interactions among factors including EL, PR, CEP, COCL, and UPAP. The highest explanatory power emerged from the interaction between EL and CEP. Therefore, a clear trend was observed: interactions among factors related to natural conditions, cultural services, and resource supply consistently and substantially enhanced the explanatory power and influenced SF-EnF trade-offs/synergies throughout the study period.

5. Discussion

5.1. Insight into the LUMF Trade-Offs/Synergies in the CLMNCP

This study reveals a structural shift in the drivers of EF-SF synergy. The traditional dominance of agricultural production and natural conditions was supplanted by the interplay of cultural services, resource supply, and environmental improvement. This transition suggests that integrating cultural and resource factors into regional development can enhance grain yields while alleviating environmental stress, offering a viable pathway toward sustainable agriculture. This trend aligns with SDG 2 (Zero Hunger), SDG 11 (Sustainable Cities and Communities), and SDG 15 (Life on Land), highlighting the potential of cultural-ecological integration to enhance food security, ecological resilience, and social well-being—offering a synergistic pathway for sustainable territorial governance. This observed transition from a trade-off to a synergistic EF-SF relationship after 2012 contrasts with findings from some conventional agricultural regions, where economic and social functions often exhibit persistent trade-offs due to competing demands for labor and land resources [72]. Conversely, it resonates with research in metropolitan fringe areas and heritage tourism destinations, where cultural heritage and improved social infrastructure have simultaneously stimulated local economic growth and enhanced social well-being [6,73]. Studies in Guangzhou and Hangzhou similarly identified significant synergies between production and living functions, with high synergy areas expanding from urban cores to peripheries [6,74]. This pattern closely mirrors the spatial evolution of EF-SF synergy observed in the CLMNCP.
Despite the acknowledged contributions of environmental improvement, resource supply, and natural conditions to EF-EnF synergy, pronounced trade-offs dominated the CLMNCP during 2013–2018, indicating that environmental gains were sacrificed for short-term economic expansion amid rapid urbanization. Spatially, these trade-offs originated in densely populated, economically vibrant central plains cities and progressively diffused into peripheral, topographically complex regions with slower socioeconomic growth. This spatial pattern reflects a deepening urban-rural discord, driven by a singular focus on GDP growth during this peak urbanization period, which fueled population influx and accelerated urbanization at the cost of environmental integrity. This growth model fundamentally conflicts with SDG 13 (Climate Action), SDG 15, and SDG 11. To reverse this trend, territorial governance must evolve from a GDP-centric to an economy–ecology nexus by strengthening ecological redlines and green infrastructure, thereby aligning growth with sustainability. The predominance of EF-EnF trade-offs during peak urbanization aligns with global evidence from rapidly developing regions, where short-term economic gains typically precede environmental remediation [75,76]. While such trade-offs are well-documented during intensive land-use transformation [73,76], this study uncovers a critical spatial dimension that has received limited attention: a pronounced spillover effect from central cities to peripheral mountains. This pattern reveals a mechanism of “ecological cost outsourcing,” whereby urban environmental burdens are displaced onto less developed hinterlands—a dynamic largely overlooked in previous LUMF research, which has tended to emphasize aggregate trends over spatial propagation [72,77]. Corroborating this finding, multi-scenario simulations in Jiaxing and the Pearl River Delta demonstrate that urban development consistently compromises agricultural and ecological functions, with trade-off intensities varying markedly across spatial contexts [77,78].
The SF-EnF relationship in the CLMNCP exhibited pronounced spatiotemporal fluctuations. The initial synergy (2008–2013) coincided with a period of limited development, characterized by modest economic growth and low urbanization. During this phase, the scarcity of public cultural facilities meant that human-environment interactions were largely confined to vernacular agricultural practices, inadvertently fostering a gradual SF-EnF synergy. However, post-2013, the commercialization of cultural heritage under a culture-tourism integration framework drove rapid construction land expansion and intensive tourist activities. This expansion progressively compressed ecological space and degraded environmental quality—a trade-off reflecting the tension between cultural commodification and ecological integrity. These trade-offs reveal that culture-led development, if unconstrained by ecological limits, can undermine SDG 8 and SDG 12. Sustainable governance must therefore embed cultural expansion within ecological carrying capacity to secure a balanced culture–society–ecology nexus. The inverted U-shaped trajectory of the SF-EnF interaction represents a distinctive finding that both aligns with and diverges from previous research. While studies in protected areas typically report persistent trade-offs driven by human–wildlife conflicts or recreational pressures [79], and research in traditional rural areas often documents stable synergies between low-intensity social activities and environmental quality [80], the CLMNCP exhibits a phased transition between these two states. This dynamic pattern reflects the specific developmental timeline of China’s cultural tourism policies, illustrating how policy-driven shifts in cultural service demand can fundamentally restructure socio-environmental relationships—a temporal nuance largely overlooked in cross-sectional LUMF analyses. Crucially, multi-scenario simulations suggest that the balance between social and environmental functions can be actively managed through compact urban forms and multifunctional land-use strategies that simultaneously accommodate social needs and ecological preservation [77,81].

5.2. Driving Factors for LUMF Trade-Offs/Synergies in the CLMNCP

Multifactor interactions across dimensions substantially enhanced the explanatory power for EF-SF dynamics in the CLMNCP. Notably, the results revealed a fundamental shift in the drivers of economic-social interactions: the traditional dominance of agricultural–natural or agricultural–environmental couplings has been supplanted by the growing influence of cultural services intersecting with economic and resource-based factors. This transition reflected the growing relevance of SDG 11 and SDG 8, emphasizing the need to integrate cultural infrastructure with agricultural and ecological systems in territorial governance. This shift in dominant drivers distinguishes our findings from earlier LUMF research, which has consistently identified natural conditions and agricultural factors as primary determinants of functional interactions in conventional landscapes [45,75]. Studies in Hangzhou [6] and Guangzhou [74], for example, found that natural factors outweighed socioeconomic drivers in shaping EF-SF trade-offs. While our analysis reveals that by 2023, cultural service factors had ascended to equal or greater prominence, suggesting that heritage presentation and tourism infrastructure can override traditional biophysical constraints in culturally significant landscapes—a dynamic largely overlooked in a literature historically focused on EF-SF trade-offs. This finding responds to recent calls to integrate cultural dimensions into land system science [73].
The drivers of EF-EnF trade-offs/synergies exhibited a marked temporal shift from 2008 to 2023, transitioning from those between natural conditions and either agricultural production or environmental improvement to those between environmental improvement and cultural services or resource supply. This transition suggests that reconciling economic development with environmental protection increasingly depends on the synergistic coupling of eco-environmental improvements with efficient resource utilization and diverse cultural service provisions—rather than on natural endowments or agricultural intensification alone. This evolution supports SDG 6 (Clean Water), SDG 7 (Clean Energy), and SDG 13, demonstrating that integrating ecological restoration, green infrastructure construction, and cultural services enhances territorial resilience and advances low-carbon development pathways. This finding marks a notable departure from early research, which emphasized the primacy of natural endowment [81]. While studies in the 2010s predominantly identified topography and climate as the fundamental constraints on economic-environmental relationships [75], recent research increasingly acknowledges the role of active environmental governance [82,83]—a shift likely attributable to China’s large-scale ecological restoration and pollution control efforts since the mid-2010s. This suggests that proactive governance can partially decouple economic-environmental dynamics from natural constraints, an optimistic finding that builds upon—and moves beyond—earlier studies centered on passive natural determinants. Supporting this conclusion, Gao et al. [81] demonstrated that multifunctional urban land-use strategies incorporating environmental improvements could effectively mitigate natural habitat degradation, reinforcing our assertion that anthropogenic interventions can reshape EF-EnF dynamics.
Analysis of SF-EnF interactions reveals a progressive shift in dominant drivers. The synergistic interplay between cultural services and natural/resource factors persistently enhanced explanatory power throughout the study period. Meanwhile, the influence of natural conditions steadily eroded, increasingly supplanted by factors from the environmental improvement and socioeconomic (social security, employment support) dimensions. This finding directly challenges the persistent emphasis on natural conditions in previous SF-EnF research, particularly studies from biodiversity hotspots where elevation, habitat quality, and ecosystem integrity dominated explanatory models [79]. The ascendancy of socio-cultural and environmental improvement factors in the CLMNCP suggests that, in cultural landscapes, social-environmental coupling is increasingly mediated by policy-driven investments rather than inherent natural characteristics. Supporting evidence from related fields strengthens this view. Cultivated land multifunctionality in mega-urban agglomerations is shaped more by socio-economic factors than by natural conditions [78]; urban growth boundaries are similarly driven by stakeholder preferences rather than biophysical constraints [77]. This convergence suggests a key update to LUMF frameworks: in anthropogenically shaped territories, socio-political forces progressively override natural determinants as the primary drivers of social-environmental interactions. These results reinforce the imperative to integrate social equity—particularly SDG 1 (No Poverty), 3 (Health), and 10 (Reduced Inequalities)—into territorial governance. Future strategies must ensure that cultural and environmental benefits are equitably distributed, thereby fostering a society–ecology–culture synergistic governance framework.

5.3. Policy Implications for LUMF Management and Thematic Functional Zonation

5.3.1. Key Advancements Informing Management

This study yields three principal advancements with direct implications for land use governance in the CLMNCP and analogous protected areas. First, spatiotemporal analysis reveals that EF-EnF trade-offs dominated during 2013–2018 and progressively expanded from central urban agglomerations to peripheral mountainous regions, indicating spatial spillover of ecological costs driven by urbanization. Second, factor detection demonstrates that cultural service factors evolved from marginal to dominant drivers of functional interactions by 2023, superseding traditional agricultural and natural condition factors. Third, interaction detection confirms that multifactor combinations—particularly those encompassing cultural services, environmental improvement, and resource supply—exhibit substantially enhanced explanatory power, affirming that synergistic governance across these dimensions is essential for optimizing LUMF trade-offs.

5.3.2. Management Recommendations

Based on these advancements, the following recommendations are proposed for optimizing LUMF within the CLMNCP’s thematic functional zones:
(1)
management strategies for construction-control zones with pronounced economic-environmental trade-offs (Fujian, Jiangxi, Hunan, Sichuan, Chongqing, encompassing the Yangtze River tributaries and critical ecological barriers such as the Jinggang and Jinfo Mountains) are refined through three interconnected dimensions: Regulatory constraint imposes differentiated land-use governance on ecologically sensitive core areas based on natural factors (elevation and SO2 emission intensity), coupled with systematic ecological restoration interventions (water conservation forests, soil erosion control) to consolidate territorial spatial security. Value transformation transcends containment paradigms by strategically aligning restoration ecological outcomes with resource commodification, cultivating an ecological agricultural system (fruits, ecological livestock, high-quality nuts) calibrated to environmental carrying capacity—operationalizing the “environmental improvement-resource supply” effect to reconfigure ecological protection from constraint into competitive green advantage. Spatial governance addresses “ecological cost outsourcing” through institutionalized cross-jurisdictional horizontal compensation mechanisms, whereby financial transfers and technical assistance from beneficiary urban agglomerations to protected hinterlands internalize spatialized externalities—reconciling production-ecology tensions while advancing sustainable governance integrating ecological integrity, economic vitality, and regional equity.
(2)
management strategies for theme exhibition and cultural tourism integration zones—covering the western plateau-mountainous areas of Sichuan and Yunnan, the northern borderlands of Henan and Shanxi, and the southern peripheries of Guizhou, Hunan, and Jiangxi—are optimized through three interconnected dimensions. Industrial system configuration requires transcending conventional resource presentation by strategically investing in cultural infrastructure (museums, interpretation centers, heritage trails) to integrate dispersed heritage assets into networked experiential corridors, while leveraging montane biodiversity and ecological landscapes to develop tourism formats that synthesize ecological appreciation with historical-cultural immersion—thereby reinforcing the dual “cultural services-economic development” and “culture-environmental improvement” synergies. Risk mitigation demands rigorous containment of cultural tourism development within socio-ecological carrying capacities through dynamic monitoring and early-warning mechanisms encompassing visitor flows, environmental thresholds (water quality, biodiversity disturbance indices), and community resilience—ensuring that when cultural service demand approaches critical thresholds, investment pivots from spatial expansion toward experiential enhancement. Community co-benefit realization necessitates institutional arrangements—including concession systems, community-based co-management, and employment prioritization—to guarantee that indigenous populations in traditionally agrarian, low-density zones equitably share benefits from cultural service valorization and environmental improvement. This integrated approach reconciles cultural expansion with socio-ecological equilibrium, advancing a sustainable governance paradigm predicated on deep culture-society-ecology coupling.
(3)
Management strategies for traditional utilization zones—characterized by traditional farming, rural settlements, and cultural heritage—are reoriented toward continuing preservation and adaptive utilization. At the value level, Long March heritage should be embedded within local socio-ecological systems by integrating agricultural landscapes and historic settlements into cultural representation, thereby rendering indigenous livelihoods living vehicles of cultural service delivery. At the development level, the land expansion paradigm must be superseded; areas with lower resource supply pressure should be delineated through interactions between natural condition and resource supply, wherein cultural tourism and ecological agriculture—such as terraced landscape agriculture and agritourism embedded with Long March history—should be developed at a measured scale, while environmental quality improvements enhance the ecological premium of agricultural products, transitioning resource supply from extraction to cultural experience services. At the spatial level, the “ecological embedding” paradigm should be operationalized through regional-scale landscape optimization: preserving traditional configurations linking farmlands, forests, water systems, and settlements, while restoring ecological corridors (historic irrigation networks) to reinforce social-natural connectivity—transforming macro-scale trade-offs into micro-scale synergies and advancing sustainable governance through deep cultural, social, and environmental coupling within the CLMNCP.

5.3.3. Implications for Analogous Protected Area Systems

These findings offer transferable insights for protected area systems facing similar functional conflicts. For national parks with tourism-infrastructure pressure (e.g., Yosemite): Managers should monitor cultural infrastructure relative to ecological capacity. The EF-EnF spatial spillover—from urban centers to peripheral mountains—offers an early-warning template for identifying ecological cost transfers before escalation. For cross-regional heritage corridors (e.g., Camino de Santiago, Silk Roads): The dominance of multi-factor interactions—especially “culture and environment”—calls for integrated governance that jointly addresses cultural expansion and ecological protection. For cultural landscapes under urbanization pressure (e.g., Southeast Asian terraces, European vineyards): Agricultural factors retained consistent explanatory power but were gradually superseded by cultural drivers. This suggests a dual strategy: sustaining traditional practices as the landscape foundation while integrating cultural infrastructure to foster synergies. Grounded in the CLMNCP case, this study’s analytical framework, diagnostic tools, and management principles provide a generalizable template for evidence-based, adaptive governance of multifunctional landscapes in protected areas worldwide.

5.4. Bridging the Research Gap: Quantitative Insights into LUMF Heterogeneity and Drivers in the CLMNCP

Addressing the research gap in the spatiotemporal heterogeneity and driving mechanisms of LUMF CLMNCP, this study integrates multi-source data with a Geo-detector model to systematically elucidate their evolutionary dynamics and underlying causes. First, LUMF trade-off/synergy patterns show marked spatiotemporal evolution: EF-SF synergy strengthened persistently, driven by increasing integration of cultural services with resource supply; EF-EnF trade-offs dominated during 2013–2018, quantifying ecological cost transfer from urban cores to peripheral mountains. Second, while agricultural factors maintained consistent explanatory power, cultural service factors evolved from marginal to dominant influences by 2023, pervasively shaping all functional interactions—filling critical gaps in cultural dimension analysis. Third, driving mechanisms underwent dynamic reorganization: dominant interaction patterns shifted from “agriculture and nature/environment” to “culture and economy/resources” and “environmental improvement and culture/resources,” indicating that socio-cultural and eco-environmental interactions now supersede natural endowments as primary determinants of LUMF heterogeneity. Furthermore, nonlinear enhancement effects among multifactor interactions substantiate the systemic synergy within LUMF driving mechanisms, despite individual factor limitations. By establishing an integrated analytical framework encompassing “functional assessment—driver identification—interaction detection,” this study not only provides a scientific foundation for territorial spatial governance in CLMNCP but also offers a transferable analytical paradigm for sustainability research in analogous cultural-ecological regions worldwide.

5.5. Limitation and Research Prospective

Despite its contributions, this study has several limitations that should be acknowledged.
First, the identification and quantification of LUMF in this study relied primarily on data from statistical yearbooks and relevant statistical bulletins based on prefecture-level city administrative divisions. This approach assumed that the spatiotemporal distribution of LUMF within each administrative unit was homogeneous, which likely underestimated the actual spatiotemporal heterogeneities of socio-economic indicators and their influences, thereby compromising the objectivity and reliability of the final results to some extent. In future research, we aim to elucidate the spatiotemporal evolutionary characteristics of LUMF trade-offs/synergies by integrating high spatial resolution remote sensing data with extensive survey data. This will translate the LUMF identification and quantification to the grid scale for more precise analysis [25].
Second, although this study employed the OPGD model to identify the dominant factors influencing LUMF trade-offs/synergies through factor and interaction detection, the results only revealed the overall explanatory power (q-values) of these factors without elucidating the direction (positive or negative) of their influences. Consequently, the analysis falls short of uncovering potential nonlinear relationships, threshold effects, or causal chains among the three primary functions. Future research should integrate nonlinear threshold models to reveal the complex transmission mechanisms and causal pathways governing LUMF interactions.
Third, while a comprehensive set of indicators is essential for LUMF assessment, there are currently no universally accepted principles or guidelines for selecting the most representative indicators [28]. Consequently, constrained by data availability and methodological limitations, the LUMF quantification system developed in this study requires further refinement.
Regarding potential endogeneity arising from conceptual overlap between functional indicators and driving factors, we have justified variable selection through theoretical reasoning and diagnostic tests. However, the inherent complexity of land systems precludes complete disentanglement between “functional status” and “driving factors,” which may introduce uncertainty into precise contribution estimation. Future research should incorporate longer-term panel data for evolutionary analysis and process-based counterfactual simulations to better identify exogenous drivers and enhance conclusion generalizability.

6. Conclusions

Coordinating land use multifunction (LUMF) with thematic functional zoning in the CLMNCP is crucial for the preservation and management of large-scale national cultural parks. A quantitative analysis of the trade-offs and synergies among LUMF and their influencing factors can provide valuable guidance for optimizing and controlling thematic functional zoning.
This study established a classification and quantification indicator system for LUMF based on a comprehensive “economic-social-environmental” perspective, and employed the improved entropy-weighted TOPSIS method to measure LUMF. Using a spatial autocorrelation model, we analyzed the spatiotemporal heterogeneity and nonlinear characteristics of LUMF trade-offs/synergies in the CLMNCP from 2008 to 2023. Subsequently, the OPGD model was applied to identify the factors influencing these trade-offs/synergies. Based on these findings, management and control guidelines were proposed to support the optimization of thematic functional zoning. The main conclusions are as follows:
(1)
From 2008 to 2023, the economic, social, and environmental functions of land use in the CLMNCP exhibited significant spatiotemporal changes, characterized by a prominent increasing trend and distinct spatial distributions.
(2)
The trade-offs and synergies among LUMF in the CLMNCP demonstrated substantial spatiotemporal variation and nonlinear characteristics over the study period. The interaction between EF and SF underwent a notable transition from trade-off to synergy after 2012, followed by a gradually weakening trend. The EF-EnF interaction remained predominantly synergistic throughout the study period, though exhibiting a similar continuing decline. In contrast, the SF-EnF interaction showed a significant shift from synergy to trade-off in 2018, which subsequently strengthened continuously, displaying a convex relationship in the form of an inverted “U” shape.
(3)
Distinct spatial patterns were identified for LUMF trade-offs/synergies across the study area. High synergies between EF and SF expanded from the central and southern parts to the northwestern and southwestern regions; similarly, trade-offs gradually expanded from the center to the periphery. Conversely, high synergies for the EF-EnF interaction gradually became agglomerated in central metropolises, exhibiting a fluctuating increasing trend. For the SF-EnF interaction, high trade-offs progressively migrated from the south to the north.
(4)
The driving mechanisms varied across different function pairs. The EF-SF interaction was predominantly influenced by factors related to agricultural production, resource supply, and cultural services. The EF-EnF interaction was primarily shaped by natural conditions and environmental improvement factors, alongside emerging contributions from cultural services. In contrast, the SF-EnF interaction was mainly driven by economic development, cultural services, and resource supply.
These findings provide valuable references for policymakers and national cultural park managers to better understand the underlying mechanisms of various land-use functions. They also offer guidance for constructing strategies to facilitate thematic functional zoning optimization and management in large-scale national cultural parks, thereby contributing to the alleviation of land use conflicts between economic development and eco-environmental protection.

Author Contributions

X.L.: Conceptualization, Methodology, Data processing, Writing, Visualization, Software. S.D.: Conceptualization, Methodology, Writing, Supervision. All authors have read and agreed to the published version of the manuscript.

Funding

This study was supported by the [National Natural Science Foundation of China] under Grant [number 52208067]; the [China Postdoctoral Science Foundation] under Grant [number 2023M740667]; the [Science and Research Project of Yunnan Education Department] under Grant [numbers 2024J0441].

Data Availability Statement

Data will be made available on request.

Acknowledgments

The authors would like to thank the investigators for their help when collecting the data.

Conflicts of Interest

The authors declare that they have no known competing financial interests or personal relationships that could have appeared to influence the work reported in this paper.

References

  1. National Cultural Park Construction Working Leadership Group. The Long March National Cultural Park Construction and Protection Plan [Government Document]. 2021. Available online: http://www.xinhuanet.com/politics/2021-08/08/c_1127742416.htm (accessed on 15 December 2024).
  2. Dai, J.C. Path analysis of national cultural park research. Tour. Trib. 2023, 38, 40–51. (In Chinese) [Google Scholar]
  3. Zhao, L.; Du, M.X.; Liu, N. Theoretical conception and exploration of functional zoning of terrestrial national park in china. J. Nanjing Tech Univ. (Soc. Sci. Ed.) 2023, 22, 67–82. (In Chinese) [Google Scholar]
  4. Mei, Y.L.; Yao, X.L.; Liu, X.Z. Analysis on the Cognition of National Culture Park from the Perspective of Cultural Value: Reflections Based on the Practice of the Grand Canal National Culture Park. Mod. Urban Res. 2021, 7, 7–11. (In Chinese) [Google Scholar]
  5. Wang, Z.J.; Yang, H.; Hu, Y.M.; Peng, Y.P.; Liu, L.; Su, S.Q.; Wang, W.; Wu, J.L. Multifunctional trade-off/synergy relationship of cultivated land in Guangdong: A long time series analysis from 2010 to 2030. Ecol. Indic. 2023, 154, 110700. [Google Scholar] [CrossRef]
  6. Zhu, C.M.; Dong, B.Y.; Li, S.N.; Lin, Y.; Shahtahmassebi, A.; You, S.X.; Zhang, J.; Gan, M.Y.; Yang, L.X.; Wang, K. Identifying the trade-offs and synergies among land use functions and their influencing factors from a geospatial perspective: A case study in Hangzhou, China. J. Clean. Prod. 2021, 314, 128026. [Google Scholar] [CrossRef]
  7. Zou, L.L.; Liu, Y.S.; Yang, J.X.; Yang, S.F.; Wang, Y.S.; Cao, Z.; Hu, X.D. Quantitative identification and spatial analysis of land use ecological-production-living functions in rural areas on China’s southeast coast. Habitat Int. 2020, 100, 102182. [Google Scholar] [CrossRef]
  8. Zhang, J.; Li, S.N.; Lin, N.F.; Lin, Y.; Yuan, S.F.; Zhang, L.; Zhu, J.X.; Wang, K.; Gan, M.Y.; Zhu, C.M. Spatial identification and trade-off analysis of land use functions improve spatial zoning management in rapid urbanized areas, China. Land Use Policy 2022, 116, 106058. [Google Scholar] [CrossRef]
  9. Liu, C.; Cheng, L.; Li, J.; Lu, X.H.; Xu, Y.Q.; Yang, Q.K. Trade-offs analysis of land use functions in a hilly-mountainous city of northwest Hubei Province: The interactive effects of urbanization and ecological construction. Habitat Int. 2023, 131, 102705. [Google Scholar] [CrossRef]
  10. Meng, L.; Zhang, B.; Cao, L. Establishing Linear Cultural Heritage Corridors by Integrating Cultural and Ecological Values: A Case Study of the Jinzhong Section of the Great Tea Road. Land 2026, 15, 293. [Google Scholar] [CrossRef]
  11. Lin, Z.; Li, B. Circuit theory-based cultural heritage corridor network development in Qin River Basin. npj Herit. Sci. 2025, 13, 385. [Google Scholar] [CrossRef]
  12. Dong, W.; Han, W.; Xu, Y.; Wang, J.W. Evaluation of the contemporary cultural landscape based on multi-dimensional value coupling: Case study on the Grand Canal, Hangzhou section. PLoS ONE 2025, 20, e0330248. [Google Scholar] [CrossRef] [PubMed]
  13. UNESCO. Reshaping Cultural Policies: A Decade Promoting the Diversity of Cultural Expressions for Development; United Nations Educational, Scientific and Cultural Organization (UNESCO): Paris, France, 2015. [Google Scholar]
  14. Osipova, E.; Emslie-Smith, M.; Osti, M.; Murai, M.; Åberg, U.; Shadie, P. IUCN World Heritage Outlook 3: A Conservation Assessment of All Natural World Heritage Sites; IUCN: Gland, Switzerland, 2020. [Google Scholar] [CrossRef]
  15. Haddad, N.M.; Brudvig, L.A.; Clobert, J.; Davies, K.F.; Gonzalez, A.; Holt, R.D.; Lovejoy, T.E.; Sexton, J.O.; Austin, M.P.; Collins, C.D.; et al. Habitat fragmentation and its lasting impact on Earth’s ecosystems. Sci. Adv. 2015, 1, e1500052. [Google Scholar] [CrossRef] [PubMed]
  16. Rieb, J.T.; Bennett, E.M. Landscape structure as a mediator of ecosystem service interactions. Landsc. Ecol. 2020, 35, 2863–2880. [Google Scholar] [CrossRef]
  17. Wilkins, E.J.; Keener, S.R.; Carr, W.; Winder, S.G.; Reas, J.; Daniele, D.B.; Wood, S.A. Adapting visitor use management under a changing climate across the U.S. National Park System. J. Environ. Manag. 2025, 391, 126424. [Google Scholar] [CrossRef]
  18. Buckley, R.C.; O’Bryan, C.J.; Chauvenet, A.L.M.; Underdahl, S.; Zhang, Z.J.; Liddon, M.S.; Zhong, L.S. Political ecology of private tourism development in public protected areas in the lead-up to the IUCN World Conservation Congress 2025. npj Biodivers. 2026, 5, 6. [Google Scholar] [CrossRef]
  19. Jennings, M.K.; Haeuser, E.; Foote, D.; Lewison, R.L.; Conlisk, E. Planning for Dynamic Connectivity: Operationalizing Robust Decision-Making and Prioritization Across Landscapes Experiencing Climate and Land-Use Change. Land 2020, 9, 341. [Google Scholar] [CrossRef]
  20. Silva, E.C.; Guerrero-Moreno, M.A.; Oliveira, F.A.; Dias-Silva, K.; Juen, L.; Junior, J.F.M.; Carvalho, F.G.; Oliveira-Junior, J.M.B. Socio-Environmental conflicts and traditional communities in protected areas: A scientometric analysis. J. Nat. Conserv. 2025, 86, 126936. [Google Scholar] [CrossRef]
  21. Tupala, A.-K.; Huttunen, S.; Halme, P. Social impacts of biodiversity offsetting: A review. Biol. Conserv. 2022, 267, 109431. [Google Scholar] [CrossRef]
  22. Watts, K.; Whytock, R.C.; Park, K.J.; Fuentes-Montemayor, E.; Macgregor, N.A.; Duffield, S.; McGowan, P.J.K. Ecological time lags and the journey towards conservation success. Nat. Ecol. Evol. 2020, 4, 304–311. [Google Scholar] [CrossRef]
  23. Song, X.F.; Wu, Y.T.; Chen, S.Y.; Wang, L.; Yang, D.C.; Zhang, W.; Liu, N. A framework for functional zoning of national parks based on biocultural diversity assessment. Glob. Ecol. Conserv. 2024, 51, e02877. [Google Scholar] [CrossRef]
  24. Taylor, K. Cultural Landscapes and Asia: Reconciling International and Southeast Asian Regional Values. Landsc. Res. 2009, 34, 7–31. [Google Scholar] [CrossRef]
  25. Li, K.; Zhao, J.S.; Li, Y.P.; Lin, Y.L. Identifying trade-offs and synergies among land use functions using an XGBoost-SHAP model: A case study of Kunming, China. Ecol. Indic. 2025, 172, 113330. [Google Scholar] [CrossRef]
  26. Taylor, K.; Lennon, J.L. Managing Cultural Landscapes; Routledge Publisher: London, UK; New York, NY, USA, 2012; pp. 1–44. [Google Scholar]
  27. Rössler, M. World Heritage Cultural Landscapes: A UNESCO Flagship Programme 1992–2006. Landsc. Res. 2006, 31, 333–353. [Google Scholar] [CrossRef]
  28. Liu, J.; Jin, X.B.; Xu, W.Y.; Fan, Y.T.; Ren, J.; Zhang, X.L.; Zhou, Y.K. Spatial coupling differentiation and development zoning trade-off of land space utilization efficiency in eastern China. Land Use Policy 2019, 85, 310–327. [Google Scholar] [CrossRef]
  29. Chodkowska-Miszczuk, J.M.; Roszak, P.; Mróz, F. The urban pilgrimage route in the co-production of walkable cities: Essence, challenges, and outline. The case of the Camino de Santiago. Cities 2025, 165, 106177. [Google Scholar] [CrossRef]
  30. Gonson, C.; Pelletier, D.; Alban, F.; Giraud-Carrier, C.; Ferraris, J. Influence of settings management and protection status on recreational uses and pressures in marine protected areas. J. Environ. Manag. 2017, 200, 170–185. [Google Scholar] [CrossRef]
  31. Mo, L.; Yang, H.; Li, C.; Luo, P.; Luo, C.; Hou, R.; Wu, W.; Gu, X.D.; Gu, H.J.; Huang, F.; et al. Coordinating habitat protection and local development in Giant panda national park: An ecological carrying capacity perspective. Ecol. Indic. 2025, 178, 113945. [Google Scholar] [CrossRef]
  32. Feng, C.T.; Yan, K.; Wang, H.; Luo, M.; Ma, B.R.; Zhao, W.Y.; Wang, W. A framework for assessing the impact of human pressure on priority core habitats of rare and endangered species. Ecol. Indic. 2025, 178, 114051. [Google Scholar] [CrossRef]
  33. Múnera-Roldán, C.; Roux, D.J.; Colloff, M.J.; van Kerkhoff, L. Beyond Calendars and Maps: Rethinking Time and Space for Effective Knowledge Governance in Protected Areas. Land 2020, 9, 293. [Google Scholar] [CrossRef]
  34. Oseland, S.E.; Haarstad, H. Displacing Conflicting Goals in Planning for Sustainability? Insights from Three Norwegian Cities. Plan. Theory Pract. 2022, 23, 233–247. [Google Scholar] [CrossRef]
  35. Steen-Adams, M.M.; Langston, N.; Adams, M.D.O.; Mladenoff, D.J. Historical framework to explain long-term coupled human and natural system feedbacks: Application to a multiple-ownership forest landscape in the northern Great Lakes region, USA. Ecol. Soc. 2015, 20, 28. [Google Scholar] [CrossRef]
  36. Nikinmaa, L.; Lindner, M.; Cantarello, E.; Gardiner, B.; Jacobsen, J.B.; Jump, A.S.; Parra, C.; Plieninger, T.; Schuck, A.; Seidl, R.; et al. A balancing act: Principles, criteria and indicator framework to operationalize social-ecological resilience of forests. J. Environ. Manag. 2023, 331, 117039. [Google Scholar] [CrossRef] [PubMed]
  37. de Groot, R. Function-analysis and valuation as a tool to assess land use conflicts in planning for sustainable, multi-functional landscapes. Landsc. Urban Plan. 2006, 75, 175–186. [Google Scholar] [CrossRef]
  38. Pérez-Soba, M.; Petit, S.; Jones, L.; Bertrand, N.; Briquel, V.; Omodei-Zorini, L.; Contini, C.; Helming, K.; Farrington, J.H.; Mossello, M.T.; et al. Land use functions—A multifunctionality approach to assess the impact of land use changes on land use sustainability. In Sustainability Impact Assessment of Land Use Changes; Helming, K., P’erez-Soba, M., Tabbush, P., Eds.; Springer: Berlin/Heidelberg, Germany, 2008. [Google Scholar]
  39. Liu, C.; Xu, Y.Q.; Huang, A.; Liu, Y.S.; Wang, H.; Lu, L.H.; Sun, P.L.; Zheng, W.R. Spatial identification of land use multifunctionality at grid scale in farming-pastoral area: A case study of Zhangjiakou City, China. Habitat Int. 2018, 76, 48–61. [Google Scholar] [CrossRef]
  40. Cai, W.B.; Gibbs, D.; Zhang, L.; Ferrier, G.; Cai, Y.L. Identifying hotspots and management of critical ecosystem services in rapidly urbanizing Yangtze River Delta Region, China. J. Environ. Manag. 2017, 191, 258–267. [Google Scholar] [CrossRef]
  41. Geng, W.L.; Li, Y.Y.; Zhang, P.Y.; Yang, D.; Jing, W.L.; Rong, T.Q. Analyzing spatio-temporal changes and trade-offs/synergies among ecosystem services in the Yellow River Basin, China. Ecol. Indic. 2022, 138, 108825. [Google Scholar] [CrossRef]
  42. Mastrangelo, M.E.; Weyland, F.; Villarino, S.H.; Barral, M.P.; Nahuelhual, L.; Laterra, P. Concepts and methods for landscape multifunctionality and a unifying framework based on ecosystem services. Landsc. Ecol. 2014, 29, 345–358. [Google Scholar] [CrossRef]
  43. Peng, J.; Liu, Y.S.; Liu, Z.C.; Yang, Y. Mapping spatial non-stationarity of human-natural factors associated with agricultural landscape multifunctionality in Beijing-Tianjin-Hebei region, China. Agric. Ecosyst. Environ. 2017, 246, 221–233. [Google Scholar] [CrossRef]
  44. Peng, J.; Tian, L.; Liu, Y.S.; Zhao, M.Y.; Hu, Y.N.; Wu, J.S. Ecosystem services response to urbanization in metropolitan areas: Thresholds identification. Sci. Total Environ. 2017, 607–608, 706–714. [Google Scholar] [CrossRef]
  45. Verburg, P.H.; van de Steeg, J.; Veldkamp, A.; Willemen, L. From land cover change to land function dynamics: A major challenge to improve land characterization. J. Environ. Manag. 2009, 90, 1327–1335. [Google Scholar] [CrossRef]
  46. Foley, J.A.; Defries, R.; Asner, G.P.; Barford, C.; Bonan, G.; Carpenter, S.R.; Chapin, F.S.; Coe, M.T.; Daily, G.C.; Gibbs, H.K.; et al. Global consequences of land use. Science 2005, 309, 570–574. [Google Scholar] [CrossRef]
  47. Long, H.L.; Ge, D.Z.; Zhang, Y.N.; Tu, S.S.; Qu, Y.; Ma, L. Changing man-land interrelations in China’s farming area under urbanization and its implications for food security. J. Environ. Manag. 2018, 209, 440–451. [Google Scholar] [CrossRef]
  48. Ng, C.N.; Xie, Y.J.; Yu, X.J. Measuring the spatio-temporal variation of habitat isolation due to rapid urbanization: A case study of the Shenzhen River crossboundary catchment, China. Landsc. Urban Plan. 2011, 103, 44–54. [Google Scholar] [CrossRef]
  49. Song, W.; Pijanowski, B.C.; Tayyebi, A. Urban expansion and its consumption of high-quality farmland in Beijing, China. Ecol. Indic. 2015, 54, 60–70. [Google Scholar] [CrossRef]
  50. Asadolahi, Z.; Salmanmahiny, A.; Sakieh, Y.; Mirkarimi, S.H.; Baral, H.; Azimi, M. Dynamic trade-off analysis of multiple ecosystem services under land use change scenarios: Towards putting ecosystem services into planning in Iran. Ecol. Complex. 2018, 36, 250–260. [Google Scholar] [CrossRef]
  51. Jiang, S.; Meng, J.J.; Zhu, L.K. Spatial and temporal analyses of potential land use conflict under the constraints of water resources in the middle reaches of the Heihe River. Land Use Policy 2020, 97, 104773. [Google Scholar] [CrossRef]
  52. Liu, J.; Jin, X.B.; Xu, W.Y.; Yang, F.; Wang, S.L.; Zhou, Y.K. Assessing trade-offs and synergies among multiple land use functional efficiencies: Integrating ideal reference and key indicators for sustainable landscape management. Appl. Geogr. 2023, 158, 103037. [Google Scholar] [CrossRef]
  53. Duan, Y.M.; Wang, H.; Huang, A.; Xu, Y.Q.; Lu, L.H.; Ji, Z.X. Identification and spatial-temporal evolution of rural “production living-ecological” space from the perspective of villagers’ behavior—A case study of Ertai Town, Zhangjiakou City. Land Use Policy 2021, 106, 105457. [Google Scholar] [CrossRef]
  54. Wang, Y.; Dai, E. Spatial-temporal changes in ecosystem services and the trade-off relationship in mountain regions: A case study of Hengduan Mountain region in Southwest China. J. Clean. Prod. 2020, 264, 121573. [Google Scholar] [CrossRef]
  55. Li, Q.; Zhou, Y.; Xu, T.; Wang, L.; Zuo, Q.; Liu, J.Y.; Su, X.P.; He, N.; Wu, Z.X. Tradeoffs/synergies in land-use function changes in central China from 2000 to 2015. Chin. Geogr. Sci. 2021, 31, 711–726. [Google Scholar] [CrossRef]
  56. Li, S.N.; An, W.Z.; Zhang, J.; Gan, M.Y.; Wang, K.; Ding, L.L.; Li, W.Q. Optimizing limit lines in urban-rural transitional areas: Unveiling the spatial dynamics of trade-offs and synergies among land use functions. Habitat Int. 2023, 140, 102907. [Google Scholar] [CrossRef]
  57. Paracchini, M.L.; Pacini, C.; Jones, M.L.M.; P’erez-Soba, M. An aggregation framework to link indicators associated with multifunctional land use to the stakeholder evaluation of policy options. Ecol. Indic. 2011, 11, 71–80. [Google Scholar] [CrossRef]
  58. Fan, Y.T.; Jin, X.B.; Gan, L.; Jessup, L.H.; Pijanowski, B.C.; Yang, X.H.; Xiang, X.M.; Zhou, Y.K. Spatial identification and dynamic analysis of land use functions reveals distinct zones of multiple functions in eastern China. Sci. Total Environ. 2018, 642, 33–44. [Google Scholar] [CrossRef] [PubMed]
  59. Deng, W.; Li, X.; Guo, Y.; Huang, J.; Zhang, L. Ecological Assessment of Water Environment in Huizhou Region of China Based on DPSIR Theory and Entropy Weight TOPSIS Model. Water 2024, 16, 2579. [Google Scholar] [CrossRef]
  60. Su, J.; Sun, Y. An Improved TOPSIS Model Based on Cumulative Prospect Theory: Application to ESG Performance Evaluation of State-Owned Mining Enterprises. Sustainability 2023, 15, 10046. [Google Scholar] [CrossRef]
  61. Fang, L.; Xu, D.; Wang, L.; Niu, Z.; Zhang, M. Ecosystem service changes and trade-offs/synergies in the Yangtze and Yellow River basins. Geogr. Res. 2021, 3, 821–838. [Google Scholar] [CrossRef]
  62. He, L.J.; Xie, Z.Y.; Wu, H.Q.; Liu, Z.; Zheng, B.F.; Wan, W. Exploring the interrelations and driving factors among typical ecosystem services in the Yangtze River Economic Belt, China. J. Environ. Manag. 2024, 351, 119794. [Google Scholar] [CrossRef]
  63. Qiao, B.; Yang, H.; Cao, X.Y.; Zhou, B.R.; Wang, N.A. Driving mechanisms and threshold identification of landscape ecological risk: A nonlinear perspective from the Qilian Mountains, China. Ecol. Indic. 2025, 173, 113342. [Google Scholar] [CrossRef]
  64. Lyu, Y.F.; Wang, M.J.; Zou, Y.; Wu, C.F. Mapping trade-offs among urban fringe land use functions to accurately support spatial planning. Sci. Total Environ. 2022, 802, 149915. [Google Scholar] [CrossRef]
  65. Li, S.N.; Zhu, C.M.; Lin, Y.; Dong, B.Y.; Chen, B.J.; Si, B.; Li, Y.J.; Deng, X.D.; Gan, M.Y.; Zhang, J.; et al. Conflicts between agricultural and ecological functions and their driving mechanisms in agroforestry ecotone areas from the perspective of land use functions. J. Clean. Prod. 2021, 317, 128453. [Google Scholar] [CrossRef]
  66. Shen, W.; Chen, Y.; Cao, W.; Yu, R.Y.; Rong, P.J.; Cheng, J.L. Spatial pattern and its influencing factors of national-level cultural heritage in China. Herit. Sci. 2024, 12, 384. [Google Scholar] [CrossRef]
  67. Zhang, Z.Y.; Tong, Z.M.; Zhang, L.T.; Liu, Y.L. What factors affect the synergy and tradeoff between ecosystem services, and how, from a geospatial perspective? J. Clean. Prod. 2023, 422, 138609. [Google Scholar] [CrossRef]
  68. Song, Y.; Wang, J.; Ge, Y.; Xu, C. An optimal parameters-based geographical detector model enhances geographic characteristics of explanatory variables for spatial heterogeneity analysis: Cases with different types of spatial data. GIScience Remote Sens. 2020, 57, 593–610. [Google Scholar] [CrossRef]
  69. Zhang, H.; Dong, G.; Wang, J.; Zhang, T.L.; Meng, X.Y.; Yang, D.Y.; Liu, Y.; Lu, B.B. Understanding and extending the geographical detector model under a linear regression framework. Int. J. Geogr. Inf. Sci. 2023, 37, 2437–2453. [Google Scholar] [CrossRef]
  70. Bai, H.X.; Li, D.Y.; Ge, Y.; Wang, J.F.; Cao, F. Spatial rough set-based geographical detectors for nominal target variables. Inf. Sci. 2022, 586, 525–539. [Google Scholar] [CrossRef]
  71. Zhang, Z.H.; Song, Y.Z.; Wu, P. Robust geographical detector. Int. J. Appl. Earth Obs. Geoinf. 2022, 109, 102782. [Google Scholar] [CrossRef]
  72. Wei, C.; Wu, Z.; Xing, J.; Jin, G. Trade-off or synergy? Dynamic analysis and policy insights on land use functions in China. Environ. Impact Assess. Rev. 2024, 105, 107399. [Google Scholar] [CrossRef]
  73. Huang, S.; Wang, Y.; Liu, R.; Jiang, Y.; Qie, L.; Pu, L.J. Identification of Land Use Function Bundles and Their Spatiotemporal Trade-Offs/Synergies: A Case Study in Jiangsu Coast, China. Land 2022, 11, 286. [Google Scholar] [CrossRef]
  74. Huang, X.C.; Wu, Z.; Zhu, L.L.; Li, Y.C. Accurate identification and trade-off analysis of multifunctional spaces of land in megacities: A case study of Guangzhou city, China. Habitat Int. 2024, 153, 103209. [Google Scholar] [CrossRef]
  75. Zhang, Y.N.; Long, H.L.; Tu, S.S.; Ge, D.Z.; Ma, L.; Wang, L.Z. Spatial identification of land use functions and their tradeoffs/synergies in China: Implications for sustainable land management. Ecol. Indic. 2019, 107, 105550. [Google Scholar] [CrossRef]
  76. Groß, V.; Sibhatu, K.T.; Knohl, A.; Qaim, M.; Veldkamp, E.; Hölscher, D.; Zemp, D.C.; Corre, M.D.; Grass, I.; Fiedler, S.; et al. Transformation scenarios towards multifunctional landscapes: A multi-criteria land-use allocation model applied to Jambi Province, Indonesia. J. Environ. Manag. 2024, 356, 120710. [Google Scholar] [CrossRef] [PubMed]
  77. Wei, J.X.; Yue, W.Z.; Li, M.M.; Liu, Y.; Song, Y.Z. Multi-scenario urban growth boundaries and trade-offs among land use functions. Cities 2025, 159, 105752. [Google Scholar] [CrossRef]
  78. Li, H.; Zhou, X.; Zhu, Z.; Liu, Y.; Lin, W. Exploring cultivated land trade-off/synergy of production and ecological supply–demand mismatch for coordinated development: Evidence from mega urban agglomeration. Environ. Dev. Sustain. 2025. [Google Scholar] [CrossRef]
  79. Qiu, J.X.; Turner, M.G. Spatial interactions among ecosystem services in an urbanizing agricultural watershed. Proc. Natl. Acad. Sci. USA 2013, 110, 12149–12154. [Google Scholar] [CrossRef]
  80. Wang, Y.; Zhao, Y.; Guo, J.; Qi, Y. Study on the multifunctional evaluation of cultivated land and the evolution of trade-off/synergy relationships in the Sanjiang Plain. Front. Environ. Sci. 2025, 13, 1637297. [Google Scholar] [CrossRef]
  81. Gao, H.X.; Song, X.Q.; Xu, H.X.; Li, X.; Tang, J.; Zhao, G.S. Promoting sustainable development by mitigation of natural habitat quality decline through multifunctional urban land use: Insights from a multi-scenario simulation. Sustain. Cities Soc. 2024, 110, 105563. [Google Scholar] [CrossRef]
  82. Wen, R.J.; Liu, Z.J. Exploring trade-offs and synergies between economy development and ecosystem sustainability of the eco-fragile regions in the context of food security. J. Clean. Prod. 2025, 510, 145604. [Google Scholar] [CrossRef]
  83. Yue, Q.; Adamowski, J.; Cao, X.C.; Chen, D.; Xuanyuan, M.Z.; Elbeltagi, A.; Dai, X.P. Managing agricultural crop and livestock land use for synergistic energy-economy-environment development: A hybrid multi-objective optimization approach under a waste-to-energy nexus. J. Clean. Prod. 2025, 486, 144544. [Google Scholar] [CrossRef]
Figure 1. Geographic location of the study area.
Land 15 00551 g001
Figure 2. Research framework.
Land 15 00551 g002
Figure 3. Spatial distribution of LUMFs in the CLMNCP from 2008 to 2023.
Land 15 00551 g003
Figure 4. LUMF values in the CLMNCP from 2008 to 2023.
Land 15 00551 g004
Figure 5. Spearman correlation coefficient among LUMFs in the CLMNCP from 2008 to 2023.
Land 15 00551 g005
Figure 6. Global Moran’s I of LUMFs in the CLMNCP from 2008 to 2023.
Land 15 00551 g006
Figure 7. Trade-offs and synergies among LUMFs in the CLMNCP from 2008 to 2023.
Land 15 00551 g007
Figure 8. The magnitudes of multidimensional influencing factors for LUMF trade-offs/synergies in the CLMNCP from 2008 to 2023. (*** indicates 1% two-tailed significance level; ** indicates 5% two-tailed significance level; * indicates 10% two-tailed significance level).
Land 15 00551 g008
Figure 9. The interactive effects of influencing factors on LUMF trade-offs/synergies in the CLMNCP from 2008 to 2023.
Land 15 00551 g009
Table 1. Data sources.
Data TypeData Sources
DEM dataGeospatial Data Cloud https://www.gscloud.cn/ (accessed on 22 March 2025)
Climate station records of temperature National Tibetan Plateau/Third Pole Environment Data Center https://data.tpdc.ac.cn (accessed on 22 March 2025)
Climate station records of precipitationNational Tibetan Plateau/Third Pole Environment Data Center https://data.tpdc.ac.cn (accessed on 22 March 2025)
Land use/cover dataData Center for Resources and Environmental Sciences, Chinese Academy of Sciences (RESDC)
http://www.resdc.cn/ (accessed on 27 March 2025)
Farmland quality dataDepartment of Natural Resources of the Province/the prefecture-level city
Road dataThe Prefecture-level City’s Bureau of Planning and Natural Resources; the basic unit is the prefecture-level city
Demographic dataStatistical Yearbook of Prefecture-level Cities; the basic unit is the prefecture-level city
Grain yield & Forest product/Livestock productStatistical Yearbook of Prefecture-level Cities; the basic unit is the prefecture-level city
Socioeconomic dataStatistical Yearbook of Prefecture-level Cities; Statistical Communiqué of the prefecture-level city on the National Economic and Social Development; the basic unit is the prefecture-level city
Air and environmental qualityEcological and environmental bulletin the prefecture-level city;
the basic unit is the prefecture-level city
Water source data water resources bulletin of the prefecture-level city; the basic unit is the prefecture-level city
Park area dataNational Platform for Common Geospatial Information Services https://cloudcenter.tianditu.gov.cn/administrativedivision (accessed on 22 March 2025)
Climatic dataNational Meteorological Information Center https://data.cma.cn/ (accessed on 22 March 2025)
Table 2. Land use multi-function evaluation index system in CLMNCP.
Criterion LevelFactor LevelIndicator LevelIndex Instruction & CalculationUnitP/N
EF
Economic Function
Agricultural productionC1 GYP
Grain yield per capita
GYP i ( city ) j ( year )   =     Grain   Yield i ( city ) j ( year ) Population i ( city ) j ( year ) kg/person+
C2 GYPH
Grain yield per hectare
GYPH i ( city ) j ( year ) =   Grain   Yield i ( city ) j ( year ) Grain - growing   Acreage i ( city ) j ( year ) kg/hm2+
C3 MPP
Meat production per capita
MPP i ( city ) j ( year )   =       Meat   Yield i ( city ) j ( year ) Population i ( city ) j ( year ) kg/person+
Economic developmentC4 VSTP
Value added of the secondary industry and tertiary industry per capita
VSTP i ( city ) j ( year )   =     Value   added   of   secondary   and   tertiary   industries i ( city ) j ( year ) Population i ( city ) j ( year ) RMB/person+
TransportationC5 RAP
Road area per capita
RAP i ( city ) j ( year )   =   Road   area i ( city ) j ( year ) Population i ( city ) j ( year ) M2/person+
SF
Social
Function
Employment supplyC6 NEPR
The current year new Employment–Population Ratio
NEPR i ( city ) j ( year )   =   The   current   year   new   Employment i ( city ) j ( year ) Population i ( city ) j ( year )   ×   100 % %+
C7 URER
Urban–Rural Employment ratio
URER i ( city ) j ( year )   =   Urban   employment i ( city ) j ( year ) Rural   employment i ( city ) j ( year ) -+
Social securityC8 URIB
Urban–rural income balance index
URIB i ( city ) j ( year )   =   Per   capita   disposable   income   of   rural   residents i ( city ) j ( year ) Per   capita   disposable   income   of   urban   residents i ( city ) j ( year ) -+
C9 HBPM
Number of hospital beds per million
HBPM i ( city ) j ( year )   =   Number   of   hospital   beds i ( city ) j ( year ) Population i ( city ) j ( year ) N/million+
Inhabitation C10 HAP
Housing area per capita
HAP i ( city ) j ( year )   =   Housing   area i ( city ) j ( year ) Population i ( city ) j ( year ) M2/person+
C11 UR
Urbanization rate
UR i ( city ) j ( year )   =   Urban   population i ( city ) j ( year ) Total   Population i ( city ) j ( year )   ×   100 % %+
Healthy recreation C12 UPAP
Urban park area per capita
UPAP i ( city ) j ( year )   =   Urban   park   area i ( city ) j ( year ) Population i ( city ) j ( year ) M2/person+
C13 GCBA
Green coverage rate of built-up areas
GCBR i ( city ) j ( year )   =   Green   area   bulit - up i ( city ) j ( year ) Area   of   bulit - up i ( city ) j ( year )   ×   100 % %+
C14 EAQR
Excellent air quality rate
EAQR i ( city ) j ( year )   =   Days   of   excellent   air   quality i ( city ) j ( year ) 365 i ( city ) j ( year )   ×   100 % %+
Cultural spiritual serviceC15 CEP
Cultural expenditure per capita
CEP i ( city ) j ( year ) = Cultural   expenditure   i ( city ) j ( year ) Population i ( city ) j ( year ) RMB/person+
C16 CFPM
Number of cultural facilities per million
CFPM i ( city ) j ( year )   =   Number   of   cultural   facilities i ( city ) j ( year ) Population i ( city ) j ( year ) N/million+
C17 BPLP
Number of books in public libraries per capita
BPLP i ( city ) j ( year )   =     Number   of   books   in   the   library i ( city ) j ( year ) Population i ( city ) j ( year ) N/person+
EnF
Environmental Function
Abiotic resources supplyC18 WRP
Water resources per capita
WRP i ( city ) j ( year )   =     Water   Resources i ( city ) j ( year ) Population i ( city ) j ( year ) +
C19 ALAP
Arable land area per capita
ALAP i ( city ) j ( year )   =   Arable   land   area i ( city ) j ( year ) Population i ( city ) j ( year ) M2/person+
Biotic resources supplyC20 CLPP
Consumption of livestock products per capita
CLPP i ( city ) j ( year )   =   Production   of   livestock   and   poultry   products i ( city ) j ( year ) Population i ( city ) j ( year ) kg/person+
Ecological balance maintenance C21 NPFR
Newly planted forests–urban area ratio
PFC i ( city ) j ( year )   =   Newly   planted   forest   area i ( city ) j ( year ) Urban   area i ( city ) j ( year ) %+
C22 PFC
Percentage of the forestry coverage
PFC i ( city ) j ( year )   =   Forest   area i ( city ) j ( year ) Urban   area i ( city ) j ( year )   ×   100 % %+
C23 WLR
Wet land–urban area ratio
WLR i ( city ) j ( year )   =   Wet   land   area i ( city ) j ( year ) Urban   area i ( city ) j ( year )   ×   100 % %+
C24 FCPH
Fertilizer consumption per hectare of cultivated area
FCPH i ( city ) j ( year )   =   Fertilizer   consumption i ( city ) j ( year ) Arable   land   area i ( city ) j ( year ) kg/hm2-
C25 IPWD
Intensity of polluted water discharge
IPWD i ( city ) j ( year )   =   Total   amount   of   wastewater   discharge i ( city ) j ( year ) Urban   area i ( city ) j ( year ) t/hm2-
C26 SO2MD
Sulfur dioxide annual mean density
Sulfur dioxide mean density μg/m3-
Bio-diversity maintenanceC27 ELUAR
Ecological land–urban area ratio
ELUAR i ( city ) j ( year )   =   Ecological   land   area i ( city ) j ( year ) Urban   area i ( city ) j ( year )   ×   100 % %+
C28 ELSC
Ecological land structure coefficient
ELSC i ( city ) j ( year )   =   Wet   land   area i ( city ) j ( year ) Urban   area i ( city ) j ( year ) --+
Table 3. Criteria for evaluating the development level of LUMF in CLMNCP.
Posting ProgressRudimentaryCordonIntermediateFavorableTalented
LUMF[0–0.15)[0.15–0.30)[0.30–0.45)[0.45–0.60)[0.60–1)
Table 4. Index system for potential influencing factors of LUMF.
Index DimensionPotential Influencing FactorUnit
Natural conditionX1 EL (Elevation)m
X2 TE (Temperature)°
X3 PR (Precipitation)mm
X4 COCL (Coefficient of cultivated land)%
Agricultural productionX5 GYP (Grain yield per capita)kg/person
X6 GYPH (Grain yield per hectare)kg/hm2
X7 MPP (Meat production per capita)kg/person
Economic developmentX8 VSTP (Value added of the secondary industry and tertiary industry per capita)RMB/person
Transportation X9 RAP (Road area per capita)M2/person
Employment supportX10 NEPR (The current year new Employment–Population Ratio)%
X11 URER (Urban–Rural Employment ratio)-
Economic developmentX12 URIB (Urban–rural income balance index)
Social securityX13 HBPM (Number of hospital beds per million)Num/million
X14 HAP (Housing area per capita)M2/person
Economic developmentX15 UR (Urbanization rate)
Resource supplyX16 UPAP (Urban park area per capita)M2/person
X17 GCBA (Green coverage rate of built-up areas)%
Environmental improvementX18 EAQR (Excellent air quality rate)%
Cultural serviceX19 CEP (Cultural expenditure Per capita)RMB/person
X20 CFPM (Number of cultural facilities per million)Num/million
X21 BPLP (Number of books in public libraries per capita)
Resource supplyX22 WRP (Water resources Per capita)
X23 ALAP (Arable land area per capita)M2/person
Agricultural productionX24 CLPP (Consumption of livestock products per capita)kg/person
Resource supplyX25 NPFR (Newly planted forests–urban area ratio)
Environmental improvementX26 PFC (Percentage of the forestry coverage)%
X27 WLR (Wet land–urban area ratio)%
X28 FCPH (Fertilizer consumption per hectare of cultivated area)kg/hm2
X29 IPWD (Intensity of polluted water discharge)
X30 SO2MD (Sulphur dioxide annual mean density)μg/m3
X31 ELUAR (Ecological land–urban area ratio)%
X32 ELSC (Ecological land structure coefficient)-
Table 5. The criteria for the various interaction types.
CriterionInteraction Type
q(X1X2) < Min(q(X1), q(X2))Nonlinear-weakened
Min(q(X1), q(X2)) < q(X1X2) < Max(q(X1), q(X2))Uni-enhanced = weakened
q(X1X2) > Max(q(X1), q(X2))Bi-enhanced
q(X1X2) = q(X1) + q(X2)Independent
q(X1X2) > q(X1) + q(X2)Nonlinear-enhanced
Table 6. Pearson correlation (Independent variables vs. LUMF trade-off/synergy index).
YearPearson Correlation Range
2008[−0.2310, 0.2437]
2013[−0.2073, 0.3890]
2018[−1485, 0.1613]
2023[−0.2483, 0.3759]
Table 7. The Spearman correlation coefficient of trade-offs and synergies among LUMF in the CLMNCP.
YearSpearman Correlation Coefficient
EF & SFEF & EnFSF & EnF
2008−0.1310.338 ***0.046
20130.1420.243 **0.095
20180.0530.278 ***0.235 **
20230.0950.146−0.191
Note: *** indicates 1% significance level; ** indicates 5% significance level.
Table 8. Ranking of q value and two-tailed significance level of 32 influencing factors of LUMF trade-offs/synergies in the CLMNCP (2008–2023).
20082013
EF & SFEF & EnFSF & EnFEF & SFEF & EnFSF & EnF
Rankq ValueRankq ValueRankq ValueRankq ValueRankq ValueRankq Value
X6 ***0.3343X1 ***0.3190X8 **0.1774X16 ***0.2013X16 **0.1291X17 **0.1445
X26 ***0.2025X2 ***0.1778X19 *0.1519X22 **0.1208X11 **0.1044X16 **0.1441
X3 ***0.1998X7 **0.1625X2 **0.1455X27 **0.1160X9 *0.0980X13 **0.1356
X9 **0.1847X24 **0.1625X3 *0.1406X8 **0.1140X6 *0.0970X14 **0.1303
X1 ***0.1742X31 **0.1617X1 **0.1397X15 *0.0948X32 *0.0888X32 **0.1259
X18 **0.1740X27 **0.1604X16 **0.1373X2 *0.0914X30 *0.0866X3 **0.1117
X13 **0.1685X6 **0.1353X20 *0.1203X9 *0.0893X13 *0.0856X8 **0.1061
X5 **0.1607X3 **0.1292X4 *0.1056X19 *0.0807 X6 *0.1046
X31 **0.1083X26 *0.1241
X10 *0.1115
20182023
EF & SFEF & EnFSF & EnFEF & SFEF & EnFSF & EnF
Rankq valueRankq valueRankq valueRankq valueRankq valueRankq value
X9 **0.2261X23 **0.1272X2 *0.1419X20 ***0.2021X30 **0.2077X8 ***0.1725
X28 **0.2104X22 *0.1234X11 *0.1317X16 ***0.1799X27 ***0.2001X20 **0.1597
X16 **0.1691X30 *0.1215X30 *0.1285X25 **0.1587X1 ***0.1768X16 **0.1582
X1 **0.1230X4 *0.1156X1 **0.1031X5 **0.1538X20 **0.1635X5 *0.1231
X23 *0.1097X1 *0.0865----X15 **0.1383X18 **0.1525X3 *0.1179
X2 *0.1051--------X23 **0.1360X29 *0.1177----
X8 **0.1259--------
X19 *0.1259--------
Notes: *** indicates 1% two-tailed significance level; ** indicates 5% two-tailed significance level; * indicates 10% two-tailed significance level; -- indicates not significant.
Table 9. Results of factor/interaction detection on LUMF trade-offs/synergies in the CLMNCP from 2008 to 2023.
Function InteractionFactor Detection ResultsInteraction Detection Results
Economic-Social FunctionAll single factors < 0.4X16 and X2, X16 and X9, X6 and X1, X6 and X3, X6 and X5, X6 and X18, X18 and X5 (q > 0.6)
Economic-Environmental FunctionAll single factors < 0.4X1 and X26 (q > 0.6)
Social-Environmental FunctionAll single factors < 0.4X1 and X19 (q > 0.6)
Table 10. Results of the Interaction Robustness.
Factor InteractionDiscretization Parameter SettingsResults
Natural Breaks
(4–6 Categories)
Quantile Methods (4–7 Levels)
X1 ∩ X7/X30Consistent Bi-enhancedStability
X2 ∩ X3/X27Consistent Bi-enhancedStability
X6 ∩ X2/X13/X26/X32Consistent Bi-enhancedStability
X8 ∩ X14~X17Consistent Bi-enhancedStability
X15 ∩ X27/X9Consistent Bi-enhancedStability
X32 ∩ X14/X17Consistent Bi-enhancedStability
X1 ∩ X26/X19Consistent Nonlinear-enhancedStability
X6 ∩ X1/X3/X5/X18Consistent Nonlinear-enhancedStability
X16 ∩ X2/X9Consistent Nonlinear-enhancedStability
Disclaimer/Publisher’s Note: The statements, opinions and data contained in all publications are solely those of the individual author(s) and contributor(s) and not of MDPI and/or the editor(s). MDPI and/or the editor(s) disclaim responsibility for any injury to people or property resulting from any ideas, methods, instructions or products referred to in the content.