Article

Land-Use-Mediated Pathways of Regional Carbon Storage Under Natural and Human Constraints: Evidence from Shaanxi Province, China

1
Graduate School of Integrated Sciences for Global Society, Kyushu University, 744 Motooka, Nishi-ku, Fukuoka 819-0395, Japan
2
Institute of Tropical Agriculture, Kyushu University, 744 Motooka, Nishi-ku, Fukuoka 819-0395, Japan
*
Author to whom correspondence should be addressed.
Land 2026, 15(4), 550; https://doi.org/10.3390/land15040550
Submission received: 12 February 2026 / Revised: 20 March 2026 / Accepted: 24 March 2026 / Published: 27 March 2026

Abstract

Under global climate change, analyzing carbon storage dynamics and their drivers is essential for understanding regional carbon sink capacity. Human activities and land-use change have substantially affected regional carbon storage. However, in China, most existing studies emphasize specific driving pathways, and integrated analyses of the combined effects of climate, natural, human, and landscape factors remain limited. This study aims at clarifying the integrated mechanisms by which multiple driving factors influence regional carbon storage. The InVEST model was used to analyze the carbon storage spatiotemporal changes. OPGD was then applied to evaluate the explanatory power of driving factors and their interactions, quantifying their contributions to carbon storage spatial patterns. Based on PLS-SEM, the direct and indirect effects of LULC, climate, natural, human, and landscape factors were quantified to elucidate the driving pathways of carbon storage. This study focuses on Shaanxi Province, which is a key ecological restoration region in the core area of the Loess Plateau. The main results are as follows: (1) From 2000 to 2020, carbon storage in Shaanxi Province showed a continuous increasing trend, rising from 2.97 × 10¹⁰ Mg C to 3.03 × 10¹⁰ Mg C. (2) LULC was identified as the most important direct and predominantly negative driving factor of carbon storage. (3) Natural factors had a strong positive influence on carbon storage, among which slope and NDVI exhibited the highest explanatory power; in contrast, climate factors showed weaker but still positive effects. (4) Human activities affected carbon storage through both direct and indirect pathways associated with LULC, with positive effects driven by landscape factors and negative effects driven by natural factors, while climate factors exhibited mixed but weak effects. Overall, carbon storage dynamics in Shaanxi Province reflect a hierarchical and path-dependent process shaped by the combined effects of natural constraints, human activities, and policy guidance through LULC pathways, providing important evidence for systematically understanding the driving structure and pathways of regional carbon storage. These findings highlight the importance of aligning land-use policies with regional biophysical constraints to enhance carbon sequestration efficiency.

1. Introduction

Terrestrial ecosystems provide positive feedback to climate change by releasing or absorbing greenhouse gases at the global scale [1]. The carbon storage contained within terrestrial ecosystems is classified into five major pools: live biomass, dead wood, litter, soil organic carbon, and harvested wood products [2]. Previous studies have demonstrated that soils store more carbon than any other terrestrial ecosystem component [3,4]. As the largest carbon reservoir on land, soil carbon is highly sensitive to changes in land use and management [5]. Land use and land cover (LULC) change alters the distribution and transformation of vegetation and soil carbon pools, thereby reshaping regional carbon storage patterns and influencing terrestrial carbon cycling [6]. LULC has become one of the major sources of carbon emissions from terrestrial ecosystems, second only to fossil fuel combustion [7]. Changes in land-use types are often accompanied by substantial carbon exchange processes, thereby exerting a profound influence on the carbon balance of ecosystems [5]. Previous studies have analyzed carbon storage dynamics by linking land-use change with variations in ecosystem carbon pools [8]. Consequently, research on carbon storage variations driven by LULC has become one of the primary approaches for monitoring ecosystem service functions [9,10,11]. Recognizing this, China pledged at the 75th United Nations General Assembly to enhance its Nationally Determined Contributions, committing to peaking carbon emissions by 2030 and reaching carbon neutrality by 2060 [2]. To support these national climate goals, it is crucial to understand the evolutionary patterns of land use and to further investigate the driving mechanisms influencing carbon storage. Clarifying the role of land-use change in regulating ecosystem carbon storage is essential for understanding how land-based carbon sinks can contribute to China’s climate mitigation strategy, especially within the framework of Nationally Determined Contributions (NDCs). Such understanding can provide valuable scientific evidence for policymakers to develop effective conservation strategies and sustainable land management plans.
Most existing studies agree that the formation and evolution of LULC are influenced by both natural and human factors, while researchers from different fields tend to focus on different aspects and analytical perspectives when explaining its driving mechanisms. Some studies explain the effects of single types of driving factors on LULC. Among them, some studies emphasize the role of natural factors, suggesting that environmental conditions such as slope and DEM can greatly influence the spatial distribution of LULC [12,13]. Meanwhile, other studies focus on climate factors, especially in the context of global climate change, and point out that changes in TEM and PRE can alter vegetation growth conditions and land suitability, thereby driving adjustments in agricultural land patterns and ecosystem structure [14,15]. More studies examine LULC from the perspective of human activities, exploring the influence of socioeconomic factors. For example, indicators such as rapid economic growth, population increase, and transportation accessibility are considered important drivers of LULC [16,17,18]. Within the scope of human activities, some studies further treat policy factors as core driving variables, focusing on how institutional interventions influence LULC transitions [19,20]. Recent studies also suggest that land-based carbon sequestration has important economic and policy relevance. Forest carbon sinks play a key role in climate change mitigation and are increasingly integrated into carbon markets and climate policy frameworks [21]. These studies provide an important basis for identifying key driving factors. However, because they mainly focus on a single type of factor, it is often difficult to fully explain the integrated processes of LULC change in complex regions.
The study area, Shaanxi Province, is in the central part of Northwest China and spans a clear climate and topographic gradient from the Loess Plateau in the north to the Qinling Mountains in the south. It contains diverse ecosystems and LULC types and is therefore highly representative in terms of both natural and human driving factors. Northern Shaanxi, located on the Loess Plateau, is an ecologically fragile region and a key implementation area for national ecological restoration projects such as the Grain for Green Program. As a result, large areas of cropland have been converted into forest and grassland, leading to significant adjustments in land-use structure [22]. As the economic and population core of the province, the Guanzhong Plain has experienced rapid urbanization since 2000, with continuous expansion of construction land, representing a typical human-activity-driven LULC transition [23]. In contrast, the Qinling mountainous region in southern Shaanxi serves as an important ecological barrier and biodiversity hotspot, with high forest coverage, and plays a key role in maintaining regional ecological security and carbon sequestration [22].
Therefore, the temporal and spatial characteristics of regional carbon storage are analyzed in this study based on land-use data. The InVEST model is first used to estimate carbon storage, and the OPGD and PLS-SEM methods are then applied to reveal the interaction processes among multiple driving factors, including natural, climate, and human, through both direct and indirect pathways. In this way, the overall mechanism by which these factors influence regional carbon storage through changes in LULC is clarified. The results of this study can provide scientific support for land-use planning in the study area and further contribute to sustainable land management. At the same time, this study is primarily designed as a biophysical assessment focusing on the dynamics of LULC change and carbon storage. While the findings provide useful insights that may inform climate policy instruments, they do not aim to develop or evaluate specific policy mechanisms such as NDC implementation or carbon market design. In addition, the integrated analytical framework of multiple driving factors developed in this study helps to deepen the understanding of the mechanisms shaping regional carbon storage and provides a useful reference for future research in related fields.

2. Materials and Methods

2.1. Materials

2.1.1. Study Area

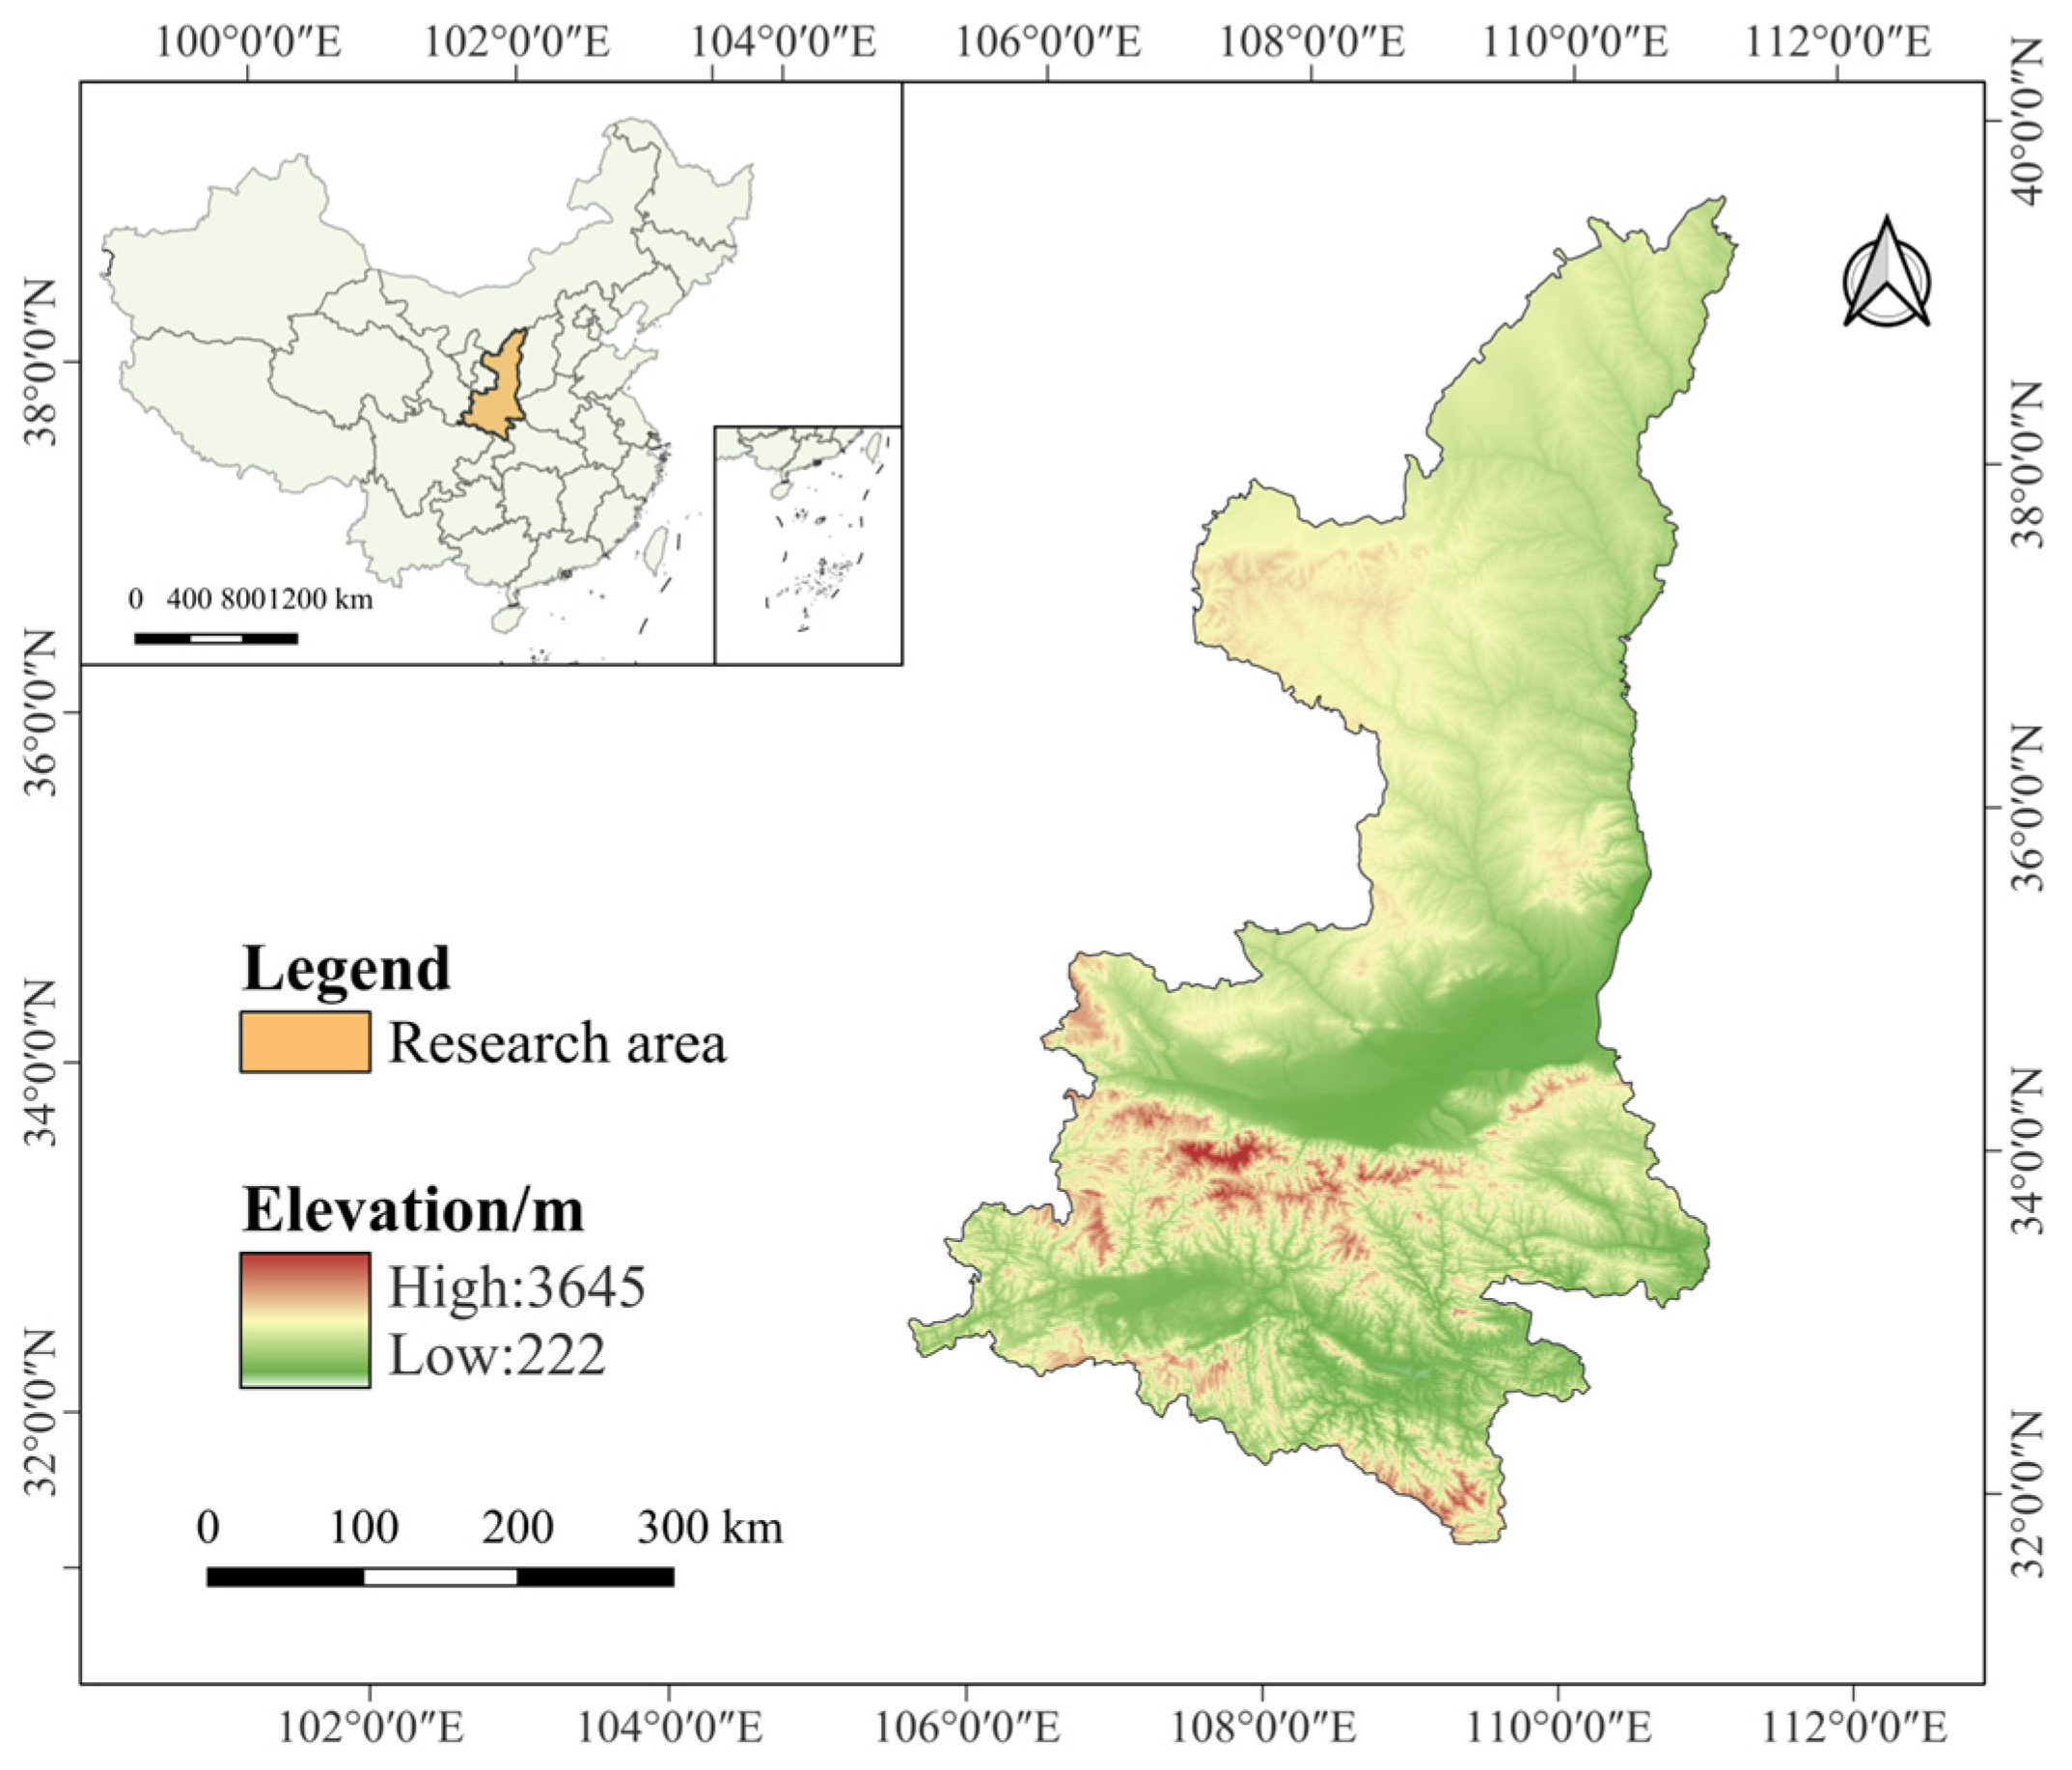
Shaanxi Province is situated in central China (31°42′–39°35′ N, 105°29′–111°15′ E) and covers an area of about 205,600 km2 (Figure 1). The terrain slopes from northwest to southeast, forming three distinct geomorphological zones: the Loess Plateau in the north, the Guanzhong Plain in the center, and the Qinling–Daba Mountains in the south. The province experiences a typical continental monsoon climate, with clear north–south variations. Situated at the transition between China’s northern arid zone and southern humid zone, Shaanxi acts as an important ecological transitional belt [24]. The northern region is characterized by a warm semi-arid climate, the central region by a temperate semi-humid climate, and the southern region by a humid subtropical climate. Annual precipitation increases markedly from less than 400 mm in the northern Loess Plateau to over 1000 mm in the Qinba Mountains, while temperature shows an opposite gradient [25,26]. Within the province, ecosystem types are rich and include forests, grass, croplands and wetlands, all of which play a key role in maintaining regional ecological stability and carbon balance. Meanwhile, the rapid urbanization of the Guanzhong Plain [24] and intensive agricultural activity in northern Shaanxi [27] have markedly altered land-use patterns, with profound implications for ecosystem carbon storage. The pronounced topographic differentiation not only shapes the spatial pattern of land use but also exerts a significant influence on the distribution of carbon storage [28]. Shaanxi Province has diverse ecosystems—forests, grass, croplands, and water bodies—offering valuable data for analyzing carbon storage dynamics. Therefore, Shaanxi serves as an ideal case study area for investigating the spatial coupling relationship between LULC and carbon storage.

2.1.2. Data Sources and Processing

In this study, climate, natural, human, and landscape factors were selected to analyze the driving mechanisms of carbon storage in Shaanxi Province [9,10,11,29,30]. The LULC Dataset of Shaanxi Province was obtained from the 30 m annual land cover dataset of China (CLCD) developed by Professor Xin Huang and Jie Yang from Wuhan University (https://doi.org/10.5281/zenodo.5210928) [26]. In this study, the land-use types were categorized into six classes: cultivated land (cropland), forest land, grass land (shrub and grass), water, construction land (impervious), and unused land (barren). Twelve key variables were selected as driving factors of carbon storage, categorized into four groups: climate, natural, human, and landscape factors (Table 1). To ensure consistency and comparability across datasets, all raster datasets were processed using Python (version 3.12.2, Python Software Foundation, USA)—including rasterization, resampling, projection transformation, and spatial alignment—standardizing the spatial resolution to 90 m and unifying the row and column dimensions, thereby ensuring the accuracy and compatibility of subsequent spatial analyses.

2.1.3. Analytical Framework of the Study

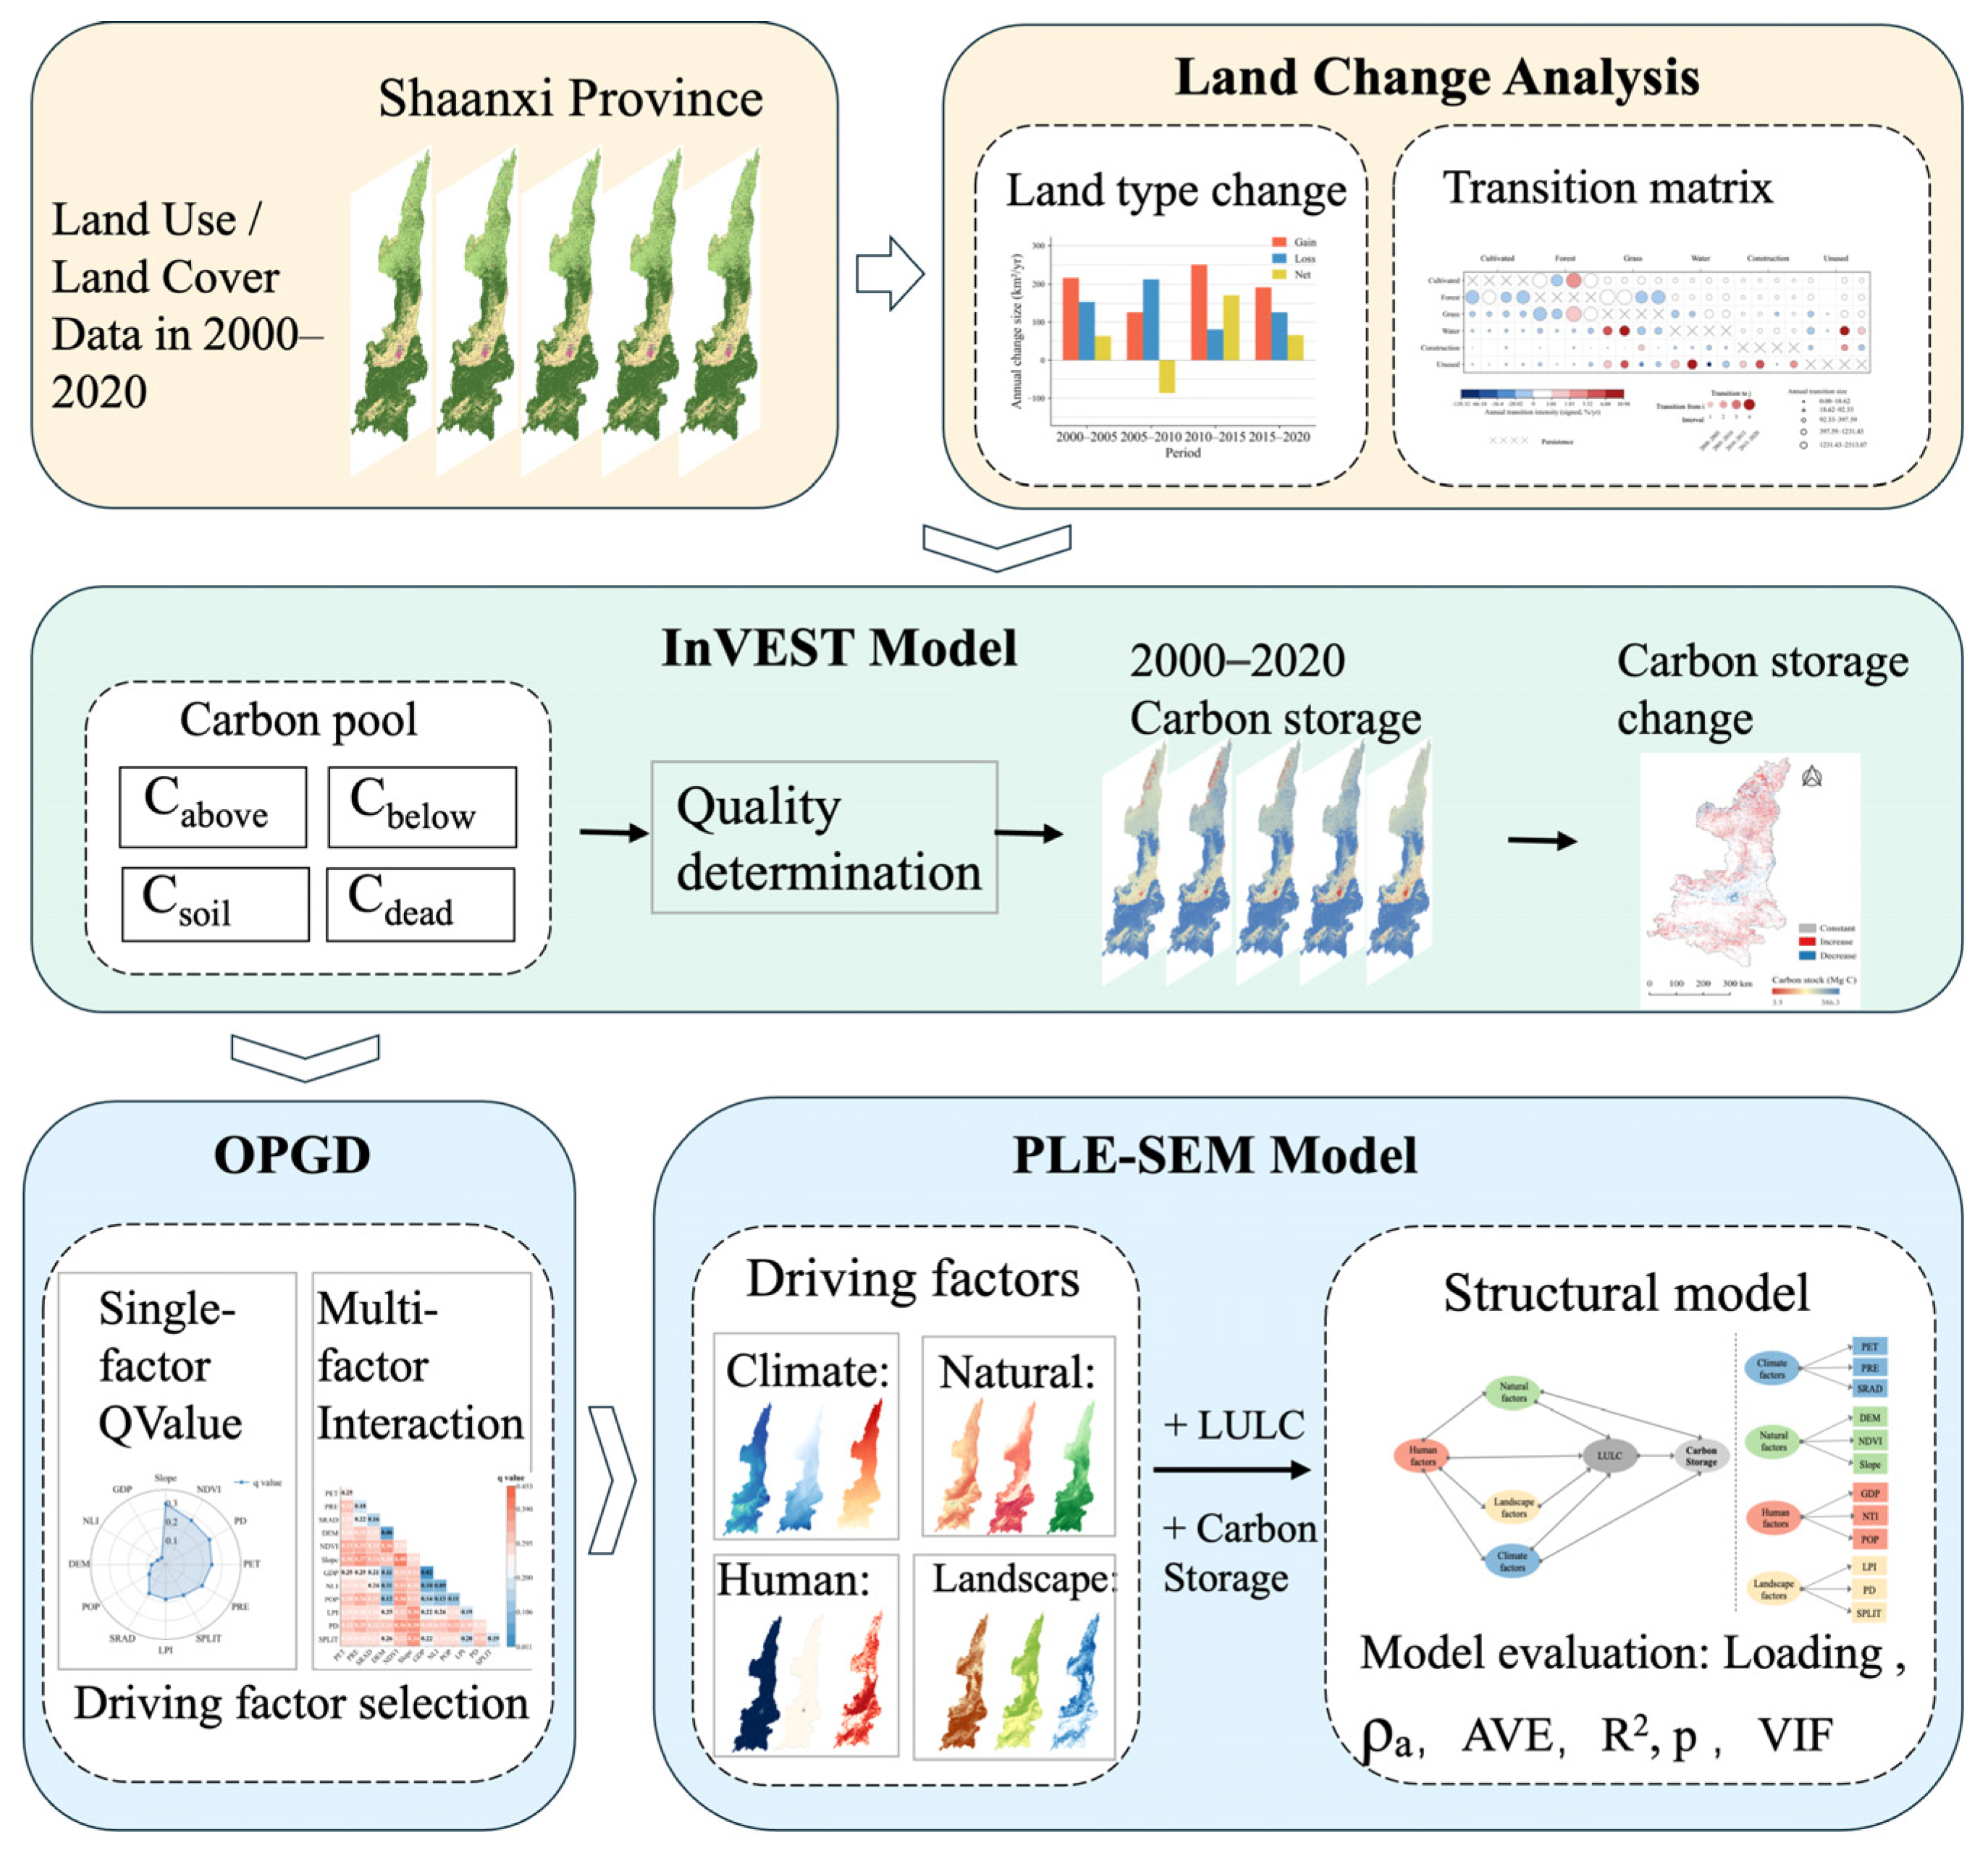
This study is structured into three main parts: (1) LULC change analysis is conducted based on the 2000–2020 dataset to identify spatial transformation patterns and transition relationships among different land types. (2) The InVEST model is applied to calculate the total carbon storage and to visualize the spatial distribution of carbon storage increases and decreases across different regions from 2000 to 2020. (3) The OPGD and PLS-SEM models are integrated to identify and quantify the driving factors influencing both LULC and carbon storage, revealing their interaction mechanisms across climate, natural, human, and landscape dimensions (Figure 2).

2.2. Methods

2.2.1. A Markov Chain-Based Model for Analyzing Land Use/Cover Dynamics

To analyze the temporal evolution of land-use patterns, a Markov Chain-based model was employed. LULC maps from multiple periods (2000, 2005, 2010, 2015, and 2020) were used as the primary input data. Each land-use category was coded as a discrete state S i (cultivated land, forest land, grass land, water land, construction land, and unused land) [30,31,32,33,34]. The area and rate of change for each land-use category between two consecutive periods were calculated as follows:
Δ A i = A i , t 2 A i , t 1 , R i = Δ A i A i , t 1 × 100 %
where A i , t 1 and A i , t 2 represent the area of land-use type i at times t 1 and t 2 , respectively; Δ A i denotes the change in the area of land-use type i between the two periods; and R i indicates the rate of change in land-use type i during the same period. This step quantifies the total gains and losses of each land-use type during the study period.
To characterize the dynamic conversion relationships between land-use categories, a transition probability matrix P was established as follows:
P = p i j , j = 1 n p i j = 1 , 0 p i j < 1
where p i j denotes the probability of land-use type i converting to type j within the given time interval. The matrix elements were derived from the cross-tabulation of land-use maps from two periods. The overall land-use state at the time t + 1 can be expressed as:
S t + 1 = P × S t
where S t represents the vector of land-use proportions at time t . This process enables the quantification of transition probabilities and provides a statistical foundation for assessing land-use dynamics over time.

2.2.2. InVEST Model

Carbon storage is a key indicator of the climate-regulating function of ecosystems, as quantifying the amount of carbon held in soils and vegetation enables us to assess how ecosystems respond to and contribute toward climate change. The InVEST (Integrated Valuation of Ecosystem Services and Trade-offs) model is currently one of the most widely used tools for estimating carbon storage. The model divides carbon storage into four primary carbon pools: above-ground biomass, below-ground biomass, soil organic carbon, and dead organic matter. By integrating LULC Data with the corresponding carbon-density parameters for each land-use type, the model estimates both the spatial distribution and the total amount of carbon storage within the study area. The carbon storage for each land-use category is calculated as follows:
C i = C i , a b o v e + C i , b e l o w + C i , s o i l + C i , d e a d
where C i represents the average carbon density of the land-use type t · h a 1 ; C i , a b o v e , C i , b e l o w , C i , s o i l , and C i , d e a d represent the carbon densities of above-ground biomass, below-ground biomass, soil organic carbon, and dead organic matter, respectively. The total carbon storage in the study area can be calculated as:
C t o t a l = i = 1 n C i × A i
where A i denotes the area (ha) of land-use type i , n is the total number of land-use categories, and C t o t a l represents the total carbon storage ( t ) within the study area.
The InVEST model operates under the assumption that the carbon density of each land-use type remains constant over the study period. The carbon density values corresponding to various vegetation types are treated as fixed parameters and multiplied by their respective land-use areas to estimate the total regional carbon storage. Given that carbon density values vary across studies due to differences in data sources, estimation methods, and land-use classification systems, in this study, parameters were selected from multiple candidates based on their consistency with the land-use categories used here, their compatibility with the four-pool structure of the InVEST model (Table 2), and their derivation from regional field measurements. The soil organic carbon density values correspond to the 0–100 cm soil layer, which is commonly used in regional carbon storage assessments, thereby improving applicability and reliability [27,35,36].
The InVEST model assumes a static carbon density over time, without considering dynamic ecosystem processes such as vegetation growth or human disturbance. However, in reality, carbon density may change over time due to vegetation growth, land management practices, and other human interventions [37,38]. Thus, it reflects the potential spatial distribution of carbon storage rather than temporal changes in carbon flux, which is a key limitation at the regional scale.

2.2.3. OPGD (Optimal Parameter-Based Geographical Detector)

To quantify the explanatory power of different driving factors for the spatial distribution of carbon storage, the OPDG model was employed in this study [39]. OPDG assumes that, if a factor significantly influences a spatially distributed variable, their spatial patterns should exhibit similar stratification characteristics. The factor detector measures the extent to which an explanatory variable X explains the spatial variation in the dependent variable Y by the q-statistic, calculated as:
Q = 1 h = 1 L N h σ h 2 N σ 2
where Q (ranging from 0 to 1) represents the explanatory power of the factor; L denotes the number of strata (or subregions) of the factor X ; N h and σ h 2 are the number of samples and the variance of Y within stratum h , respectively; N and σ 2 are the total number of samples and the global variance of Y. A higher Q-value indicates a stronger explanatory power of the factor for the spatial heterogeneity of carbon storage. Since the GeoDetector model requires categorical strata, continuous variables were discretized before analysis. In this study, the OPGD method was used to select the discretization scheme that gives the highest Q-value, which helps reduce the uncertainty caused by manual discretization.
Furthermore, the interaction detector was employed to examine the combined effects of two factors ( X 1 and X 2 ) on the spatial heterogeneity of carbon storage.
Q X 1 X 2 = 1 h = 1 L N h σ h 2 N σ 2
Although the mathematical expression of the Q-statistic is identical, the interaction detector differs from the single-factor detector in that its input strata are generated by overlaying the classification layers of two factors rather than using a single factor alone. By comparing Q X 1 X 2 with the individual Q ( X 1 ) and Q ( X 2 ) , the interaction type can be identified. Specifically, Q X 1 X 2 > m a x ( Q ( X 1 ) , Q ( X 2 ) ) : bivariate enhancement; Q X 1 X 2 > Q ( X 1 ) + Q ( X 2 ) : nonlinear enhancement; Q X 1 X 2 < m i n ( Q ( X 1 ) , Q ( X 2 ) ) : weakening effect. This approach reveals whether different factors interact synergistically or antagonistically, thereby providing insight into the complex mechanisms underlying carbon storage variation driven by natural, climate, human, and landscape conditions.

2.2.4. PLS-SEM

The PLS-SEM (Partial Least Squares Structural Equation Modeling) is a statistical approach used to analyze complex causal relationships among multiple factors. It allows for the simultaneous estimation of both direct and indirect effect paths among multiple variables [40]. In PLS-SEM, research variables are categorized into latent variables and manifest variables. Latent variables represent abstract concepts that cannot be directly measured or observed—such as “climate factors”—but can be characterized through a set of observable indicators. These observable indicators are referred to as manifest variables and typically originate from quantifiable data or statistical measurements, such as temperature and precipitation. In this study, the latent and observed variables were selected based on previous studies and data availability to represent natural, human, climate, and landscape factors influencing carbon storage [41,42]. The PLS-SEM model is composed of two main components. The measurement model specifies the relationships between latent variables and their corresponding manifest indicators, while the structural model depicts the causal pathways and directional influences among the latent variables. In the measurement model, each latent construct can be represented by one or more manifest indicators, and its mathematical formulation can be expressed as follows:
X = Λ x a + β
Y = Λ y λ + φ
where X and Y represent the latent and manifest variables, respectively; Λ x and Λ y are the loading matrices that describe the correlations between latent variables and their corresponding manifest variables; a and λ denote the vectors of latent variables; β and φ represent the measurement error terms. In the structural model, the causal relationships among latent variables can be expressed as:
Z = W Z + N ξ + j
where Z and ξ represent different latent variables; W and N denote their respective influence coefficients; and j refers to the regression residual term.
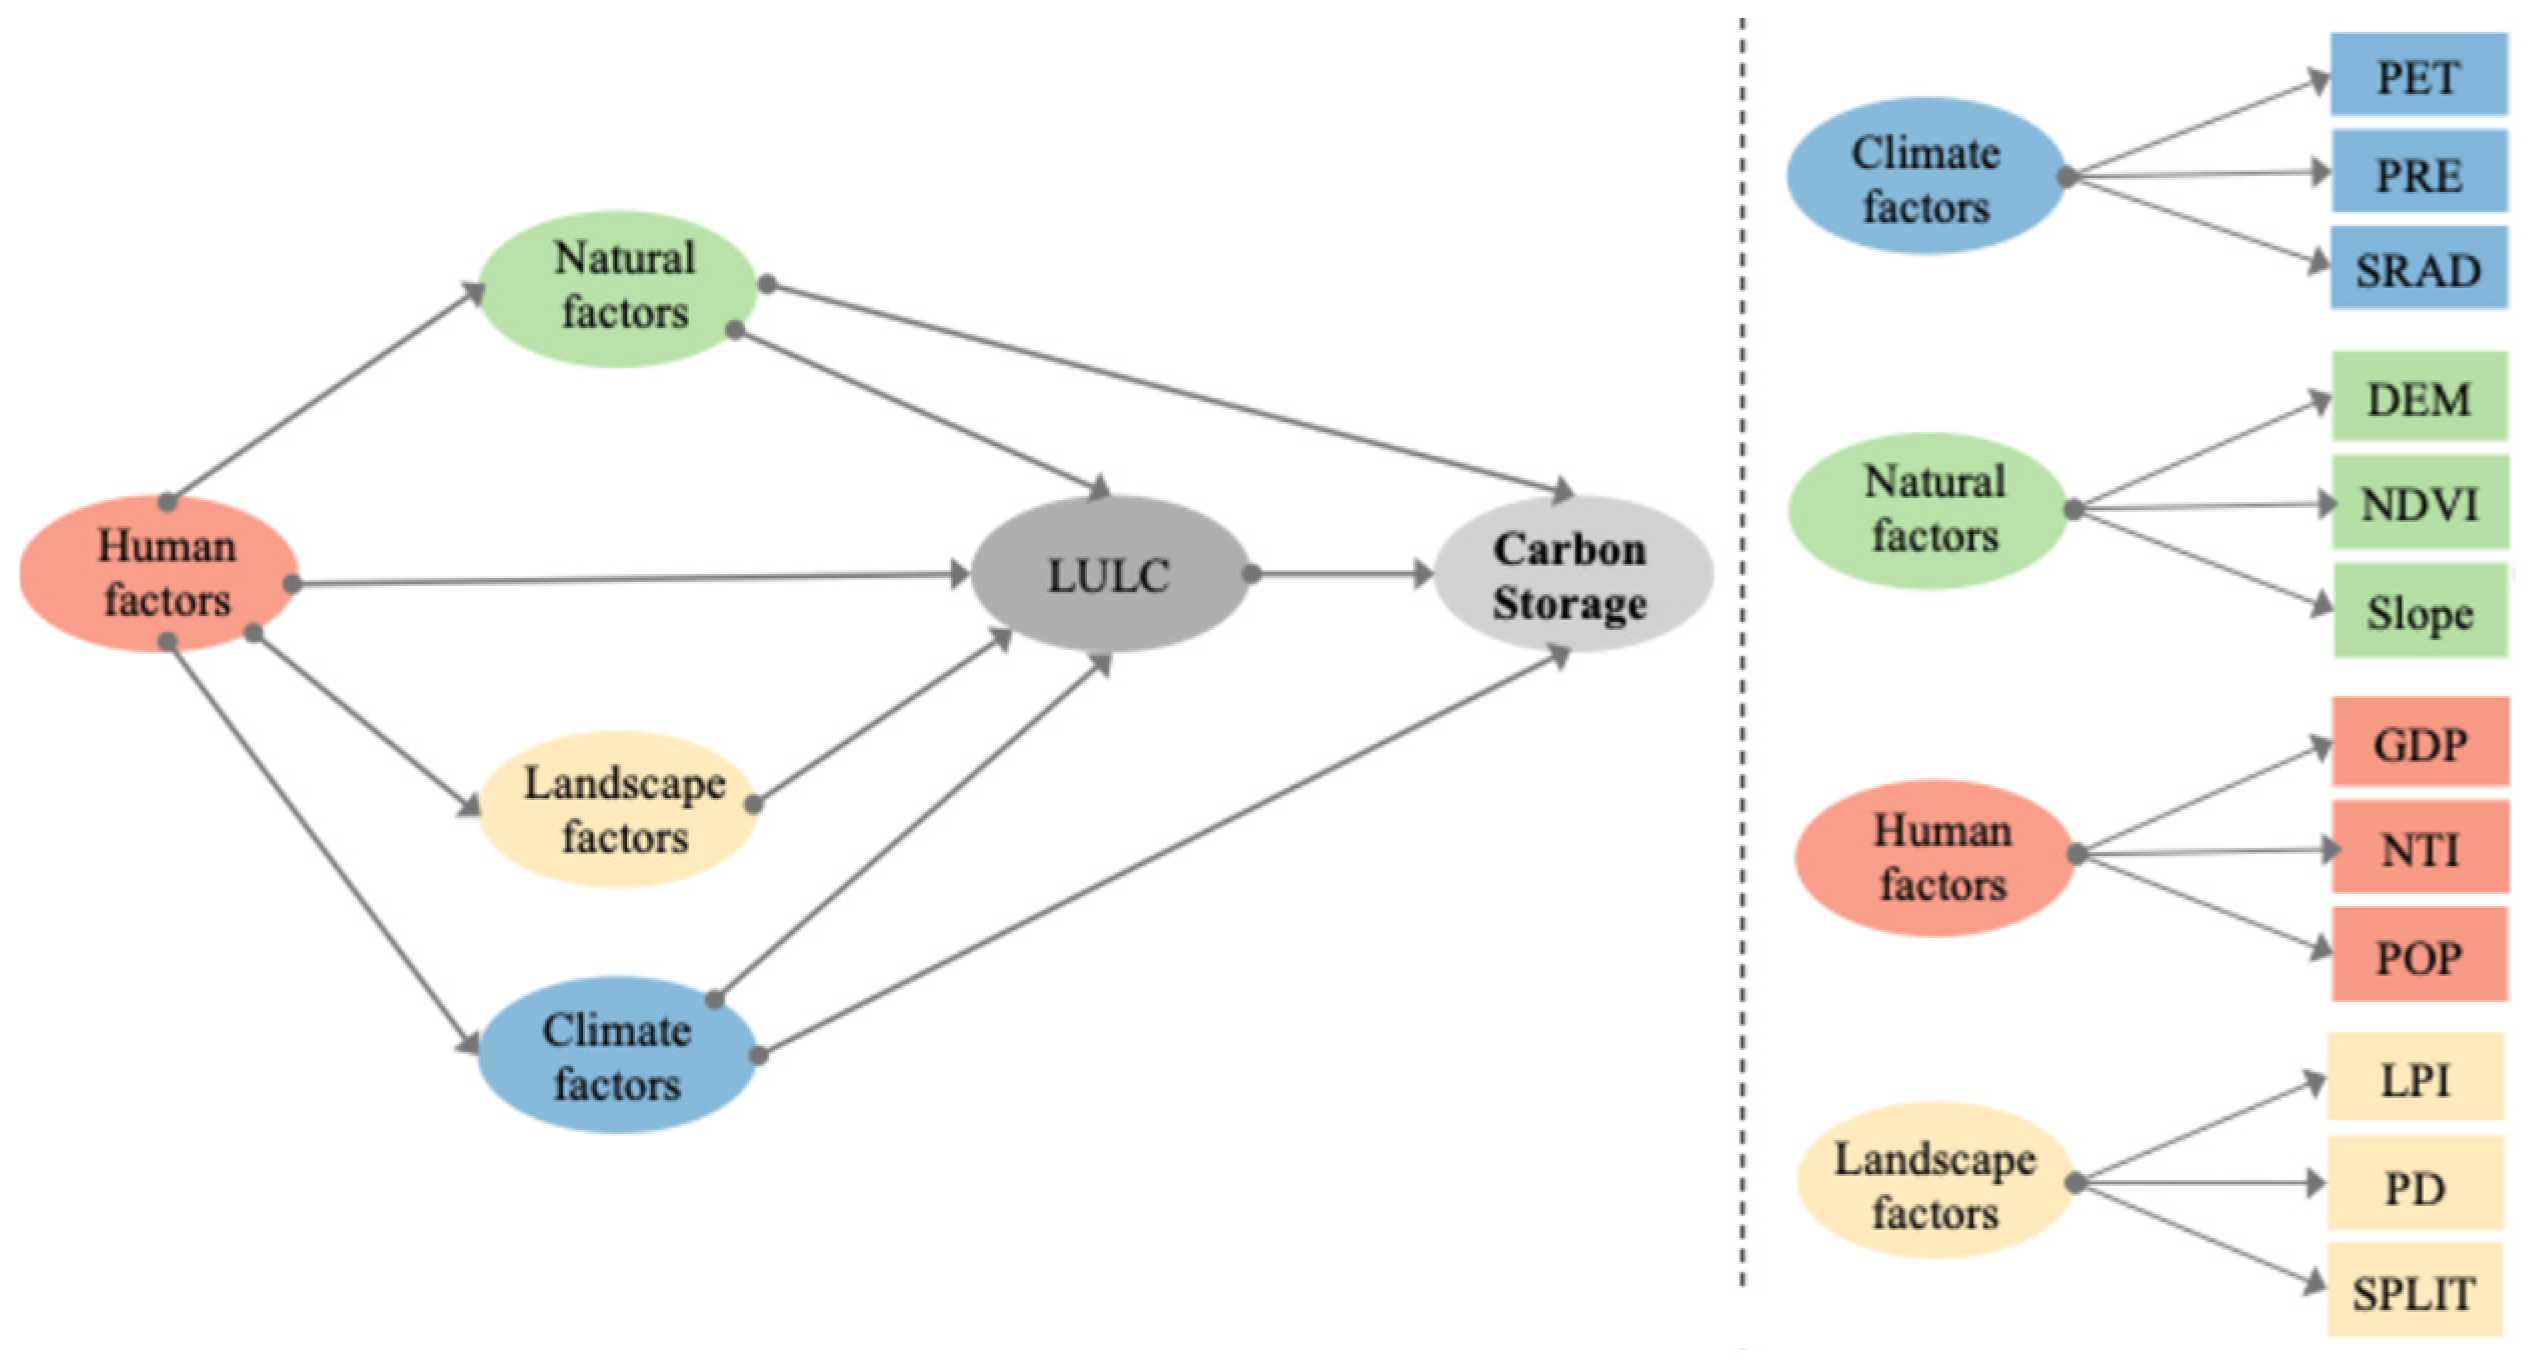
Through the joint estimation of these two sub-models, PLS-SEM can systematically explain the complex interaction mechanisms among variables, providing a quantitative basis for revealing the interrelationships among multiple factors such as natural, climate, and human activities. In this study, the latent variables include climate factors (potential evapotranspiration, precipitation, and solar radiation), natural factors (digital elevation model, normalized difference vegetation index, and slope), human factors (gross domestic product, nighttime light index, and population density), and landscape factors (largest patch index, patch density, and splitting index). The model of the driving factors influencing carbon storage in Shaanxi Province is illustrated in Figure 3.
After establishing the PLS-SEM model, a series of measurement and structural indicators were used to evaluate the model’s reliability, validity, and explanatory power. For the measurement model, factor loadings were examined to ensure that each observed variable adequately reflected its latent construct, followed by composite reliability (ρa) to assess internal consistency. Convergent validity was further verified through the average variance extracted (AVE). For the structural model, the coefficient of determination (R2) was used to evaluate the model’s explanatory strength, while p-values obtained through bootstrapping were employed to test the statistical significance of path relationships. Additionally, the variance inflation factor (VIF) was calculated to confirm the absence of multicollinearity among predictors. Together, these indicators provide a comprehensive assessment of the quality and robustness of the PLS-SEM model (Table 3).

3. Results

3.1. Spatiotemporal Land Use and Land Changes in 2000–2020

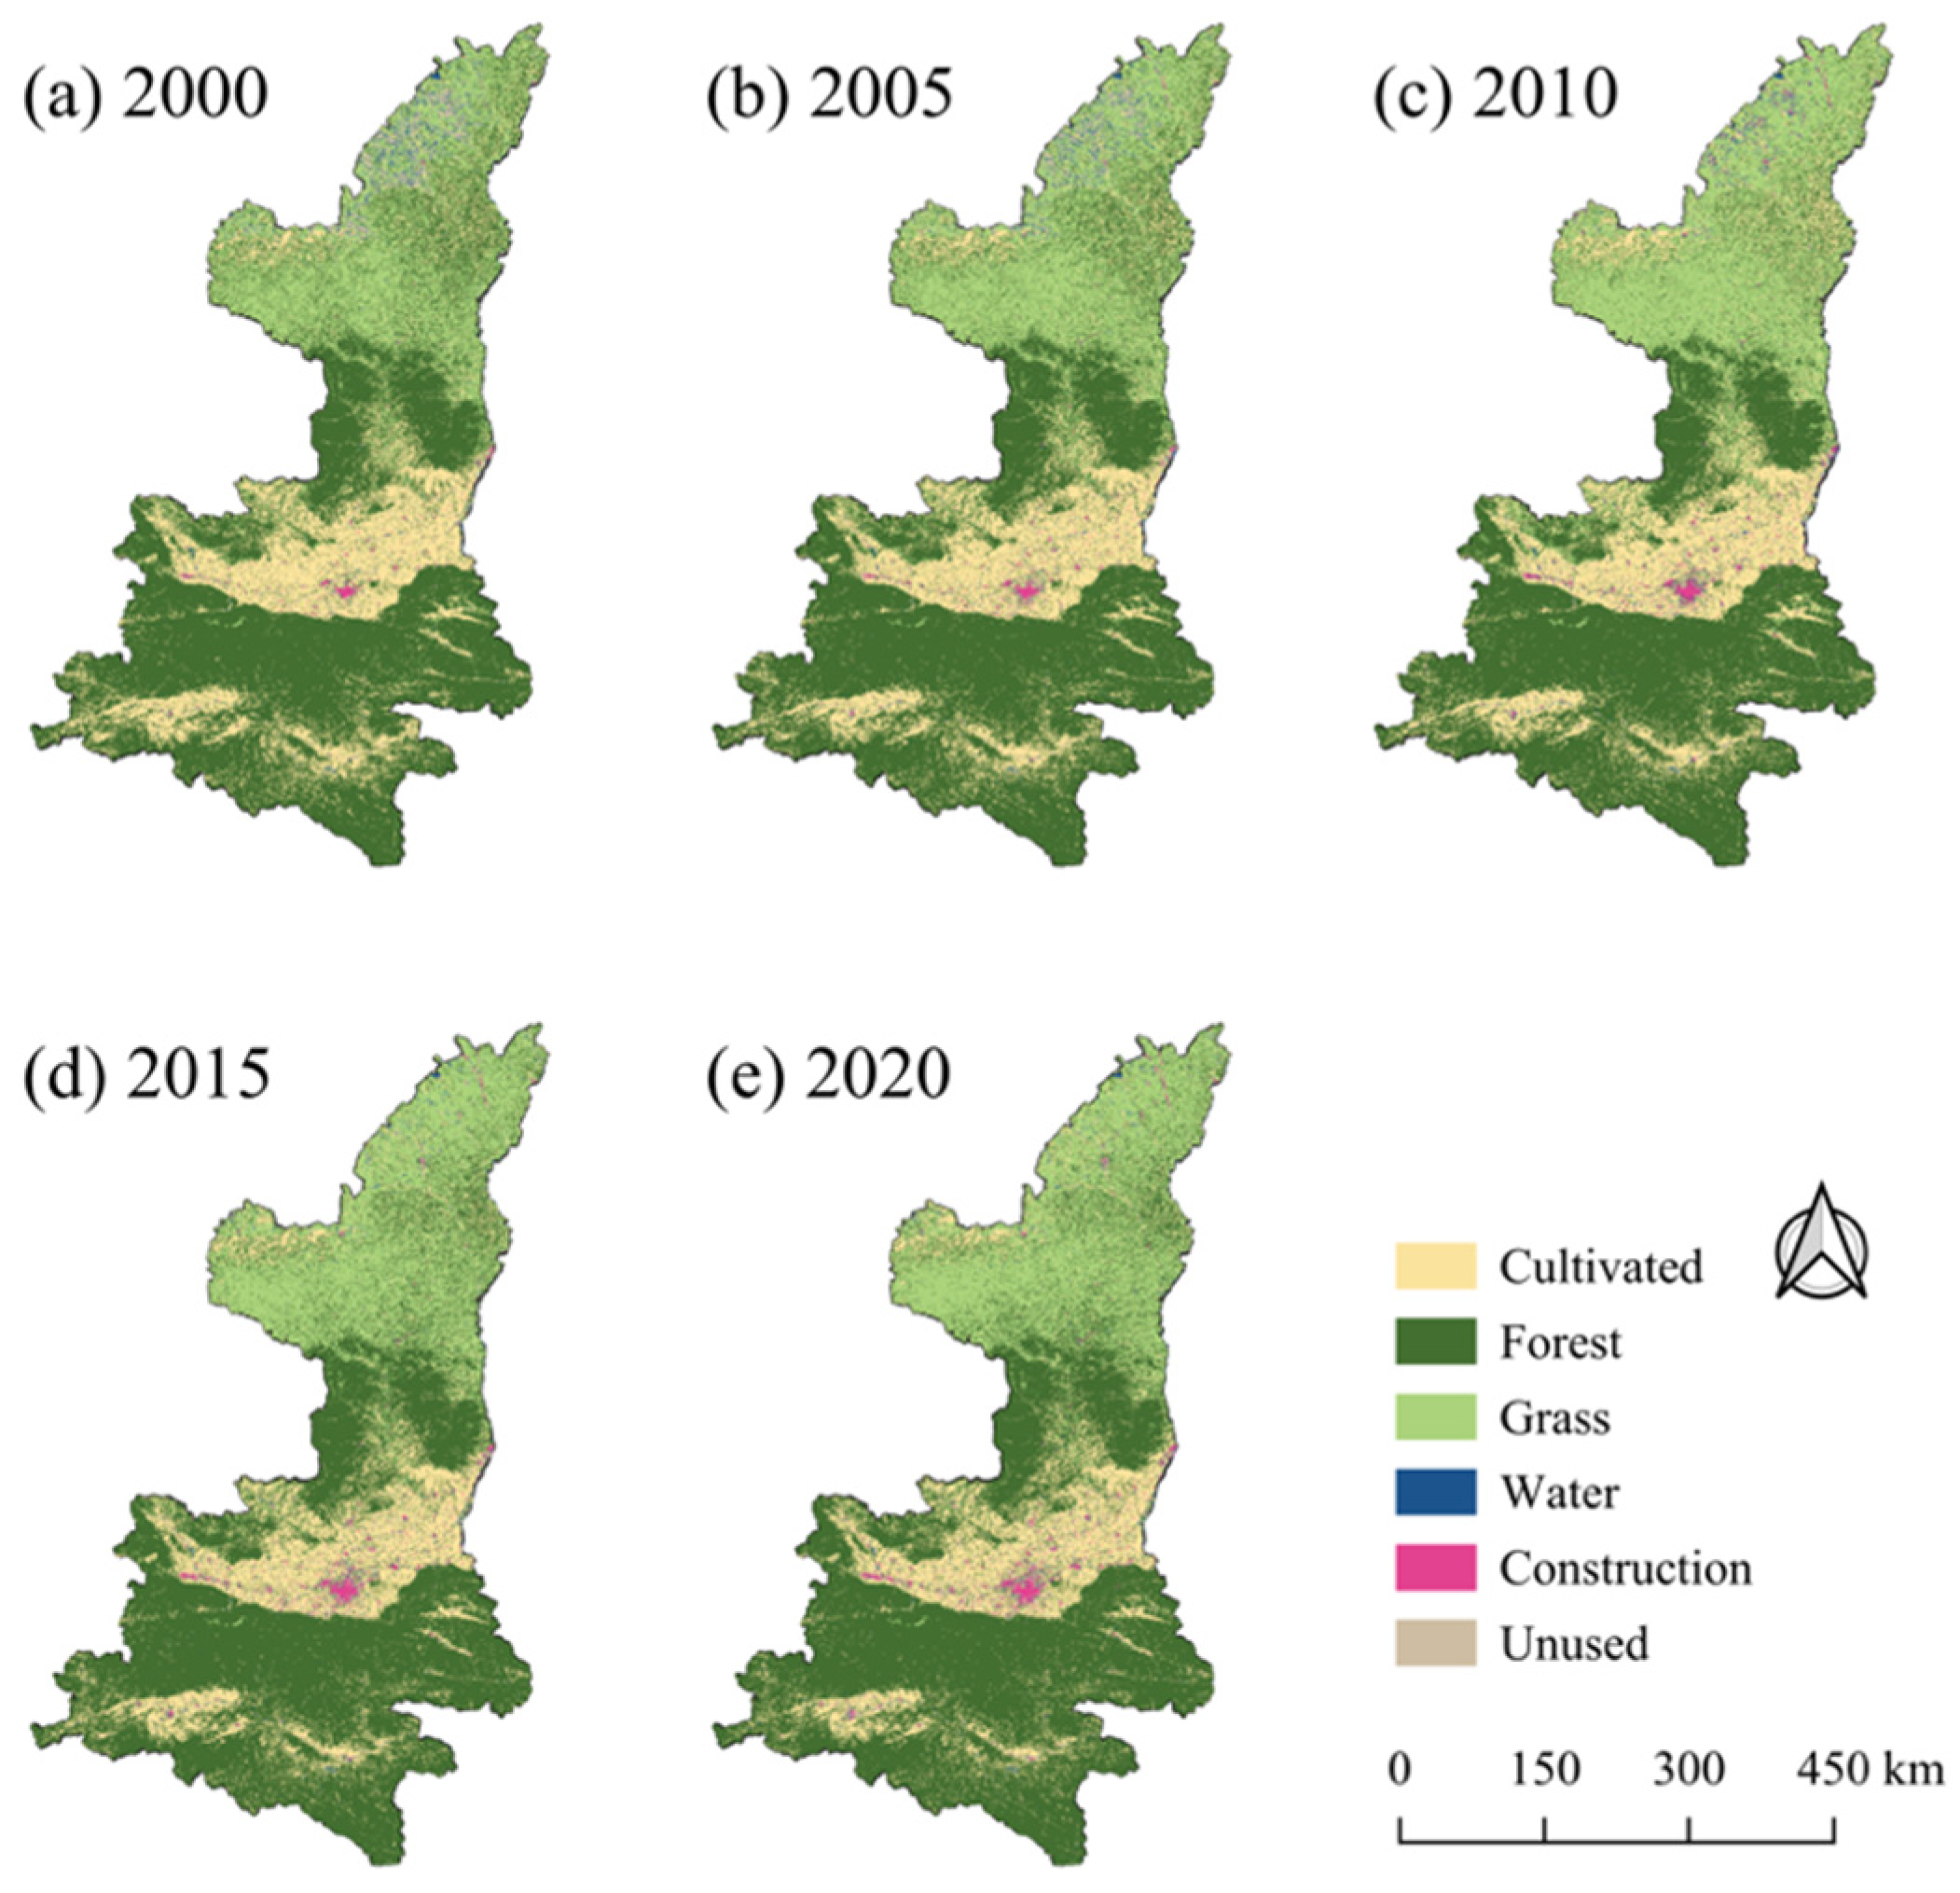
Figure 4 illustrates the spatial–temporal distribution patterns and land-use structure of the study area from 2000 to 2020. Cultivated land is mainly concentrated in the Guanzhong Plain, accounting for 21.74–18.13% of the total area. Forest land, the dominant land type, is primarily distributed in the Qinling Mountains and southern regions, covering 56.33–57.40% of the total area. Grassland is widely distributed across the semi-arid Loess Plateau in northern Shaanxi, typically appearing in patchy or belt-shaped patterns and accounting for 18.80–21.52% of the land area. Water land occupies a relatively small proportion (1.22–0.90%), whereas construction land is concentrated around major cities in the Guanzhong urban agglomeration (0.33–0.95%). Unused land accounts for 1.58–1.09% of the total area.
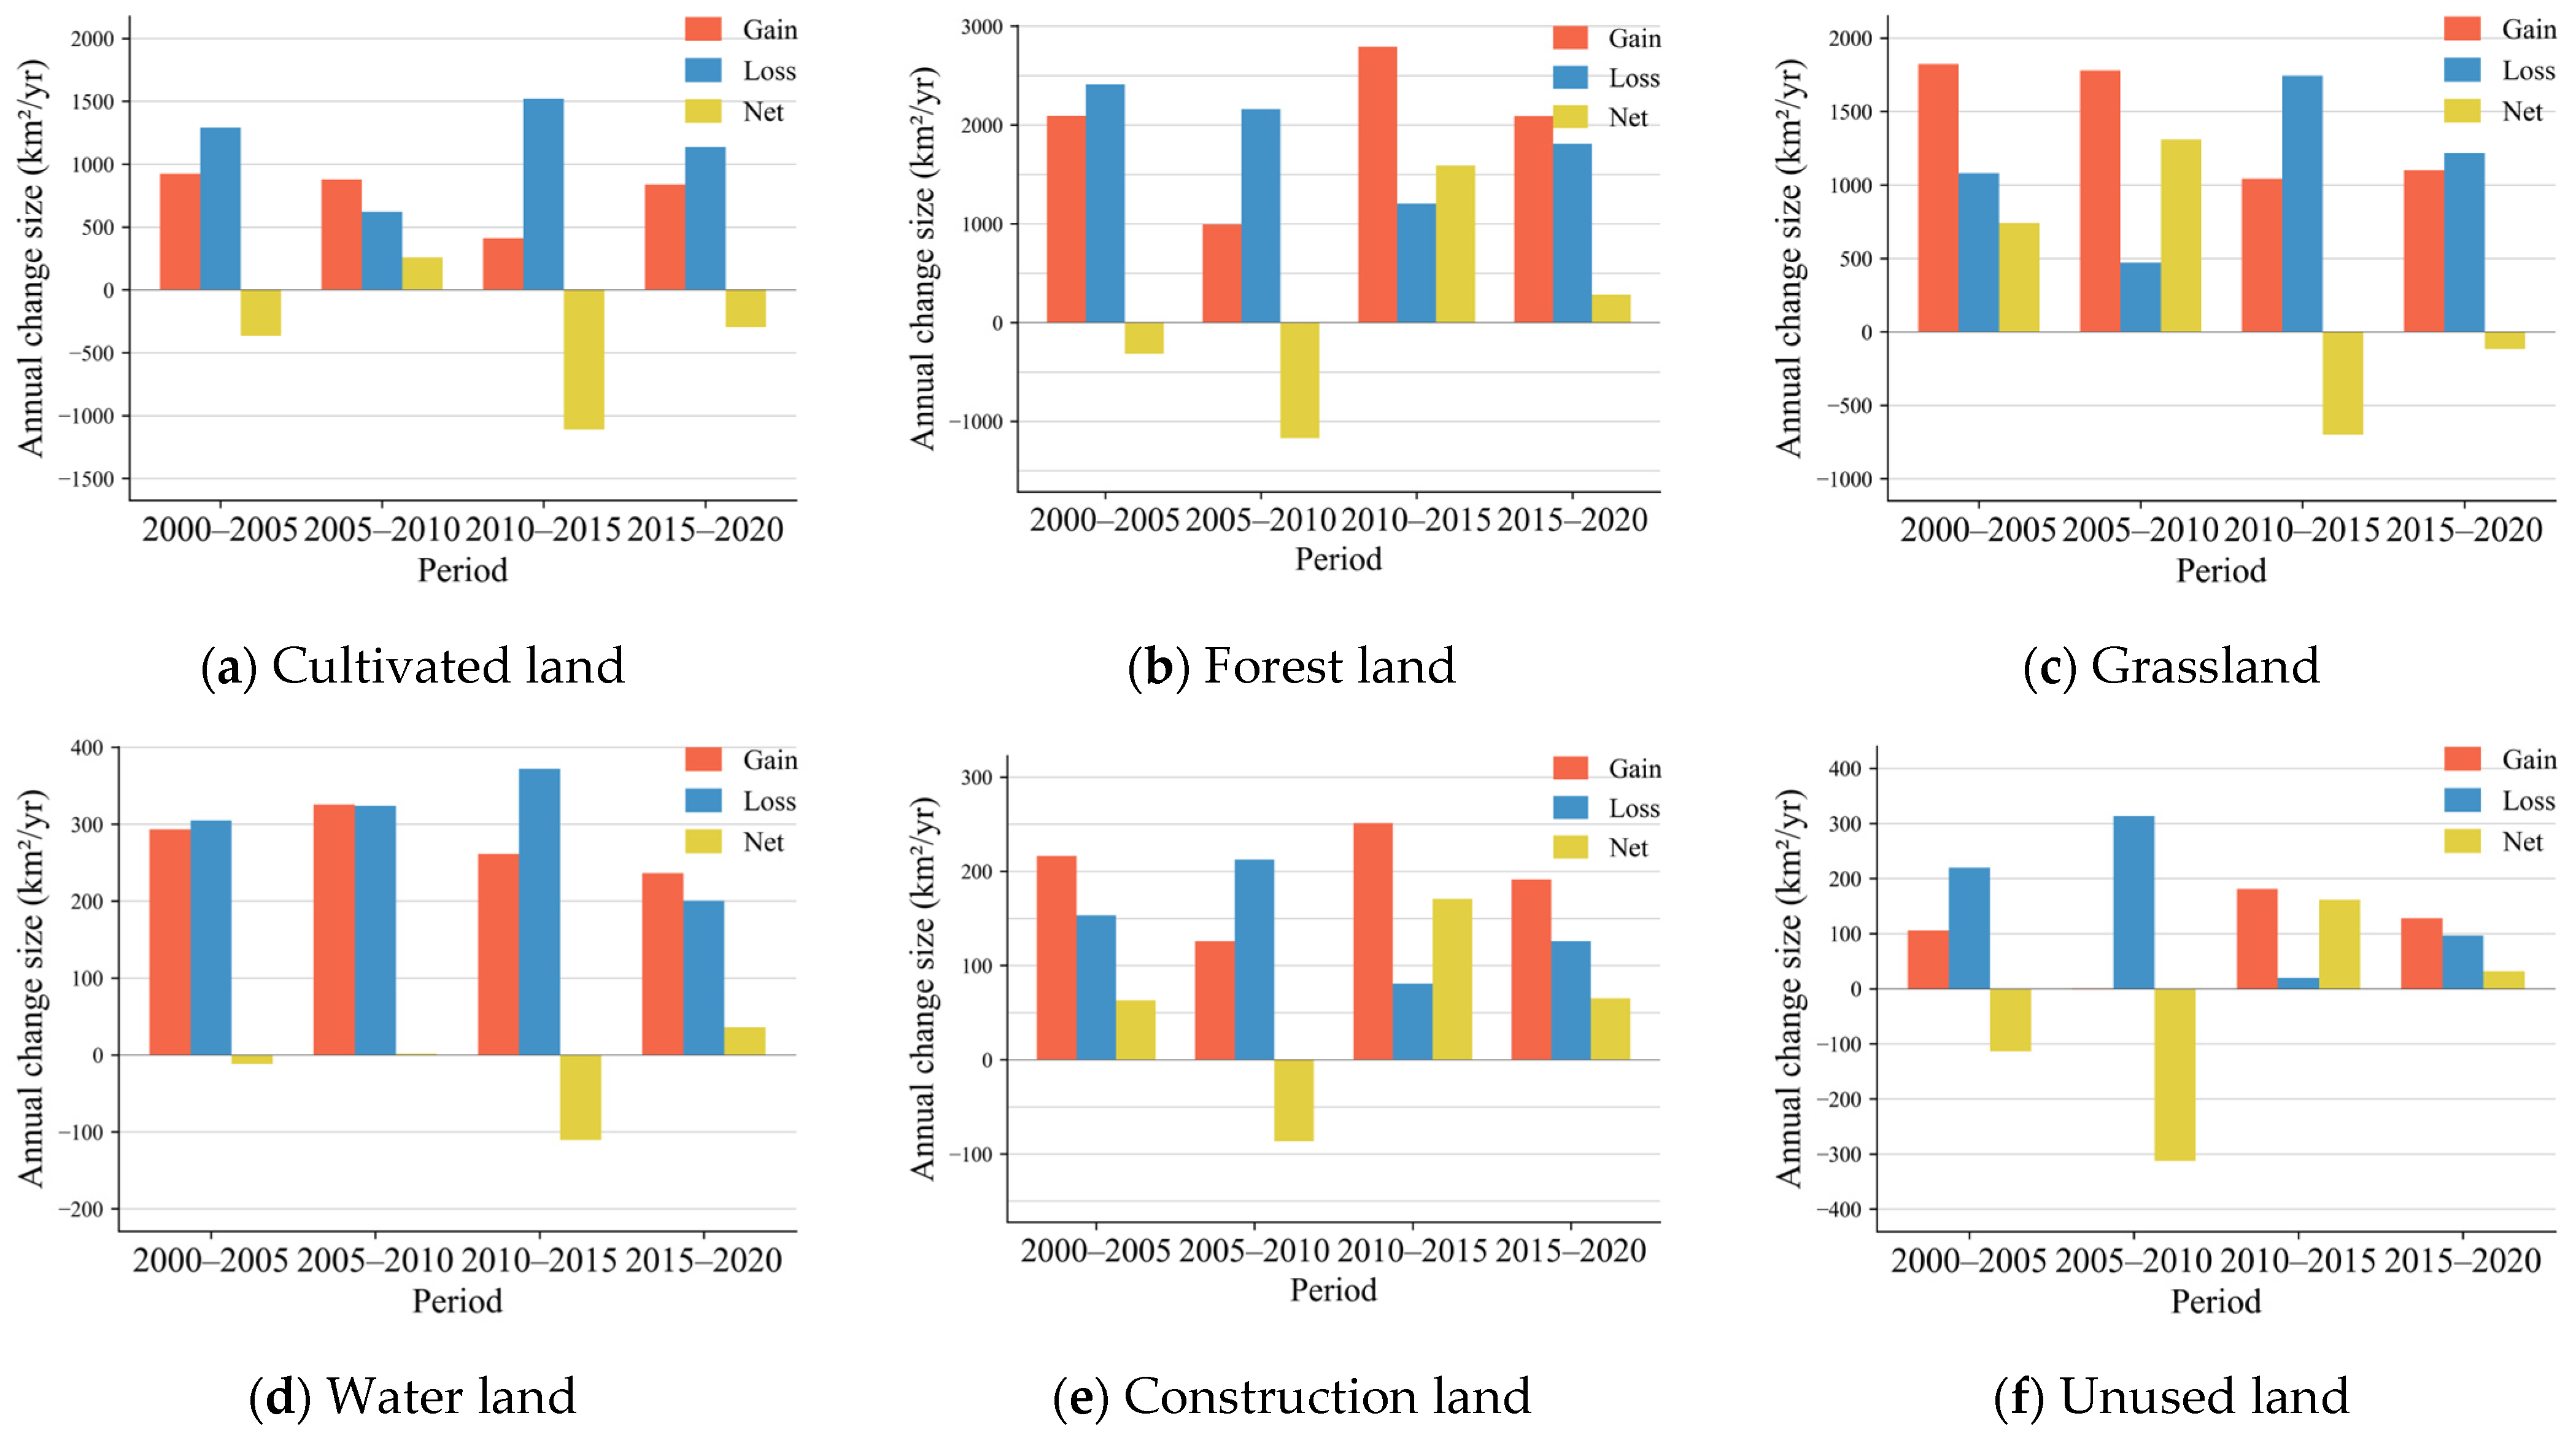
Between 2000 and 2020, the ranking of land-use types by area proportion followed the order forest land > cultivated land > grass land > unused land > water land > construction land. By 2020, this sequence had shifted to forest land > grass land > cultivated land > unused land > construction land > water land. This shift indicates significant adjustments in the regional land-use structure, largely driven by intensified land conversion activities such as afforestation, land abandonment, and urban expansion. In terms of specific changes, forest land increased by 2247.79 km2 (+1.94%). Cultivated land decreased by 7411.67 km2 (−16.59%), primarily due to the implementation of the Grain for Green Program. Grassland expanded by 5593.88 km2 (+14.47%), while water land decreased by 675.14 km2 (−26.83%). Construction land increased by 1262.20 km2 (+183.85%), reflecting rapid urban expansion, whereas unused land shrank by 1017.06 km2 (−31.20%) (Figure 5).
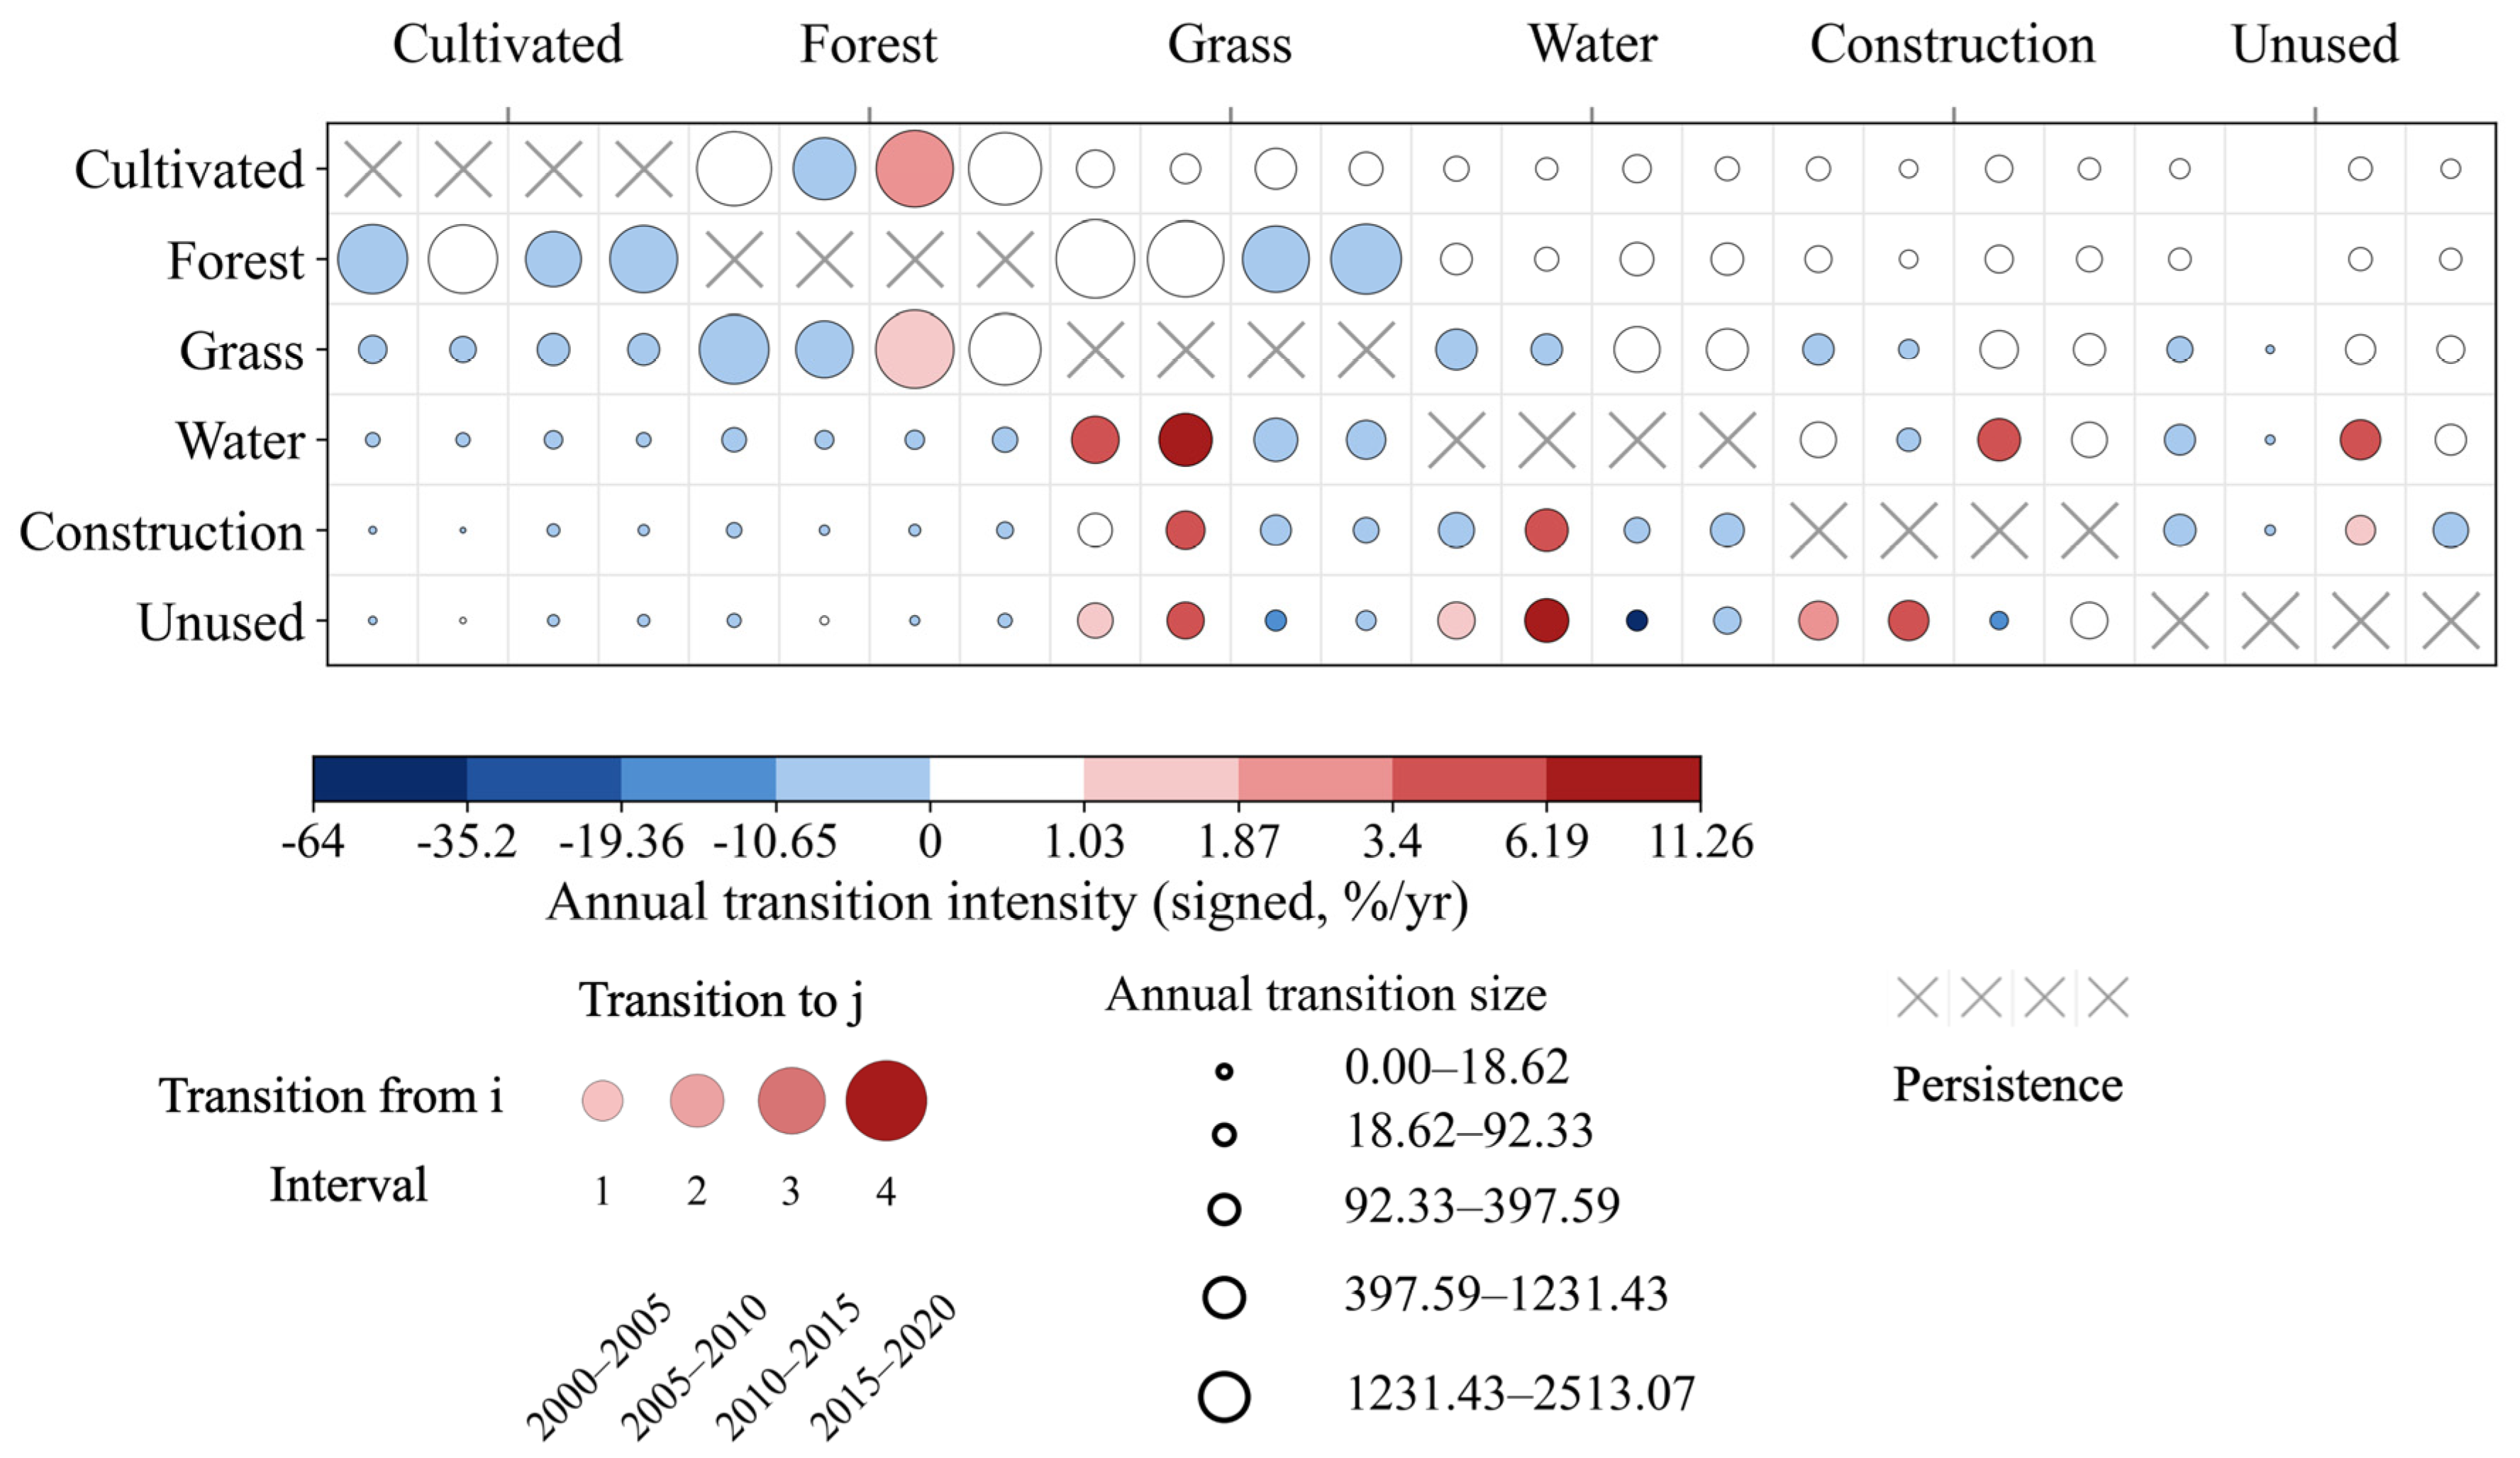
Figure 6 presents the overall land-use transitions in Shaanxi Province from 2000 to 2020. The transition matrix illustrates the magnitude and direction of conversions among the six land-use categories, where bubble size represents the scale of transition, and the color gradient indicates transition intensity. By examining the distribution of bubbles across rows and columns, major conversion pathways and relatively stable land types can be identified. The results show that cultivated land is the largest contributor to land conversion, primarily transforming into forest land (9694.40 km2) and grassland (1369.95 km2). Forest land is predominantly converted into grassland (9919.38 km2), whereas grassland mainly transitions into forest land (6699.49 km2). Water lands are primarily converted into grassland (1340.44 km2). Construction land shows its largest conversion into unused land (28.83 km2). Unused land mainly transitions into grassland (1884.65 km2) and construction land (463.18 km2).

3.2. Spatiotemporal Variation of Carbon Storage from 2000 to 2020

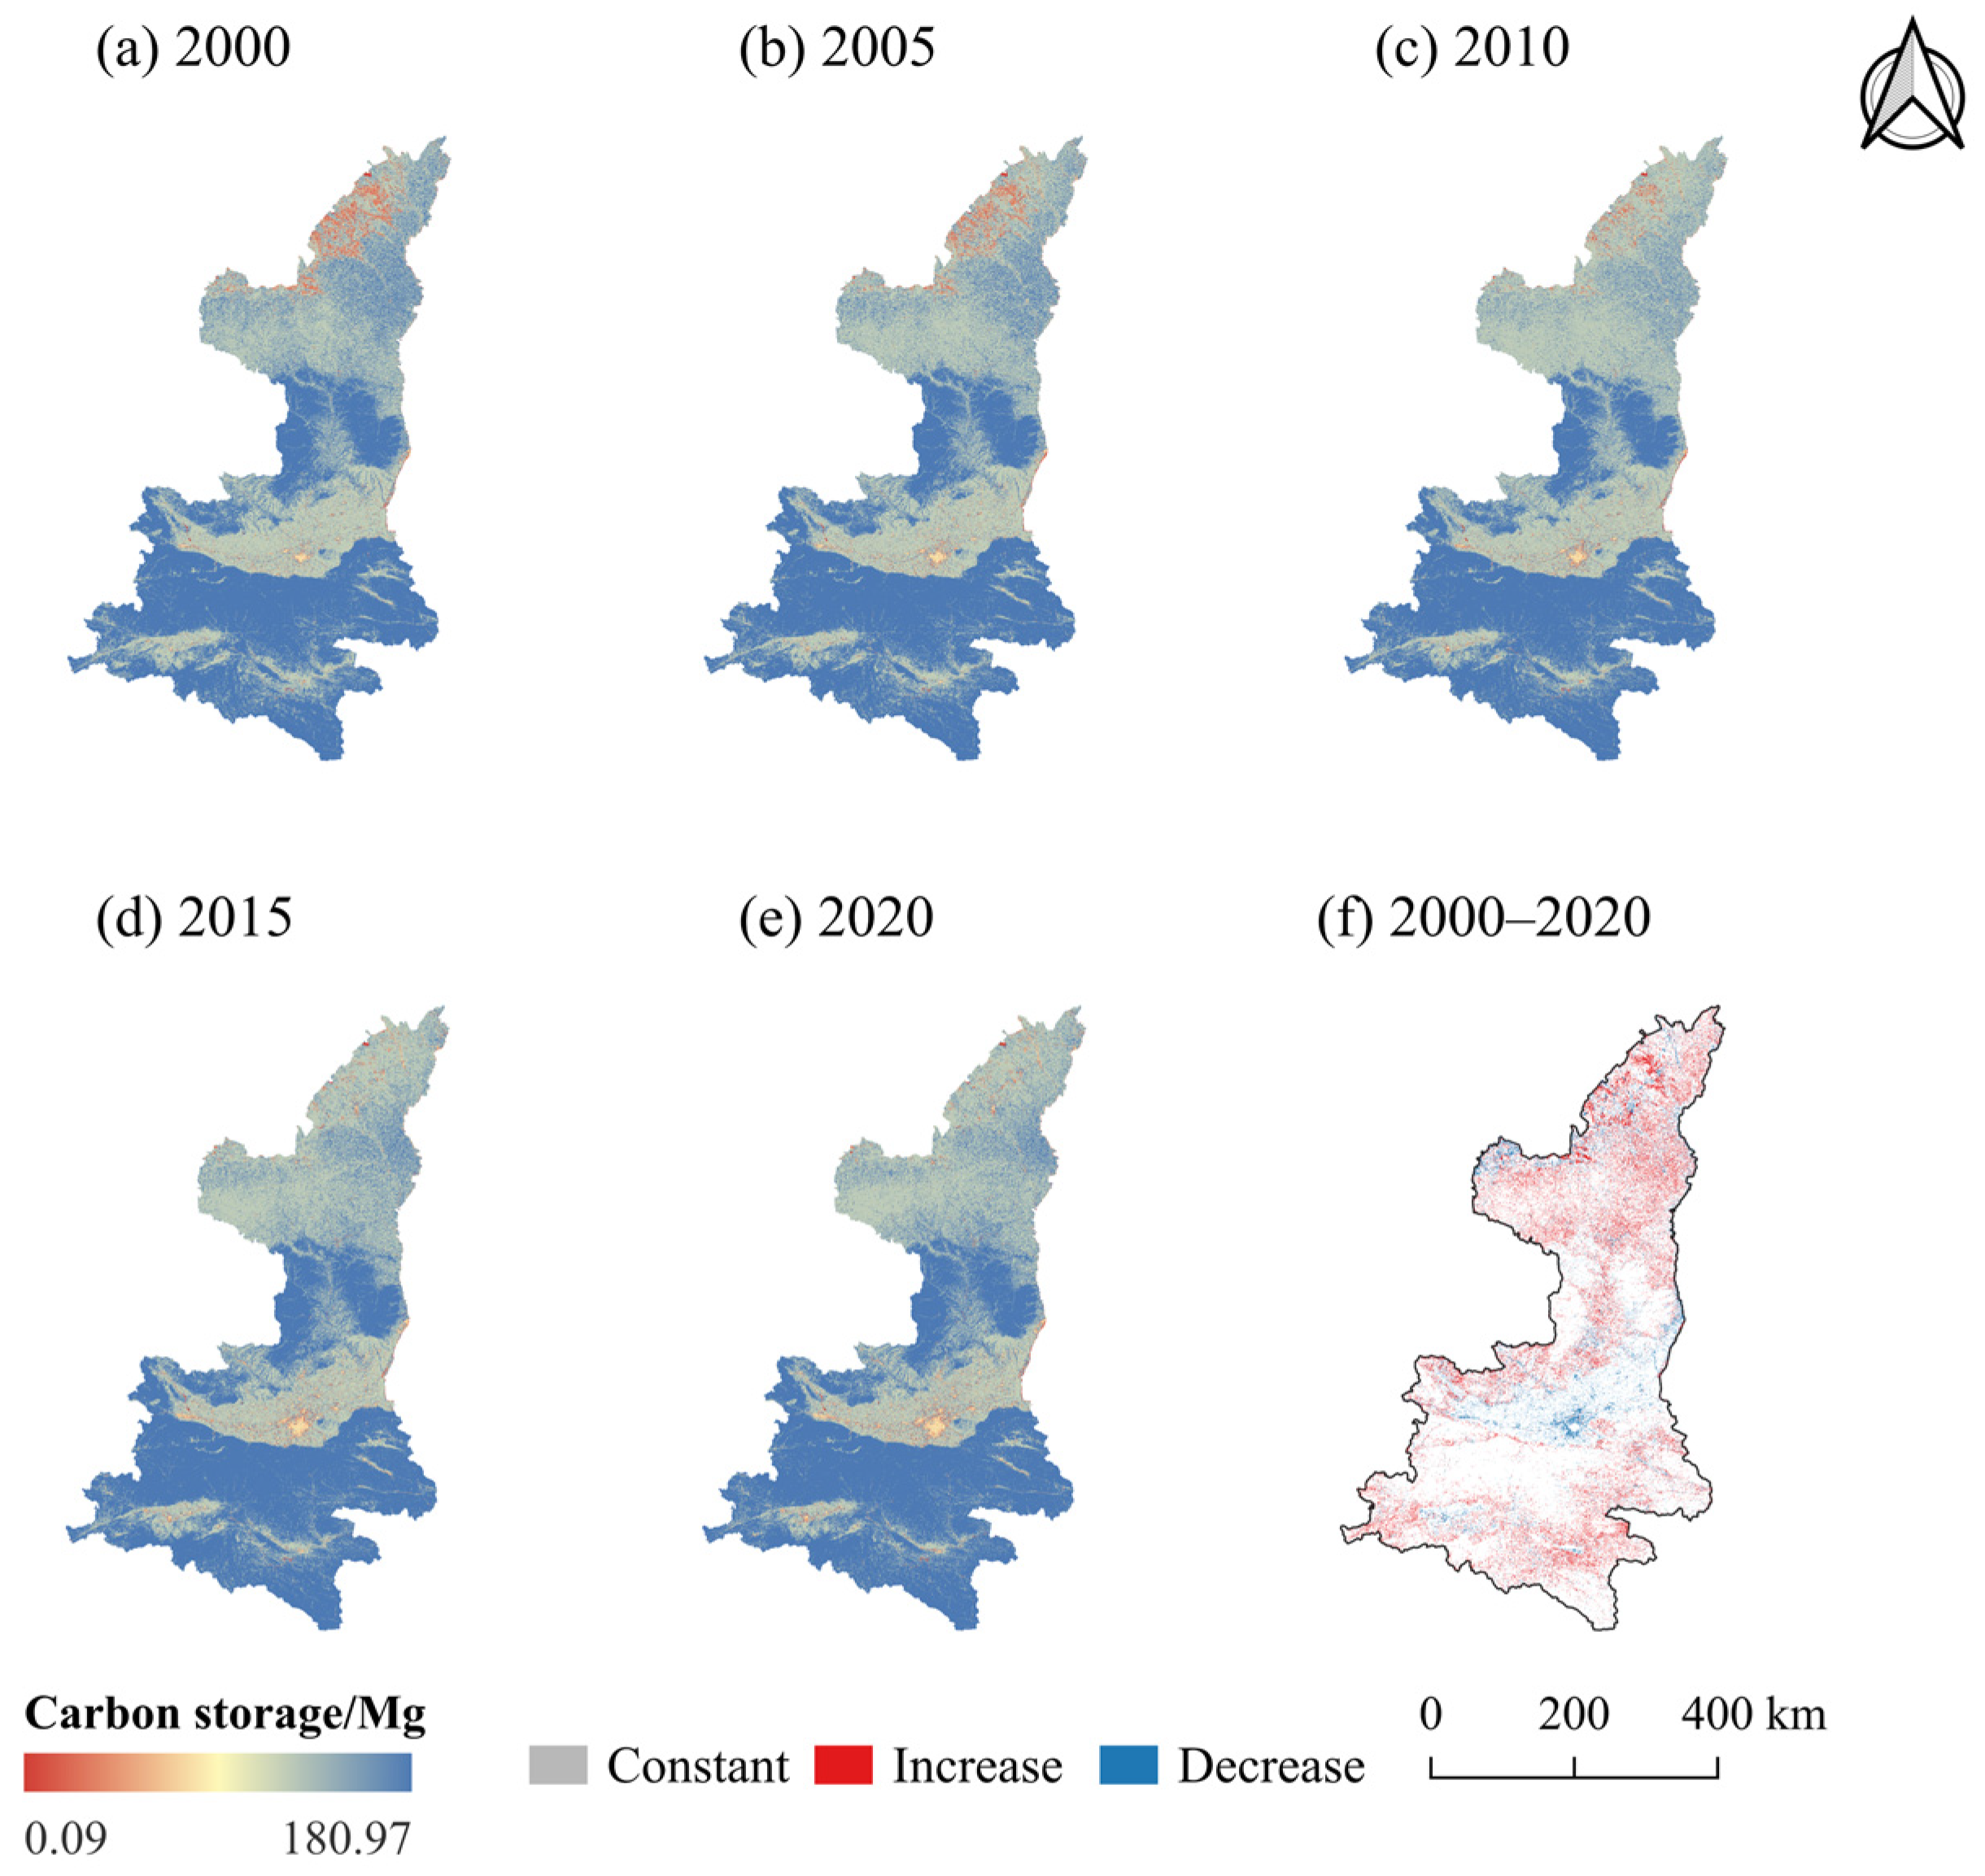
The spatial distribution of carbon storage in Shaanxi Province from 2000 to 2020 (Figure 7) shows a clear latitudinal gradient, with high values in the humid and forested Qinba Mountains, moderate levels in the cropland-dominated Guanzhong Plain, and the lowest values in the semi-arid and highly eroded Loess Plateau. Carbon storage changes also exhibit strong spatial clustering. Increases are mainly concentrated in northern hilly–gully areas and parts of southern Shaanxi, driven by ecological restoration programs such as the Grain for Green Project and natural forest protection. In contrast, decreases are concentrated in rapidly urbanizing areas of the Guanzhong urban agglomeration, where the expansion of construction land has replaced cropland and forest, leading to substantial carbon loss. Cities including Yulin, Yan’an, Hanzhong, and Ankang show continuous increases due to ongoing vegetation restoration and ecological protection efforts.
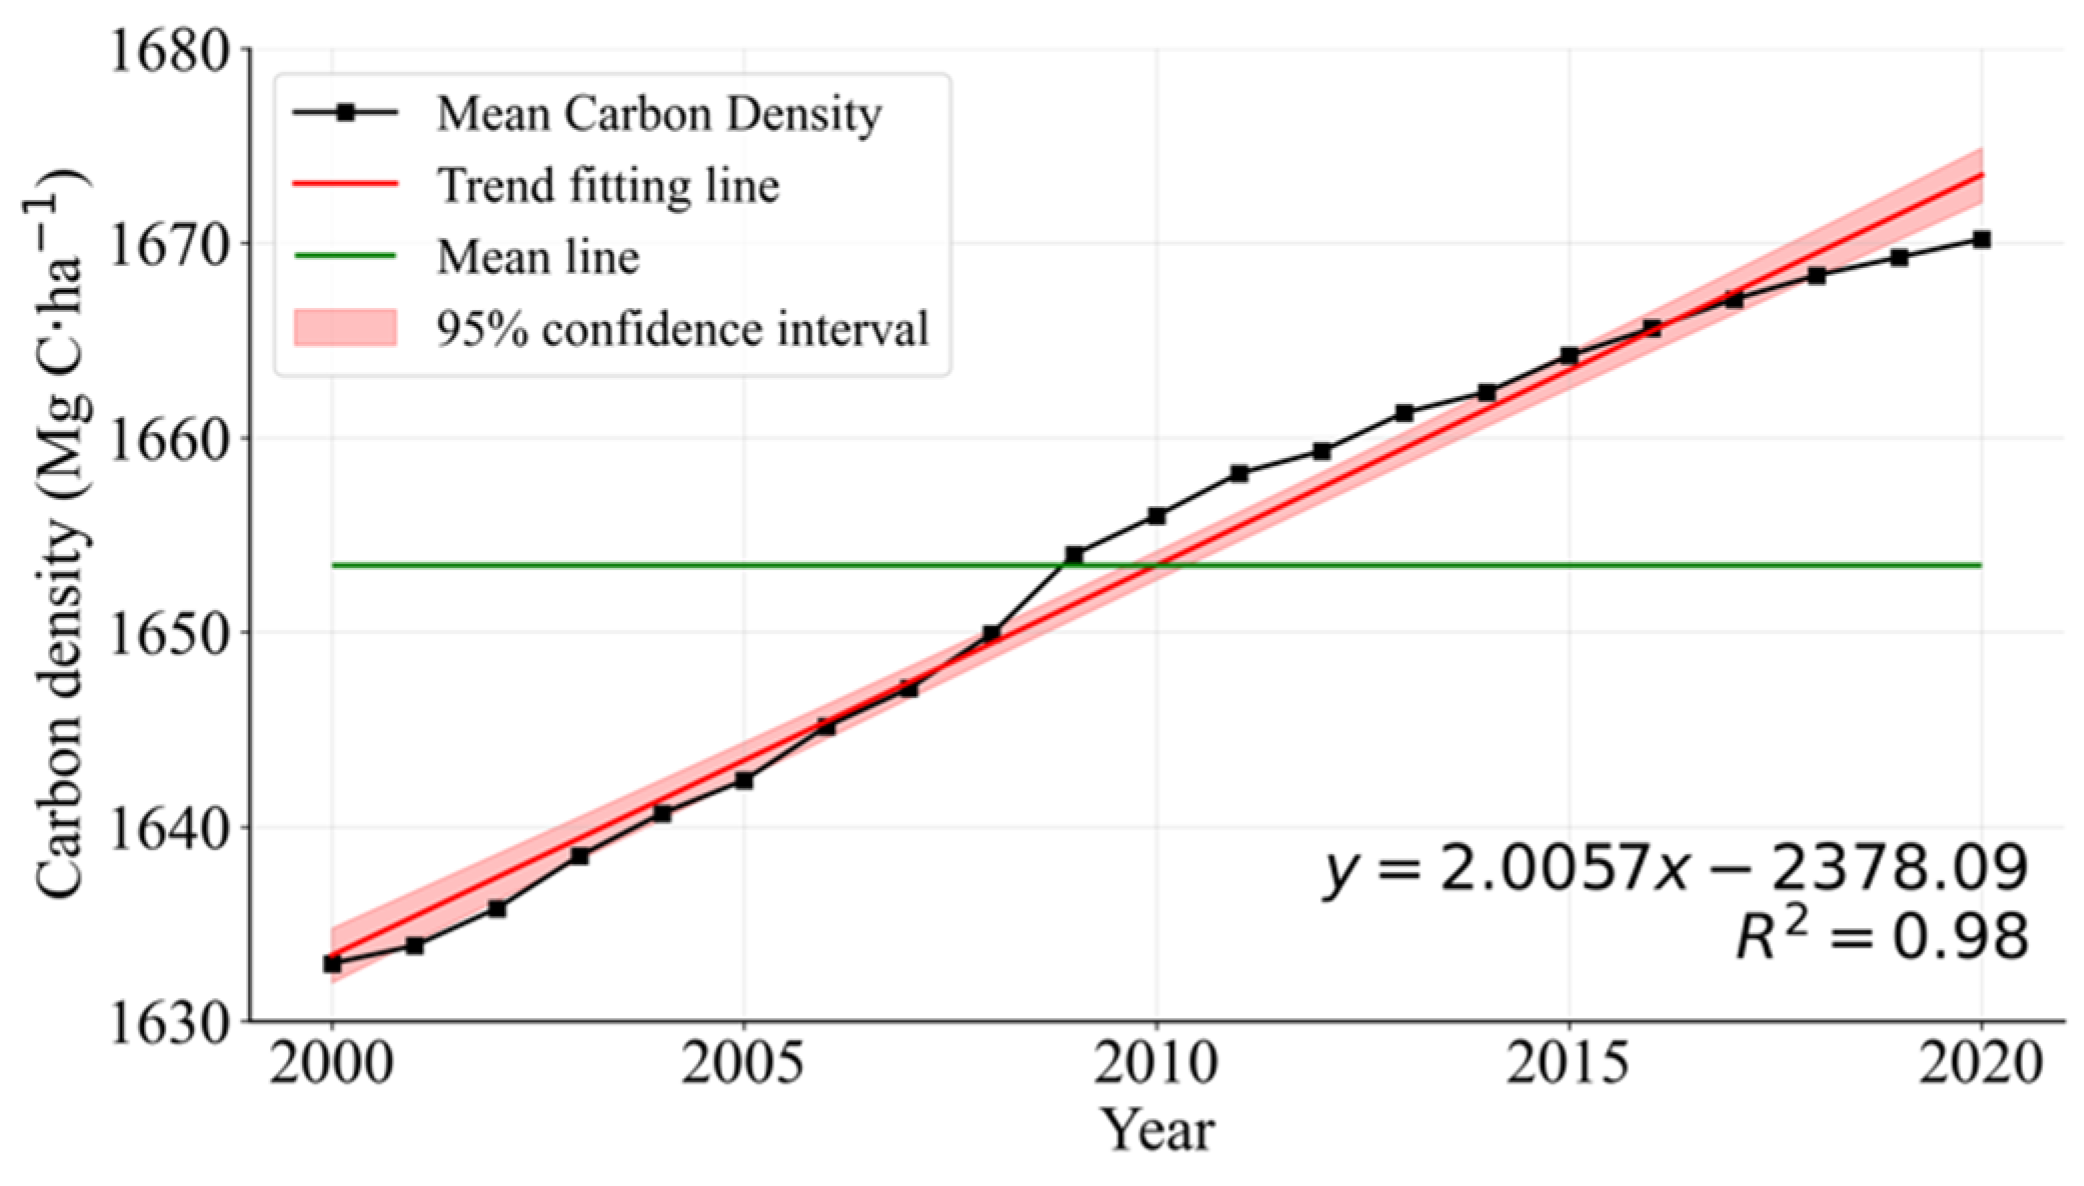
The significant increase in carbon density observed from 2000 to 2020 indicates that ecosystem carbon storage in Shaanxi Province has steadily improved during the study period (Figure 8). Linear regression analysis further supports this trend, showing that carbon density increased at a rate of 2.0057 Mg C·ha−1 per year, with an R2 value of 0.98, suggesting that 98% of the interannual variation can be explained by the linear trend. Carbon density rose from approximately 1632 Mg C·ha−1 in 2000 to about 1670 Mg C·ha−1 in 2020, highlighting a consistent and robust upward trajectory. The mean carbon density remained relatively stable around 1653 Mg C·ha−1, and the narrow width of the 95% confidence interval further indicates low temporal variability and high trend stability. Using the carbon module of the InVEST model, the total carbon storage in Shaanxi Province was calculated as 29,668.90 × 106 Mg C in 2000, 29,840.08 × 106 Mg C in 2005, 30,087.13 × 106 Mg C in 2010, 30,236.67 × 106 Mg C in 2015, and 30,345.45 × 106 Mg C in 2020. Overall, carbon storage exhibited a steadily increasing trend during the 20-year period, reflecting the cumulative effects of ecological restoration programs and improvements in vegetation cover across the province.

3.3. Contributions and Interactions of Driving Factors on Carbon Storage

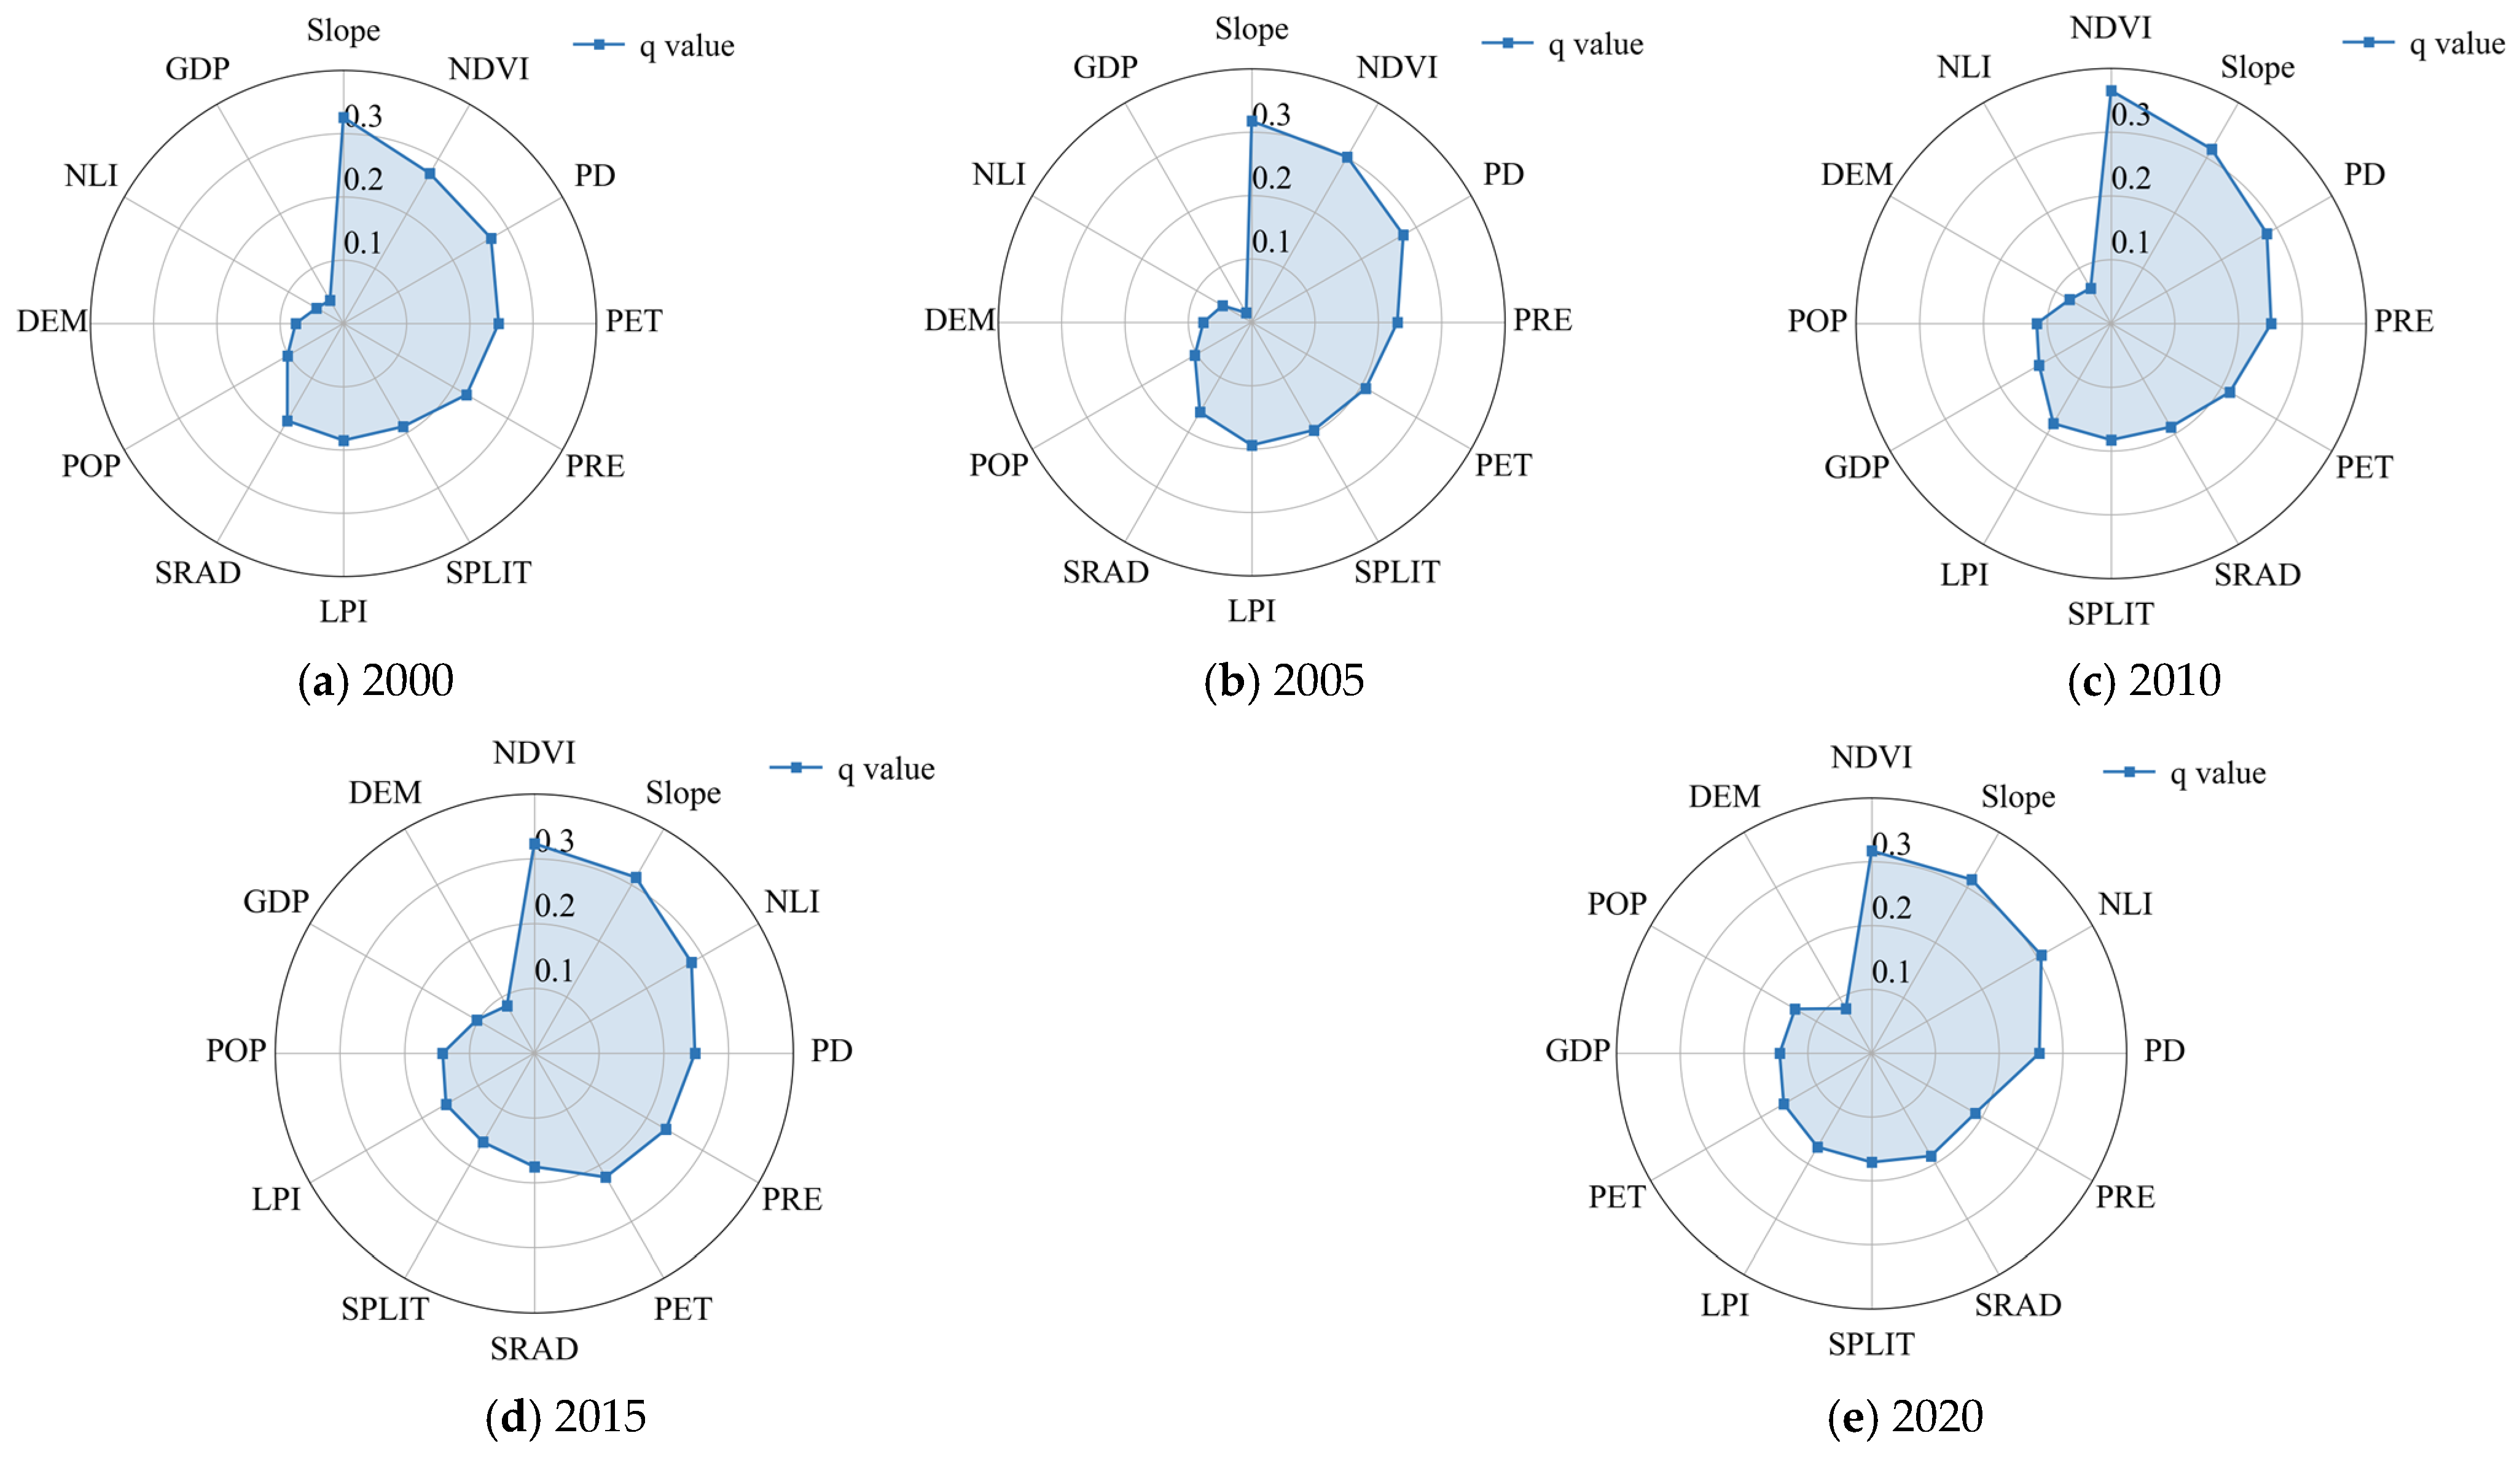
Based on the single-factor q values across different years (Table 4) and their corresponding radar chart patterns (Figure 9), the spatial determinants of carbon storage in Shaanxi Province remained generally stable from 2000 to 2020. Natural environmental factors consistently exhibited the strongest explanatory power and served as the primary drivers of the spatial distribution of carbon storage, with slope and NDVI maintaining the highest q values (approximately 0.3) across all years. Among the climate factors, PET, PRE, and SRAD demonstrated relatively stable and moderately high explanatory power. In contrast, human activity factors—including population density (POP), GDP, and nighttime light index (NLI)—showed lower q values overall but exhibited a clear increasing trend. Notably, the q value of NLI increased substantially from 0.049 to 0.307, indicating that accelerated urbanization has progressively strengthened the influence of human activities on the spatial configuration of carbon storage. Landscape factors displayed the smallest interannual variation, maintaining consistently low yet stable q values, suggesting that their direct effects on carbon storage are limited, while their influence is primarily exerted through long-term and persistent ecological structural processes.
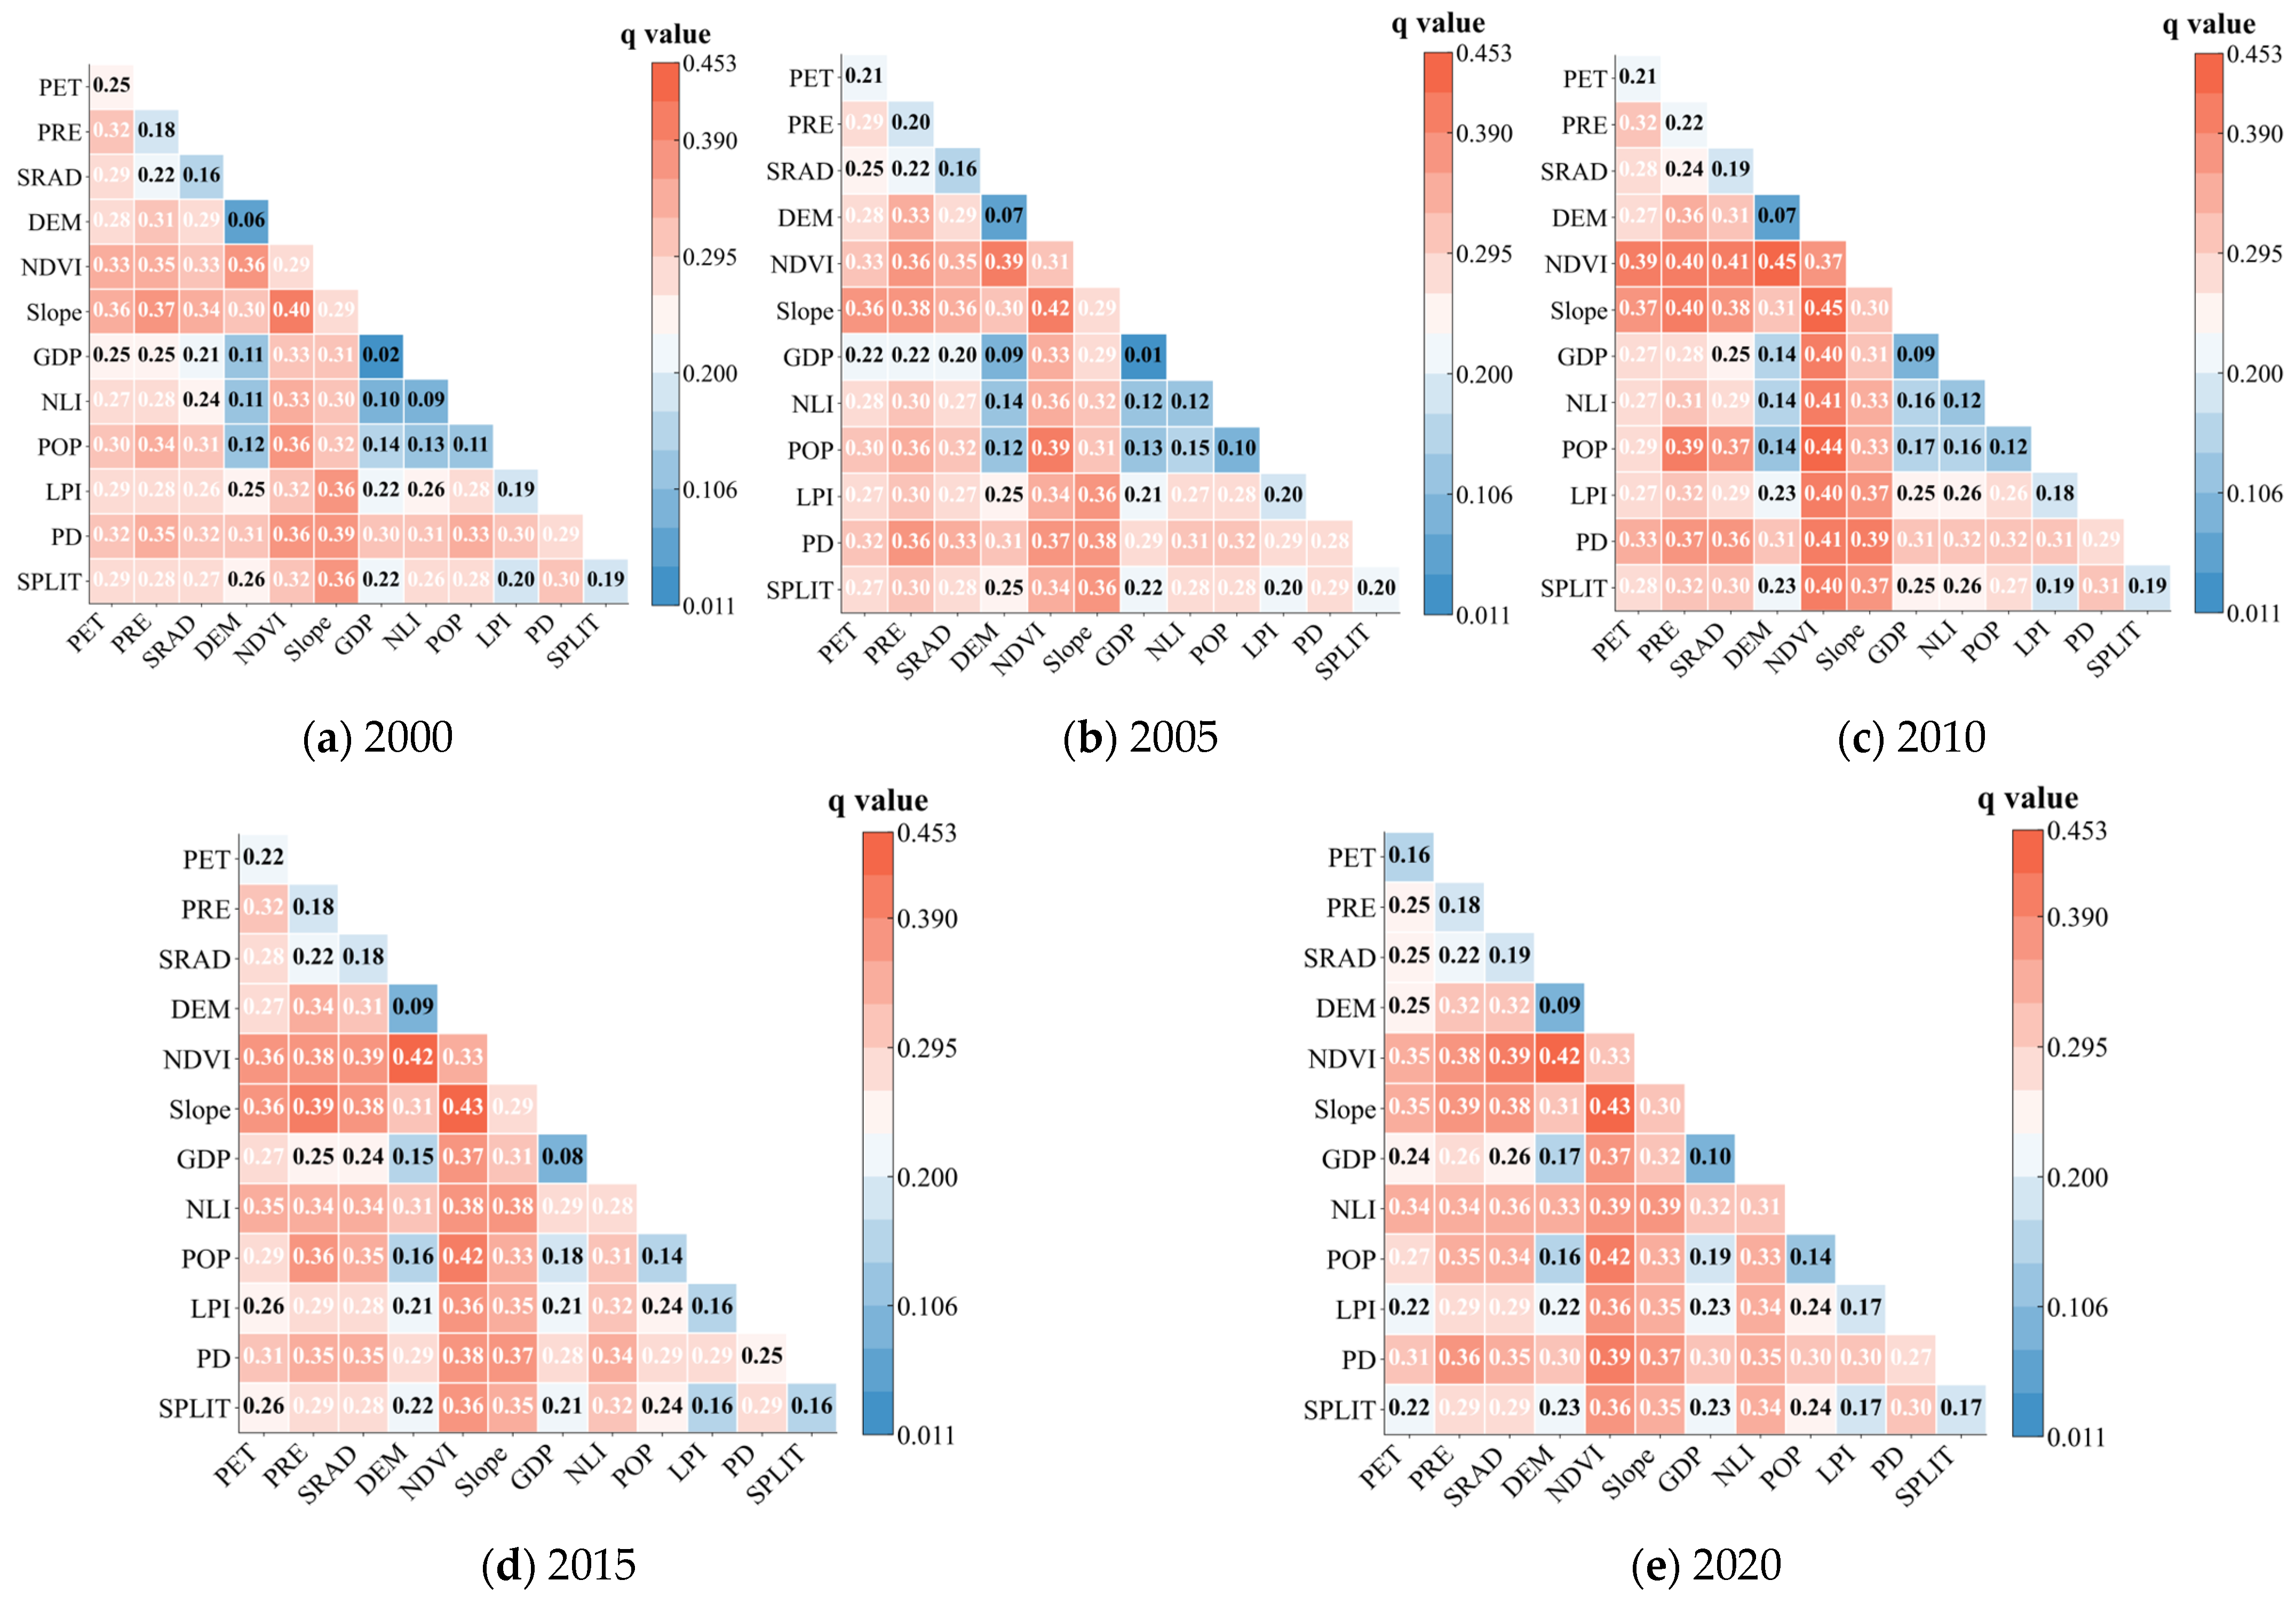
The spatial pattern of carbon storage is influenced not only by individual factors but also—more importantly—by the combined effects of multiple drivers. When two or more factors act simultaneously, their impacts typically exhibit “bivariate enhancement” or “nonlinear enhancement,” with explanatory power that exceeds that of any single factor. Across all years, interaction terms involving slope (Slope), NDVI, and patch density (PD) show the most prominent effects, with interaction q-values consistently remaining above 0.29. Notably, combinations such as Slope × NDVI, POP × NDVI, and NDVI × DEM produce the highest interaction q-values (all > 0.42). Moreover, although factors such as GDP, DEM, and population density exhibit relatively low individual explanatory power, their interactions with other factors can account for more than 30% of the spatial variation in carbon storage (Figure 10). This highlights the substantial role of factor interactions in amplifying the spatial heterogeneity of carbon storage. Therefore, assessments of carbon-storage distribution should consider not only the effects of individual drivers but also the integrated and synergistic impacts arising from multi-factor interactions.

3.4. Measurement Model Evaluation Based on PLS-SEM

Based on the evaluation of the measurement model, all latent variables in this study exhibit good reliability and validity across the five examined years (2000–2020). As shown in Table 5, the factor loadings of the observed indicators exceed the recommended threshold of 0.70 (except for DEM), indicating that each indicator effectively reflects its corresponding latent construct. In addition, the composite reliability values (ρa) for all latent variables are above 0.70 and mostly exceed 0.80, demonstrating strong internal consistency. In terms of convergent validity, the average variance extracted (AVE) for all latent variables in each year is greater than 0.50, confirming adequate convergent validity of the measurement model.

3.5. Structural Model Evaluation Based on PLS-SEM

In this study, all variance inflation factor (VIF) values are below 5, indicating the absence of multicollinearity and suggesting that the correlations among the latent factors remain within an acceptable range. Direct effects were estimated using the PLS-SEM algorithm to obtain standardized path coefficients, while indirect effects were evaluated through the bootstrapping procedure to ensure robust estimation of mediating relationships. In addition, all path coefficients exhibit p-values below 0.01, confirming that the structural relationships in the model are statistically significant at a high confidence level.
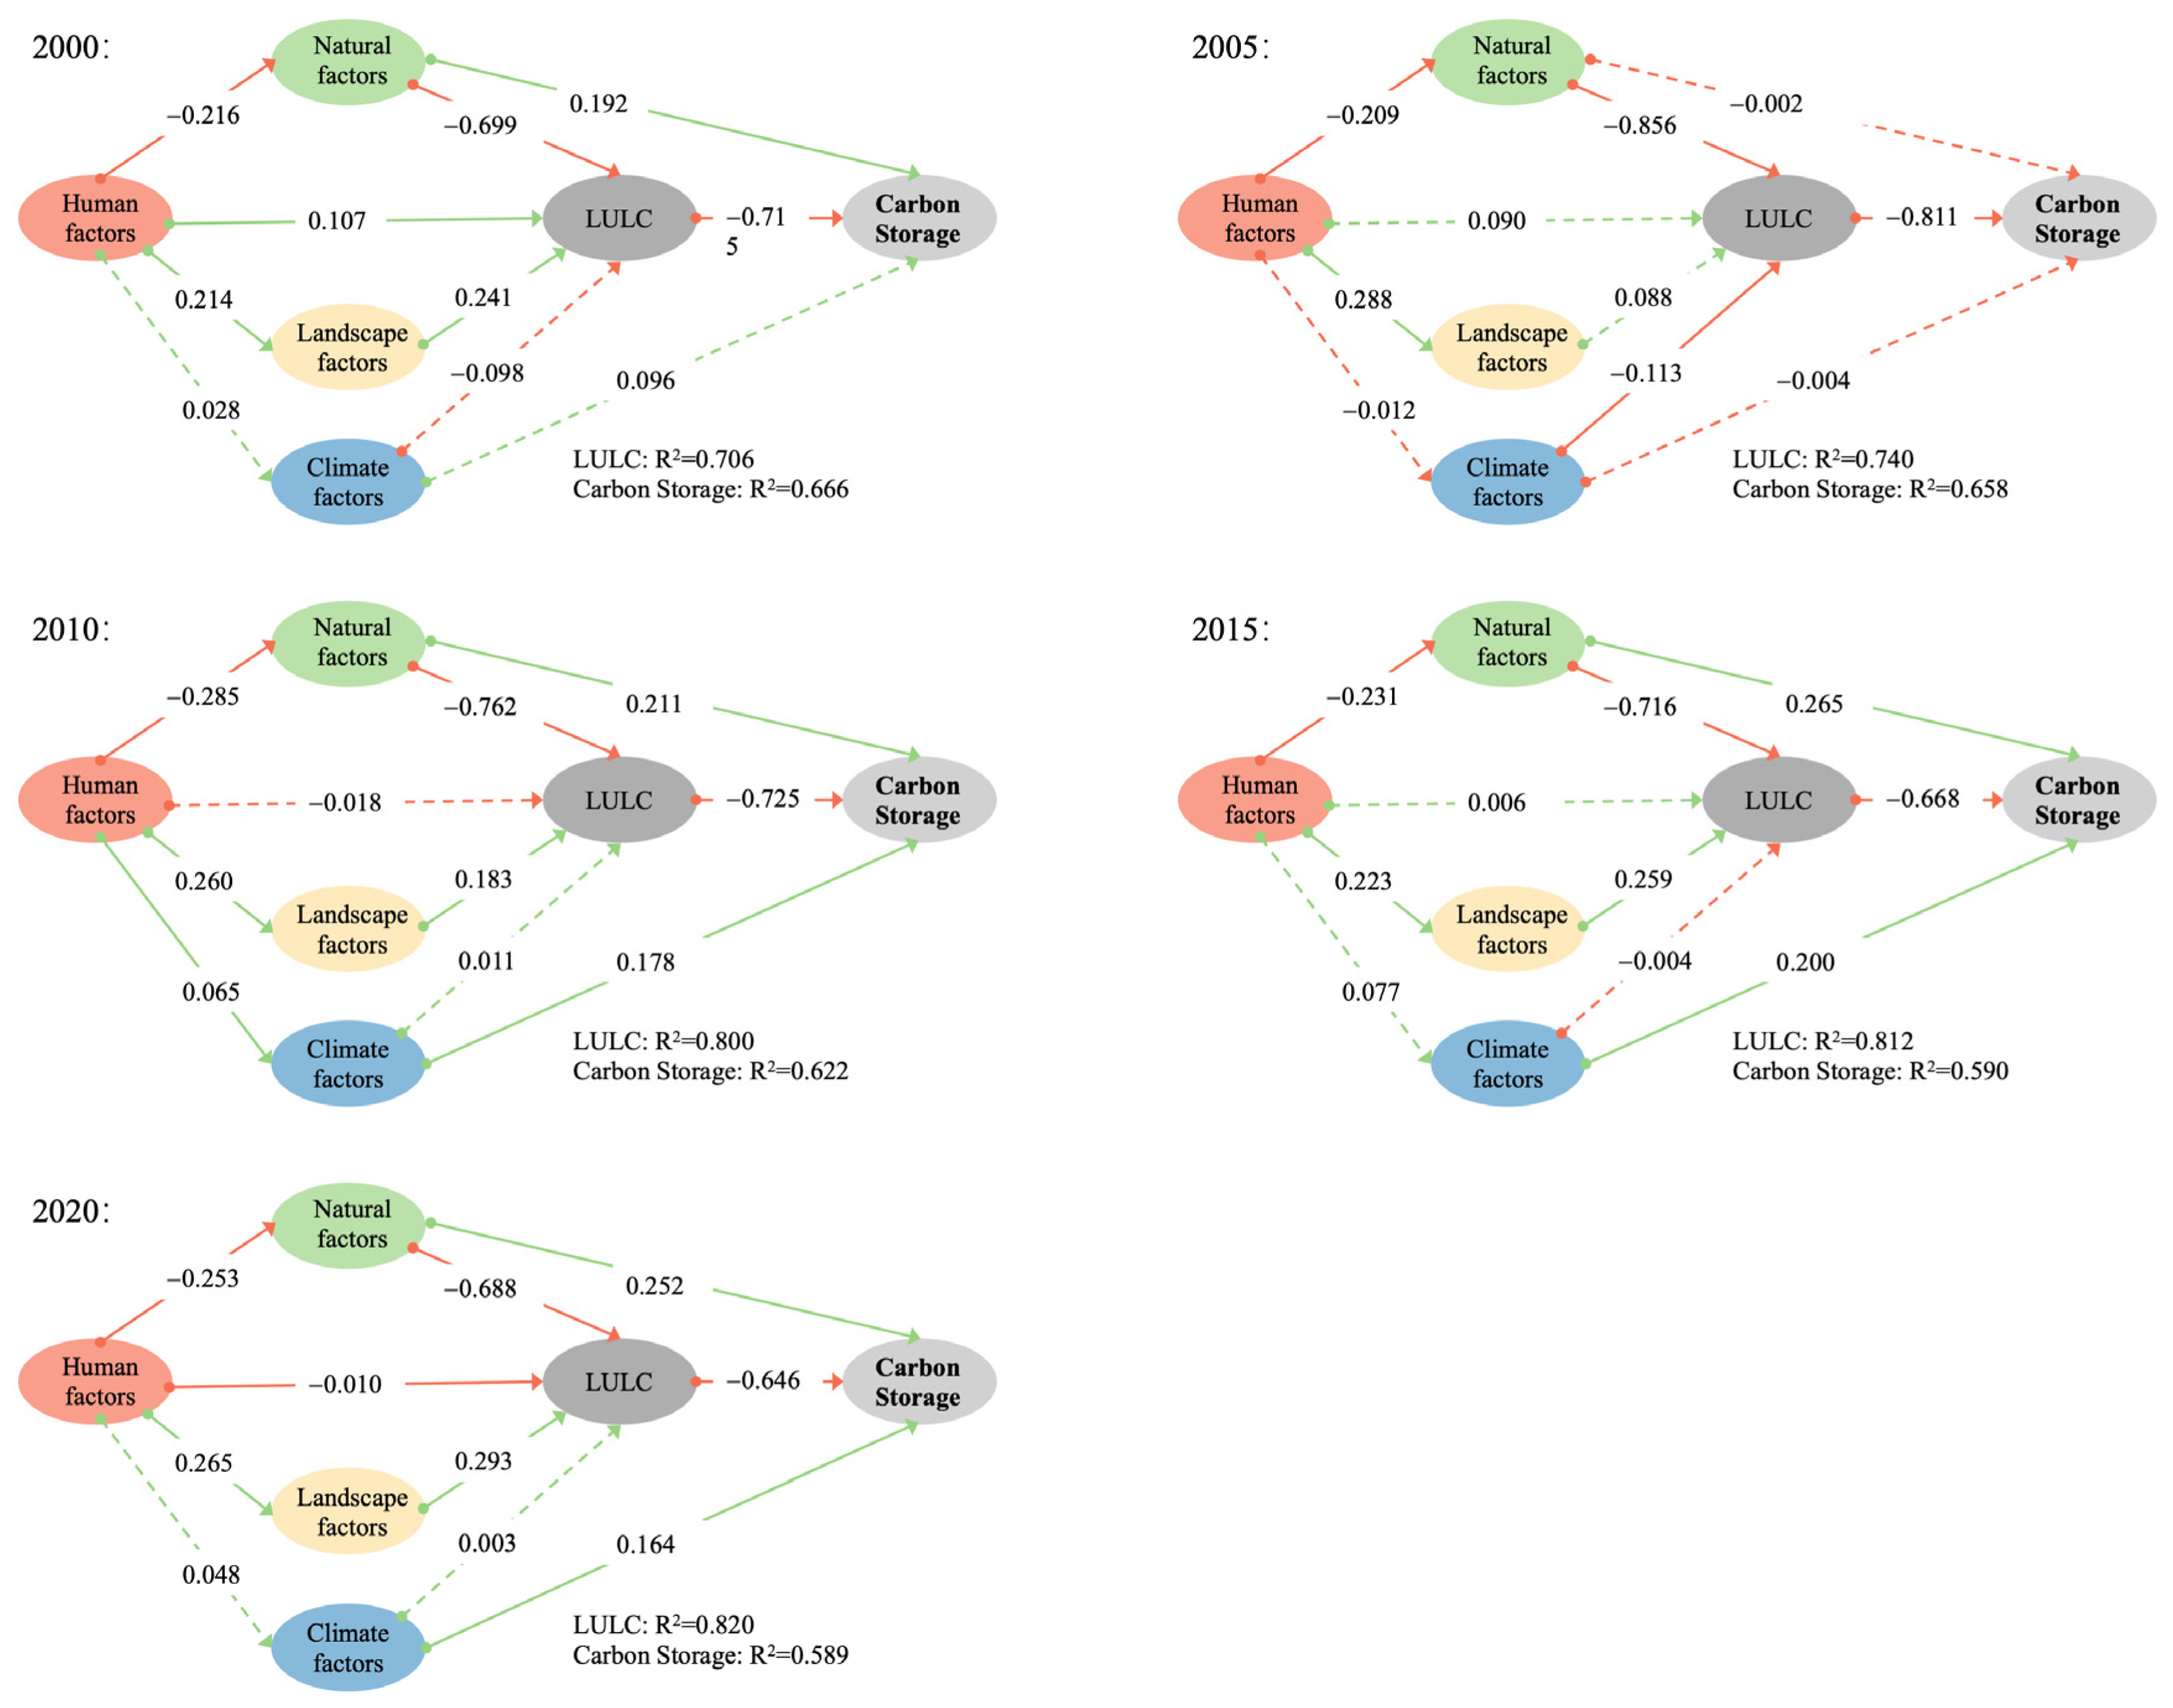
The PLS-SEM results indicate that the direct effects of different driving factors on LULC vary substantially across the five study periods. The path coefficients of natural factors range from −0.688 to −0.856, representing the largest absolute values among all factors. The path coefficients of human factors fall within −0.01 to 0.107, while those of landscape factors range from −0.088 to 0.259. Climate factors show relatively small direct effects, with path coefficients between −0.113 and 0.011. Regarding the direct effects on carbon storage, LULC exhibits the strongest negative influence, with path coefficients ranging from −0.646 to −0.811. Natural factors show direct path coefficients between −0.002 and 0.265, whereas the direct effects of landscape, human, and climate factors are minimal and not significant in some years (Figure 11). In terms of indirect effects on carbon storage, natural factors show the largest indirect influence, with values ranging from 0.444 to 0.694 across the five periods. The indirect effects of human factors range from −0.199 to −0.258, while those of landscape factors range from −0.072 to −0.189. Climate factors exhibit the smallest indirect effects, ranging from −0.008 to 0.092. The explanatory power (R2) for LULC ranges from 0.670 to 0.819 between 2000 and 2020, indicating that the model accounts for 67.0–81.9% of the variation in LULC (Table 6). For carbon storage, the R2 values range from 0.589 to 0.667, suggesting that the model explains 58.9–66.7% of the variation in carbon storage.

4. Discussion

4.1. Discussion of Dominant Pathways

This study identified three dominant pathways through which natural, human, and landscape factors influence carbon storage dynamics in Shaanxi Province via LULC transitions.
The findings from Section 3.1 and Section 3.2 indicate that significant transitions among different LULC types occurred in Shaanxi Province between 2000 and 2020, which have important implications for regional carbon storage dynamics. Different LULC types exhibit distinct carbon sequestration storage. Increases in forest land and grassland may enhance carbon storage, whereas the expansion of construction land tends to reduce carbon storage. Although ecological restoration policies such as the Grain for Green Program have promoted the conversion of cultivated land to forest and grass land in northern Shaanxi, contributing to increased carbon storage, rapid economic development has driven the expansion of construction land in the Guanzhong Plain and urban areas of northern Shaanxi, partially offsetting the carbon sequestration benefits of restoration and resulting in an overall negative effect of LULC on carbon storage, while forest ecosystems in the Qinling Mountains have remained relatively stable. These patterns highlight the role of land-use change in shaping terrestrial carbon sinks and are consistent with China’s climate mitigation strategies aimed at enhancing land-based carbon sequestration, thereby contributing to the achievement of national climate commitments, including the Nationally Determined Contributions (NDCs).
Natural factors provide the fundamental constraints shaping LULC and play a decisive role in LULC transitions. Slope and NDVI showed relatively high explanatory power among the natural factors. Steeper slopes limit land development [43] and help maintain high-carbon ecosystems such as forests and grassland [44], while higher NDVI values reflect greater vegetation productivity and directly enhance carbon sink capacity [45]. However, these effects vary spatially depending on regional topographic and environmental conditions, highlighting the need for region-specific interpretation in Shaanxi Province. Shaanxi Province exhibits pronounced topographic and climate heterogeneity, with a clear north–south differentiation pattern, and is mainly composed of the Loess Plateau, Guanzhong Plain, and Qinling Mountains. The Loess Plateau is dominated by hilly and gully landforms, featuring strong topographic relief, fragile ecosystems, and severe soil erosion. Under these natural constraints, intensive agricultural use entails high ecological risks, while conversion to built-up land is strongly restricted by terrain conditions, engineering costs, and geological stability, causing LULC transitions in this region to be largely governed by natural factors. In contrast, although the Guanzhong Plain is characterized by flat terrain and significantly lower elevation and slope than the Loess Plateau and Qinling Mountains, resulting in weaker natural constraints and favorable conditions for intensive human activities and land development, its area is only about 3.9 × 10⁴ km2, accounting for approximately 19% of Shaanxi Province, which limits its overall natural influence at the provincial scale. Located in southern Shaanxi, the Qinling Mountains form a major climate boundary between northern and southern China and are dominated by steep mountainous terrain, with an average slope of about 22°, significantly higher than that of the Loess Plateau and Guanzhong Plain (10–11°). The complex topographic conditions substantially increase land development costs, creating natural constraints on large-scale LULC conversion and causing LULC change in this region to be predominantly governed by natural factors. Overall, during 2000–2020, the pronounced natural background heterogeneity across Shaanxi Province strongly constrained LULC transitions at the provincial scale, thereby reinforcing the dominant role of natural factors in shaping the observed LULC pathways.
Human factors significantly affect carbon storage through LULC transitions. In this study, the explanatory power of GDP, POP, and NLI increased continuously over the study period, especially NLI, whose q value rose from 0.049 to 0.307, indicating the strengthening influence of human activity intensity on LULC change [46]. However, the PLS-SEM results did not show a strong direct response of LULC to these socioeconomic factors. This pattern may reflect the spatial heterogeneity of human-driven land-use changes, with urban expansion mainly concentrated in the Guanzhong Plain, as well as the influence of ecological restoration policies such as the Grain for Green Program, which may partially mask the direct effects of socioeconomic drivers on LULC. Economic growth promotes urban expansion by driving industrial development and infrastructure demand. A 10% increase in GDP is associated with an average 3% increase in urban built-up area, highlighting the strong effect of economic development on urban growth [47]. Population growth further increases demand for residential, transportation, and public service land [48]. Meanwhile, NLI serves as an effective remote sensing proxy for human activity intensity and urbanization, capturing urban expansion and economic agglomeration processes [49]. During the study period, Shaanxi Province underwent rapid economic growth and population expansion, with GDP rising from 148.76 billion CNY to 2618.19 billion CNY (approximately 17.6-fold) and the permanent population increasing from 36.44 million to 39.53 million, reflecting accelerated urbanization. Driven by economic expansion and population growth, urban infrastructure development, industrial park expansion, and residential land demand increased substantially, directly promoting the expansion of construction land from about 686.5 km2 to 1948.7 km2, with a net increase of 1262.20 km2 (183.85%), reflecting rapid urban expansion. This expansion primarily occurred through the conversion of surrounding cropland and forest/grassland, which accelerated the transition of the regional LULC structure from an agriculture- to an urban construction-dominated pattern and constituted a key anthropogenic driving mechanism of LULC change at the provincial scale. These findings have clear policy relevance. Urban expansion may weaken carbon sequestration capacity, whereas ecological restoration enhances carbon sinks. Within China’s climate policy framework, including the national emissions trading system (ETS), strengthening land-based carbon sinks can support mitigation efforts.
Regarding landscape factors, landscape structure plays an important role in carbon storage dynamics by influencing the spatial configuration of LULC. Higher values of the LPI generally indicate stronger dominance of a particular LULC and greater landscape integrity, whereas higher PD and SPLIT values reflect increased landscape fragmentation, which reduces ecosystem stability and connectivity. Increased landscape fragmentation can alter the internal flows of matter and energy within ecosystems and weaken the continuity of high-carbon-density patches such as forest and grass, thereby exerting an important influence on regional carbon storage [50]. Therefore, variations in landscape patterns may affect the spatial distribution of carbon storage by regulating the spatial structure of LULC and ecosystem connectivity.
In recent years, policy interventions have been widely recognized as one of the key institutional drivers of LULC [51]. In China, ecological restoration policies such as the Grain for Green Program and the Natural Forest Protection Program have significantly promoted the conversion of cropland to forest and grassland, reduced natural forest logging, enhanced regional carbon sequestration, and reshaped LULC structure and landscape patterns [52]. Since the implementation of ecological conservation programs centered on the Grain for Green Project in 1998, policies have primarily targeted the severely eroded areas of the northern Loess Plateau, where strict regulation of sloping cropland and ecologically fragile zones has gradually converted high-erosion-risk and low-productivity cropland into forest and grassland [53]. From 2001 to 2020, driven by the Grain for Green Program, vegetation coverage on the Loess Plateau increased significantly, with an average annual growth rate of approximately 0.8%. About 90% of the region showed increasing trends, of which 71% exhibited significant growth, mainly concentrated in the loess hilly and sandy hilly areas, highlighting the substantial effects of ecological restoration on land cover restructuring [54]. From 1987 to 2018, the mean NDVI in the Qin Mountains increased from approximately 0.62 to 0.78, with a clear turning point around 2006, followed by a stable, accelerated growth phase [55]. Considering the lagged response of vegetation recovery to afforestation activities, this shift is highly consistent with the large-scale implementation of ecological restoration programs, such as the Grain for Green Project initiated in 1998. These results indicate that policy-driven human activities have jointly accelerated the restructuring of regional land-use patterns through afforestation programs and LULC conversion processes. From a policy perspective, such land-based carbon sequestration can be considered a potential mitigation pathway within the LULUCF sector, as it enhances long-term carbon storage through vegetation and soil pools. Although this study does not explicitly assess such mechanisms, the results provide useful insights into their potential role in climate mitigation.

4.2. Discussion of Constrained Pathways

At the global scale, studies show that climate change influences ecosystem processes by altering key factors such as temperature and precipitation, indirectly drives LULC change by reshaping land suitability, and serves as an important environmental driver of terrestrial carbon storage dynamics [14,56]. In addition, studies in China show that climate change from 1961 to 2005 significantly weakened the terrestrial carbon sink, which limited the continuous increase in carbon storage [57]. Therefore, including climate factors in the analysis framework of LULC change and carbon storage drivers is of great theoretical importance. However, the PLS-SEM results show that the direct effect of climate factors on LULC is much weaker than that of other drivers. The path coefficients to LULC are only 0.003–0.113, far lower than those of natural factors (>0.68) and landscape factors (0.18–0.29), indicating that climate factors have limited direct explanatory power for LULC spatial variation at the study scale. Combined with findings from regional studies, research in the Loess Plateau over about 20 years shows that, although the climate became warmer and drier, LULC was mainly driven by policy interventions and institutional reforms [58]. Similarly, studies in the Qinling Mountains indicate that, in low-altitude areas, afforestation projects and human activities have gradually replaced climate factors as the main drivers of NDVI change, while hydrothermal conditions remain important only at high altitudes [55]. These results together indicate that, at short temporal and regional scales, although climate factors strongly affect ecological processes, their direct influence on LULC is relatively weaker than that of policy regulation and human activities, which respond more rapidly. These findings also have important implications for long-term climate mitigation. While climate factors shape ecological processes, sustained carbon sequestration largely depends on land-use management and ecological restoration, highlighting the role of land-based carbon sinks in supporting long-term mitigation strategies within broader climate policy frameworks.

4.3. Integrated Mechanism and Methodological Implications

The findings from Section 3.1 and Section 3.2 indicate that carbon storage dynamics in Shaanxi are not dominated by a single driving factor but are shaped by a hierarchical and path-dependent causal structure formed through the combined effects of natural constraints, human activities, and policy interventions via LULC transitions. At the upper level of the hierarchy, natural factors serve as stable spatial constraints that define the feasible range of LULC transitions. In the Loess Plateau and Qinling Mountains, complex terrain and high ecological vulnerability restrict large-scale LULC conversion, so natural factors mainly act as spatial constraints rather than direct drivers. Under natural constraints, human activities and policies act as a selection mechanism that shapes LULC pathways. In the Guanzhong Plain, urbanization and economic growth have driven built-up land expansion, whereas in ecologically vulnerable regions, ecological restoration policies have shifted land use toward forest and grassland recovery, locking land systems into high-carbon pathways. Although climate factors are widely recognized as important drivers of ecosystem processes, their direct influence on LULC transitions is limited at the spatial and temporal scales examined in this study. The relatively weak path coefficients identified by the PLS-SEM analysis indicate that climate plays a weaker role than policy and socioeconomic drivers in shaping LULC patterns, instead affecting carbon storage mainly through indirect impacts on vegetation productivity. From a broader perspective, carbon storage also provides an important context for understanding climate policy under evolving international carbon markets. In recent years, global carbon trading systems have expanded, and potential linkages among regional carbon markets have attracted increasing attention. In this context, land-based carbon sequestration may play a role not only within China’s carbon market but also within a broader international carbon market framework, such as the European Union Emissions Trading System (EU ETS). Previous studies suggest that long-term economic convergence and climate policy coordination may facilitate stronger interactions among regional carbon markets [59]. Therefore, research on LULC and its impacts on carbon storage can provide valuable insights into the role of terrestrial carbon storage in climate policy and its potential relevance within international carbon markets. Overall, carbon storage growth in Shaanxi reflects the alignment between natural constraints and policy-driven LULC strategies rather than spontaneous ecosystem recovery. Ecological restoration policies are most effective when implemented in areas unsuitable for intensive human use, where they help reduce LULC conflicts while enhancing carbon sink potential. This hierarchical and path-dependent framework provides broader insights for land-based climate mitigation strategies, highlighting that policy design should align with regional biophysical constraints rather than attempt to override them.

5. Conclusions

In this study, the spatiotemporal patterns of carbon storage and its driving mechanisms in Shaanxi Province from 2000 to 2020 were analyzed by integrating the InVEST model with OPGD and PLS-SEM in order to explore how driving factors influence carbon storage through LULC. In this framework, the InVEST model quantified carbon storage dynamics, OPGD evaluated the explanatory power and interaction effects of multiple drivers, and PLS-SEM was used to reveal hierarchical pathways among climate, natural, human, and landscape factors. The results indicate that carbon storage dynamics in Shaanxi Province follow a hierarchical coupling mechanism, in which policy-related factors within human activities play a dominant role in shaping LULC pathways, while natural environmental conditions act as stable spatial constraints that define the feasible range of LULC transitions. In contrast, although climate factors exert important influences on ecosystem processes, their direct driving effects on LULC change remain relatively limited at the spatial scale examined in this study, mainly affecting carbon storage indirectly through ecological processes.
Therefore, future carbon sequestration and ecological restoration policies should adopt spatially differentiated, region-specific LULC strategies that align with natural constraints, balancing urban LULC efficiency in plains with ecological restoration priorities in mountainous and plateau regions. These findings also have important implications for climate policy. By clarifying how land-use change and LULC transitions regulate ecosystem carbon storage, this study provides empirical support for the role of land-based carbon sinks in China’s climate mitigation framework, particularly under the NDC targets. Enhancing carbon sequestration through policy-guided land-use transitions can contribute to achieving long-term emission reduction goals. In urbanizing plains, stricter controls on built-up land expansion and improved efficiency of existing land use are needed to reduce carbon sink losses, whereas in ecologically fragile mountainous and plateau regions, ecological restoration and vegetation recovery should be prioritized to reinforce high-carbon LULC pathways. By embedding policy interventions into existing LULC trajectories and aligning them with regional natural constraints, carbon sequestration efficiency can be enhanced while structural LULC conflicts are mitigated. However, the detailed design of specific policy instruments is beyond the scope of this study and would require further socioeconomic and institutional analyses.
The results indicate the need to further examine differences in carbon storage drivers across cities and regional types in Shaanxi Province. Substantial internal heterogeneity may also exist within regions such as the Loess Plateau due to differences in geomorphological units (e.g., plateaus, ridges, and mounds). The InVEST model assumes constant carbon density for each land-use type, which may not fully capture temporal variations in carbon density. In addition, the carbon accounting framework used in this study focuses on ecosystem carbon pools estimated by the InVEST model and does not include carbon stored in harvested wood products (HWPs), which may represent an important component of long-term carbon storage. In regions where forest harvesting and timber utilization are significant, excluding HWPs may lead to an underestimation of total carbon storage, as a portion of carbon is retained in wood products rather than being immediately released, thereby influencing the interpretation of carbon storage patterns. As this study focuses on Shaanxi Province, the findings mainly reflect regional characteristics and may not be directly generalizable to regions with different ecological or socioeconomic conditions. Given the substantial heterogeneity in natural, socioeconomic, and policy conditions, future studies should also apply classification-based analyses across geomorphological zones, development levels, and LULC structures to identify key drivers and pathways. Clarifying spatial heterogeneity and LULC trajectories will support more targeted carbon sink management and differentiated LULC policies. Finally, future studies could explore nonlinear mechanisms and regional heterogeneity through more detailed regional classifications and local-scale analyses.

Author Contributions

Conceptualization, Y.W.; methodology, Y.W.; software, Y.W.; validation, Y.W.; formal analysis, Y.W. and K.H.; investigation, Y.W.; resources, Y.W.; data curation, Y.W.; writing—original draft preparation, Y.W.; writing—review and editing, K.H. and Y.W.; visualization, Y.W.; supervision, K.H.; project administration, Y.W.; funding acquisition, Y.W. All authors have read and agreed to the published version of the manuscript.

Funding

This work was supported by JST SPRING, Japan Grant Number JPMJSP2136.

Data Availability Statement

The land use/land cover (LULC) Data used in this study are publicly available at https://zenodo.org/records/5210928 (accessed on 1 July 2025). The climate, natural, and human-related variables were obtained from publicly available datasets through the Google Earth Engine (GEE) platform (https://earthengine.google.com/).

Acknowledgments

The authors would like to thank the members of the research laboratory from the Graduate School of Integrated Sciences for Global Society (ISGS) for their helpful discussions and support during this study.

Conflicts of Interest

The authors declare no conflicts of interest.

References

  1. Heimann, M.; Reichstein, M. Terrestrial Ecosystem Carbon Dynamics and Climate Feedbacks. Nature 2008, 451, 289–292. [Google Scholar] [CrossRef] [PubMed]
  2. Intergovernmental Panel on Climate Change. IPCC Climate Change and Land: An IPCC Special Report on Climate Change, Desertification, Land Degradation, Sustainable Land Management, Food Security, and Greenhouse Gas Fluxes in Terrestrial Ecosystems; Intergovernmental Panel on Climate Change: Geneva, Switzerland, 2019. [Google Scholar]
  3. Stocker, T.F.; Qin, D.; Plattner, G.-K.; Tignor, M.; Allen, S.K.; Boschung, J.; Nauels, A.; Xia, Y.; Bex, V.; Midgley, P.M.; et al. (Eds.) Climate Change 2013: The Physical Science Basis: Contribution of Working Group I to the Fifth Assessment Report of the Intergovernmental Panel on Climate Change; Cambridge University Press: Cambridge, UK; New York, NY, USA, 2013. [Google Scholar]
  4. Jackson, R.B.; Lajtha, K.; Crow, S.E.; Hugelius, G.; Kramer, M.G.; Piñeiro, G. The Ecology of Soil Carbon: Pools, Vulnerabilities, and Biotic and Abiotic Controls. Annu. Rev. Ecol. Evol. Syst. 2017, 48, 419–445. [Google Scholar] [CrossRef]
  5. Xiang, M.; Wang, C.; Tan, Y.; Yang, J.; Duan, L.; Fang, Y.; Li, W.; Shu, Y.; Liu, M. Spatio-Temporal Evolution and Driving Factors of Carbon Storage in the Western Sichuan Plateau. Sci. Rep. 2022, 12, 8114. [Google Scholar] [CrossRef]
  6. Vizcaíno-Bravo, Q.; Williams-Linera, G.; Asbjornsen, H. Biodiversity and Carbon Storage Are Correlated along a Land Use Intensity Gradient in a Tropical Montane Forest Watershed, Mexico. Basic Appl. Ecol. 2020, 44, 24–34. [Google Scholar] [CrossRef]
  7. Houghton, R.A. Carbon Emissions and the Drivers of Deforestation and Forest Degradation in the Tropics. Curr. Opin. Environ. Sustain. 2012, 4, 597–603. [Google Scholar] [CrossRef]
  8. Zhang, J.; Ding, H.; Xu, J.; Zheng, B. A Simulation-Based Prediction of Land Use Change Impacts on Carbon Storage from a Regional Imbalance Perspective: A Case Study of Hunan Province, China. Land 2024, 13, 1721. [Google Scholar] [CrossRef]
  9. Song, J.; He, X.; Zhang, F.; Ma, X.; Jim, C.Y.; Johnson, B.A.; Chan, N.W. Analyzing and Predicting LUCC and Carbon Storage Changes in Xinjiang’s Arid Ecosystems Under the Carbon Neutrality Goal. Remote Sens. 2024, 16, 4439. [Google Scholar] [CrossRef]
  10. Tian, L.; Tao, Y.; Fu, W.; Li, T.; Ren, F.; Li, M. Dynamic Simulation of Land Use/Cover Change and Assessment of Forest Ecosystem Carbon Storage under Climate Change Scenarios in Guangdong Province, China. Remote Sens. 2022, 14, 2330. [Google Scholar] [CrossRef]
  11. Zhu, Y.; Quan, B. A Muti-Scenario Prediction and Spatiotemporal Analysis of the LUCC and Carbon Storage Response: A Case Study of the Central Shanxi Urban Agglomeration. Sustainability 2025, 17, 1532. [Google Scholar] [CrossRef]
  12. Mottet, A.; Ladet, S.; Coqué, N.; Gibon, A. Agricultural Land-Use Change and Its Drivers in Mountain Landscapes: A Case Study in the Pyrenees. Agric. Ecosyst. Environ. 2006, 114, 296–310. [Google Scholar] [CrossRef]
  13. Deng, Z.; Quan, B. Intensity Characteristics and Multi-Scenario Projection of Land Use and Land Cover Change in Hengyang, China. Int. J. Environ. Res. Public Health 2022, 19, 8491. [Google Scholar] [CrossRef]
  14. Sloat, L.L.; Davis, S.J.; Gerber, J.S.; Moore, F.C.; Ray, D.K.; West, P.C.; Mueller, N.D. Climate Adaptation by Crop Migration. Nat. Commun. 2020, 11, 1243. [Google Scholar] [CrossRef]
  15. Lane, A.; Jarvis, A. Changes in Climate Will Modify the Geography of Crop Suitability. J. Semi-Arid Trop. Agric. Res. 2007, 4, 1–12. [Google Scholar]
  16. Seto, K.C.; Fragkias, M.; Güneralp, B.; Reilly, M.K. A Meta-Analysis of Global Urban Land Expansion. PLoS ONE 2011, 6, e23777. [Google Scholar] [CrossRef]
  17. Chomitz, K.M.; Gray, D.A. Roads, Land Use, and Deforestation: A Spatial Model Applied to Belize. RePEc 1996, 10, 487–512. [Google Scholar] [CrossRef]
  18. Pfaff, A. What Drives Deforestation in the Brazilian Amazon? Evidence from Satellite and Socioeconomic Data. J. Environ. Econ. Manag. 1999, 37, 26–43. [Google Scholar] [CrossRef]
  19. Li, J.; Peng, S.; Li, Z. Detecting and Attributing Vegetation Changes on China’s Loess Plateau. Agric. For. Meteorol. 2017, 247, 260–270. [Google Scholar] [CrossRef]
  20. Zhang, S.; Yang, D.; Yang, Y.; Piao, S.; Yang, H.; Lei, H.; Fu, B. Excessive Afforestation and Soil Drying on China’s Loess Plateau. J. Geophys. Res. Biogeosci. 2018, 123, 923–935. [Google Scholar] [CrossRef]
  21. Pavković, F.; Teslak, K.; Matošević, M.; Beljan, K. Forests and the Economics of Climate Change: A Review of Knowledge, Challenges and Future Directions. Nova Meh. Šumarstva 2025, 46, 53–62. [Google Scholar] [CrossRef]
  22. Zhang, Y.; Wang, Y.; Phillips, N.; Ma, K.; Li, J.; Wang, W. Integrated Maps of Biodiversity in the Qinling Mountains of China for Expanding Protected Areas. Biol. Conserv. 2017, 210, 64–71. [Google Scholar] [CrossRef]
  23. Wu, J.; Luo, J.; Zhang, H.; Qin, S.; Yu, M. Projections of Land Use Change and Habitat Quality Assessment by Coupling Climate Change and Development Patterns. Sci. Total Environ. 2022, 847, 157491. [Google Scholar] [CrossRef] [PubMed]
  24. Wei, X.; Zhang, S.; Luo, P.; Zhang, S.; Wang, H.; Kong, D.; Zhang, Y.; Tang, Y.; Sun, S. A Multi-Scenario Prediction and Spatiotemporal Analysis of the Land Use and Carbon Storage Response in Shaanxi. Remote Sens. 2023, 15, 5036. [Google Scholar] [CrossRef]
  25. Liu, Z.; Wang, D.; Han, L.; Kang, H.; Cao, X. Vegetation Quality Assessment of the Shaanxi Section of the Yellow River Basin Based on NDVI and Rain-Use Efficiency. Land 2025, 14, 166. [Google Scholar] [CrossRef]
  26. Zhang, Y.; Liang, C. Analysis of Annual and Seasonal Precipitation Variation in the Qinba Mountain Area, China. Sci. Rep. 2020, 10, 961. [Google Scholar] [CrossRef]
  27. Cui, G.-Y.; Chen, Y.-M.; Cao, Y.; An, C.-C. China Analysis on carbon stock distribution patterns of forest ecosystems in Shaanxi Province. Chin. J. Plant Ecol. 2015, 39, 333–342. [Google Scholar] [CrossRef]
  28. Blackburn, K.W.; Libohova, Z.; Adhikari, K.; Kome, C.; Maness, X.; Silman, M.R. Influence of Land Use and Topographic Factors on Soil Organic Carbon Stocks and Their Spatial and Vertical Distribution. Remote Sens. 2022, 14, 2846. [Google Scholar] [CrossRef]
  29. Li, C.; Huang, J.; Luo, Y.; Wang, J. Spatial Synergy Between Carbon Storage and Emissions in Coastal China: Insights from PLUS-InVEST and OPGD Models. Remote Sens. 2025, 17, 2859. [Google Scholar] [CrossRef]
  30. Fu, Y.; Huang, M.; Gong, D.; Lin, H.; Fan, Y.; Du, W. Dynamic Simulation and Prediction of Carbon Storage Based on Land Use/Land Cover Change from 2000 to 2040: A Case Study of the Nanchang Urban Agglomeration. Remote Sens. 2023, 15, 4645. [Google Scholar] [CrossRef]
  31. Yang, J.; Huang, X. The 30 m Annual Land Cover Dataset and Its Dynamics in China from 1990 to 2019. Earth Syst. Sci. Data 2021, 13, 3907–3925. [Google Scholar] [CrossRef]
  32. Zafar, Z.; Zubair, M.; Zha, Y.; Mehmood, M.S.; Rehman, A.; Fahd, S.; Nadeem, A.A. Predictive Modeling of Regional Carbon Storage Dynamics in Response to Land Use/Land Cover Changes: An InVEST-Based Analysis. Ecol. Inform. 2024, 82, 102701. [Google Scholar] [CrossRef]
  33. Gong, P.; Wang, J.; Yu, L.; Zhao, Y.; Zhao, Y.; Liang, L.; Niu, Z.; Huang, X.; Fu, H.; Liu, S.; et al. Finer Resolution Observation and Monitoring of Global Land Cover: First Mapping Results with Landsat TM and ETM+ Data. Int. J. Remote Sens. 2013, 34, 2607–2654. [Google Scholar] [CrossRef]
  34. Zhou, X.; Wang, J.; Tang, L.; He, W.; Li, H. Impact of Land Use Change on Carbon Storage Dynamics in the Lijiang River Basin, China: A Complex Network Model Approach. Land 2025, 14, 1042. [Google Scholar] [CrossRef]
  35. Wang, T.; Gong, Z.; Deng, Y. Identification of priority areas for improving quality and efficiency of vegetation carbon sinks in Shaanxi province based on land use change. J. Nat. Resour. 2022, 37, 1214. [Google Scholar] [CrossRef]
  36. Li, Q.; Xia, X.; Kou, X.; Niu, L.; Wan, F.; Zhu, J.; Xiao, W. Forest Carbon Storage and Carbon Sequestration Potential in Shaanxi Province, China. Forests 2023, 14, 2021. [Google Scholar] [CrossRef]
  37. Zhao, X.; Rao, Z.; Lin, J.; Zhang, X. Scenario Forecasting of Carbon Neutrality by Combining the LEAP Model and Future Land-Use Simulation: An Empirical Study of Shenzhen, China. Sustain. Cities Soc. 2025, 125, 106367. [Google Scholar] [CrossRef]
  38. Filippelli, E.; Ahmad, A.; Diolaiuti, G.A.; Senese, A. National-Scale Economic Valuation of Forest Ecosystem Services in Pakistan Using Sentinel-2 Data. Land 2026, 15, 308. [Google Scholar] [CrossRef]
  39. Liang, Y.; Xu, C. Knowledge Diffusion of Geodetector: A Perspective of the Literature Review and Geotree. Heliyon 2023, 9, e19651. [Google Scholar] [CrossRef]
  40. Cheah, J.-H.; Nitzl, C.; Roldán, J.L.; Cepeda-Carrion, G.; Gudergan, S.P. A Primer on the Conditional Mediation Analysis in PLS-SEM. Data Base Adv. Inf. Syst. 2021, 52, 43–100. [Google Scholar] [CrossRef]
  41. Wang, L.; Li, Z.; Xu, Z.; Yue, X.; Yang, L.; Wang, R.; Chen, Y.; Ma, H. Carbon Emission Scenario Simulation and Policy Regulation in Resource-Based Provinces Based on System Dynamics Modeling. J. Clean. Prod. 2024, 460, 142619. [Google Scholar] [CrossRef]
  42. Gao, F.; He, Z. Digital Economy, Land Resource Misallocation and Urban Carbon Emissions in Chinese Resource-Based Cities. Resour. Policy 2024, 91, 104914. [Google Scholar] [CrossRef]
  43. Zhou, L.; Dang, X.; Mu, H.; Wang, B.; Wang, S. Cities Are Going Uphill: Slope Gradient Analysis of Urban Expansion and Its Driving Factors in China. Sci. Total Environ. 2021, 775, 145836. [Google Scholar] [CrossRef] [PubMed]
  44. Patton, N.R.; Lohse, K.A.; Seyfried, M.S.; Godsey, S.E.; Parsons, S.B. Topographic Controls of Soil Organic Carbon on Soil-Mantled Landscapes. Sci. Rep. 2019, 9, 6390. [Google Scholar] [CrossRef] [PubMed]
  45. Pettorelli, N.; Vik, J.O.; Mysterud, A.; Gaillard, J.-M.; Tucker, C.J.; Stenseth, N.C. Using the Satellite-Derived NDVI to Assess Ecological Responses to Environmental Change. Trends Ecol. Evol. 2005, 20, 503–510. [Google Scholar] [CrossRef]
  46. Mu, H.; Li, X.; Wen, Y.; Huang, J.; Du, P.; Su, W.; Miao, S.; Geng, M. A Global Record of Annual Terrestrial Human Footprint Dataset from 2000 to 2018. Sci. Data 2022, 9, 176. [Google Scholar] [CrossRef] [PubMed]
  47. Deng, X.; Huang, J.; Rozelle, S.; Uchida, E. Economic Growth and the Expansion of Urban Land in China. Urban Study 2010, 47, 813–843. [Google Scholar] [CrossRef]
  48. Seto, K.C.; Güneralp, B.; Hutyra, L.R. Global Forecasts of Urban Expansion to 2030 and Direct Impacts on Biodiversity and Carbon Pools. Proc. Natl. Acad. Sci. USA 2012, 109, 16083–16088. [Google Scholar] [CrossRef]
  49. Zhao, M.; Zhou, Y.; Li, X.; Cao, W.; He, C.; Yu, B.; Li, X.; Elvidge, C.D.; Cheng, W.; Zhou, C. Applications of Satellite Remote Sensing of Nighttime Light Observations: Advances, Challenges, and Perspectives. Remote Sens. 2019, 11, 1971. [Google Scholar] [CrossRef]
  50. Hou, Y.; Wang, L.; Li, Z.; Ouyang, X.; Xiao, T.; Wang, H.; Li, W.; Nie, X. Landscape Fragmentation and Regularity Lead to Decreased Carbon Stocks in Basins: Evidence from Century-Scale Research. J. Environ. Manag. 2024, 367, 121937. [Google Scholar] [CrossRef]
  51. Lambin, E.F.; Turner, B.L.; Geist, H.J.; Agbola, S.B.; Angelsen, A.; Bruce, J.W.; Coomes, O.T.; Dirzo, R.; Fischer, G.; Folke, C.; et al. The Causes of Land-Use and Land-Cover Change: Moving beyond the Myths. Glob. Environ. Change 2001, 11, 261–269. [Google Scholar] [CrossRef]
  52. Liu, J.; Li, S.; Ouyang, Z.; Tam, C.; Chen, X. Ecological and Socioeconomic Effects of China’s Policies for Ecosystem Services. Proc. Natl. Acad. Sci. USA 2008, 105, 9477–9482. [Google Scholar] [CrossRef]
  53. Cao, S.; Chen, L.; Yu, X. Impact of China’s Grain for Green Project on the Landscape of Vulnerable Arid and Semi-arid Agricultural Regions: A Case Study in Northern Shaanxi Province. J. Appl. Ecol. 2009, 46, 536–543. [Google Scholar] [CrossRef]
  54. He, J.; He, L.; Lü, D.; Cheng, Z.; Xue, F.; Liu, B.-Y.; Zhang, X.-P. China Spatiotemporal Variation and Its Driving Mechanism of Photosynthetic Vegetation in the Loess Plateau from 2001 to 2020. Chin. J. Plant Ecol. 2023, 47, 306–318. [Google Scholar] [CrossRef]
  55. Huang, C.; Yang, Q.; Guo, Y.; Zhang, Y.; Guo, L. The Pattern, Change and Driven Factors of Vegetation Cover in the Qin Mountains Region. Sci. Rep. 2020, 10, 20591. [Google Scholar] [CrossRef]
  56. Bonan, G.B. Forests and Climate Change: Forcings, Feedbacks, and the Climate Benefits of Forests. Science 2008, 320, 1444–1449. [Google Scholar] [CrossRef] [PubMed]
  57. Tian, H.; Melillo, J.; Lu, C.; Kicklighter, D.; Liu, M.; Ren, W.; Xu, X.; Chen, G.; Zhang, C.; Pan, S.; et al. China’s Terrestrial Carbon Balance: Contributions from Multiple Global Change Factors. Glob. Biogeochem. Cycles 2011, 25, GB1007. [Google Scholar] [CrossRef]
  58. Hageback, J.; Sundberg, J.; Ostwald, M.; Chen, D.; Yun, X.; Knutsson, P. Climate Variability and Land-Use Change in Danangou Watershed, China—Examples of Small-Scale Farmers’ Adaptation. Clim. Chang. 2005, 72, 189–212. [Google Scholar] [CrossRef]
  59. Pei, Q. Climate Change Economics Between Europe and China: Long-Term Economic Development of Divergence and Convergence; Springer: Cham, Switzerland, 2021. [Google Scholar]
Figure 1. Geographical location and DEM of Shaanxi Province.
Land 15 00550 g001
Figure 2. Research framework.
Land 15 00550 g002
Figure 3. The conceptualized model of the driving factors influencing carbon storage in Shaanxi Province.
Land 15 00550 g003
Figure 4. LULC evolution in Shaanxi Province from 2000 to 2020.
Land 15 00550 g004
Figure 5. Annual gain, loss, and net change in different land-use types in Shaanxi Province from 2000 to 2020.
Land 15 00550 g005
Figure 6. Land-use transition matrix and annual transition intensity among six land categories in Shaanxi Province from 2000 to 2020. Modified from [13].
Land 15 00550 g006
Figure 7. Spatiotemporal distribution and change of carbon storage in Shaanxi Province from 2000 to 2020.
Land 15 00550 g007
Figure 8. Trend of carbon density in Shaanxi Province from 2000 to 2020.
Land 15 00550 g008
Figure 9. Relative contribution of natural, human, climate, and landscape factors to land-use dynamics across different land categories in Shaanxi Province from 2000 to 2020.
Land 15 00550 g009
Figure 10. Spatiotemporal patterns of pairwise interactions among driving factors based on GeoDetector q-values in Shaanxi Province from 2000 to 2020.
Land 15 00550 g010
Figure 11. Path coefficients for each potential factor in Shaanxi Province from 2000 to 2020. Solid lines indicate stronger effects, whereas dashed lines indicate weaker effects. Red lines represent negative effects, while green lines represent positive effects.
Land 15 00550 g011
Table 1. Data sources.
Data CategoryData DescriptionResolutionData Resource
Administrative boundaryProvince administrative boundaryShapefileChinese Academy of Sciences Resource and Environmental Science Data Center (https://www.resdc.cn, accessed on 1 July 2025)
Land-use/cover data2000–2020 Land-use/cover type30 mYang et al. [31] (https://doi.org/10.5281/zenodo.5210928,
accessed on 1 July 2025)
Climate factorsPotential Evapotranspiration (PET)1 kmGEE: IDAHO_EPSCOR/TERRACLIMATE (https://code.earthengine.google.com, accessed on 1 July 2025)
Precipitation (PRE)
Solar Radiation (SRAD)
Natural factorsDigital elevation model (DEM)90 mGeospatial Data Cloud (http://www.gscloud.cn/,
accessed on 1 July 2025)
Normalized Difference Vegetation Index (NDVI)GEE: MODIS/061/MOD13A2 (https://code.earthengine.google.com, accessed on 1 July 2025)
SlopeGeospatial Data Cloud (http://www.gscloud.cn/,
accessed on 1 July 2025)
Human factorsGross Domestic Product (GDP)30 mData Center for Resources and Environmental Sciences of the Chinese Academy of Sciences (https://www.resdc.cn/, accessed on 1 July 2025)
Nighttime Light Index (NLI)1 kmGEE: NOAA/DMSP-OLS/NIGHTTIME_LIGHTS (https://code.earthengine.google.com, accessed on 1 July 2025)
Population Density (POP)30 mData Center for Resources and Environmental Sciences of the Chinese Academy of Sciences (https://www.resdc.cn/, accessed on 1 July 2025)
Landscape factorsLargest Patch Index (LPI)30 mCalculated based on land-use/cover data
Patch Density (PD)
Splitting Index (SPLIT)
Table 2. Carbon intensity of each land-use type in Shaanxi Province (Mg/hm2).
LucodeLULC_NameC_AboveC_BelowC_SoilC_Dead
1Cultivated4.8736.5879.610.74
2Forest12.1552.53114.341.95
3Grass10.1239.2173.600.46
4Water0.09000
5Construction0.72076.950
6Unused0.37030.980
Table 3. PLS-SEM model evaluation criteria.
Criteria Description
Measurement modelLoading≥0.7 ideal; 0.6–0.7 acceptable
ρa≥0.7 good reliability
AVE≥0.5 adequate convergent validity
Structural modelR2≥0.75 substantial; ≥0.50 moderate; ≥0.25 acceptable
p value<0.05 significant; <0.01 highly significant
VIF<5 indicates no multicollinearity
Table 4. Single-factor q-statistics of driving factors for carbon storage in Shaanxi Province from 2000 to 2020.
PETPRESRADDEMNDVISlopeGDPNLIPOPLPISPLIT
20000.2460.2250.1780.0760.2740.3260.0420.0490.1020.1850.270
20050.2080.2300.1640.0760.3020.3180.0180.0530.1040.1940.276
20100.2150.2510.1870.0750.3660.3160.1300.0640.1170.1810.282
20150.2210.2350.1750.0850.3240.3140.1030.2800.1420.1580.248
20200.1590.1880.1860.0810.3170.3140.1440.3070.1390.1700.263
Table 5. The results of measurement models based on PLS-SEM.
Factor20002005201020152020
LoadingρaAVELoadingρaAVELoadingρaAVELoadingρaAVELoadingρaAVE
Climate 0.8840.798 0.8930.825 0.8340.756 0.8440.767 0.8800.809
PET0.841 0.855 0.768 0.801 0.807
PRE0.904 0.907 0.882 0.879 0.932
SRAD0.933 0.961 0.948 0.941 0.952
Natural 0.7210.599 0.7330.600 0.7500.605 0.7480.611 0.7460.608
DEM0.556 0.528 0.494 0.507 0.495
NDVI0.805 0.818 0.846 0.844 0.841
Slope0.916 0.922 0.926 0.929 0.933
Human 0.8150.722 0.7970.707 0.7980.675 0.8610.705 0.9370.716
GDP0.830 0.820 0.882 0.799 0.798
NLI0.860 0.858 0.803 0.865 0.898
POP0.859 0.844 0.775 0.855 0.839
Landscape 0.9190.810 0.9060.795 0.9950.802 0.9560.800 0.9400.800
LPI0.907 0.898 0.926 0.923 0.922
PD0.883 0.919 0.922 0.911 0.909
SPLIT0.911 0.901 0.838 0.847 0.852
Table 6. Indirect and total effects of driving factors on carbon storage in Shaanxi Province from 2000 to 2020.
Path20002005201020152020
IndirectTotalIndirectTotalIndirectTotalIndirectTotalIndirectTotal
Climate →* carbon storage0.0700.1660.0920.088−0.0080.1700.0030.203−0.0020.162
Natural → carbon storage0.5000.6920.6940.6920.5530.7640.4780.7430.4440.696
Human → carbon storage−0.258−0.258−0.239−0.239−0.228−0.228−0.199−0.199−0.212−0.212
Landscape → carbon storage−0.173−0.173−0.072−0.072−0.132−0.132−0.173−0.173−0.189−0.189
LULC → carbon storage −0.715 −0.811 −0.725 −0.668 −0.646
* “→” indicates the direction of influence between driving factors and carbon storage.
Disclaimer/Publisher’s Note: The statements, opinions and data contained in all publications are solely those of the individual author(s) and contributor(s) and not of MDPI and/or the editor(s). MDPI and/or the editor(s) disclaim responsibility for any injury to people or property resulting from any ideas, methods, instructions or products referred to in the content.