Spatiotemporal Evolution and Scenario Simulation of Production–Living–Ecological Space (PLES) in Changsha: A Long-Term Analysis Based on 2010, 2020, and 2025 Data


Abstract
1. Introduction
1.1. Research Background and Significance
- (1)
- 2010: Marked the start of China’s “Twelfth Five-Year Plan” and the acceleration stage of Changsha’s urbanization—with the implementation of the “Changsha-Zhuzhou-Xiangtan Urban Agglomeration Construction Plan” (approved in 2007), the city entered a phase of large-scale industrialization and urban expansion [4];
- (2)
- 2020: Coincided with the end of China’s “Thirteenth Five-Year Plan” and the release of the “National Territorial Spatial Planning Outline (2021–2035)”, Changsha shifted from “scale expansion” to “quality improvement”, and the CZT Metropolitan Area integration strategy was officially elevated to a provincial key task [5];
- (3)
- 2025: As the midpoint of the new round of territorial spatial planning (2021–2035), it reflects the initial effects of policies such as the “Hunan Cultivated Land Protection Territorial Spatial Special Plan (2021–2035)” and the “CZT Metropolitan Area Green Heart Protection Revised Regulations (2024)”, and is also the first year of post-COVID-19 economic recovery, making it a critical node to observe the adjustment of urban spatial development models [6].
1.2. Literature Review
1.3. Research Content, Objectives, and Content
1.3.1. Explicit Research Questions
- (1)
- Evolution law question: How did the spatiotemporal pattern of Changsha’s PLES evolve from 2010 to 2025, and what are the differences in evolutionary characteristics between the “rapid expansion stage” (2010–2020) and “quality improvement stage” (2020–2025)?
- (2)
- Driving mechanism question: What are the key driving factors of Changsha’s PLES evolution, especially the interaction between policy constraints (e.g., ecological red lines, cultivated land protection) and socioeconomic factors?
- (3)
- Scenario optimization question: Under different policy scenarios (natural development, cultivated land protection, ecological protection), what will Changsha’s 2035 PLES layout look like, and which scenario best balances urban development, food security, and ecological security?
1.3.2. Research Objectives
- (1)
- Clarify the spatiotemporal evolution characteristics of Changsha’s PLES from 2010 to 2025, revealing stage-specific rules.
- (2)
- Identify the key driving factors of PLES evolution, especially the role of policy constraints.
- (3)
- Simulate 2035 PLES layouts under multiple scenarios and propose targeted optimization paths for territorial space governance.
1.3.3. Research Content
- (1)
- Construct a PLES space classification system suitable for Changsha, based on land use data of 2010, 2020, and 2025 (addressing Research Question 1).
- (2)
- Analyze the quantitative structure change and spatial pattern evolution characteristics of PLES space in Changsha during 2010–2025, comparing the two stages (addressing Research Question 1).
- (3)
- Identify the key driving factors affecting the evolution of PLES space using Logistic regression model, incorporating policy intensity indicators (addressing Research Question 2).
- (4)
- Simulate the 2035 PLES space layout under three scenarios using the FLUS model, analyze scenario differences, and propose optimization suggestions (addressing Research Question 3).
1.4. Technical Route
2. Materials and Methods
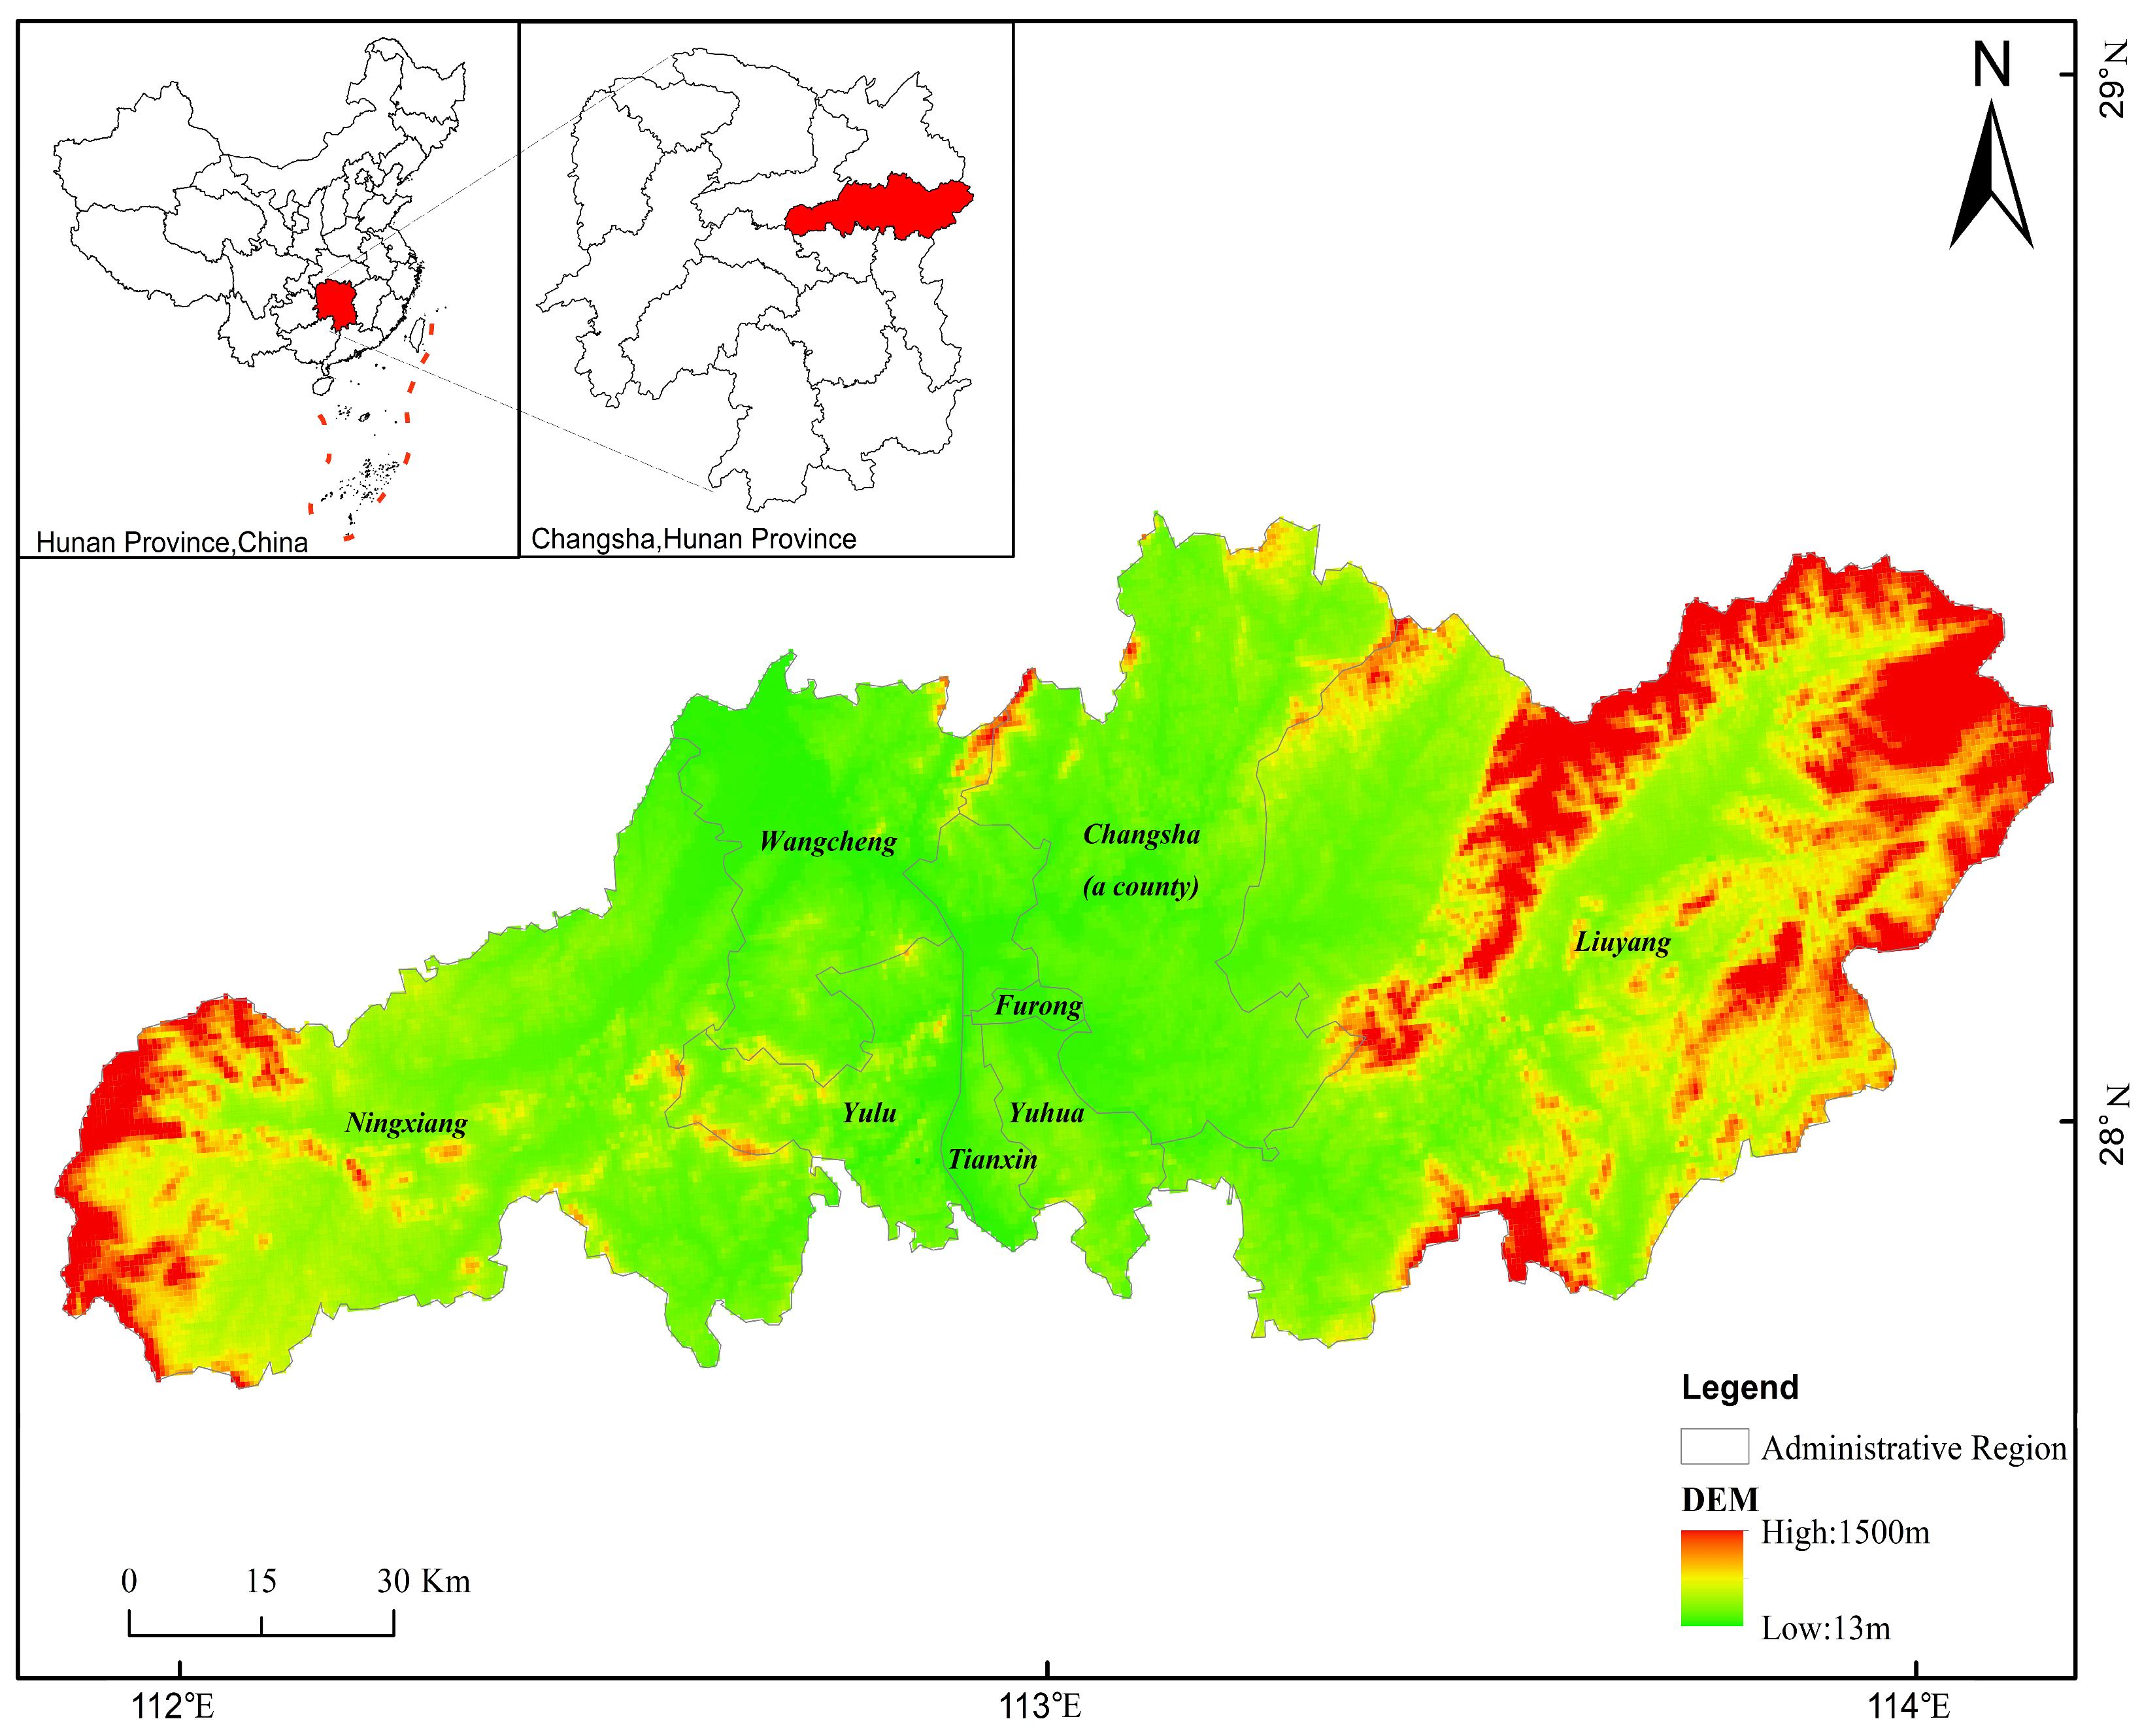
2.1. Study Area Overview
- (1)
- Ecological Environment Characteristics
- (2)
- Socioeconomic Development Characteristics
2.2. Data Sources and Processing
2.3. Research Methods
2.3.1. PLES Space Classification System
2.3.2. Spatiotemporal Evolution Analysis Methods
- (1)
- Land Use Dynamic Degree Model
- (2)
- Land Use Transfer Matrix
2.3.3. Driving Factor Analysis: Logistic Regression Model
- (1)
- Rationale for Choosing Logistic Regression
- Interpretability: Unlike black-box machine learning models, Logistic regression provides clear regression coefficients, which can directly quantify the direction (positive/negative) and intensity of driving factors—this is critical for explaining how policies and socioeconomic factors affect PLES evolution [7,17].
- Compatibility with FLUS model: The FLUS model requires suitability probability maps of each PLES type as input, and Logistic regression can directly output these probabilities (Section 2.3.4)—in contrast, GeoDetector focuses on factor contribution rather than probability prediction, requiring additional conversion steps to integrate with FLUS.
- Efficiency with large-scale data: Changsha’s 30 m resolution land use data (≈13 million pixels) requires a balance between model accuracy and computational efficiency. Logistic regression runs faster than complex machine learning models while maintaining acceptable accuracy (ROC > 0.87), which is suitable for large-scale spatial data [7].
- (2)
- Selection of Driving Factors
- Natural geographical factors: DEM (extracting elevation information), slope, and distance to rivers. These factors determine the basic suitability of PLES (e.g., flat areas for APS, steep slopes for GES) [17].
- Socioeconomic factors: Population density, GDP density, and per capita disposable income (data updated to 2025). These reflect the demand for living and production space [16].
- Location factors: Distance to roads, distance to administrative centers, and distance to industrial parks. These affect the accessibility and agglomeration of PLES [7].
- Policy intensity factors: Cultivated land protection intensity (CLI) and ecological protection intensity (EPI), operationalized as:
- (3)
- Model Principle
- (4)
- Sensitivity Analysis
2.3.4. Future Scenario Simulation: FLUS Model
- (1)
- FLUS Model Principle
- Suitability probability calculation: Based on 2010/2020 PLES data and driving factors (including policy intensity), Logistic regression outputs the suitability probability of each PLES type (directly using Equation (4) results—this is the key link between Logistic regression and FLUS) [18].
- Parameter setting: Set neighborhood weight (expanding ability of each PLES type), conversion cost matrix (whether conversion is allowed), and inertia coefficient (tendency to maintain current type) according to Changsha’s actual situation [25].
- Spatial simulation: Combine suitability probability, parameter settings, and non-conversion zones (e.g., ecological red lines) to simulate 2035 PLES layout through a self-adaptive inertia and competition mechanism. Additionally, the ecological connectivity index used to evaluate scenario effectiveness was calculated using Conefor Sensinode 2.6 (Universidad Politécnica de Madrid, Madrid, Spain).
- (2)
- Scenario settings
- Natural Development Scenario (NDS): Continues the 2010–2025 development trend, with no additional policy constraints. Neighborhood weights are set according to historical dynamic degrees (Table 5), and conversion costs follow natural market rules.
- Cultivated Land Protection Scenario (CLPS): Takes food security as the core, designates permanent basic farmland as non-conversion zones, increases APS neighborhood weight (to enhance its expansion ability), and reduces the conversion probability of APS to other types (adjustment coefficient = 0.3) [6].
- Ecological Protection Scenario (EPS): Prioritizes ecological security, designates ecological red lines (including CZT Green Heart) as non-conversion zones, increases ES neighborhood weight, and reduces ES conversion probability (adjustment coefficient = 0.2) [4].
- (3)
- Parameter settings
- Neighborhood weight: Quantified by historical land use dynamic degrees (2010–2025) and scenario objectives. For instance, under CLPS, APS neighborhood weight is elevated from 0.4 (NDS) to 1.0 to enhance its expansion potential, while IPS and ULS weights are reduced [14].
- Conversion cost matrix: In CLPS, APS → IPS/ULS conversion is prohibited (cost = 0); in EPS, ES → IPS/ULS conversion is prohibited (Table 6).
- Inertia coefficient: Set to 0.7 for all scenarios (70% probability to maintain current type), consistent with FLUS model default settings for metropolitan areas [18].
- (4)
- Model Calibration and Verification
3. Results
3.1. Spatiotemporal Evolution Characteristics of PLES Space (2010–2025)
3.1.1. Quantitative Structure Change
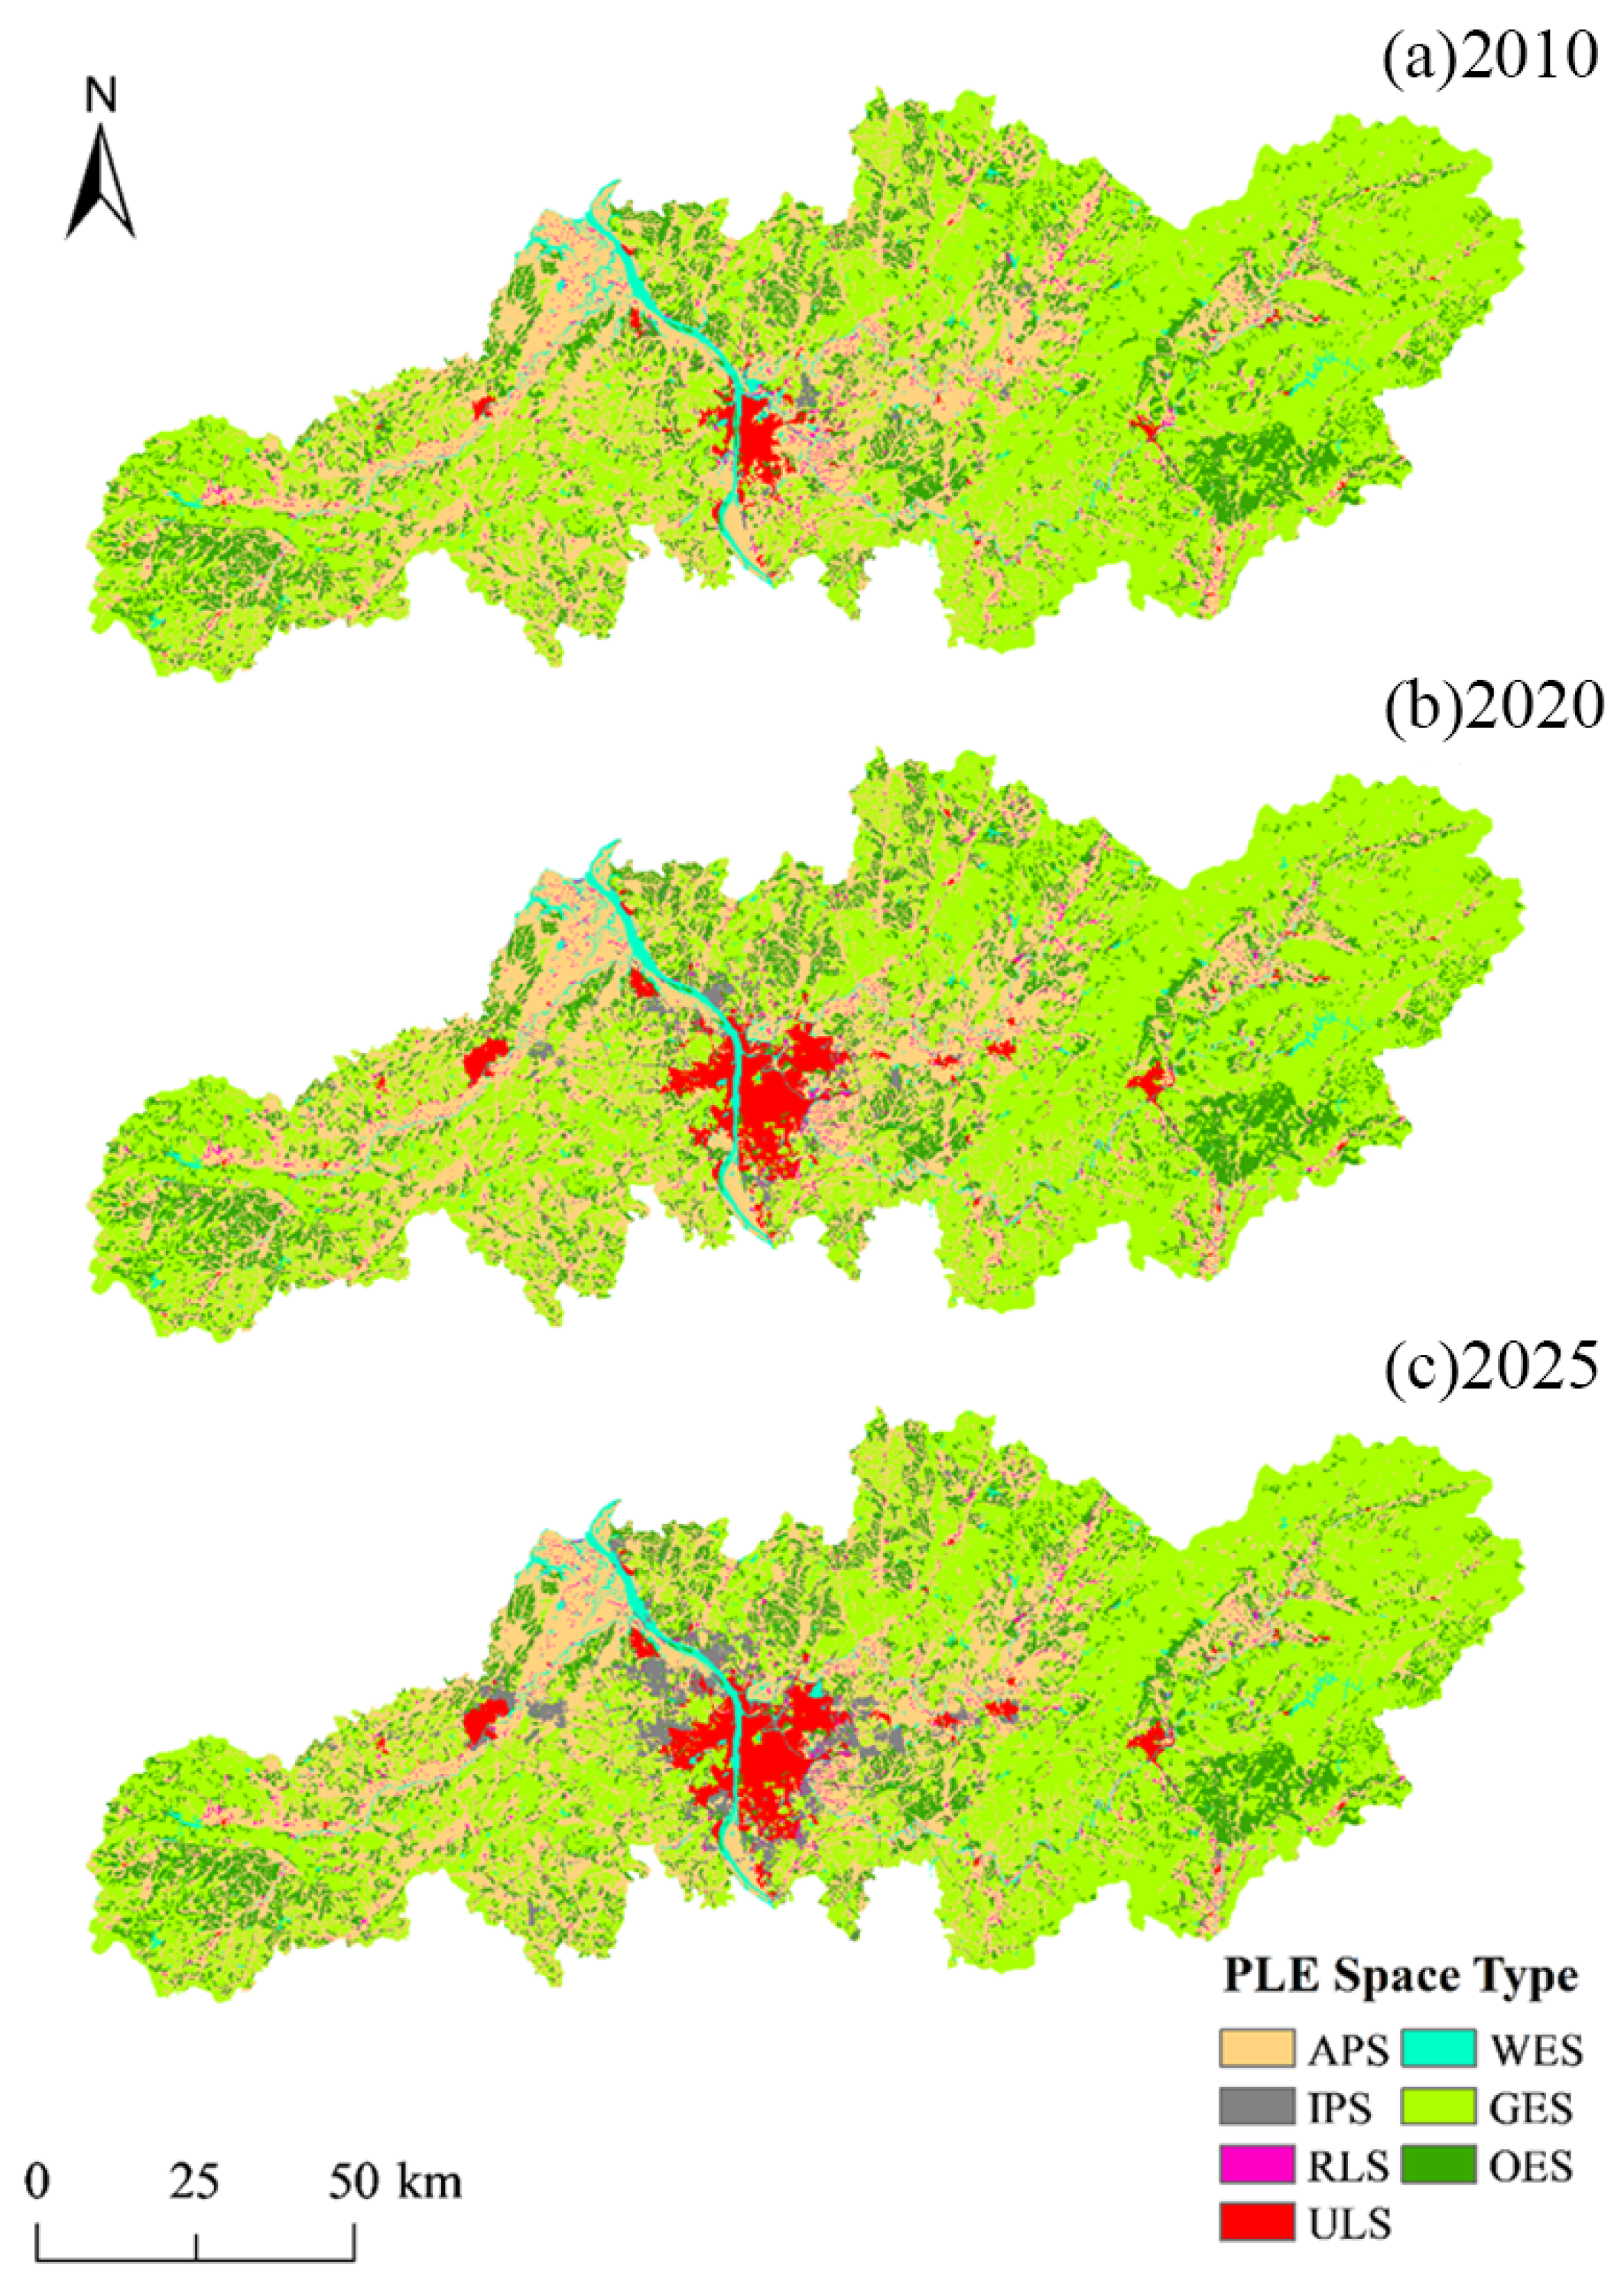
3.1.2. Spatial Pattern Evolution
- (1)
- 2010: Initial “Center-Periphery” Differentiation Pattern
- (2)
- 2020: Circular Expansion and Clustered Development Pattern
- (3)
- 2025: Optimized and Integrated “Core-Axis-Network” Pattern
3.2. PLES Space Transfer Analysis (2010–2025)
3.2.1. Transfer Characteristics of 2010–2020
- (1)
- APS is the main outgoing type, with 389.2 km2 converted to ULS (10.1% of 2010 APS area) and 83.8 km2 converted to IPS (2.2%), accounting for 62.3% of APS total transfer-out.
- (2)
- GES is the second largest outgoing type, with 126.5 km2 converted to ULS (2.1% of 2010 GES area) and 45.8 km2 converted to IPS (0.8%).
- (3)
- ULS is the main incoming type, with 85.3% of its incoming area (389.2 + 126.5 = 515.7 km2) from APS and GES.
3.2.2. Transfer Characteristics of 2020–2025
- (1)
- APS transfer-out to ULS/IPS decreased by 59.8%/25.4% (156.3 vs. 389.2 km2; 62.5 vs. 83.8 km2), mainly due to stricter cultivated land protection policies.
- (2)
- GES transfer-out decreased by 63.6% (195.0 vs. 480.8 km2), reflecting the effectiveness of ecological protection policies. OES to GES transfer increased (42.1 km2), embodying the role of ecological restoration projects. Such changes in ecological space (ES) not only reduce the risk of ecosystem degradation but also align with the general law that ‘strengthened policy constraints mitigate the negative eco-environmental effects of territorial space change’ observed in similar studies [27].
3.3. Driving Mechanism of PLES Space Evolution
3.4. Driving Factors by PLES Type
3.4.1. Agricultural Production Space (APS)
- (1)
- Dominant factors: Elevation (β = −0.85, negative correlation—APS concentrates in low-elevation areas), slope (β = −0.72, negative correlation—flat areas), and distance to rivers (β = 0.68, positive correlation—close to water sources) [17].
- (2)
- Policy role: GDP × CLI interaction term (β = 0.72, positive correlation)—higher cultivated land protection intensity weakens the negative impact of GDP growth on APS.
3.4.2. Industrial Production Space (IPS)
- (1)
- Dominant factors: GDP density (β = 0.92, positive correlation—high economic level areas), distance to roads (β = −0.86, negative correlation—convenient transportation), and distance to administrative centers (β = −0.78, negative correlation—close to policy support) [7].
- (2)
- Policy role: GDP × CLI (β = −0.45) and GDP × EPI (β = −0.38)—both negative, indicating policies restrict IPS expansion in protected areas.
3.4.3. Urban Living Space (ULS)
- (1)
- Dominant factors: Population density (β = 0.98, positive correlation—high population concentration), per capita disposable income (β = 0.85, positive correlation—high consumption demand), and distance to administrative centers (β = −0.82, negative correlation—central urban areas) [16].
- (2)
- Policy role: GDP × CLI (β = −0.52) and GDP × EPI (β = −0.46)—negative, indicating policies limit ULS expansion into cultivated land and ecological zones.
3.4.4. Ecological Space (GES)
- (1)
- Dominant factors: Elevation (β = 0.95, positive correlation—high mountains), slope (β = 0.88, positive correlation—steep slopes), and distance to roads (β = 0.76, positive correlation—far from human disturbance) [13].
- (2)
- Policy role: GDP × EPI (β = 0.85, positive correlation—ecological protection policies strengthen the positive impact of elevation/slope on GES.
3.5. Scenario Simulation of PLES Space in 2035
3.5.1. Simulation Accuracy Verification
3.5.2. Scenario Comparison and Governance Implications
- (1)
- Natural Development Scenario (NDS)
- Characteristics: Urban living space (ULS) and industrial production space (IPS) continue to expand rapidly, increasing by 289.3 km2 and 156.2 km2, respectively, compared with 2025. The expansion areas are mainly concentrated in suburban regions such as eastern Changsha County and northern Wangcheng District. Agricultural production space (APS) and green ecological space (GES) decrease significantly by 328.5 km2 and 126.3 km2, respectively. Among them, the reduced APS is dominated by contiguous cultivated land in Changsha County and Ningxiang City, while the reduced GES is concentrated in the edge areas of the Changzhutan Metropolitan Area Green Heart.
- Problems: The contradiction between development and protection is prominent—it is necessary to clarify the conceptual boundary between APS and cultivated land. According to the PLES classification system in Section 2.3.1, APS includes paddy fields, drylands, and other agricultural land. In contrast, the “2035 cultivated land retention target of no less than 2.9601 million mu (approximately 1973.4 km2)” specified in the Master Plan for Territorial Space of Changsha City (2021–2035) is a statutory indicator exclusively for cultivated land. Based on the 85% proportion of cultivated land in Changsha’s APS in 2025 (source: Changsha Statistical Yearbook 2025), when the APS area drops below 3000 km2 in 2035, the cultivated land area will be approximately 2550 km2 (3.825 million mu). Although this is higher than the statutory cultivated land retention target, it decreases by 221.4 km2 compared with the cultivated land area in APS in 2025 (3260.5 km2 × 85% ≈ 2771.4 km2). Additionally, the cultivated land fragmentation index rises to 1.6 (from 1.2 in 2025), which will weaken the capacity of large-scale agricultural operations. Meanwhile, the reduction in GES leads to an 18.5% decrease in ecological connectivity compared with 2025, impairing the ecological barrier function of the Changzhutan Metropolitan Area Green Heart (602.79 km2, based on the Revised Regulations on the Protection of the Green Heart of the Changzhutan Metropolitan Area (2024), and the water conservation capacity of the Xiangjiang River Basin decreases by approximately 12% (referring to Green Heart ecosystem service monitoring data).
- Governance Implications: This scenario does not meet Changsha’s high-quality development needs. It fails to incorporate rigid constraints such as the cultivated land protection red line (1973.4 km2 of permanent basic farmland) and the ecological protection red line (including the 602.79 km2 Changzhutan Green Heart and the Xiangjiang River Ecological Corridor). In the long term, it will exacerbate the risk of cultivated land fragmentation and ecosystem degradation, conflicting with Changsha’s positioning as a “National Pilot City for Ecological Civilization Construction.”
- (2)
- Cultivated Land Protection Scenario (CLPS)
- Characteristics: APS is effectively protected, decreasing by only 85.2 km2 compared with 2025, and maintaining an area of 3175.3 km2 (approximately 4.763 million mu) in 2035. Calculated at an 85% cultivated land proportion, the cultivated land area is about 4.049 million mu, far exceeding the statutory retention target of 2.9601 million mu. The reduced APS mainly consists of other agricultural land such as idle livestock and poultry breeding land. ULS and IPS expand moderately by 91.8 km2 and 68.5 km2, respectively, compared with 2025, with expansion areas concentrated in existing industrial parks such as Changsha Economic and Technological Development Zone and Ningxiang High-tech Zone, without exceeding the urban development boundary. Green Ecological Space (GES) increases slightly (+133.5 km2) due to the restoration of Other Ecological Space (OES), mainly from the conversion of sparse woodlands (OES) to arbor forests (GES) (accounting for 78.2% of the newly added GES), concentrated in the western mountainous areas of Liuyang City.
- Advantages: Balances food security and economic development—the APS fragmentation index remains at 1.2 (consistent with 2025), and contiguous cultivated land concentration areas (such as northern Changsha County and eastern Ningxiang City) account for 62.5% of the total APS area, ensuring large-scale agricultural operations and supporting an annual grain output of 1.2 million tons (meeting 40% of Changsha’s grain demand). The IPS agglomeration rate reaches 90.2% (higher than 85.6% in 2025), and the per unit area GDP output of industrial land increases by 21.3% compared with 2025, complying with the requirement of “strictly controlling construction occupation of cultivated land and promoting intensive utilization of industrial land” in the Special Plan for Territorial Space of Cultivated Land Protection in Hunan Province (2021–2035). The area of cultivated land occupied by construction in 2035 is controlled within 35 km2, lower than the planned upper limit of 50 km2.
- Governance Implications: Adapts to Changsha’s positioning as an important grain-producing area in Hunan Province but requires further strengthening of ecological protection—the growth rate of GES is limited (only +2.4%), and the newly added GES is concentrated in non-core ecological areas. Additional measures such as ecological restoration of the core area of the Changzhutan Green Heart (289.5 km2, based on the prohibited development zone scope specified in the Master Plan for the Ecological Green Heart Area of the Changzhutan Urban Agglomeration (2010–2030) Revised in 2018) and the connection of the Liuyang River–Laodao River Ecological Corridor are needed to avoid an imbalance between cultivated land protection and ecological protection. It is recommended to complete the restoration of 50 km2 of degraded forest land in the Green Heart by 2030 to improve regional ecological connectivity.
- (3)
- Ecological Protection Scenario (EPS)
- Characteristics: Subject to strict ecological red line constraints (including the 602.79 km2 Changzhutan Green Heart and the Xiangjiang River Ecological Corridor, with the Green Heart scope based on the Revised Regulations on the Protection of the Green Heart of the Changzhutan Metropolitan Area (2024)), GES increases significantly by 245.8 km2 compared with 2025, reaching 5594.1 km2 in 2035. The proportion of GES in the Green Heart area rises to 38.5% (from 32.1% in 2025), mainly from the conversion of low-efficiency orchards to forest land within Green Heart. The expansion of ULS and IPS is strictly controlled, increasing by only 72.5 km2 and 12.3 km2, respectively, compared with 2025. In total, 82.1% of the newly added ULS comes from old urban area reconstruction (such as Chaoyang Area in Furong District and Shuyuan Road Area in Tianxin District), and all newly added IPS is concentrated in existing industrial parks (Changsha High-tech Zone and Yuelu High-tech Zone). APS decreases by 161.8 km2, with an area of 3098.7 km2 (approximately 4.648 million mu) in 2035. Calculated at an 85% cultivated land proportion, the cultivated land area is about 3.951 million mu, still higher than the statutory retention target of 2.9601 million mu. The reduced APS is mainly idle breeding land (accounting for 68.3%), and the cultivated land reduction is only 42.3 km2, concentrated in southern Wangcheng District (non-permanent basic farmland area).
- Advantages: Ensures ecological security—the ecological connectivity of the Changzhutan Metropolitan Area Green Heart increases by 42.5% compared with 2025, and the ecological connectivity rate between the Green Heart, the Xiangjiang River Ecological Corridor, and the Liuyang River Wetland reaches 76.3% (from 53.8% in 2025), significantly enhancing regional ecological resilience and reducing the flood inundation risk of the Xiangjiang River Basin for a 50-year return period. Water Ecological Space (WES) increases by 3.3 km2, mainly from the restoration of the shorelines of Xiangjiang River tributaries (such as Jinjiang River and Longwanggang River) and the expansion of small reservoirs (such as Tuantou Lake). The water quality compliance rate of the Changsha section of the Xiangjiang River remains at 100% (Grade III or above), in line with Changsha’s positioning as a “National Pilot City for Ecological Civilization Construction.” Meanwhile, cultivated land protection does not exceed the statutory bottom line, ensuring food security.
- Governance Implications: Suitable for ecological priority development needs but imposes certain restrictions on industrial development—the growth rate of IPS is only 3.1%, and industrial upgrading is required to address this constraint: first, promote the circular transformation of industrial parks, aiming to increase the comprehensive utilization rate of industrial solid waste in key parks such as Changsha Economic and Technological Development Zone and Ningxiang High-tech Zone to over 95% by 2035, an increase of 18 percentage points compared with 2025; second, revitalize existing industrial land, renovate 23 plots of inefficient industrial land in the main urban area (with a total area of approximately 18.5 km2, such as old factories in Jinxia Area of Kaifu District), and transform them into innovative industrial parks or urban industrial carriers to ensure economic vitality within the ecological protection framework, which is expected to create 50,000 new jobs.
- (4)
- Optimal Scenario Selection
4. Conclusions
- (1)
- Refined Rigid Control: Clarify the spatial boundaries of permanent basic farmland (1973.4 km2) and the ecological protection red line (with a total area of 1892.5 km2, including the 602.79 km2 Changzhutan Green Heart, the 128.6 km2 Xiangjiang River Ecological Corridor, and the 92.3 km2 Liuyang River Wetland), incorporate them into the “one map” supervision of territorial space planning, and prohibit any construction occupation. Establish a “double red line” assessment mechanism for cultivated land and ecology, incorporate the effectiveness of red line protection into the performance assessment of local governments, with an assessment weight of no less than 20%.
- (2)
- Spatial Intensification Path: Promote the agglomeration of IPS to 10 key industrial parks (see Table 12 for details) and formulate differentiated access standards—Changsha Economic and Technological Development Zone and Yuelu High-tech Zone will focus on developing high-end manufacturing and digital economy, and restrict high-energy-consuming industries (energy consumption access standard ≥ 0.3 tons of standard coal per CNY 10,000 of GDP). Aim to achieve a per unit area GDP output of industrial land of 800 million CNY/km2 by 2035, an increase of 30% compared with 2025, and control the total industrial land area within 480 km2, a decrease of 12 km2 compared with 2025 (achieved through inventory revitalization).
- (3)
- Inventory Renewal Plan: Compile the Special Plan for Urban Renewal of Changsha City (2026–2035), specifying the time sequence and scope of old urban area reconstruction (15 km2 per year, focusing on old urban areas such as Furong District and Kaifu District) and old factory revitalization (5 km2 per year, prioritizing the renovation of inefficient industrial land within the Second Ring Road). Prioritize the expansion of ULS through the renovation of old communities in the central urban area, ensure that the proportion of inventory renewal in newly added ULS is no less than 70% by 2035, reduce the occupation of cultivated land and ecological space by new construction land, and achieve the territorial space governance goal of “development without crossing lines and protection with guarantees”.
Author Contributions
Funding
Data Availability Statement
Acknowledgments
Conflicts of Interest
Abbreviations
| PLES | Production–Living–Ecological |
| CZT | Changsha–Zhuzhou–Xiangtan |
| PS | Production Space |
| APS | Agricultural Production Space |
| IPS | Industrial Production Space |
| LS | Living Space |
| ULS | Urban Living Space |
| RLS | Rural Living Space |
| ES | Ecological Space |
| GES | Green Ecological Space |
| WES | Water Ecological Space |
| OES | Other Ecological Space |
| FLUS | Future Land Use Simulation |
| LCDI | Land Use Dynamic Degree Index |
| DEM | Digital Elevation Model |
| ROC | Receiver Operating Characteristic |
| NDS | Natural Development Scenario |
| CLPS | Cultivated Land Protection Scenario |
| EPS | Ecological Protection Scenario |
| PCDI | Per Capita Disposable Income |
| Term Explanation | |
| OES | (Other Ecological Space): Refers to spaces with weak ecological functions that require protection and restoration, such as sparse forest land, low-coverage grassland, and wetlands. The core difference from GES (Green Ecological Space) and WES (Water Ecological Space) lies in the intensity of ecological service value. Referring to the “Technical Guidelines for Delineating Ecological Protection Red Lines”, GES has stable and high ecological service value (e.g., high-coverage forest land), WES focuses on water ecosystem protection, while OES has relatively low ecological service value and needs to be restored through ecological engineering measures. |
References
- Liu, J.; Liu, Y.; Li, Y. Classification evaluation and spatial-temporal analysis of “production-living-ecological” spaces in China. Acta Geogr. Sin. 2017, 72, 1290–1304. [Google Scholar]
- Huang, A.; Xu, Y.; Lu, L.; Liu, C.; Zhang, Y.; Hao, J.; Wang, H. Research progress of the identification and optimization of production-living-ecological spaces. Prog. Geogr. 2020, 39, 503–518. [Google Scholar] [CrossRef] [Scilit]
- Zhang, Y.; Zhang, Y.; Zhang, H.; Zhang, Y. Classification of China’s first-tier cities based on GDP and modernization level. Ecol. Indic. 2022, 145, 109616. [Google Scholar] [CrossRef] [Scilit]
- Li, J.; Ouyang, X.; Zhu, X. Land space simulation of urban agglomerations from the perspective of the symbiosis of urban development and ecological protection: A case study of Changsha-Zhuzhou-Xiangtan urban agglomeration. Ecol. Indic. 2021, 126, 107669. [Google Scholar] [CrossRef] [Scilit]
- Xu, N.; Chen, W.; Pan, S.; Liang, J.; Bian, J. Evolution characteristics and formation mechanism of production-living-ecological space in China: Perspective of main function zones. Int. J. Environ. Res. Public Health 2022, 19, 9910. [Google Scholar] [CrossRef] [Scilit]
- Xie, X.; Li, X.; He, W. A land space development zoning method based on resource–environmental carrying capacity: A case study of Henan, China. Int. J. Environ. Res. Public Health 2020, 17, 900. [Google Scholar] [CrossRef] [Scilit]
- Fan, Q.; Shi, Y.; Song, X.; Li, H.; Sun, W.; Wu, F. Evolution analysis of the coupling coordination of microclimate and landscape ecological risk degree in the Xiahuayuan District in recent 20 years. Sustainability 2022, 14, 1893. [Google Scholar] [CrossRef] [Scilit]
- Liang, T.; Du, P.; Yang, F.; Su, Y.; Luo, Y.; Wu, Y.; Wen, C. Potential land-use conflicts in the urban center of Chongqing based on the “production–living–ecological space” perspective. Land 2022, 11, 1415. [Google Scholar] [CrossRef] [Scilit]
- Buya, S.; Tongkumchum, P.; Owusu, B.E. Modelling of land-use change in Thailand using binary logistic regression and multinomial logistic regression. Arab. J. Geosci. 2020, 13, 437. [Google Scholar] [CrossRef] [Scilit]
- Kipkulei, H.K.; Bellingrath-Kimura, S.D.; Lana, M.; Ghazaryan, G.; Boitt, M.; Sieber, S. Modelling cropland expansion and its drivers in Trans Nzoia County, Kenya. Model. Earth Syst. Environ. 2022, 8, 5761–5778. [Google Scholar] [CrossRef] [Scilit]
- Heilig, G.K. Anthropogenic factors in land-use change in China. Popul. Dev. Rev. 1997, 23, 139–161. [Google Scholar] [CrossRef] [Scilit]
- Zhang, H.; Xu, E.; Zhu, H. An ecological-living-industrial land classification system and its spatial distribution in China. Resour. Sci. 2015, 37, 1332–1338. [Google Scholar]
- Zhou, G.; Zhang, D.; Zhou, Q.; Shi, T. Study on the spatiotemporal evolution characteristics of the “production–living–ecology” space in the Yellow River Basin and its driving factors. Sustainability 2022, 14, 15227. [Google Scholar] [CrossRef] [Scilit]
- Wang, Y.; Wang, Y.; Xia, T.; Li, Y.; Li, Z. Land-use function evolution and eco-environmental effects in the Tarim River Basin from the perspective of production–living–ecological space. Front. Environ. Sci. 2022, 10, 1004274. [Google Scholar] [CrossRef] [Scilit]
- Chen, H.; Yang, Q.; Peng, L.; Su, K.; Zhang, H.; Liu, X. Spatiotemporal evolution characteristics and scenario simulation of production-living-ecological space at county level in Three Gorges Reservoir Areas. Trans. Chin. Soc. Agric. Eng. 2022, 38, 285–294. [Google Scholar]
- Duan, Y.; Wang, H.; Huang, A.; Xu, Y.; Lu, L.; Ji, Z. Identification and spatial-temporal evolution of rural “production-living-ecological” space from the perspective of villagers’ behavior—A case study of Ertai Town, Zhangjiakou City. Land Use Policy 2021, 106, 105457. [Google Scholar] [CrossRef] [Scilit]
- Deng, Y.; Yang, R. Influence mechanism of production-living-ecological space changes in the urbanization process of Guangdong Province, China. Land 2021, 10, 1357. [Google Scholar] [CrossRef] [Scilit]
- Wang, S.; Qu, Y.; Zhao, W.; Guan, M.; Ping, Z. Evolution and optimization of territorial-space structure based on regional function orientation. Land 2022, 11, 505. [Google Scholar] [CrossRef] [Scilit]
- Huang, Z.; Yang, Y. Comparative study on the simulation of spatial patterns of land use in the Yanhe River Basin. Res. Soil Water Conserv. 2022, 29, 268–274+283. [Google Scholar] [CrossRef]
- Zhao, X.; Tang, F.; Zhang, P.; Hu, B.; Xu, L. Dynamic simulation and characteristic analysis of county production-living-ecological spatial conflicts based on CLUE-S model. Acta Ecol. Sin. 2019, 39, 4356–4365. [Google Scholar] [CrossRef] [Scilit]
- Sun, P.; Xu, Y.; Yu, Z.; Liu, Q.; Xie, B.; Liu, J. Scenario simulation and landscape pattern dynamic changes of land use in the poverty belt around Beijing and Tianjin: A case study of Zhangjiakou City, Hebei Province. J. Geogr. Sci. 2016, 26, 272–296. [Google Scholar] [CrossRef] [Scilit]
- Ou, M.; Li, J.; Fan, X.; Gong, J. Compound optimization of territorial spatial structure and layout at the city scale from “production–living–ecological” perspectives. Int. J. Environ. Res. Public Health 2022, 20, 495. [Google Scholar] [CrossRef] [Scilit]
- Xiao, P.; Xu, J.; Zhao, C. Conflict identification and zoning optimization of “production-living-ecological” space. Int. J. Environ. Res. Public Health 2022, 19, 7990. [Google Scholar] [CrossRef] [Scilit]
- Fang, C.; Yang, J.; Fang, J.; Huang, X.; Zhou, Y. Optimization transmission theory and technical pathways that describe multiscale urban agglomeration spaces. Chin. Geogr. Sci. 2018, 28, 543–554. [Google Scholar] [CrossRef] [Scilit]
- Liu, X.; Liang, X.; Li, X.; Xu, X.; Ou, J.; Chen, Y.; Li, S.; Wang, S.; Pei, F. A future land use simulation model (FLUS) for simulating multiple land use scenarios by coupling human and natural effects. Landsc. Urban Plan. 2017, 168, 94–116. [Google Scholar] [CrossRef] [Scilit]
- Tu, S.; Long, H.; Zhang, Y.; Ge, D.; Qu, Y. Rural restructuring at village level under rapid urbanization in metropolitan suburbs of China and its implications for innovations in land use policy. Habitat Int. 2018, 77, 143–152. [Google Scholar] [CrossRef] [Scilit]
- Wu, X.; Ding, J.; Lu, B.; Wan, Y.; Shi, L.; Wen, Q. Eco-environmental effects of changes in territorial spatial pattern and their driving forces in Qinghai, China (1980–2020). Land 2022, 11, 1772. [Google Scholar] [CrossRef] [Scilit]



| Data Type | Source | Key Information and Processing |
|---|---|---|
| Land Use Data | Resource and Environmental Science and Data Center of the Chinese Academy of Sciences; Changsha Municipal Bureau of Natural Resources and Planning | 2010, 2020, 2025 land use data with 30 m spatial resolution, including 6 primary types and 25 secondary types. All geospatial data (including geometric correction, projection transformation, vectorization of land use data, and subsequent visualization of PLES spatial patterns) were processed and generated using ArcGIS 10.8 (Esri Inc., Redlands, CA, USA) to ensure data consistency. |
| Socioeconomic Data | Changsha Municipal Bureau of Statistics; Hunan Statistical Yearbook; Changsha Economic Operation Report (Q3 2025) | Core indicators include GDP, permanent resident population, urbanization rate, urban (permanent resident statistics, including wage, operational, property, and transfer income) per capita disposable income, and total retail sales of consumer goods for 2010, 2020, and 2025. Standardized processing was performed to eliminate dimensional differences. Data source: Changsha Economic Operation Report (Q3 2025), released by Changsha Municipal Bureau of Statistics in October 2025. |
| Natural Geography Data | Geospatial Data Cloud; National Geospatial Information Public Service Platform | Digital Elevation Model (DEM) data (30 m resolution) used to extract slope and elevation information; river system and administrative boundary data for spatial analysis. |
| Policy Data | Hunan Provincial People’s Government; Changsha Municipal Government | Key policies include “Changsha New Urbanization Development Plan (2021–2025)”, “Hunan Cultivated Land Protection Territorial Spatial Special Plan (2021–2035)”, and “CZT Metropolitan Area Integration Development Three-Year Action Plan (2023–2025)”. Rigid clauses such as cultivated land protection red lines, ecological protection red lines, and urban development boundaries in the policies were digitized and converted into non-conversion zone parameters and constraints for the FLUS model. |
| Policy Intensity Data | Hunan Provincial Government Work Reports (2010–2025); Changsha Municipal Government Work Report (2010–2025) | Operationalized policy intensity from three dimensions: (1) Policy frequency (number of PLES-related policies are mentioned in government reports); (2) Implementation rate (completion rate of cultivated land/ecological protection indicators); (3) Constraint scope (area of ecological/cultivated land red lines). Used to construct interaction terms in Logistic regression (Section 2.3.3). |
| Primary Type | Secondary Type | Corresponding Land Use Types | Functional Orientation |
|---|---|---|---|
| Production Space (PS) | Agricultural Production Space (APS) | Paddy field, dry land, other agricultural land | Ensure food security; provide agricultural products |
| Industrial Production Space (IPS) | Industrial land, mining land, transportation and transportation auxiliary land | Support industrial development and transportation connectivity | |
| Living Space (LS) | Urban Living Space (ULS) | Urban residential land, commercial and service land, public management and public service land | Meet urban residents’ living, consumption, and public service needs |
| Rural Living Space (RLS) | Rural residential land, rural transportation land | Meeting rural residents’ living and production needs | |
| Ecological Space (ES) | Green Ecological Space (GES) | Forest land, shrub land, high/medium coverage grassland | Maintain ecological security; regulate regional climate |
| Water Ecological Space (WES) | River, lake, reservoir, tidal flat | Conserve water resources; protect water ecosystem | |
| Other Ecological Space (OES) | Sparse forest land, low coverage grassland, wetland, bare land | Ecological conservation and restoration |
| Driving Factor Category | Specific Factors | VIF Value |
|---|---|---|
| Natural geographical factors | DEM (elevation), slope, distance to rivers | 1.82, 1.65, 2.13 |
| Socioeconomic factors | Population density, GDP density, per capita disposable income | 2.37, 2.51, 1.98 |
| Location factors | Distance to roads, distance to administrative centers, distance to industrial parks | 2.05, 1.79, 1.88 |
| Policy intensity factors | Cultivated land protection intensity (CLI), ecological protection intensity (EPI) | 1.92, 2.07 |
| Excluded Factor | ROC Before Exclusion | ROC After Exclusion | ROC Change Rate |
|---|---|---|---|
| Population density | 0.94 | 0.91 | −3.2% |
| GDP density | 0.94 | 0.92 | −2.1% |
| CLI (interaction term) | 0.94 | 0.90 | −4.3% |
| EPI (interaction term) | 0.94 | 0.91 | −3.2% |
| Distance to administrative centers | 0.94 | 0.93 | −1.1% |
| Scenario Mode | APS | IPS | ULS | RLS | GES | WES | OES |
|---|---|---|---|---|---|---|---|
| Natural Development (NDS) | 0.4 | 1 | 0.8 | 0.6 | 0.5 | 0.7 | 0.3 |
| Cultivated Land Protection (CLPS) | 1 | 0.6 | 0.4 | 0.5 | 0.5 | 0.7 | 0.3 |
| Ecological Protection (EPS) | 0.4 | 0.6 | 0.4 | 0.5 | 1 | 1 | 1 |
| From 2020 To 2035 | APS | IPS | ULS | GES | Scenario Explanation |
|---|---|---|---|---|---|
| APS | 1 | 1 (NDS)/ 0 (CLPS) | 1 (NDS)/ 0 (CLPS) | 1 | CLPS prohibits APS → IPS/ULS |
| GES | 1 | 1 (NDS)/ 0 (EPS) | 1 (NDS)/ 0 (EPS) | 1 | EPS prohibits GES → IPS/ULS |
| IPS | 0 | 1 | 0 | 0 | All scenarios: IPS is stable |
| PLES Type | Average Area (km2) | Standard Deviation | Variation Coefficient |
|---|---|---|---|
| APS | 2932.0 | 78.5 | 2.7% |
| ULS | 1202.0 | 32.5 | 2.7% |
| GES | 5422.0 | 125.8 | 2.3% |
| PLES Type | 2010 | 2020 | 2025 | 2010–2020 Change | 2020–2025 Change |
|---|---|---|---|---|---|
| Agricultural Production Space (APS) | 3862.5 km2 (32.7%) | 3450.2 km2 (29.2%) | 3260.5 km2 (27.6%) | −412.3 km2 (−10.7%) | −189.7 km2 (−5.5%) |
| Industrial Production Space (IPS) | 189.6 km2 (1.6%) | 273.4 km2 (2.3%) | 400.0 km2 (3.4%) | +83.8 km2 (+44.2%) | +126.5 km2 (+46.3%) |
| Urban Living Space (ULS) | 326.8 km2 (2.8%) | 716.0 km2 (6.1%) | 912.7 km2 (7.7%) | +389.2 km2 (+119.1%) | +196.7 km2 (+27.5%) |
| Rural Living Space (RLS) | 156.3 km2 (1.3%) | 163.9 km2 (1.4%) | 185.5 km2 (1.6%) | +7.6 km2 (+4.9%) | +21.6 km2 (+13.2%) |
| Green Ecological Space (GES) | 5896.2 km2 (49.9%) | 5621.8 km2 (47.6%) | 5548.3 km2 (46.9%) | −274.4 km2 (−4.6%) | −73.5 km2 (−1.3%) |
| Water Ecological Space (WES) | 289.7 km2 (2.5%) | 293.5 km2 (2.5%) | 296.8 km2 (2.5%) | +3.8 km2 (+1.3%) | +3.3 km2 (+1.1%) |
| Other Ecological Space (OES) | 1094.9 km2 (9.3%) | 1097.7 km2 (9.3%) | 1012.2 km2 (8.6%) | +2.8 km2 (+0.3%) | −85.5 km2 (−7.8%) |
| From 2010 to 2020 | APS | IPS | ULS | RLS | GES | WES | OES | Total Transfer-Out |
|---|---|---|---|---|---|---|---|---|
| APS | 3061.3 | 83.8 | 389.2 | 25.6 | 212.3 | 5.2 | 85.1 | 801.2 |
| IPS | 12.5 | 156.3 | 18.7 | 2.1 | 0.0 | 0.0 | 0.0 | 33.3 |
| ULS | 0.0 | 0.0 | 298.1 | 8.7 | 0.0 | 0.0 | 0.0 | 8.7 |
| RLS | 15.6 | 3.2 | 12.5 | 125.0 | 0.0 | 0.0 | 0.0 | 31.3 |
| GES | 189.6 | 45.8 | 126.5 | 18.9 | 5331.0 | 12.3 | 87.7 | 480.8 |
| WES | 5.2 | 0.0 | 8.7 | 0.0 | 12.3 | 263.3 | 0.0 | 26.2 |
| OES | 85.1 | 12.5 | 45.8 | 12.3 | 87.7 | 0.0 | 851.5 | 243.4 |
| From 2020 to 2025 | APS | IPS | ULS | RLS | GES | WES | OES | Total Transfer-Out |
|---|---|---|---|---|---|---|---|---|
| APS | 3044.4 | 62.5 | 156.3 | 18.9 | 145.8 | 3.2 | 59.1 | 445.8 |
| IPS | 8.7 | 225.6 | 12.5 | 1.2 | 0.0 | 0.0 | 0.0 | 22.4 |
| ULS | 0.0 | 0.0 | 685.3 | 12.5 | 0.0 | 0.0 | 0.0 | 12.5 |
| RLS | 12.3 | 2.1 | 8.7 | 135.6 | 0.0 | 0.0 | 0.0 | 23.1 |
| GES | 85.1 | 21.2 | 25.6 | 12.3 | 5496.8 | 8.7 | 42.1 | 195.0 |
| WES | 3.2 | 0.0 | 5.2 | 0.0 | 8.7 | 275.4 | 0.0 | 17.1 |
| OES | 59.1 | 8.7 | 21.2 | 8.5 | 42.1 | 0.0 | 872.7 | 139.6 |
| PLES Type | Elevation | Slope | Distance to Rivers | Population Density | GDP Density | Per Capita Disposable Income |
|---|---|---|---|---|---|---|
| APS | −0.85 *** | −0.72 *** | 0.68 *** | −0.56 *** | −0.48 *** | −0.32 *** |
| IPS | −0.32 *** | −0.28 *** | 0.15 ** | 0.65 *** | 0.92 *** | 0.48 *** |
| ULS | −0.45 *** | −0.38 *** | 0.22 *** | 0.98 *** | 0.76 *** | 0.85 *** |
| GES | 0.95 *** | 0.88 *** | −0.25 *** | −0.78 *** | −0.82 *** | −0.65 *** |
| PLES Type | Distance to Roads | Distance to Administrative Centers | Distance to Industrial Parks | GDP × CLI | GDP × EPI | ROC |
| APS | −0.25 *** | −0.18 *** | −0.12 | 0.72 *** | −0.15 ** | 0.87 |
| IPS | −0.86 *** | −0.78 *** | −0.82 | −0.45 *** | −0.38 *** | 0.91 |
| ULS | −0.68 *** | −0.82 *** | −0.75 | −0.52 *** | −0.46 *** | 0.94 |
| GES | 0.76 *** | 0.68 *** | 0.52 | −0.12 ** | 0.85 *** | 0.90 |
| Name of Industrial Park | Leading Industries | Controlled Industrial Land Area in 2035 (km2) | Intensive Utilization Target [GDP Per Unit Area (100 million CNY/km2)] |
|---|---|---|---|
| Changsha Economic and Technological Development Zone | High-end Equipment Manufacturing, Electronic Information | 85.2 | 10.5 |
| Yuelu High-tech Industrial Development Zone | Artificial Intelligence, Biomedical Engineering | 62.8 | 9.2 |
| Ningxiang High-tech Industrial Development Zone | New Energy Materials, Smart Home | 58.5 | 7.8 |
| Liuyang Economic and Technological Development Zone | Fine Chemicals, Medical Devices | 52.3 | 7.5 |
| Changsha High-tech Industrial Development Zone | Integrated Circuits, Aerospace | 78.6 | 11.2 |
| Wangcheng Economic and Technological Development Zone | Food Processing, Intelligent Connected Vehicles | 65.4 | 6.8 |
| Other 4 Parks | Urban Industry, Producer Services | 77.2 | ≥6.0 |
| Total | - | ≤480.0 | ≥8.0 |
Disclaimer/Publisher’s Note: The statements, opinions and data contained in all publications are solely those of the individual author(s) and contributor(s) and not of MDPI and/or the editor(s). MDPI and/or the editor(s) disclaim responsibility for any injury to people or property resulting from any ideas, methods, instructions or products referred to in the content. |
© 2026 by the authors. Licensee MDPI, Basel, Switzerland. This article is an open access article distributed under the terms and conditions of the Creative Commons Attribution (CC BY) license.
Share and Cite
Zhang, K.; He, X.; Tang, Y. Spatiotemporal Evolution and Scenario Simulation of Production–Living–Ecological Space (PLES) in Changsha: A Long-Term Analysis Based on 2010, 2020, and 2025 Data. Land 2026, 15, 234. https://doi.org/10.3390/land15020234
Zhang K, He X, Tang Y. Spatiotemporal Evolution and Scenario Simulation of Production–Living–Ecological Space (PLES) in Changsha: A Long-Term Analysis Based on 2010, 2020, and 2025 Data. Land. 2026; 15(2):234. https://doi.org/10.3390/land15020234
Chicago/Turabian StyleZhang, Kun, Xinlu He, and Yifeng Tang. 2026. "Spatiotemporal Evolution and Scenario Simulation of Production–Living–Ecological Space (PLES) in Changsha: A Long-Term Analysis Based on 2010, 2020, and 2025 Data" Land 15, no. 2: 234. https://doi.org/10.3390/land15020234
APA StyleZhang, K., He, X., & Tang, Y. (2026). Spatiotemporal Evolution and Scenario Simulation of Production–Living–Ecological Space (PLES) in Changsha: A Long-Term Analysis Based on 2010, 2020, and 2025 Data. Land, 15(2), 234. https://doi.org/10.3390/land15020234