Article

Effectiveness of Protected Areas in the Conservation of Nothofagus antarctica Forests in Santa Cruz, Argentina


by
Rocío L. Arcidiácono
1,
Nirvana N. Churquina
1,
Julián Rodríguez-Souilla
1,
Juan M. Cellini
2,
María Vanessa Lencinas
1,
Francisco Ferrer
3,
Pablo L. Peri
3,4 and
Guillermo Martínez Pastur
1,*
1
Laboratorio de Recursos Agroforestales, Centro Austral de Investigaciones Científicas (CADIC), Consejo Nacional de Investigaciones Científicas y Técnicas (CONICET), Bernardo Houssay 200, Ushuaia 9410, Tierra del Fuego, Argentina
2
Laboratorio de Investigaciones en Maderas (LIMAD), Universidad Nacional de la Plata (UNLP), Diagonal 113 n° 469, La Plata 1900, Buenos Aires, Argentina
3
Instituto Nacional de Tecnología Agropecuaria (INTA), Gandhi y Chaplin, Río Gallegos 9400, Santa Cruz, Argentina
4
Centro de Investigaciones y Transferencia (CIT) Santa Cruz, Universidad Nacional de la Patagonia Austral (UNPA), Lisandro de la Torre 860, Río Gallegos 9400, Santa Cruz, Argentina
*
Author to whom correspondence should be addressed.
Land 2026, 15(1), 178; https://doi.org/10.3390/land15010178
Submission received: 10 December 2025 / Revised: 6 January 2026 / Accepted: 16 January 2026 / Published: 18 January 2026

Abstract

Protected areas (PAs) constitute a fundamental strategy for mitigating biodiversity loss. The land–sparing approach has expanded in response to international agreements, but expansion of PAs does not guarantee conservation objectives. The objective was to assess PA effectiveness in conserving Nothofagus antarctica forests in Santa Cruz (Argentina), evaluating human impacts associated with fires, animal uses, and harvesting. The research was conducted within pure native forests in Santa Cruz, Argentina. This province encompasses 52 protected areas, representing the highest concentration of conservation units within the forested landscapes across Argentina. At least eight PAs included N. antarctica forests. Three land tenure categories were evaluated: protected areas (PAs), a buffer of 15 km from PA boundaries on private lands (BL), and private lands (PL) outside the buffer. In total, 103 stands were sampled, where 38 variables were assessed (impacts, soil, forest structure, understory, and animal use). Three indices were developed to analyze ecosystem integrity: forest structure (FI), soil (SI), and animal use (AI). PAs presented the highest FI (0.64 for PA, 0.44 for BL, and 0.30 for PL) and AI (0.60 for PA, 0.55 for BL, and 0.52 for PL), and together with buffer areas, the highest SI (0.43 for PA, 0.47 for BL, and 0.32 for PL). PAs were clearly distinct from private lands; however, sustained actions for livestock exclusion, harvest regulation, and fire management remain necessary for future sustainable planning at the landscape level.

1. Introduction

Global protected area (PA) coverage currently encompasses 17.6% of terrestrial and inland water systems and 8.4% of marine and coastal ecosystems [1]. The Kunming–Montreal Global Biodiversity Framework sets the target of expanding the global PA network to 30% by 2030 [2,3]. Although the establishment of PA remains a central instrument for biodiversity protection and conservation, biodiversity loss continues to date [4,5]. Consequently, evaluating PA effectiveness is essential for land use planning [6] and is typically defined as the integration of three components: PA location, management performance, and the capacity to implement the designated Management and Conservation Plan [7]. These analyses and evaluations often rely on subjective and, in some cases, self-assessed questionnaires, even though their methodological rigor has improved over time [8]. Within this context, monitoring must determine the extent to which the conservation of a PA’s natural and cultural values is being achieved by assessing management effectiveness [9]. Such monitoring can be conducted from biological and ecological perspectives to evaluate the ecosystems and their biodiversity [10,11]. Some studies employ indices based on deforestation and changes in land cover and land use, although these indicators do not always reflect reductions in ecological integrity [12,13]. However, many degradations in value are not detectable through remote sensing, affecting ecosystem integrity within PAs [12,14]. Therefore, monitoring biological and ecological attributes is necessary to enable a locally grounded assessment [15].
In Argentina, only one quarter of the research conducted within National Parks (NPs) and Provincial Reserves (PRs) aligns with the research priorities defined in their management plans. Moreover, most of the management plans are either unavailable or not publicly accessible [16]. Santa Cruz province includes 52 PAs with 7 NPs [17]. These PAs include a wide range of aquatic and terrestrial environments, from steppe to forests [18]. Within the forested landscapes, Nothofagus antarctica (G. Forst.) Oerst. occurs under different land conservation statuses, e.g., in eight PAs, three within NPs (Los Glaciares, Patagonia, and Perito Moreno), and five within PRs (Lago del Desierto, Tucu–Tucu, Península Magallanes, Punta Gruesa, and San Lorenzo), as well as on private lands, across the natural distribution of the species [19]. These forests occupy 1699 km2 in Santa Cruz province and have an important role in the local economy; however, only 16% of the area in which they exist is effectively protected [18].
Nothofagus antarctica is one of the most phenotypically plastic tree species in Andean–Patagonian forests, capable of adapting to a wide range of environmental conditions [20,21]. In addition to this plasticity, monospecific N. antarctica forests exhibit distinct phases of the natural life cycle (initial growth, final growth, mature, and decay), which allow for the classification of stands as even-aged (>70% of basal area represented by a single growth phase), two-aged (≥70% represented by two phases), or uneven-aged (three or more phases representing >70% of basal area) [22]. A single conservation strategy is not recommended for this heterogeneous forest [23,24], particularly considering that it also provides important cultural, regulating, and provisioning ecosystem services (ES) [25]. In Santa Cruz province, the use of N. antarctica forests is primarily associated with silvopastoral systems involving domestic livestock (cattle, horses, and sheep), while a smaller proportion undergoes forestry interventions, mainly thinning, to produce posts, poles, and firewood [26]. Overgrazing, land-use change, fires, and harvesting exert pressure on N. antarctica forests, compromising their conservation and long-term persistence [27]. Rosas et al. [18] identify N. antarctica forests as those presenting the greatest negative potential trade-offs between production and conservation, with particular emphasis on areas located in the ecotone, where environments provide both forage and shelter for domestic livestock. This creates a production–conservation dilemma, often framed by the concepts of land-sharing and land-sparing [28,29]. The land-sharing approach promotes production and conservation within the same area and is associated with complex landscape structures in which natural habitats coexist with low-intensity systems that employ environmentally friendly practices [30]. In contrast, land-sparing aims to secure the largest possible extent of contiguous, intact natural habitats, spatially separating areas designated for biodiversity protection from those allocated to production [31]. Furthermore, the sensitivity of forests to climate variability accentuates the complexity of the problem, increasing ecosystem vulnerability [32], both due to climate change itself and to its effects on meteorological variables associated with the heightened probability and occurrence of large-scale forest disturbances (e.g., fires) [33]. For this reason, it is important to consider resilience, defined within our study as the ability to maintain and/or recover ecosystem identity in the face of disturbances, as well as the species vulnerability to climatic factors [23]. For example, some studies demonstrate a high resilience of N. antarctica to fires [34] and to harvesting, owing to the resprouting capacity [23]. Determining the effectiveness of PA makes it possible to evaluate whether the proposed conservation objectives are being met, whether current management and conservation strategies are effective, and whether alternative strategies need to be considered [35].
The objective was to determine the effectiveness of PAs in conserving N. antarctica forests in Santa Cruz province (Argentina), assessing the impact of fires, animal use, and harvesting. We propose the following research questions: (i) Do livestock occupancy, forest structure, and soil properties vary according to land tenure status? (ii) Does the intensity of impacts increase as we move away from PA? We propose the following hypotheses: (i) Unprotected areas exhibit greater livestock, logging, and fire pressures, which gradually decrease in PAs; (ii) land tenure status influences forest structure (e.g., dominant height, crown cover, basal area, total over-bark volume, percentage of mature basal area, vigor, regeneration cover, seedling density and height, and sapling density and height), with more conserved structures expected in PAs than in unprotected areas; (iii) private tenure status leads to negative impacts on soil (e.g., compaction, acidification, carbon loss, and reduced water retention capacity) where more intensive land use occurs; and (iv) PAs experience lower herbivory pressure on the understory due to land use restrictions.

2. Materials and Methods

2.1. Study Area

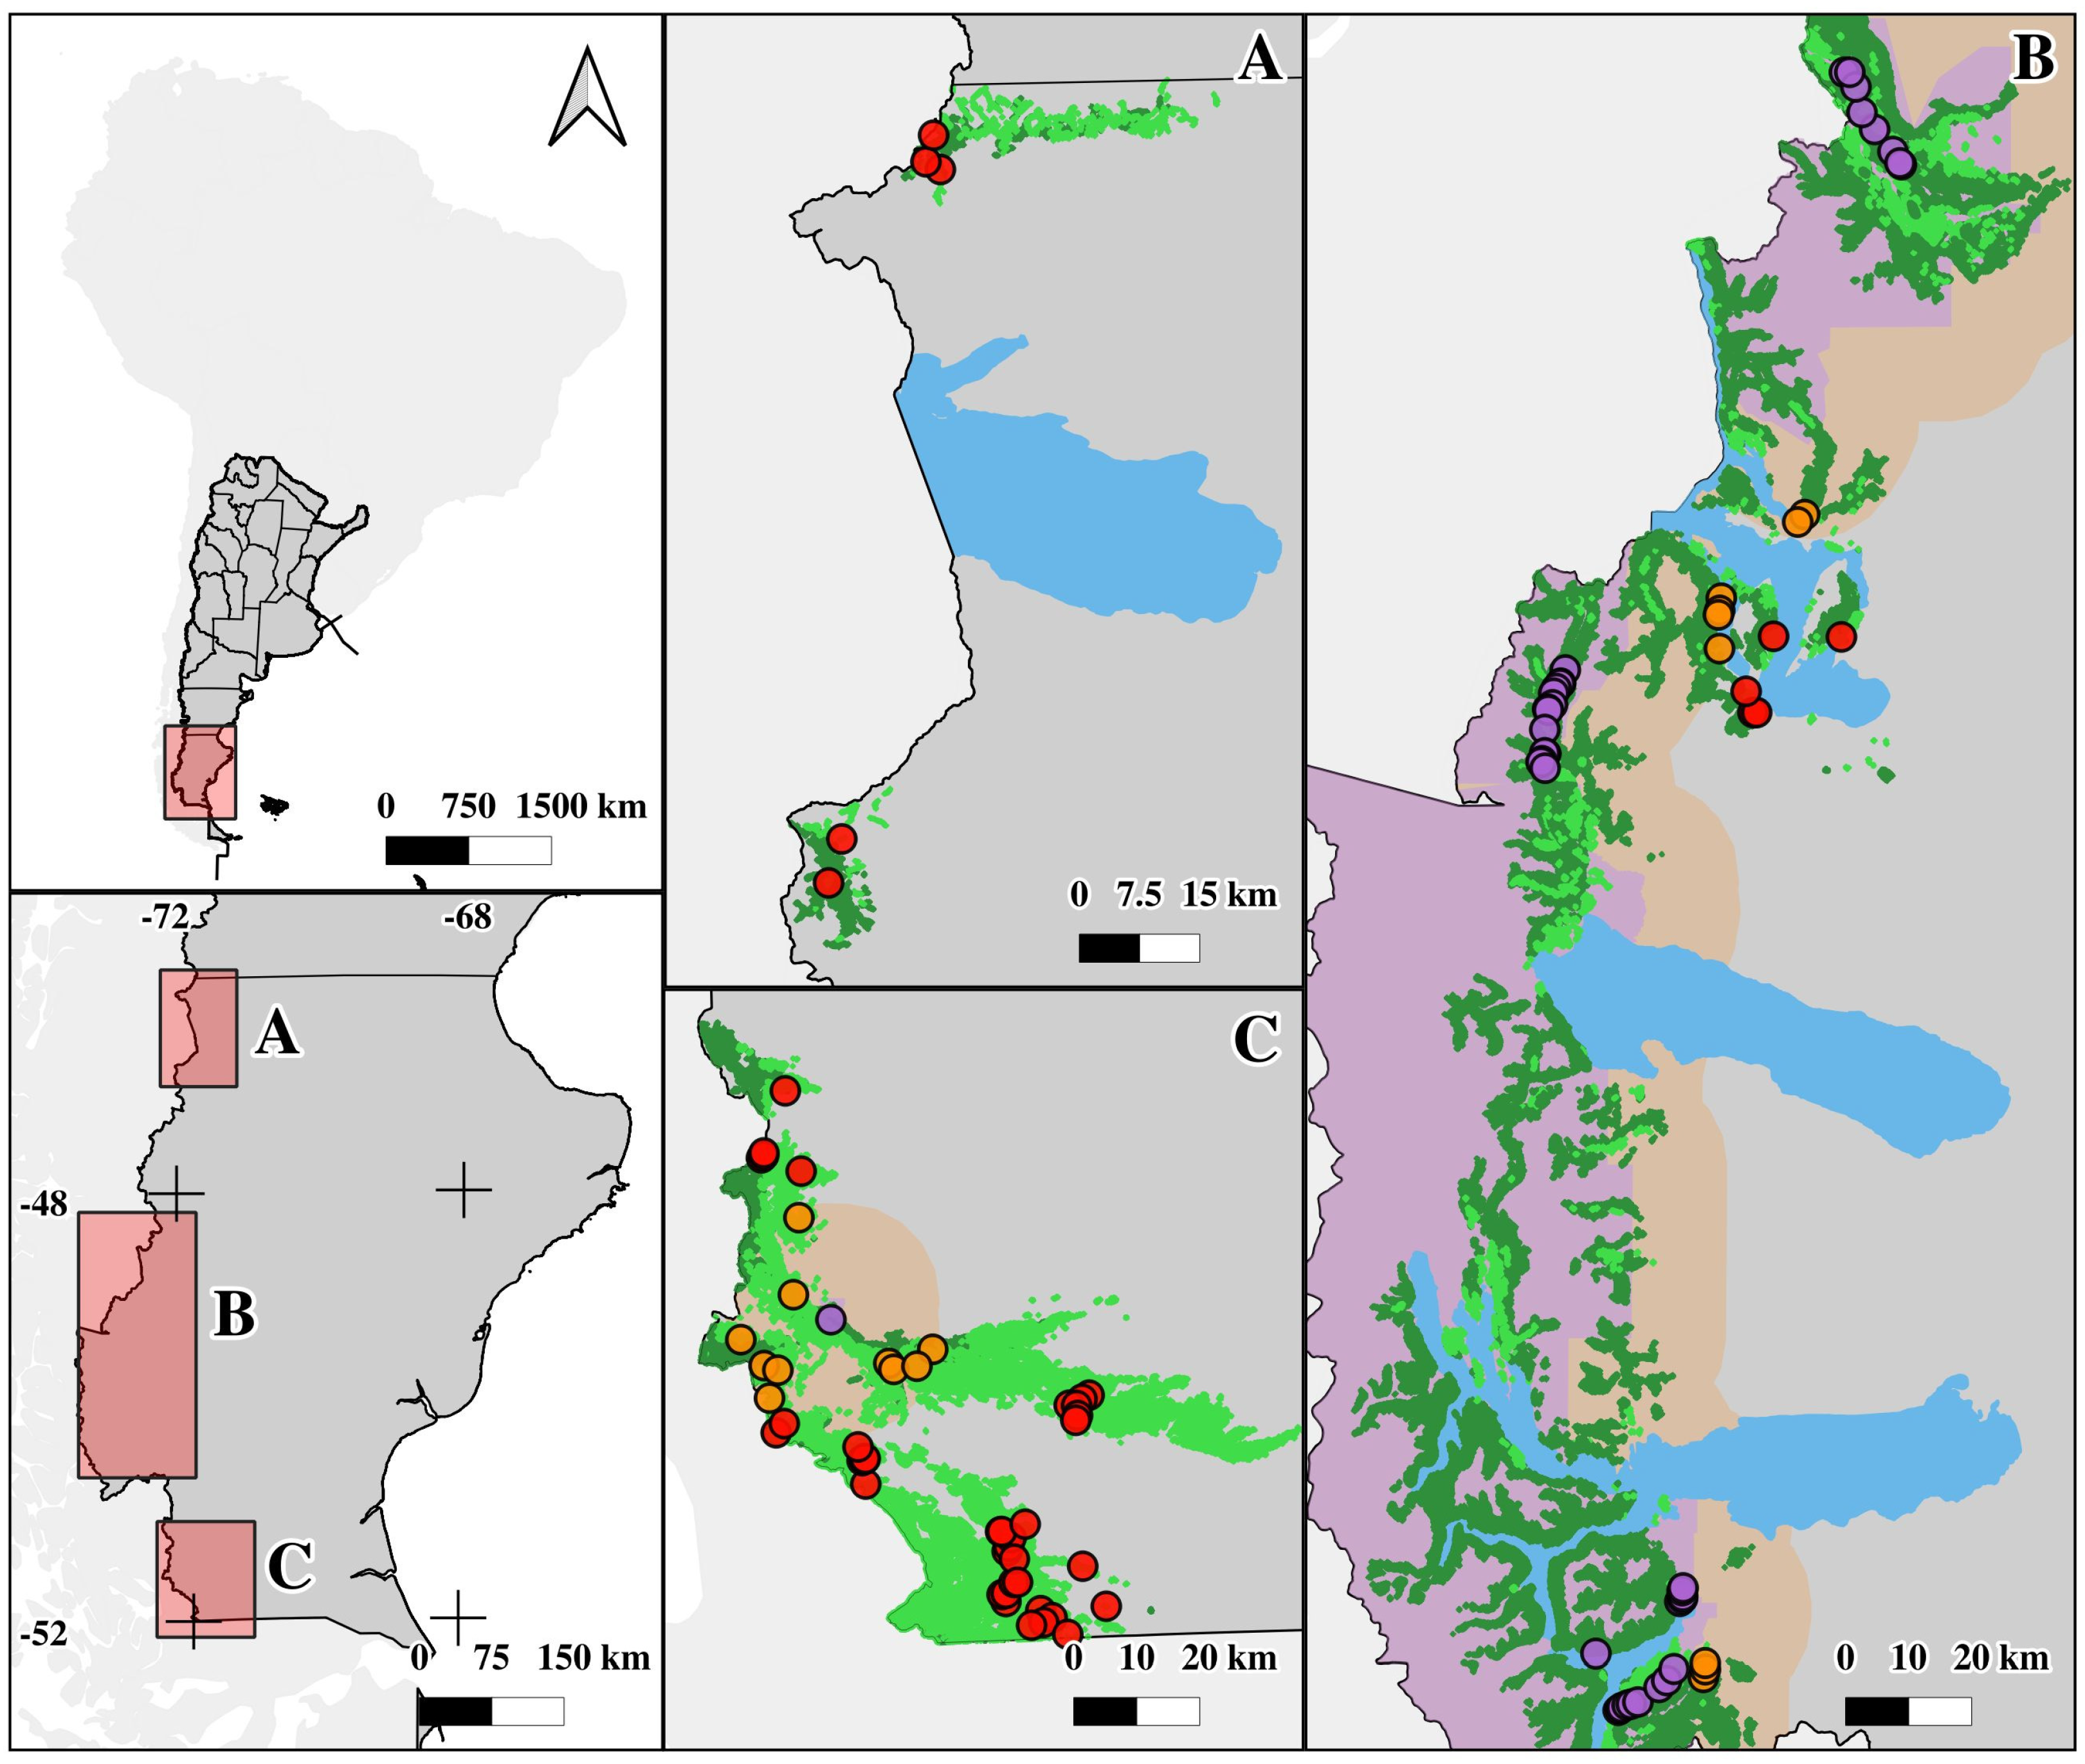
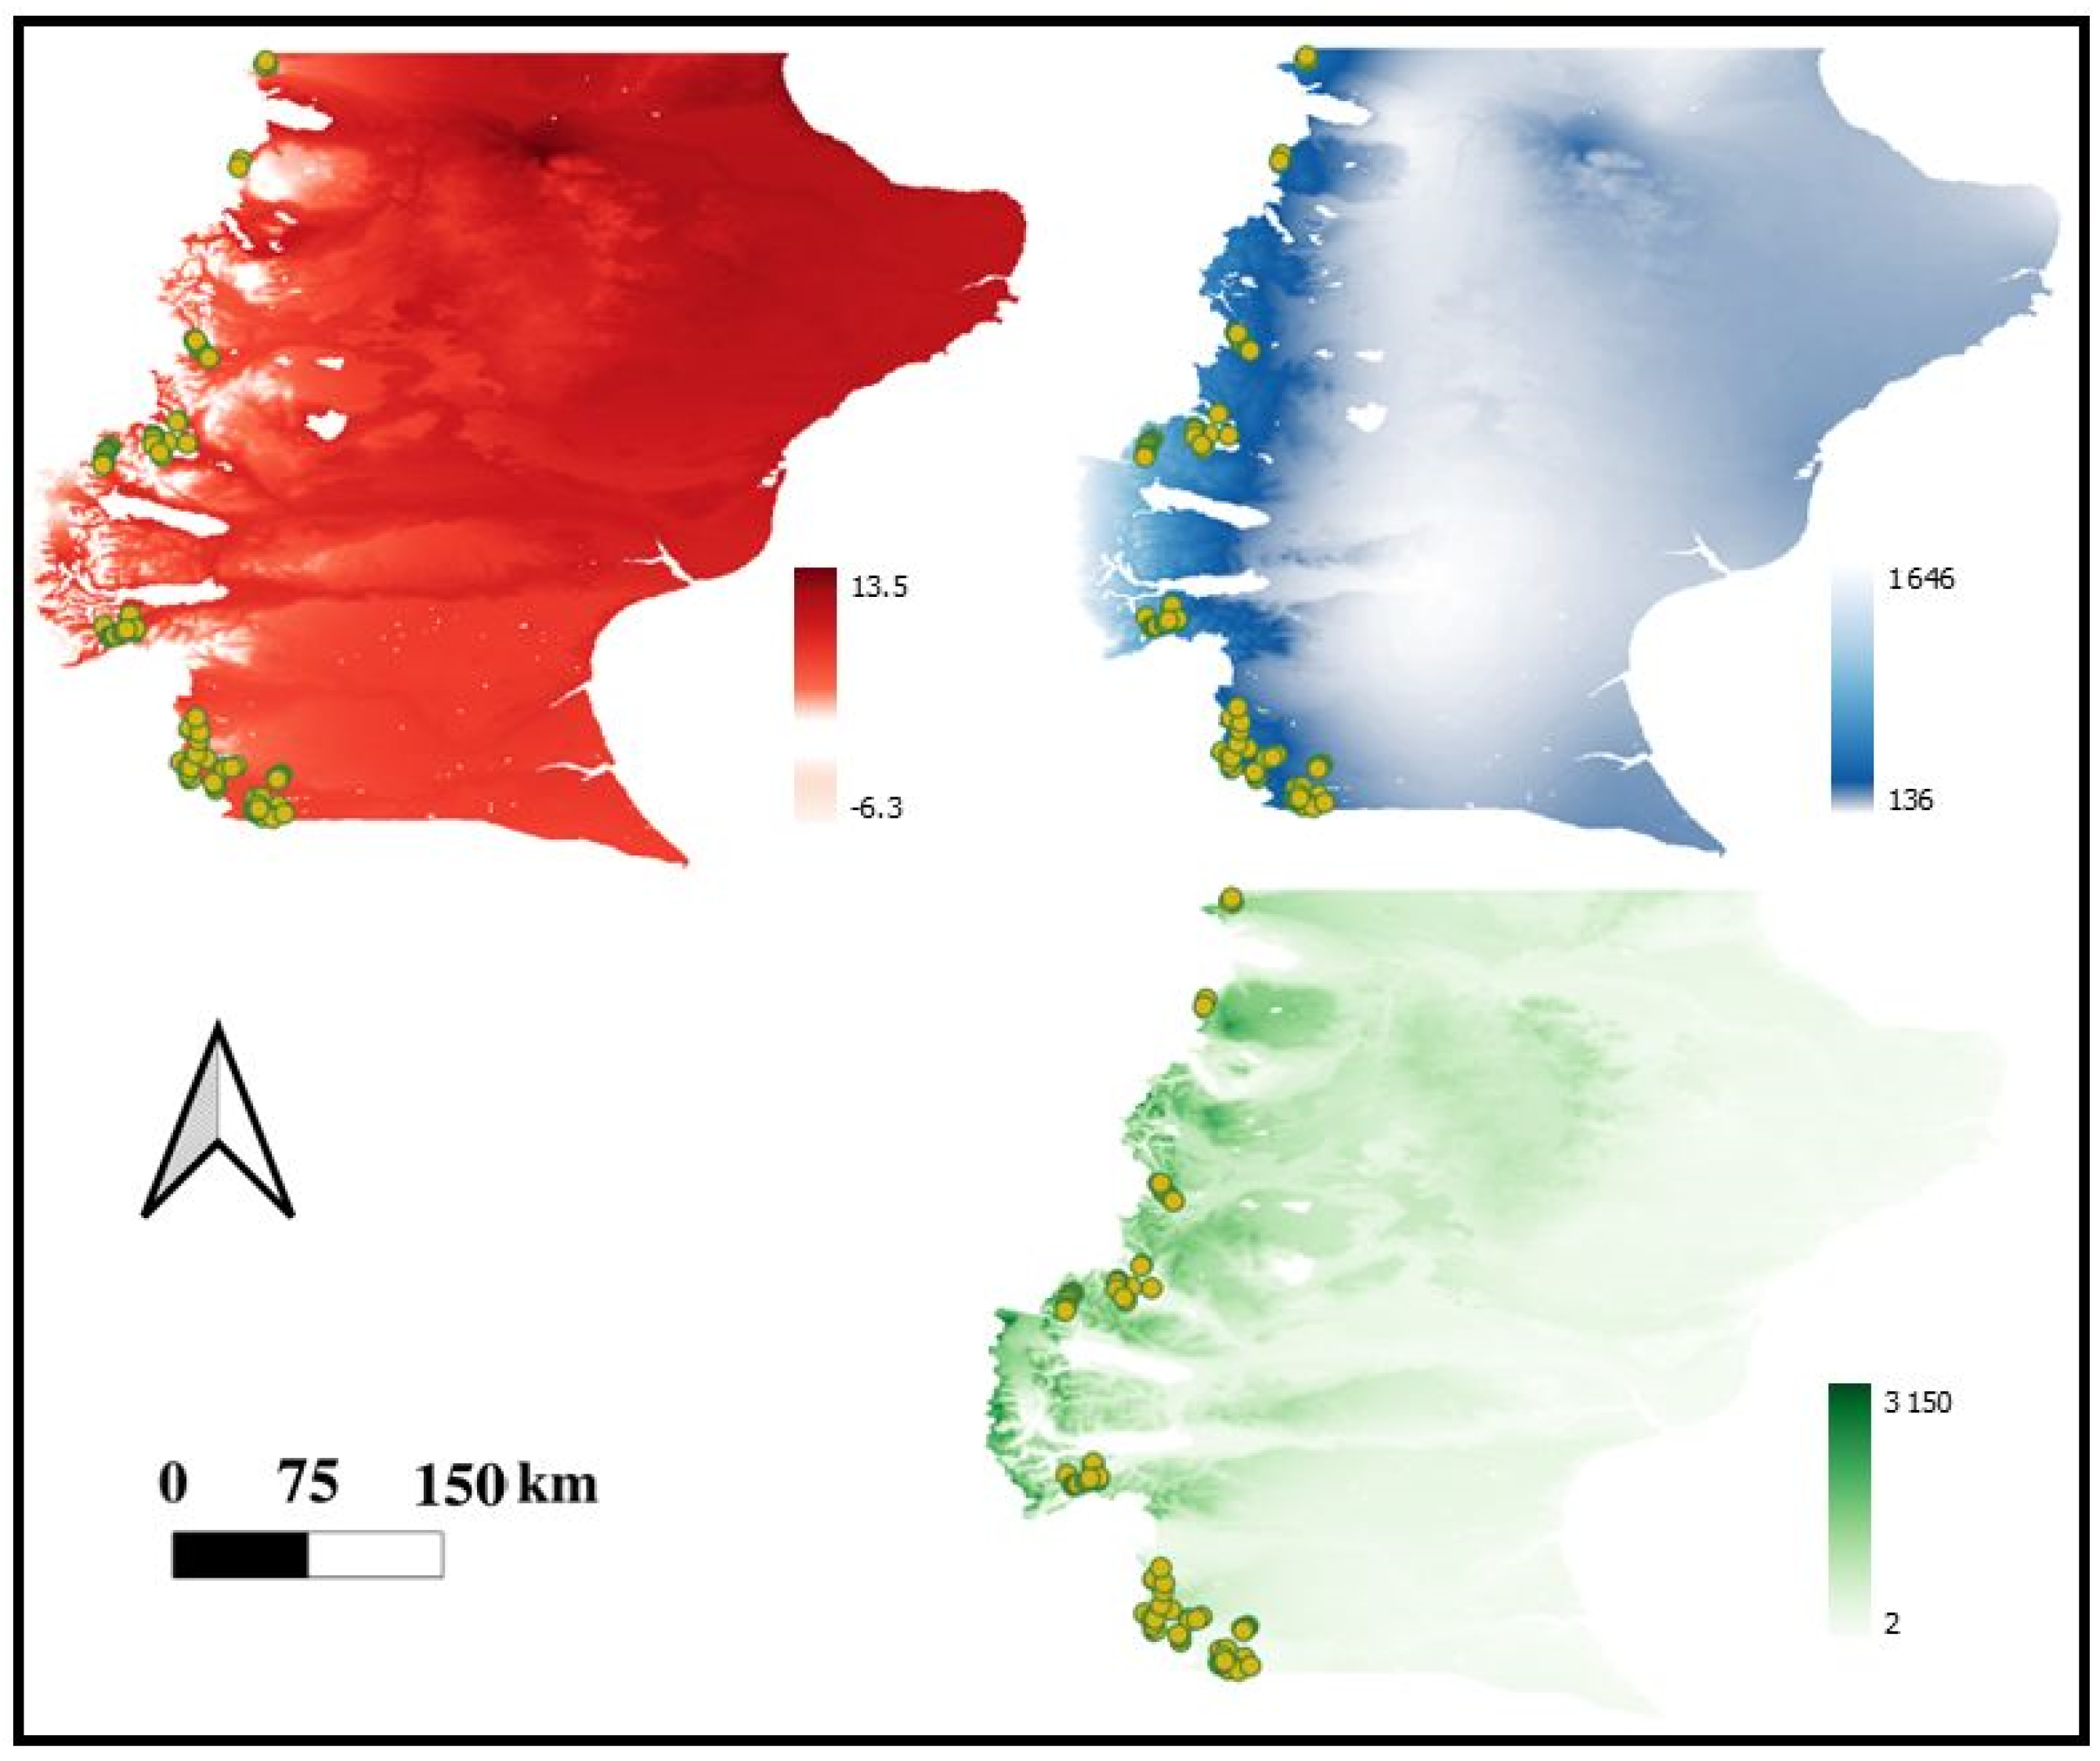
The study area comprises pure N. antarctica forests across Santa Cruz province (Argentina). These forests exhibit different structural conditions (even-aged or uneven-aged), depending on natural disturbances (e.g., windstorms) and anthropogenic impacts over the last century (e.g., wildfires, logging, pastures, and livestock grazing) [18,19]. A total of 103 stands (Figure 1), each with >2 ha of homogeneous forest structure, were sampled, representing the environmental heterogeneity presented within PAs (National Parks and Provincial Reserves) and private areas, e.g., farms with livestock operations. A 15 km buffer zone was defined from the PA boundary, which was used to classify private area stands into the private-land and buffer-area categories (Figure 1). The buffer size was arbitrarily defined following some previous studies in the literature, e.g., [8,18,19]. We presented the natural gradients across the study area and sampling stands (Figure 1A).

2.2. Data Taking and Data Analysis

At each sampling unit (stand), a sampling plot consisting of a 50 m transect placed in a random direction was established. Stands that had been harvested were identified by the presence of stumps resulting from cuts applied with different intensities (H–Int) (0 = no harvesting, 1 = light harvesting, 2 = heavy harvesting, and 3 = clear cutting). Fire impact was recorded in stands showing substantial alterations to their original forest structure caused by fires of varying magnitudes and intensities (F–Int) (1 = less than half of the trees were burned, 2 = half of the trees were burned, 3 = all trees were burned). The occurrence of harvesting (H–O), fires (F–O), and animal use (A–O) was calculated as the number of plots in which the impact was recorded relative to the total number of plots classified within each tenure status. Decay of coarse woody debris was very low at these higher latitudes, requiring long-term periods to disappear from the forests (e.g., higher-diameter healthy logs required more than 400 years); for this, the presence of stumps, logs, and coarse wood debris resulting from harvesting or fires are a good indicator [18,19]. When it was possible, we supported the characterization of each impact through existing management plans, fire events, and stakeholder comments. Regeneration was recorded at every meter along 50 m transect, allowing us to calculate the regeneration cover (CAN, %). At the 10 m and 40 m points of each transect, forest structure was characterized using Bitterlich angle-count sampling (K = 3–5) [36]. The diameter at 1.3 m height (DBH), vigor (1–3, with 3 representing the highest vitality), and development phase based on bark characteristics following the classification used by Martínez Pastur et al. [22] were registered for each tree. Additionally, tree crown classes were assigned based on light capture (dominant, co–dominant, intermediate, and suppressed) [37]. Each angle-count measurement point was associated with a dominant height value (measured with a TruPulse 200 rangefinder, corresponding to the tallest tree at each subplot), and these were averaged to obtain dominant height per stand (DH, m). Using these data, basal area (BA, m2 ha−1), total over-bark volume (TOBV, m3 ha−1) [38], percentage of mature basal area (>100 years old, PBA–M), and average vigor per plot (VIG, 1–3) were calculated. Hemispheric photos (Nikon 35 mm with Sigma 8 mm lens) were taken at 10 m and 40 m of the transect to calculate canopy cover (CC, %) using Gap Light Analyzer v.2.0 software [39]. Height, density, browsing on initial regeneration (seedlings, <1.3 m height), and advanced regeneration (saplings, >1.3 m height and <5 cm DBH) were surveyed in two subplots, at the beginning and end of the transect, using 1 m2 for the initial regeneration and 5 m2 plots for the advanced regeneration. With this data, seedling density (DSE, thousand ha−1), sapling density (DSP, thousand ha−1), seedling height (HSE, cm), sapling height (HSP, m), and browsing damage in seedlings (BRW, %) were calculated.
To characterize the topsoil layer, we collected four soil samples along each transect using a hand soil sampler (0–30 cm depth) of known volume (200 cm3), after removing the litterfall. Samples were weighed before and after air-drying under laboratory conditions (60 °C) until a constant weight was achieved, obtaining the soil water content (SWC, %) and soil bulk density (SD, g cm−3), after coarse root debris and stones > 2 mm were removed by sieving. Samples were used to determine (i) soil acidity (pH) in a suspension (air-dried samples and deionized water) with a soil/water ratio of 1:2.5 [40], and (ii) total carbon (C, %) by dry combustion analysis (muffled at 500 °C for 24 h) [41] and modeling [42]. Using the values of SD and C, the soil organic carbon content (SOC, t ha−1 at 30 cm depth) was calculated.
Dung counts were performed, distinguishing between herbivores, in a 4 × 50 m plot along the transect (200 m2). This was used as a proxy for livestock occurrence (animals ha−1) following Martínez Pastur et al. [42]. For hares (Lepus europaeus) we used a defecation rate of 410 droppings per day, a dry matter forage requirement of 24 kg DM year−1, a residual palatable biomass of 130 kg DM ha−1, and a sheep equivalent (SE) of 0.075. With this data, we determined herbivore occupation, discriminating guanacos (Lama guanicoe, LG, SE ha−1), hares (LE, SE ha−1), sheep (SHE, SE ha−1), cattle (CAT, SE ha−1), horses (HOR, SE ha−1), domestic livestock (LIV, SE ha−1), and total herbivorous (TSD, SE ha−1). For the considered land tenure statuses, the occurrence of animal use (A–O) was calculated as the number of plots in which this impact was recorded out of the total plots classified within that status. For the occurrence of animal use, values less than 0.5 SE were considered as zero. The impact intensity of animal use (A–Int) was calculated by averaging domestic livestock loads.
An index evaluating the overall diversity of impacts (IMP) on forests was constructed by averaging the intensity of harvesting, fire, and livestock impacts. Samples of understory aerial biomass were also collected in sampled plots (0.25 m2) associated with each transect, cutting above-ground vegetation (ground level to ≤1.3 m height) (UAB, kg ha−1). Vegetation samples were manually classified into palatable and non-palatable species after oven-drying at 60 °C to constant weight and then weighed to obtain the palatable biomass (UPB, kg ha−1). Additionally, average understory height was measured. Using the palatable biomass value, the potential livestock occupation (POT) in sheep equivalents per hectare was calculated. Three additional indices were constructed to group the analyzed variables by topic (forest, soil, and animal use) and were then used to compare conservation status. Values were standardized between 0 and 1 and averaged within each index to obtain a value per plot. Variables considered positive were kept in their original form, while negative variables were inverted by subtracting them from 1 (Table A1). These values were then averaged by status for the final outputs. The variables included in the indexes were classified into positive (assigned positive values) or negative (assigned negative values) structural attributes considering the reference forests (complete density and without previous human impacts). The forest index (FI) included dominant height, canopy cover, basal area, total over-bark volume, percentage of mature basal area, vigor, regeneration cover, seedling density, seedling height, sapling density, and sapling height, with all these variables considered positive. The soil index (SI) included soil water content, pH, soil total carbon, and soil organic carbon content, which were all considered positive, and soil bulk density, which was considered negative. Finally, the animal use index (AI) included direct animal load measurement variables and indirect measurements based on the understory, including height, total biomass, palatable biomass, potential livestock (SE), and guanaco (SE), all considered positive, and browsing percentage, hare (SE), sheep (SE), cattle (SE), horse (SE), domestic livestock (SE), and total herbivorous (SE), all considered negative. Values close to 1 in the FI indicate forests with the highest structural attributes of mature unmanaged forests. For the SI, higher values represent soils with the best development occurring in mature unmanaged forests, while higher AI values indicate greater ecosystem integrity regarding animal use intensity, e.g., higher AI corresponds to lower domestic animal use, as is expected in mature unmanaged forests. Based on the premise that a PA is effective when it is managed to conserve ecosystem integrity across territories and ecosystem types [43], ecosystem integrity was evaluated using the generated indices, with values of 1 representing the highest levels of conservation for forest structure, soil, and animal use. The different dimensions and variables employed in the analyses can vary in their importance depending on the management and conservation objectives. For this, we decided to use equal weighting for all the variables, including those variables that did not present significant differences, which were considered as equally important to those that were statistically different. Finally, the Pearson correlation coefficient (−1 to +1) and significance (p-value) were obtained for each index.

2.3. Statistical Analysis

Data was analyzed by one-way analysis of variance (ANOVA) and pairwise mean comparisons using Tukey’s test, with Statgraphics Centurion XVI software [44]. Thirty-five ANOVAs were performed (one for each variable: H–Int, F–Int, A–Int, IMP, DH, CC, BA, TOBV, PBA–M, VIG, CAN, DSE, HSE, DSP, HSP, SD, SWC, C, SOC, pH, UH, UAB, UPB, BRW, POT, TSD, LG, LE, SHE, CAT, HOR, LIV, and AI), considering different land tenure status (PL, BL, and AP) as the main factors. All the individual ANOVAs achieved normality according to their skewness (−2 to +2).

3. Results

3.1. Analysis of the Impacts Across the Landscape

Occurrence and intensity of fire, harvesting, and livestock impacts do not vary according to the conservation status of the stands (Table 1). Despite the lack of significant differences, private lands showed the highest values for fire occurrence (FO) and fire intensity (F–Int) and the lowest values for harvesting occurrence and harvesting intensity. Private buffer lands (BLs) presented the highest values for harvest occurrence and intensity (HO and H–Int) and animal use (A–O and A–Int). However, they showed fire occurrence and fire intensity values like those of protected areas, and lower than those recorded in private lands. In the status categories where the highest values of impact occurrence were recorded, the highest impact intensities were also observed. PA had the lowest impact values (IMP), while private buffer lands showed the highest. Regarding intensities, compensatory patterns were observed. For example, PL areas with higher fire intensity showed lower harvesting and animal use intensities; BL areas had higher animal use and harvesting intensity but lower fire intensity; and PAs recorded intermediate values for harvesting and animal use intensities but lower fire intensities; however, no significant differences were found for the overall impact index (Table 1).

3.2. Forest Structure and Regeneration Variables

Forests in PLs exhibited the lowest values for DH, CC, BA, TOBV, VIG, and HSP (Table 2), contrasting significantly with PAs, which displayed the highest forest structural values. Seedling density showed a significant inverse response, with the highest value in PLs and the lowest in PAs. The distribution of development phases was analyzed using the PBA–M variable, considering trees >100 years old. No significant differences were found among forest land tenures, although in all cases, more than 75% of the basal area was represented by mature trees. Similarly, N. antarctica regeneration cover, seedling height, and sapling density showed no variation among land statuses. The forest index (FI) showed significant differences among the three groups: PA > BL > PL. Although protected areas showed high values for H–O and H–Int, they also exhibited higher values for the forest structure variables (DH, CC, BA, and TOBV). Forests growing in buffer zones, which had harvesting values like those inside the protected areas, displayed a reduction in their FI. In contrast, forests on private lands, which had lower FI values, also showed lower harvesting impacts.

3.3. Soil Variables

The soil variables (Table 3) showed significant differences, except for pH. Higher soil bulk densities were found in PLs, while the lowest values were observed in PAs. SWC, C, and SOC presented lower values in PLs, and higher values in PAs for SWC and in BLs for C and SOC. The soil index (SI) showed significant differences, following the order PA = BL > PL. Private lands were the most affected by fire occurrence and intensity, which may explain the lower SI values. Specifically, private lands with the lowest FI values coincide with the lowest SI values. However, this trend was less distinct in buffer zones and protected areas; while both fell into the same SI group with the highest values, they differed in terms of FI, with protected areas exhibiting higher values. The areas most affected by fire occurrence and intensity (PL) are those that exhibit the lowest SI values.

3.4. Understory Vegetation and Animal Use Variables

For direct and indirect animal use variables (Table 4), significant differences were found for UH and SHE. For UH, the highest values were observed in PAs and the lowest in PLs, while for SHE, the lowest values were found in PAs and the highest in PLs. Palatable biomass (UPB) and POT showed marginally significant differences, being higher in PAs and lower in PLs for both. No significant differences were found for UAB, BRW, TSD, LG, LE, CAT, HOR, or LIV. The animal use index (AI) showed significant differences, distinguishing two groups and one with intermediate values, following the order PA > BL > PL; this corresponds to lower domestic animal use in protected areas. This finding aligns with the A–O value, which, despite being the lowest, was like that found in unprotected buffer zones, as well as with the intermediate A–Int value. Although only SHE showed significant differences among the direct animal use variables (TSD, LG, LE, SHE, CAT, HOR, and LIV), browsing values (BRW) on regeneration were lower in PA. In turn, this could explain the greater heights of HSP and UH observed in PA. Conversely, in areas with higher animal presence (PL), indicated by the lowest AI, we observed poorer soil conditions, as reflected by the SI.

3.5. Index Comparison Among Protected Areas, Buffer Areas, and Private Lands

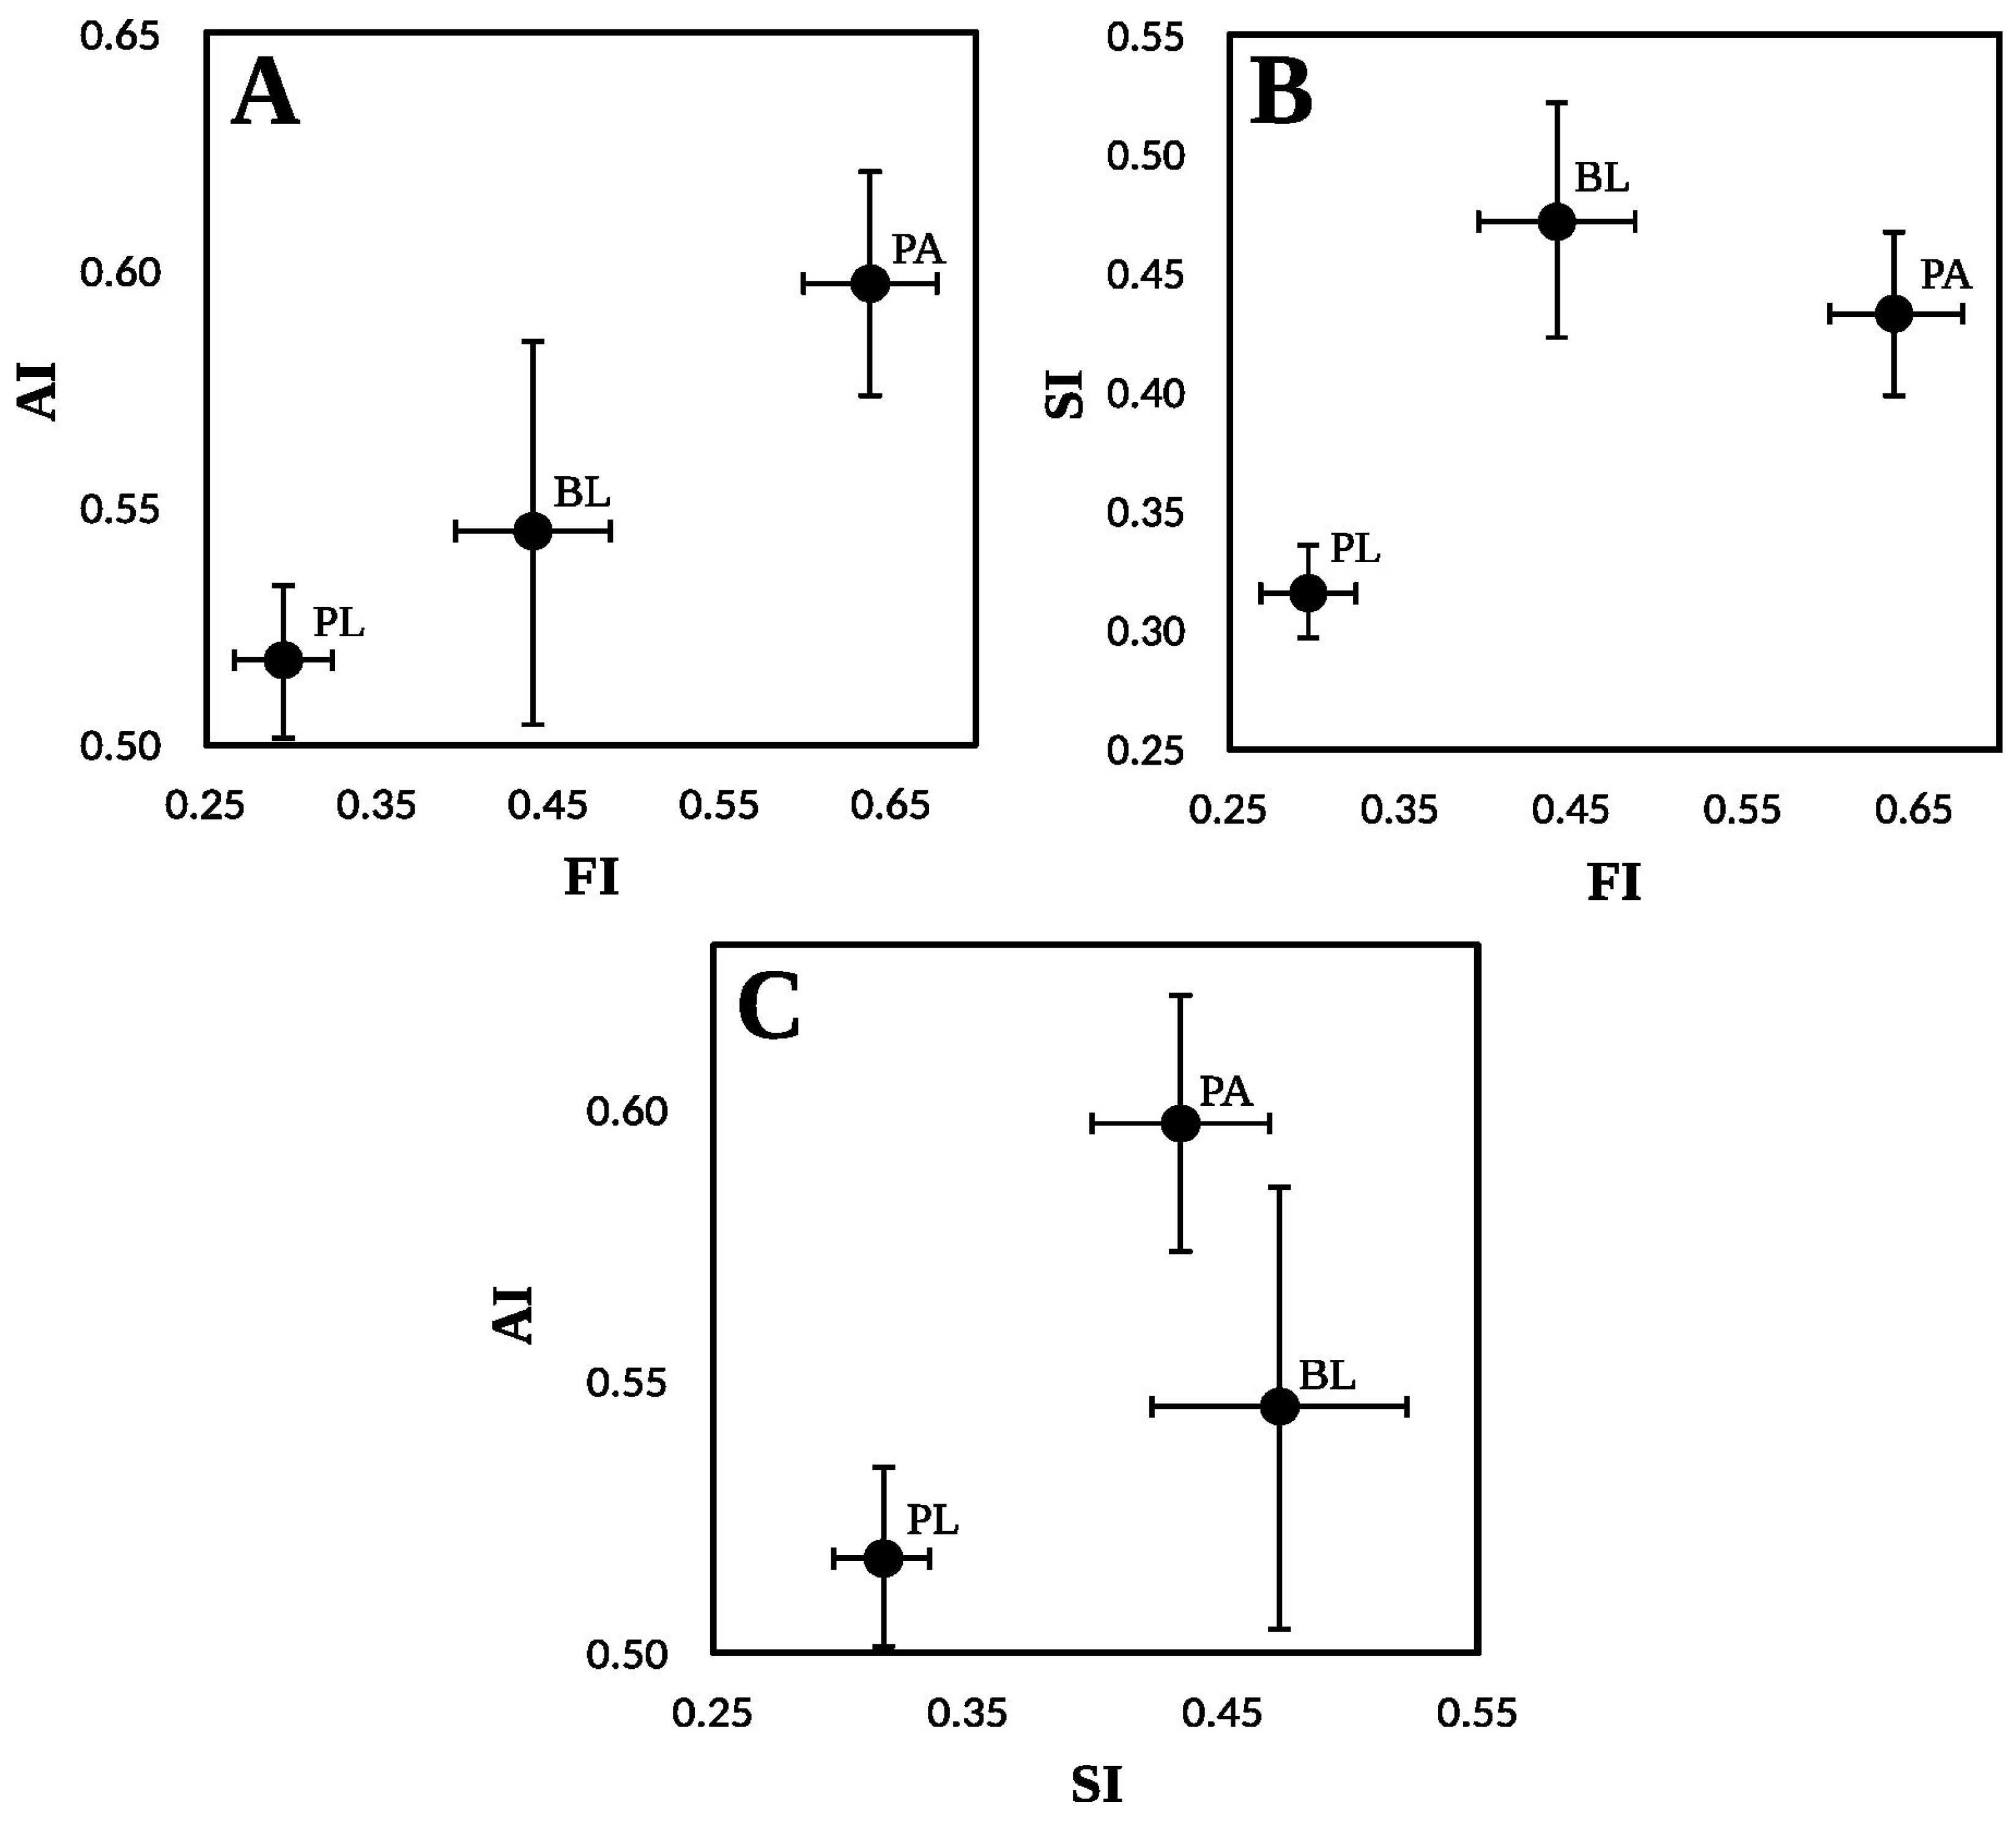
The indices allowed us to examine relationships among soil properties, forest structure, and animal use. Variables were partially correlated among them (Pearson correlation coefficient and p-value for FI are presented in Table A2; for SI, in Table A3; and for AI, in Table A4) and must be considered to understand the obtained indexes. In all cases, BLs exhibited the highest heterogeneity, with greater variability than PLs and PAs, positioning it as an intermediate condition between the two (Figure 2). Considering BL forests as intermediate between the protection levels of PAs and PLs, PAs consistently showed the highest FI and AI values (Figure 2A). The soil index revealed two distinct groups: PLs, and BLs together with PAs; however, along the FI axis, three groups emerged clearly, with buffer zones occupying an intermediate position (Figure 2B). The animal use index highlighted similarities between private lands and buffer zones, as well as between buffer zones and protected areas, while also distinguishing PLs from PAs. When considered alongside the soil index, areas with higher integrity in terms of animal use (PAs and BLs) also exhibited superior soil characteristics, reflected in higher SI values (Figure 2C).

4. Discussion

Although protected areas (PA) benefit from their formal protection status, impacts from harvesting, animal use, and fire were observed within the sampled areas, which is consistent with studies describing the occurrence and management challenges of fires within PA in Chile [45]. Many of these impacts (e.g., harvesting) occurred before the creation of NP and PR, and changes in the forest structure survive to date. In addition, most of the fires were intentional, aiming to open areas for pastures to provide grazing for livestock [46]. Fires linked to agricultural activities are also a significant issue in other regions, such as Serbia, where they affect PAs, including the Special Nature Reserve Carska Bara [47]. Added to this is animal browsing, which limits efficient regeneration due to high animal stocking rates [48]. Faúndez Pinilla et al. [45] report fires that affected PAs but originated outside their administrative boundaries, highlighting the importance of considering activities within buffer zones [49,50]. Such vulnerability at the boundaries is consistent with Sarkar et al. [51], who argue that National Park edges are prone to resource extraction. Therefore, establishing large PAs becomes crucial to minimizing these edge effects, as they provide a better surface-to-volume ratio [52]. This strategy facilitates the preservation of pristine core areas, consistent with observations in broadleaved, coniferous, and mixed forests in China [53], where optimal wildlife habitats were found exclusively in the deep interior of PAs. Our results showed that the highest intensity and occurrence of forest harvesting and livestock use were found in the buffer areas [54]. This may reflect the effectiveness of PAs in limiting these activities within their boundaries [55], though not completely, highlighting the need for increased efforts to exclude such impacts inside PAs [56]. Likewise, attention to buffer areas is important, as the effects of these activities can be displaced toward PAs, such as through fires or livestock movements [57]. Similarly, Sarkar et al. [51] documented various illicit activities (e.g., timber extraction for firewood or fencing, livestock grazing, wildlife hunting, and the harvesting of plants and wetland reeds for traditional use) occurring within Kibale National Park in Uganda. Crucially, it must be acknowledged that many of these productive practices predate the establishment of PAs and their subsequent implementation, monitoring, and effectiveness evaluation [56]. These activities leave a lasting ecological footprint, necessitating long-term efforts to reverse their effects and ensure the efficacy of exclusion measures [53]. This indicates that the presence of domestic livestock has constituted a persistent challenge for PA in Argentina over recent decades [58,59]. However, this is a global conservation issue also observed in other reserves, e.g., Giant Panda National Park. As noted by Li et al. [53], the persistence of livestock is attributed to the significant effort required for exclusion, which involves both logistical constraints and potential territorial conflicts among stakeholders. Given that forests characterized by lower harvesting occurrence and intensity are located within productive private lands, the need to integrate protection measures into land-sharing approaches becomes evident [60,61]. Furthermore, N. antarctica forests within PA exhibit the highest forest structure values, despite the impacts described before. This showed the resilience of these ecosystems and their capacity for structural recovery following different disturbance types [62,63]. Conversely, this analysis can be influenced by natural environmental gradients; specifically, higher site quality was found near mountain ranges, declining towards the provincial interior within the ecotone [64]. For this, NPs can present higher site quality values; however, some PRs are mainly located in ecotone areas. In this work, we try to maintain a balance of samples among the different treatments. Some differences can be influenced by the uses (e.g., volume) but others can be related to landscape location (e.g., dominant height). Our results indicate that the areas selected for PAs, while demonstrating resilience in meeting conservation objectives, have primarily preserved N. antarctica forests, which were characterized by the highest forest structure values, such as dominant height, canopy cover, total volume, and basal area [65]. The highest initial N. antarctica regeneration densities were recorded on private lands. This trend may be attributed to lower stand density (lower canopy cover) due to past impacts, which enhances light availability and minimizes competition for soil resources [66,67]. Consequently, the lower regeneration values observed in PAs, where canopy cover is higher, are consistent with these ecological dynamics [68]. This finding further highlights the resilience of N. antarctica forests, including those located in sites of lower quality and those subjected to disturbance. Conversely, significant differences were observed in sapling heights, likely attributable to greater animal use intensity, as evidenced by higher browsing events [69,70]. Regarding soil parameters, forests conserved within PAs, along with those in buffer zones, were associated with the highest soil index values, characterizing soils with lower bulk density, higher water content, and mean SOC and C levels [42]. This trend may be attributed to the greater exposure of unprotected lands to disturbances, as well as the land-use history in areas where forests were cleared for livestock grazing [34,71]. The observed SOC levels partially align with the distribution described by Martínez Pastur et al. [72], who reported an increasing carbon content gradient from the east to west across Patagonia. Consistent with their analysis, the peak SOC values found in the buffer zone may be explained by topographic or climatic drivers, wherein lower temperatures, higher precipitation, and higher elevations favor SOC accumulation. Water content is higher in PAs, a pattern likely attributed to canopy cover, as observed by Koelemeijer et al. [73], who noted that cover levels characteristic of primary forests exhibit the highest percentages of soil moisture and water storage [74]. This suggests that forest structures within PAs are better preserved. Similarly, while sites located in the mountain range receive higher precipitation [75], this input is also intercepted by the tree canopy [76]. In Nothofagus forests of Santa Cruz, ecosystem services and biodiversity are positively correlated with forest cover [18]. Consequently, the observed increase in cover from private lands to PAs suggests that conservation lands are situated in locations where the forest possesses the greatest potential to harbor biodiversity and provide ecosystem services [77]. Furthermore, according to Rosas et al. [18], N. antarctica forests exhibit a significant prevalence of potential trade-off areas, indicating that this species is crucial for both provisioning ecosystem services and biodiversity conservation. This duality raises significant challenges for forest protection [78,79], as impacts from harvesting and livestock use persist even within PAs. In addition, as ecotonal N. antarctica forests are situated closer to the steppe than to the cordillera, the study emphasizes their importance for livestock production, specifically through the combined provision of forage and shelter [80]. Consequently, these environments warrant special attention as potential sites for future conservation initiatives or the establishment of new formal reserves [81]. Upon comparing the indices, specifically the animal index (AI) and the forest index (FI) (Figure 2A), it is observed that forests within buffer zones exhibit greater similarity to private lands than to PAs. Based on the preceding discussion, it is determined that PAs are effective in mitigating animal use (specifically through the exclusion of sheep grazing), thereby enhancing ecosystem integrity [53], as well as in maintaining forest structural integrity [82]. This preservation safeguards forests’ potential to sustain both biodiversity and ecosystem services [25]. Regarding the forest index (FI) and the soil index (SI), forests within buffer zones cluster closer to PAs than to private lands. These distinctions are primarily driven by understory height and sheep stocking density. The former is higher in PAs and BLs, whereas the latter exhibits a decreasing gradient from PLs to PAs. These variables are interrelated, as animal stocking density is the principal factor negatively affecting understory height [83]. This indicates that soil conditions in buffer zones are comparable to those in PAs. Furthermore, when analyzing the relationship between the animal index and the soil index, forests in PAs and BLs are observed to exhibit superior soil conditions alongside better conservation status regarding animal use. Even though soil supports ecosystems, soil conservation via protected areas is still lacking [84].
This study showed that PAs present different conservation values compared to private lands, whereas buffer areas present intermediate values. These outputs are significant when management proposals for PAs (NPs and PRs) are implemented at the landscape level. Usually, these proposals leave aside the surrounding private lands, but their ranching activities can influence conservation areas, reducing the efficiency of the PA. For this, it is important to change the current strategy and modify current legislation to expand the benefits of the implementation of PAs through the inclusion of stakeholders in management and conservation initiatives at the landscape level.

5. Conclusions

The effectiveness of PAs in Santa Cruz (Argentina) was quantitatively assessed in comparison to private lands and buffer areas considering their impact of fires, animal use, and harvesting. Contrary to our first hypothesis, PAs presented impacts that occurred before their creation; however, forest structure was recovered as well as the associated variables. This recovery gradually decreased from buffer areas to unprotected areas. Furthermore, while fire incidence was lower, such events still occurred across the landscape. Our second and third hypotheses were accepted, where PA presented better conserved forest structure and recovery (e.g., seedlings and saplings), and where private lands led to negative impacts on soil. Nevertheless, PA successfully preserved the integrity of forest structure and vegetation (regarding animal use and changes in soil properties associated with impacts and ecosystem recovery) when compared to buffer zones (15 km) and private lands without clear conservation legislation. Finally, PAs experienced lower herbivory pressure on the understory due to land-use restrictions; however, livestock still had an impact inside protected areas. Buffer zones acted as an effective transitional area between unprotected private lands and protected areas in NPs and PRs. In all analyses, PAs were clearly distinct from private lands. However, sustained action in livestock exclusion, harvest regulation, and fire management remains necessary, as these impacts persist within protected areas to date. Ongoing management measures, particularly monitoring and fire control, are essential for future sustainable planning at the landscape level.

Author Contributions

Conceptualization, R.L.A., J.R.-S., P.L.P. and G.M.P.; methodology, J.R.-S., J.M.C. and G.M.P.; software, N.N.C.; validation, R.L.A. and J.R.-S.; formal analysis, R.L.A.; investigation, N.N.C.; resources, J.R.-S. and G.M.P.; data curation, N.N.C. and F.F.; writing—original draft preparation, R.L.A. and J.R.-S.; writing—review and editing, N.N.C., J.M.C., M.V.L., F.F., P.L.P. and G.M.P.; visualization, R.L.A.; supervision, G.M.P.; project administration, P.L.P. and G.M.P.; funding acquisition, P.L.P. and G.M.P. All authors have read and agreed to the published version of the manuscript.

Funding

This research was funded by Fundación Williams, “Umbrales de resiliencia de los bosques de Nothofagus frente a disturbios antrópicos en la provincia de Santa Cruz (Argentina)”, Fondos Complementarios para Proyectos de Investigación con Impacto en el Territorio Argentino 2024.

Data Availability Statement

Availability of data and material: At the CONICET (Argentina) repository.

Acknowledgments

We acknowledge technicians, scholars and ranch owners for their disinterested and unconditional help during the field work and laboratory analyses.

Conflicts of Interest

The authors declare no conflicts of interest.

Abbreviations

The following abbreviations are used in this manuscript:
A–IntAnimal use intensity
A–OOccurrence of animal use
AIAnimal use index
ANOVAAnalysis of variance
BLBuffer lands
DBHDiameter at 1.3 m height
DMDry matter
ESEcosystem services
F–IntFire intensity
F–OOccurrence of fires
FIForest structure index
H–IntHarvesting intensity
H–OOccurrence of harvesting
IMPImpact index
NPNational Parks
PAProtected areas
PLPrivate lands
PRProvincial Reserves
SESheep equivalent
SISoil index

Appendix A

Table A1. Variables employed in the construction of the different indices (FI = forest index, SI = soil index, AI = animal use index) and their directionality. Positive values (+) indicate that an increase in the variable will increase similarity to the variable as found in mature unmanaged forests, while negative (−) values indicate that a decrease in the variable will increase similarity to the variable as found in mature unmanaged forests.
AbbreviationMeaningDirectionalityIndex
BABasal area+FI
CANRegeneration cover +FI
CCCanopy cover+FI
DHDominant height+FI
DSESeedling density +FI
DSPSapling density+FI
HSESeedling height+FI
HSPSapling height+FI
PBA–MMature basal area+FI
TOBVTotal over–bark volume+FI
VIGVigor+FI
CTotal carbon+SI
pHSoil acidity+SI
SDSoil bulk densitySI
SOCSoil organic carbon content+SI
SWCSoil water content+SI
BRWBrowsingAI
CATCattle stocking density AI
HORHorse stocking density AI
LELepus europaeus stocking density AI
LGLama guanicoe stocking density +AI
LIVTotal livestockAI
POTPotential livestock occupation+AI
SHESheep stocking density AI
TSDTotal herbivorousAI
UABUnderstory biomass+AI
UHUnderstory height+AI
UPBPalatable biomass+AI
Figure A1. Natural gradients of average annual temperature (°C) in red, annual rainfall (mm yr−1) in blue, and elevation (m.a.s.l) in green. Data was extracted from WorldClim global database (1970–2000) and from digital elevation model derived from a radar image from the Shuttle Radar Topography Mission [85,86].
Land 15 00178 g0a1
Table A2. Pearson correlation coefficient (−1 to +1) and significance (p-value) between brackets for variables of the forest index (Table 2).
CCBATOBVPBA−MVIGCANDSEHSEDSPHSP
DH0.7260.6350.7960.0080.525−0.413−0.243−0.113−0.1730.461
(<0.001)(<0.001)(<0.001)(0.934)(<0.001)(<0.001)(0.013)(0.274)(0.080)(<0.001)
CC 0.8730.842−0.1850.526−0.321−0.183−0.188−0.0580.568
(<0.001)(<0.001)(0.062)(<0.001)(0.001)(0.065)(0.068)(0.561)(<0.001)
BA 0.940−0.0540.490−0.395−0.159−0.363−0.2150.520
(<0.001)(0.588)(<0.001)(<0.001)(0.109)(<0.001)(0.029)(<0.001)
TOBV 0.0450.526−0.380−0.185−0.296−0.2150.504
(0.651)(<0.001)(<0.001)(0.061)(0.004)(0.029)(<0.001)
PBA–M −0.146−0.2000.081−0.241−0.288−0.345
(0.141)(0.043)(0.418)(0.019)(0.003)(0.003)
VIG −0.207−0.154−0.107−0.0100.414
(0.036)(0.121)(0.300)(0.919)(<0.001)
CAN 0.2650.3950.621−0.208
(0.007)(<0.001)(<0.001)(0.076)
DSE −0.0940.061−0.227
(0.367)(0.542)(0.052)
HSE 0.321−0.001
(0.002)(0.996)
DSP 0.005
(0.965)
Table A3. Pearson correlation coefficient (−1 to +1) and significance (p-value) between brackets for variables of the soil index (Table 3).
SWCCSOCpH
SD−0.655−0.811−0.462−0.046
(<0.001)(<0.001)(<0.001)(0.640)
SWC 0.419−0.0270.048
(<0.001)(0.795)(0.631)
C 0.7830.329
(<0.001)(0.001)
SOC 0.355
(<0.001)
Table A4. Pearson correlation coefficient (−1 to +1) and significance (p-value) between brackets for variables of the animal use index (Table 4).
UABUPBBRWPOTTSDLGLESHECATHORLIV
UH0.4110.402−0.1980.401−0.1790.165−0.062−0.251−0.128−0.031−0.180
(<0.001)(<0.001)(0.045)(<0.001)(0.070)(0.097)(0.535)(0.011)(0.197)(0.757)(0.069)
UAB 0.496−0.0840.496−0.179−0.051−0.080−0.104−0.148−0.109−0.178
(<0.001)(0.397)(<0.001)(0.070)(0.608)(0.421)(0.297)(0.136)(0.275)(0.072)
UPB 0.0111.000−0.019−0.101−0.123−0.047−0.005−0.029−0.017
(0.910)(<0.001)(0.849)(0.310)(0.215)(0.641)(0.962)(0.769)(0.863)
BRW 0.0100.169−0.0020.0360.2350.140−0.1540.169
(0.918)(0.088)(0.985)(0.715)(0.017)(0.160)(0.121)(0.089)
POT −0.019−0.103−0.126−0.048−0.004−0.032−0.017
(0.851)(0.302)(0.205)(0.631)(0.969)(0.751)(0.866)
TSD −0.0380.0120.1630.9760.0651.000
(0.700)(0.905)(0.100)(<0.001)(0.515)(<0.001)
LG 0.383−0.036−0.0560.115−0.050
(<0.001)(0.722)(0.577)(0.246)(0.618)
LE −0.083(<0.001)0.1650.001
(0.405)(0.997)(0.096)(0.992)
SHE −0.028−0.1120.164
(0.782)(0.259)(0.098)
CAT −0.0200.976
(0.838)(<0.001)
HOR 0.063
(0.530)

References

  1. Arora, N.K.; Mishra, I. Life on land: Progress, outcomes and future directions to achieve the targets of SDG 15. Environ. Sustain. 2024, 7, 369–375. [Google Scholar] [CrossRef] [Scilit]
  2. Adams, V.M.; Chauvenet, A.L.; Stoudmann, N.; Gurney, G.G.; Brockington, D.; Kuempel, C.D. Multiple-use protected areas are critical to equitable and effective conservation. One Earth 2023, 6, 1173–1189. [Google Scholar] [CrossRef] [Scilit]
  3. Cook, C.N.; Lemieux, C.J.; Grantham, H.S.; Rao, M.; Clyne, P.J.; Rathbone, V.; Sharma, R. What will count? Evidence for the global recognition of other effective area-based conservation measures. Conserv. Lett. 2025, 18, e13150. [Google Scholar] [CrossRef] [Scilit]
  4. Paredes-Vilca, O.J.; Diaz, L.J.; García, J.D.; Cruz, J.A. Contaminación y pérdida de biodiversidad por actividades mineras y agropecuarias: Estado del arte. Rev. Inv. Altoandin. 2024, 26, 56–66. [Google Scholar] [CrossRef] [Scilit]
  5. Barth, A.; Ranacher, L.; Hesser, F.; Stern, T.; Schuster, K.C. Bridging business and biodiversity: An analysis of biodiversity assessment tools. Environ. Sustain. Ind. 2025, 26, e100682. [Google Scholar] [CrossRef] [Scilit]
  6. Jonas, H.D.; Bingham, H.C.; Bennett, N.J.; Woodley, S.; Zlatanova, R.; Howland, E.; Belle, E.; Upton, J.; Gottlieb, B.; Kamath, V.; et al. Global status and emerging contribution of other effective area-based conservation measures (OECMs) towards the ‘30x30′ biodiversity Target 3. Front. Conserv. Sci. 2024, 5, e1447434. [Google Scholar] [CrossRef] [Scilit]
  7. Arneth, A.; Leadley, P.; Claudet, J.; Coll, M.; Rondinini, C.; Rounsevell, M.D.; Shin, Y.J.; Alexander, P.; Fuchs, R. Making protected areas effective for biodiversity, climate and food. Glob. Change Biol. 2023, 29, 3883–3894. [Google Scholar] [CrossRef] [Scilit]
  8. Cáceres, K.M. Adaptabilidad y optimización de una herramienta de evaluación de efectividad de manejo de áreas protegidas (Ecuador). Rev. Latinoam. Cien. Soc. Hum. 2024, 5, 4565–4579. [Google Scholar] [CrossRef] [Scilit]
  9. Zhang, Y.; West, P.; Thakholi, L.; Suryawanshi, K.; Supuma, M.; Straub, D.; Sithole, S.S.; Sharma, R.; Schleicher, J.; Ruli, B.; et al. Governance and conservation effectiveness in protected areas and indigenous and locally managed areas. Ann. Rev. Environ. Res. 2023, 48, 559–588. [Google Scholar] [CrossRef] [Scilit]
  10. Hansen, A.J.; Noble, B.P.; Veneros, J.; East, A.; Goetz, S.J.; Supples, C.; Watson, J.E.M.; Jantz, P.A.; Pillay, R.; Jetz, W.; et al. Toward monitoring forest ecosystem integrity within the post-2020 Global Biodiversity Framework. Conserv. Lett. 2021, 14, e12822. [Google Scholar] [CrossRef] [Scilit]
  11. Velazco, S.J.E.; Bedrij, N.A.; Rojas, J.L.; Keller, H.A.; Ribeiro, B.R.; De Marco, P. Quantifying the role of protected areas for safeguarding the uses of biodiversity. Biol. Conserv. 2022, 268, e109525. [Google Scholar] [CrossRef] [Scilit]
  12. Delgado, E.; Mori, G.M.; Barboza, E.; Briceño, N.B.R.; Guzmán, C.T.; Oliva-Cruz, M.; Chavez-Quintana, S.G.; Salas López, R.; López de la Lama, R.; Sevillano-Ríos, S.; et al. Efectividad de áreas de conservación privada comunal en bosques montanos nublados del norte de Perú. Pirineos 2021, 176, e067. [Google Scholar] [CrossRef] [Scilit]
  13. DellaSala, D.A.; Mackey, B.; Kormos, C.F.; Young, V.; Boan, J.J.; Skene, J.L.; Lindenmayer, D.B.; Kun, Z.; Selva, N.; Malcolm, J.R.; et al. Measuring forest degradation via ecological-integrity indicators at multiple spatial scales. Biol. Conserv. 2025, 302, 110939. [Google Scholar] [CrossRef] [Scilit]
  14. Essbiti, M.C.; Namous, M.; Krimissa, S.; Elaloui, A.; Hajaj, S.; Mosaid, H.; Ismaili, M.; Hajji, S.; El Atiq, J.; El Kamouni, F.E. Emerging trends and future directions in remote-sensing techniques and platforms for sustainable forest degradation monitoring: A review. Mediter. Geosci. Rev. 2025, 7, 953–976. [Google Scholar] [CrossRef] [Scilit]
  15. Holzwarth, S.; Thonfeld, F.; Kacic, P.; Abdullahi, S.; Asam, S.; Coleman, K.; Eisfelder, C.; Gessner, U.; Huth, J.; Kraus, T.; et al. Earth-observation-based monitoring of forests in Germany. Recent progress and research Frontiers: A review. Remote Sen. 2023, 15, 4234. [Google Scholar] [CrossRef] [Scilit]
  16. Borsellino, M.L.; Zufiaurre, E.; Bilenca, D.N. La investigación científica y la conservación de la biodiversidad en Parques Nacionales de la Argentina: Dónde estamos y hacia dónde podríamos ir. Ecol. Austr. 2022, 32, 493–501. [Google Scholar] [CrossRef] [Scilit]
  17. Navarro, V.M. Análisis de situación y perspectivas de la gestión del Sistema de áreas protegidas de la provincia de Santa Cruz. Inf. Cient. Téc. UNPA 2025, 17, 19–49. [Google Scholar] [CrossRef] [Scilit]
  18. Rosas, Y.M.; Peri, P.L.; Martínez Pastur, G. Assessment of provisioning ecosystem services in terrestrial ecosystems of Santa Cruz Province, Argentina. In Ecosystem Services in Patagonia: A Multi-Criteria Approach for an Integrated Assessment; Peri, P.L., Martínez Pastur, G., Nahuelhual, L., Eds.; Springer: Cham, Switzerland, 2021; pp. 19–46. [Google Scholar] [CrossRef] [Scilit]
  19. Peri, P.L.; Ormaechea, S.G. Relevamiento de los Bosques Nativos de Ñire (Nothofagus antarctica) en Santa Cruz: Base Para su Conservación y Manejo; Ed. INTA: Río Gallegos, Argentina, 2013. [Google Scholar]
  20. Ramírez, G.; Correa, M.; Figueroa, S.; San Martín, J. Variation in the growth habit and habitat of Nothofagus antarctica in South-Central Chile. Bosque 1985, 6, 55–73. [Google Scholar] [CrossRef] [Scilit]
  21. Soliani, C.; Marchelli, P.; Mondino, V.; Pastorino, M.; Mattera, M.G.; Gallo, L.; Aparicio, A.; Torres, A.D.; Tejera, L.; Schinelli, C.T. Nothofagus pumilio and N. antarctica: The most widely distributed and cold-tolerant southern beeches in Patagonia. In Low Intensity Breeding of Native Forest Trees in Argentina; Pastorino, M., Marchelli, P., Eds.; Springer: Cham, Switzerland, 2021; pp. 117–148. [Google Scholar] [CrossRef] [Scilit]
  22. Martínez Pastur, G.; Rosas, Y.M.; Chaves, J.E.; Cellini, J.M.; Barrera, M.D.; Favoretti, S.; Lencinas, M.V.; Peri, P.L. Changes in forest structure values along the natural cycle and different management strategies in Nothofagus antarctica forests. For. Ecol. Manag. 2021, 486, e118973. [Google Scholar] [CrossRef] [Scilit]
  23. Peri, P.L.; López, D.; Rusch, V.; Rusch, G.; Rosas, Y.M.; Martínez Pastur, G. State and transition model approach in native forests of Southern Patagonia (Argentina): Linking ecosystemic services, thresholds and resilience. Int. J. Biodiv. Sci. Ecosyst. Ser. Manag. 2017, 13, 105–118. [Google Scholar] [CrossRef] [Scilit]
  24. Soler, R.; Lencinas, M.V.; Martínez Pastur, G.; Rosas, Y.M.; Bustamante, G.; Espelta, J.M. Forest regrowth in Tierra del Fuego, Southern Patagonia: Landscape drivers and effects on forest structure, soil, and understory attributes. Reg. Environ. Change 2022, 22, e46. [Google Scholar] [CrossRef] [Scilit]
  25. Martínez Pastur, G.; Rodríguez-Souilla, J.; Rosas, Y.M.; Politi, N.; Rivera, L.; Silveira, E.M.O.; Olah, A.M.; Pidgeon, A.M.; Lencinas, M.V.; Peri, P.L. Conservation value and ecosystem service provision of Nothofagus antarctica forests based on phenocluster categories. Discov. Conserv. 2025, 2, e2. [Google Scholar] [CrossRef] [Scilit]
  26. Mattera, M.G.; Gonzalez-Polo, M.; Peri, P.L.; Moreno, D.A. Intraspecific variation in leaf (poly) phenolic content of a southern hemisphere beech (Nothofagus antarctica) growing under different environmental conditions. Sci. Rep. 2024, 14, e20050. [Google Scholar] [CrossRef] [Scilit]
  27. Huertas Herrera, A.; Toro-Manríquez, M.D.; Sanhueza, J.S.; Guínez, F.R.; Lencinas, M.V.; Martínez Pastur, G. Relationships among livestock, structure, and regeneration in Chilean Austral Macrozone temperate forests. Trees For. People. 2023, 13, e100426. [Google Scholar] [CrossRef] [Scilit]
  28. Pichancourt, J.B. Navigating the complexities of the forest land sharing vs sparing logging dilemma: Analytical insights through the governance theory of social-ecological systems dynamics. PeerJ 2024, 12, e16809. [Google Scholar] [CrossRef] [Scilit]
  29. Pulido-Herrera, L.A.; Sepulveda, C.; Jiménez, J.A.; Betanzos Simon, J.E.; Pérez-Sánchez, E.; Niño, L. Landscape connectivity in extensive livestock farming: An adaptive approach to the land sharing and land sparing dilemma. Front. Sustain. Food Syst. 2024, 8, 1345517. [Google Scholar] [CrossRef] [Scilit]
  30. Gioiosa, M.; Spada, A.; Cammerino, A.R.B.; Ingaramo, M.; Monteleone, M. Can agriculture conserve biodiversity? Structural biodiversity analysis in a case study of wild bird communities in Southern Europe. Environments 2025, 12, 129. [Google Scholar] [CrossRef] [Scilit]
  31. Augustiny, E.; Frehner, A.; Green, A.; Mathys, A.; Rosa, F.; Pfister, S.; Muller, A. Empirical evidence supports neither land sparing nor land sharing as the main strategy to manage agriculture-biodiversity tradeoffs. PNAS Nexus 2025, 4, pgraf251. [Google Scholar] [CrossRef] [Scilit] [PubMed]
  32. Soto-Rogel, P.; Aravena, J.C.; Villalba, R.; Bringas, C.; Meier, W.; Gonzalez-Reyes, A.; Grießinger, J. Two Nothofagus species in Southernmost South America are recording divergent climate signals. Forests 2022, 13, 794. [Google Scholar] [CrossRef] [Scilit]
  33. Rafaqat, W.; Sanchez, P.; Botnen, D.; Fernandez-Anez, N. Analysing historical events and current management strategies of wildfires in Norway. Sci. Rep. 2025, 15, e24905. [Google Scholar] [CrossRef] [Scilit]
  34. Ruggirello, M.J.; Bustamante, G.; Soler, R. Nothofagus pumilio regeneration failure following wildfire in the sub-Antarctic forests of Tierra del Fuego, Argentina. Forestry 2025, 98, 40–49. [Google Scholar] [CrossRef] [Scilit]
  35. Onditi, K.O.; Li, X.; Song, W.; Li, Q.; Musila, S.; Mathenge, J.; Kioko, E.; Jiang, X. The management effectiveness of protected areas in Kenya. Biodiv. Conserv. 2021, 30, 3813–3836. [Google Scholar] [CrossRef] [Scilit]
  36. Bitterlich, W. The Relascope Idea: Relative Measurements in Forestry; Commonwealth Agricultural Bureaux: Farnham Royal, UK, 1984; p. 242. [Google Scholar]
  37. Ivancich, H.S.; Martínez Pastur, G.; Lencinas, M.V.; Cellini, J.M.; Peri, P.L. Proposals for Nothofagus antarctica diameter growth estimation: Simple vs. global models. J. For. Sci. 2014, 60, 307–317. [Google Scholar] [CrossRef] [Scilit]
  38. Ivancich, H.S. Relaciones entre la estructura forestal y el crecimiento del bosque de Nothofagus antarctica en gradientes de edad y calidad de sitio. PhD. Thesis, Universidad Nacional de La Plata, La Plata, Argentina, 2013. [Google Scholar]
  39. Frazer, G.W.; Fournier, R.A.; Trofymow, J.A.; Hall, R.J. A comparison of digital and film fisheye photography for analysis of forest canopy structure and gap light transmission. Agric. For. Meteorol. 2001, 109, 249–263. [Google Scholar] [CrossRef] [Scilit]
  40. Bao, S.D. Soil Agricultural Chemical Analysis; China Agric. Press: Beijing, China, 2000. [Google Scholar]
  41. Carter, M.; Gregorich, E. Soil Sampling and Methods of Analysis; Taylor and Francis: Boca Ratón, FL, USA, 2007; 1261p. [Google Scholar] [CrossRef] [Scilit]
  42. Martínez Pastur, G.; Cellini, J.M.; Chaves, J.E.; Rodríguez-Souilla, J.; Benitez, J.; Rosas, Y.M.; Soler, R.; Lencinas, M.V.; Peri, P.L. Changes in forest structure modify understory and livestock occurrence along the natural cycle and different management strategies in Nothofagus antarctica forests. Agrofor. Syst. 2022, 96, 1039–1052. [Google Scholar] [CrossRef] [Scilit]
  43. Yu, M.; Liu, Y. Landscape ecological integrity assessment to improve protected area management of forest ecosystem. Ecologies 2025, 6, 38. [Google Scholar] [CrossRef] [Scilit]
  44. StatPoint Technologies. Statgraphics Centurion XVI, Version 16.1.11; Statpoint Technologies: Warrenton, VA, USA, 2011. [Google Scholar]
  45. Faúndez Pinilla, J.; Castillo Soto, M.; Navarro Cerrillo, R.M. Impactos de los incendios forestales de magnitud en áreas silvestres protegidas de Chile Central. Bosque 2023, 44, 83–95. [Google Scholar] [CrossRef] [Scilit]
  46. Boughton, E.H.; Sonnier, G.; Gomez-Casanovas, N.; Bernacchi, C.; DeLucia, E.; Sparks, J.; Swain, H.; Anderson, E.; Brinsko, K.; Gough, A.M. Impact of patch-burn grazing on vegetation composition and structure in subtropical humid grasslands. Rangel. Ecol. Manag. 2025, 98, 588–599. [Google Scholar] [CrossRef] [Scilit]
  47. Nikolić, N. Assessing wildfire impact on vegetation in protected areas using the dNBR index: Insights from the designated location in Serbia. J. Geogr. Inst. Jovan Cvijic. 2025, 75, 453–460. [Google Scholar] [CrossRef] [Scilit]
  48. Hardalau, D.; Codrean, C.; Iordache, D.; Fedorca, M.; Ionescu, O. The expanding thread of ungulate browsing: A review of forest ecosystem effects and management approaches in Europe. Forests 2024, 15, 1311. [Google Scholar] [CrossRef] [Scilit]
  49. Dixit, S.; Poudyal, N.C.; Silwal, T.; Joshi, O.; Bhandari, A.R.; Pant, G.; Hodges, D.G. Effectiveness of protected area revenue-sharing program: Lessons from the key informants of Nepal’s buffer zone program. J. Environ. Manag. 2024, 367, e121980. [Google Scholar] [CrossRef] [Scilit]
  50. van Versendaal, L.; Schickhoff, U. The evolution of threats to protected areas during crises: Insights from the COVID-19 pandemic in Madagascar. Hum. Ecol. 2024, 52, 1157–1172. [Google Scholar] [CrossRef] [Scilit]
  51. Sarkar, D.; Bortolamiol, S.; Gogarten, J.F.; Hartter, J.; Hou, R.; Kagoro, W.; Omeja, P.; Tumwesigye, C.; Chapman, C.A. Exploring multiple dimensions of conservation success: Long-term wildlife trends, anti-poaching efforts and revenue sharing in Kibale National Park, Uganda. Anim. Conserv. 2022, 25, 532–549. [Google Scholar] [CrossRef] [Scilit]
  52. Flores, B.M.; Montoya, E.; Sakschewski, B.; Nascimento, N.; Staal, A.; Betts, R.A.; Levis, C.; Lapola, D.M.; Esquível-Muelbert, A.; Jakovac, C.; et al. Critical transitions in the Amazon forest system. Nature 2024, 626, 555–564. [Google Scholar] [CrossRef] [Scilit] [PubMed]
  53. Li, C.; Yu, J.; Wu, W.; Hou, R.; Yang, Z.; Owens, J.R.; Gu, X.; Xiang, Z.; Qi, D. Evaluating the efficacy of zoning designations for national park management. Glob. Ecol. Conserv. 2021, 27, e01562. [Google Scholar] [CrossRef] [Scilit]
  54. Liu, Y.; Ziegler, A.D.; Wu, J.; Liang, S.; Wang, D.; Xu, R.; Duangnamon, D.; Li, H.; Zeng, Z. Effectiveness of protected areas in preventing forest loss in a tropical mountain region. Ecol. Indic. 2022, 136, e108697. [Google Scholar] [CrossRef] [Scilit]
  55. Schooler, S.L.; Finnegan, S.P.; Fowler, N.L.; Kellner, K.F.; Lutto, A.L.; Parchizadeh, J.; van den Bosch, M.; Zubiria Perez, A.; Masinde, L.M.; Mwampeta, S.B.; et al. Factors influencing lion movements and habitat use in the western Serengeti ecosystem, Tanzania. Sci. Rep. 2022, 12, e18890. [Google Scholar] [CrossRef] [Scilit]
  56. Du, B.; Ye, S.; Gao, P.; Ren, S.; Liu, C.; Song, C. Analyzing spatial patterns and driving factors of cropland change in China’s National Protected Areas for sustainable management. Sci. Total Environ. 2024, 912, e169102. [Google Scholar] [CrossRef] [Scilit]
  57. Pérez-Granados, C.; Schuchmann, K.L. The sound of the illegal: Applying bioacoustics for long-term monitoring of illegal cattle in protected areas. Ecol. Inform. 2023, 74, 101981. [Google Scholar] [CrossRef] [Scilit]
  58. Veblen, T.T.; Mermoz, M.; Martin, C.; Kitzberger, T. Ecological impacts of introduced animals in Nahuel Huapi National Park, Argentina. Conserv. Biol. 1992, 6, 71–83. [Google Scholar] [CrossRef] [Scilit]
  59. Nuñez, P.G.; Núñez, C.I. Livestock activity in Norwestern Patagonian protected areas. Environ. Anal. Ecol. Stu. 2023, 10, 1–3. [Google Scholar] [CrossRef] [Scilit]
  60. Grass, I.; Batáry, P.; Tscharntke, T. Combining land-sparing and land-sharing in European landscapes. In Advances in Ecological Research; Bohan, D.A., Vanbergen, A.J., Eds.; Academic Press: London, UK, 2021; pp. 251–303. [Google Scholar] [CrossRef] [Scilit]
  61. Hua, F.; Liu, M.; Wang, Z. Integrating forest restoration into land-use planning at large spatial scales. Curr. Biol. 2024, 34, R452–R472. [Google Scholar] [CrossRef] [Scilit]
  62. Peri, P.L.; Rosas, Y.M.; Lopez, D.; Lencinas, M.V.; Cavallero, L.; Martínez Pastur, G. Marco conceptual para definir estrategias de manejo en sistemas silvopastoriles para los bosques nativos. Ecol. Austral 2022, 32, 749–766. [Google Scholar] [CrossRef] [Scilit]
  63. Ruggirello, M.J.; Bustamante, G.; Fulé, P.Z.; Soler, R. Drivers of post-fire Nothofagus antarctica forest recovery in Tierra del Fuego, Argentina. Front. Ecol. Evol. 2023, 11, e1113970. [Google Scholar] [CrossRef] [Scilit]
  64. Veblen, T.T.; Donoso, C.; Kitzberger, T.; Rebertus, A.J. The ecology of southern Chilean and Argentinean Nothofagus forests. In Ecology of Southern Chilean and Argentinean Nothofagus Forests; Veblen, T.T., Hill, R.S., Read, J., Eds.; Yale University Press: New Haven, CT, USA, 1996; pp. 293–353. [Google Scholar]
  65. Ceccherini, G.; Girardello, M.; Beck, P.S.A.; Migliavacca, M.; Duveiller, G.; Dubois, G.; Avitabile, V.; Battistella, L.; Barredo, J.I.; Cescatti, A. Spaceborne LiDAR reveals the effectiveness of European protected areas in conserving forest height and vertical structure. Comm. Earth Environ. 2023, 4, e97. [Google Scholar] [CrossRef] [Scilit]
  66. Liu, J. Progress in research on the effects of environmental factors on natural forest regeneration. Front. For. Glob. Change 2025, 8, e1525461. [Google Scholar] [CrossRef] [Scilit]
  67. Wei, X.; Wei, S.; Hao, D.; Jia, L.; Liang, W. Optimizing adaptive disturbance in planted forests: Resource allocation strategies for sustainable regeneration from seedlings to saplings. Plant Cell. Environ. 2025, 48, 8114–8126. [Google Scholar] [CrossRef] [Scilit]
  68. Hill, E.M.; Cannon, J.B.; Ex, S.; Ocheltree, T.W.; Redmond, M.D. Canopy-mediated microclimate refugia do not match narrow regeneration niches in a managed dry conifer forest. For. Ecol. Manag. 2024, 553, e121566. [Google Scholar] [CrossRef] [Scilit]
  69. Szwagrzyk, J.; Gazda, A.; Cacciatori, C.; Tomski, A.; Maciejewski, Z.; Zwijacz-Kozica, T.; Zięba, A.; Foremnik, K.; Madalcho, A.B.; Bodziarczyk, J. Species-specific branching architecture influences sapling resilience to ungulate browsing pressure in temperate forests. Forestry 2025, cpaf033. [Google Scholar] [CrossRef] [Scilit]
  70. Zamorano-Elgueta, C.; Becerra-Rodas, C. Successional dynamics are influenced by cattle and selective logging in Nothofagus deciduous forests of Western Patagonia. Forests 2025, 16, 580. [Google Scholar] [CrossRef] [Scilit]
  71. Amoroso, M.M.; Peri, P.L.; Lencinas, M.V.; Soler Esteban, R.M.; Rovere, A.E.; González Peñalba, M.; Chauchard, L.; Urretavizcaya, M.F.; Loguercio, G.; Mundo, I.A.; et al. Región Patagónica (Bosques Andino Patagónicos). In Uso Sostenible del Bosque: Aportes Desde la Silvicultura Argentina; Peri, P.L., Martínez Pastur, G., Schlichter, T., Eds.; MAyDS: Buenos Aires, Argentina, 2021; pp. 692–809. [Google Scholar]
  72. Martínez Pastur, G.; Aravena Acuña, M.C.; Silveira, E.M.O.; Von Müller, A.; La Manna, L.; González-Polo, M.; Chaves, J.E.; Cellini, J.M.; Lencinas, M.V.; Radeloff, V.C.; et al. Mapping soil organic carbon content in Patagonian forests based on climate, topography and vegetation metrics from satellite imagery. Rem. Sen. 2022, 14, 5702. [Google Scholar] [CrossRef] [Scilit]
  73. Koelemeijer, I.A.; Severholt, I.; Ehrlén, J.; De Frenne, P.; Jönsson, M.; Hylander, K. Canopy cover and soil moisture influence forest understory plant responses to experimental summer drought. Glob. Change Biol. 2024, 30, e17424. [Google Scholar] [CrossRef] [Scilit]
  74. Feng, T.; Zheng, H.; Wei, W.; Wang, P.; Bi, H.; Zhang, J.; Wei, T.; Wang, R.; Wang, L. Natural forests accelerate soil hydrological processes and enhance water-holding capacities compared to planted forests after long-term restoration. Water Res. 2025, 61, e2025WR040857. [Google Scholar] [CrossRef] [Scilit]
  75. Llano, M.P. Spatiotemporal variability of monthly precipitation concentration in Argentina. JSHESS 2023, 73, 168–177. [Google Scholar] [CrossRef] [Scilit]
  76. Meijers, E.; Groenewoud, R.; de Vries, J.; van der Zee, J.; Nabuurs, G.J.; Vos, M.; Sterck, F. Canopy cover at the crown-scale best predicts spatial heterogeneity of soil moisture within a temperate Atlantic forest. Agric. For. Meteorol. 2025, 363, e110431. [Google Scholar] [CrossRef] [Scilit]
  77. Dobre, A.C.; Pascu, I.S.; Leca, Ș.; Garcia-Duro, J.; Dobrota, C.E.; Tudoran, G.M.; Badea, O. Applications of TLS and ALS in evaluating forest ecosystem services: A southern Carpathians case study. Forests 2021, 12, 1269. [Google Scholar] [CrossRef] [Scilit]
  78. Amoroso, M.M.; Chillo, V.; Enríquez, A. Sustainable timber production in afforestations: Trade-offs and synergies in the provision of multiple ecosystem services in northwest Patagonia. For. Ecol. Manag. 2024, 574, e122345. [Google Scholar] [CrossRef] [Scilit]
  79. Gutgesell, M.; McCann, K.; O’Connor, R.; KC, K.; Fraser, E.D.G.; Moore, J.C.; McMeans, B.; Donohue, I.; Bieg, C.; Ward, C.; et al. The productivity-stability trade-off in global food systems. Nat. Ecol. Evol. 2024, 8, 2135–2149. [Google Scholar] [CrossRef] [Scilit] [PubMed]
  80. Masters, D.G.; Blache, D.; Lockwood, A.L.; Maloney, S.K.; Norman, H.C.; Refshauge, G.; Hancock, S.N. Shelter and shade for grazing sheep: Implications for animal welfare and production and for landscape health. Anim. Prod. Sci. 2023, 63, 623–644. [Google Scholar] [CrossRef] [Scilit]
  81. Dudley, N.; Timmins, H.L.; Stolton, S.; Watson, J.E. Effectively incorporating small reserves into national systems of protected and conserved areas. Diversity 2024, 16, 216. [Google Scholar] [CrossRef] [Scilit]
  82. Sze, J.S.; Childs, D.Z.; Carrasco, L.R.; Edwards, D.P. Indigenous lands in protected areas have high forest integrity across the tropics. Curr. Biol. 2022, 32, 4949–4956. [Google Scholar] [CrossRef] [Scilit] [PubMed]
  83. Frei, E.R.; Conedera, M.; Bebi, P.; Zürcher, S.; Bareiss, A.; Ramstein, L.; Giacomelli, N.; Bottero, A. High potential but little success: Ungulate browsing increasingly impairs silver fir regeneration in mountain forests in the southern Swiss Alps. Forestry 2025, 98, 194–203. [Google Scholar] [CrossRef] [Scilit]
  84. Guerra, C.A.; Berdugo, M.; Eldridge, D.J.; Eisenhauer, N.; Singh, B.K.; Cui, H.; Abades, S.; Alfaro, F.D.; Bamigboye, A.R.; Bastida, F.; et al. Global hotspots for soil nature conservation. Nature 2022, 610, 693–698. [Google Scholar] [CrossRef] [Scilit]
  85. Hijmans, R.J.; Cameron, S.E.; Parra, J.L.; Jones, P.G.; Jarvis, A. Very high-resolution interpolated climate surfaces for global land areas. Int. J. Climatol. 2005, 25, 1965–1978. [Google Scholar] [CrossRef] [Scilit]
  86. Farr, T.G.; Rosen, P.A.; Caro, E.; Crippen, R.; Duren, R.; Hensley, S.; Kobrick, M.; Paller, M.; Rodriguez, E.; Roth, L.; et al. The shuttle radar topography mission. Rev. Geophys. 2007, 45, RG2004. [Google Scholar] [CrossRef] [Scilit]
Figure 1. Map of the study area, identifying plots (dots) classified by land tenure (purple dots = Protected Areas, orange dots = buffer areas in private lands, red dots = private lands), and areas indicating forests (light green areas = Nothofagus antarctica, dark green areas = other forest types), protected areas (violet areas), 15 km buffer (orange areas), and lakes (light blue areas). A = north Santa Cruz, B = center Santa Cruz, C = south Santa Cruz.
Land 15 00178 g001
Figure 2. Relationships between indices, FI = forest index in Table 2, SI = soil index in Table 3, AI = animal use index in Table 4, calculated for Nothofagus antarctica forests in Santa Cruz province (Argentina): (A) forest structure vs. animal use, (B) forest structure vs. soil, (C) soil vs. animal use. The bars represent the standard error for both axes.
Land 15 00178 g002
Table 1. Occurrence and intensity of harvesting, fire, and animal use for each land conservation status (PL = private land, BL = buffer area in private lands, PA = protected area) in Nothofagus antarctica forests in Santa Cruz province (Argentina). F = Fisher test, p = probability at <0.05 in the ANOVAs.
LevelH–OH–IntF–OF–IntA–OA–IntIMP
PL0.130.170.510.810.660.380.45
BL0.330.440.330.500.780.640.53
PA0.290.370.340.500.630.460.44
F
(p)
1.97
(0.145)
1.62
(0.204)
0.92
(0.402)
0.22
(0.801)
PL = private land, BL = buffer area in private lands, PA = protected area. H–O = harvesting occurrence (%), H–Int = harvesting intensity (0–3), F–O = fire occurrence (%), F–Int = fire intensity (0–3), A–O = animal use occurrence (%), A–Int = animal use intensity (0–3), IMP = impact (0–1).
Table 2. Forest structure and regeneration variables for different land status (PL = private land, BL = buffer area in private lands, PA = protected area) measured in Nothofagus antarctica forests in Santa Cruz province (Argentina). F = Fisher test, p = probability at <0.05 in the ANOVAs.
LevelDHCCBATOBVPBA–MVIG
PL5.2a45.48a17.7a64.9a89.351.78a
BL7.9b65.71b24.9ab110.7a80.581.95a
PA9.1b76.51b37.9b177.2b89.352.35b
F
(p)
27.48
(<0.001)
20.98
(<0.001)
12.46
(<0.001)
18.92
(<0.001)
0.98
(0.378)
22.69
(<0.001)
LevelCANDSEHSEDSPHSPFI
PL9.448.8b21.81.531.78a0.30a
BL4.317.5ab29.71.241.94ab0.44b
PA3.38.1a21.01.562.48b0.64c
F
(p)
2.49
(0.088)
4.29
(0.016)
1.53
(0.221)
0.05
(0.955)
7.58
(0.001)
27.54
(<0.001)
DH = dominant height (m), CC = crown cover (%), BA = basal area (m2 ha−1), TOBV = total over-bark volume (m3 ha−1), PBA–M = mature basal area (%), VIG = vigor (1–3), CAN = regeneration cover (%), DSE = seedling density (thousand ha−1), HSE = seedling height (cm), DSP = sapling density (thousand ha−1), HSP = sapling height (m), FI = forest index (0–1). Different letters in the same column indicate significant differences by Tukey’s test (p < 0.05).
Table 3. Soil variables for different land status (PL = private land, BL = buffer area in private lands, PA = protected area) measured in Nothofagus antarctica forests in Santa Cruz province (Argentina). F = Fisher test, p = probability at <0.05 in the ANOVAs.
LevelSDSWCCSOCpHSI
PL0.905b29.5a5.47a13.2a5.20.32a
BL0.775ab37.6ab9.82b18.0b5.40.47b
PA0.723a67.9b7.82b14.9ab5.30.43b
F
(p)
8.58
(<0.001)
5.19
(0.007)
6.39
(0.003)
5.52
(0.005)
0.68
(0.507)
7.05
(0.001)
SD = soil bulk density (gr cm−3), SWC = soil water content (%), C = total soil carbon (%), SOC = soil organic carbon (tn ha−1 30 cm), SI = soil index (0–1). Different letters in the same column indicate significant differences by Tukey’s test (p < 0.05).
Table 4. Understory vegetation and animal use variables according to different land status (PL = private land, BL = buffer area in private lands, PA = protected area) measured in Nothofagus antarctica forests in Santa Cruz province (Argentina). F = Fisher test, p = probability at <0.05 in the ANOVAs.
LevelUHUABUPBBRWPOTTSD
PL15.4a1688.3787.630.82.01.4
BL32.4b1775.01019.128.62.81.8
PA32.4b1652.41174.215.13.21.6
F
(p)
5.07
(0.008)
0.06
(0.945)
2.60
(0.079)
1.96
(0.147)
2.66
(0.075)
0.28
(0.759)
LevelLGLESHECATHORLIVAI
PL0.010.020.53b0.80.131.40.52a
BL0.010.000.22ab1.40.191.80.55ab
PA0.000.000.06a1.20.221.60.60b
F
(p)
0.66
(0.518)
1.78
(0.173)
4.70
(0.011)
1.61
(0.206)
0.45
(0.638)
0.30
(0.743)
3.51
(0.034)
UH = understory height (m), UAB = understory alive plant dry biomass (kg ha−1), UPB = palatable UAB (kg ha−1), BRW = browsing damage seedling (%), POT = potential livestock stocking density based on food availability (sheep equivalent per hectare, SE ha−1), TSD = total stocking density (SE ha−1), LG = Lama guanicoe stocking density (SE ha−1), LE = Lepus europaeus stocking density (SE ha−1), SHE = sheep stocking density (SE ha−1), CAT = cattle stocking density (SE ha−1), HOR = horses stocking density (SE ha−1), LIV = total livestock (cattle, sheep, horses) stocking density (SE ha−1), AI = animal use index (0–1). Different letters in the same column indicate significant differences by Tukey’s test (p < 0.05).
Disclaimer/Publisher’s Note: The statements, opinions and data contained in all publications are solely those of the individual author(s) and contributor(s) and not of MDPI and/or the editor(s). MDPI and/or the editor(s) disclaim responsibility for any injury to people or property resulting from any ideas, methods, instructions or products referred to in the content.