Article

Constructing Ecological Networks and Analyzing Impact Factors in Multi-Scenario Simulation Under Climate Change

1
School of Architecture, Chang’an University, Xi’an 710061, China
2
Yellow River Engn Consulting Co., Ltd., Zhengzhou 450003, China
*
Author to whom correspondence should be addressed.
Land 2025, 14(5), 1120; https://doi.org/10.3390/land14051120
Submission received: 16 March 2025 / Revised: 6 May 2025 / Accepted: 19 May 2025 / Published: 21 May 2025

Abstract

:
Persistent climate change and anthropogenic activities have caused the degradation of urban ecosystems and the fragmentation of landscapes in the Loess Plateau region, situated in northern China. Ecological networks have been considered an effective measure for reducing urban habitat fragmentation, enhancing landscape connectivity, and identifying priority areas for ecological restoration. However, research on the spatiotemporal dynamics of ecological networks in cities in the Loess Plateau region, especially multi-scenario ecological networks under future climate change scenarios, and the drivers affecting these network elements are still limited. This study analyzed the spatiotemporal dynamic changes in the ecological networks in Shenmu City from 2000 to 2035, and used GeoDetector to explore the driving factors influencing changes in ecological source distribution. The results showed the following: (1) The ecological sources in Shenmu City continued to shrink from 2000 to 2020, while landscape fragmentation increased. By 2035, the results of scenario modeling will differ for different Shared Socioeconomic Pathways (SSPs) and Representative Concentration Pathways (RCPs), with the ecological source area increasing under scenarios SSP119 and SSP245, and continuing to decrease under scenario SSP585. (2) From 2000 to 2020, the α, β, and γ indices increased and then declined, while the ecological networks of the SSP119 and SSP585 scenarios will stabilize. (3) Under the optimal scenario SSP119, 27 ecological pinch points and 43 ecological barrier points will be identified, which are priority areas for the future execution of ecological restoration initiatives. (4) Precipitation is the primary factor that affects the distribution of ecological sources, followed by temperature. This study proposes a new research perspective on ecological networks, and provides a guideline for ecological restoration and conservation in cities (counties) in the Loess Plateau region.

1. Introduction

Global greenhouse gas emissions contribute to climate warming, which drives species behavior and distribution patterns, ultimately causing biodiversity loss and reduction in vegetation cover [1]. The rising occurrence of extreme weather has resulted in soil erosion and the degradation of biological habitats across various geographical regions [2]. In addition, growing anthropogenic activities and the rapid proliferation of construction land have led to substantial alterations in land use [3]. As a result, urban ecosystems and biodiversity have been confronted with escalating threats from climate change and land use change, causing various ecological issues, including habitat loss, landscape fragmentation, and diminished ecosystem functions [4]. To cope with such increasingly disorganized urban ecosystems and to protect and restore ecological spaces, effective ecological restoration and protection strategies need to be implemented by relevant government departments. To address the escalating fragmentation of urban ecosystems and safeguard ecological spaces, governmental agencies have implemented a series of ecological restoration initiatives, including soil and water conservation in the upper and middle reaches of the Yellow River, the Three-North Shelterbelt Forest Program, the Grain for Green Program, and small watershed management projects. Since 2019, the national strategy of “Ecological Protection and High-Quality Development in the Yellow River Basin” has been enacted, prioritizing the conservation of critical ecosystems and the systematic planning of restoration efforts [5]. Notably, the Loess Plateau, a focal region of the Grain for Green Program, has achieved partial success in ecological rehabilitation. However, such efforts have inadequately addressed the spatial interconnections between ecological patches, leading to persistent ecological degradation in specific regions. In response to the national strategy, government bodies at all levels within the region have actively developed plans for the ecological restoration of territorial space.
At present, the spatial optimization of the ecological restoration of national land space mainly focuses on the recognition of ecological networks and the identification and construction of ecological networks is a key prerequisite for ecological restoration of national land space. Ecological networks maintain landscape integrity and continuity by establishing ecological corridors to protect patches affected by fragmentation [6]. Constructing ecological networks not only improves landscape connectivity between ecological patches [7], but also prioritizes areas for restoration from a comprehensive perspective, facilitating the adjustment and optimization of ecological spaces rather than focusing on individual ecological restoration projects. Since the 1990s, a large number of scholars have provided a reference for constructing ecological networks, forming a research framework of “ecological source identification–resistance surface construction–corridor extraction–node identification.” Identifying ecological sources is central to ecological network construction [8,9]. The methods for this identification have evolved from the direct identification of key ecological spaces, including nature reserves and scenic areas, to the use of related techniques like morphological spatial pattern analysis (MSPA) [10]. Furthermore, indices such as ecosystem service function, habitat quality, and ecological sensitivity are assessed using tools including the InVEST model and RUSLE model, enabling comprehensive assessment. Ecological resistance surfaces are a prerequisite for extracting ecological corridors.
Numerous scholars have selected disturbance factors affecting species migration and ecological flow, based on landscape resistance influences, to establish a resistance factor assessment system and construct a comprehensive resistance surface. Correcting such resistance surfaces based on nighttime light data has also been performed by some scholars [11]. Common methods for extracting ecological corridors include graph theory, minimum cumulative resistance models, and circuit theory. Although all three methods can identify the shortest paths between different ecological sources, circuit theory, which simulates animal migration and energy flow based on the properties of stochastic charge flow, extracts ecological corridors by calculating least-cost paths. This results in more realistic outcomes compared to the other two methods. In addition, circuit theory relies on the Linkage Mapper 3.0 tool to identify “pinch points” and “barrier points” within ecological corridors by calculating the current density in ecological corridors [12], providing spatial guidance for ecological restoration and biodiversity conservation [13]. The elements in ecological networks are characterized by continuous and dynamic changes. However, most scholars have mainly concentrated on ecological networks in the historical to present period [14]. Although some scholars have simulated future ecological networks, the process may involve a degree of subjectivity in defining various future scenarios, which could result in ecological networks that are insufficiently adaptive to future challenges [15]. The Coupled Model Intercomparison Project Phase 6 provides researchers with multi-scenarios for the future [16,17]. It couples the Shared Socioeconomic Pathways (SSPs) and Representative Concentration Pathways (RCPs), emphasizing the role of different socioeconomic development patterns in driving climate change.
Currently, land use simulations mainly include the simulation of quantitative structures and spatial distribution patterns [18]. Forecasting land use demand value primarily involves the Markov model, system dynamics (SD) model, and logistic regression model [19]. The Markov model simulates land use change by transferring probabilities, which can be subjective and fail to adequately explore the relationships among various influencing factors. However, the SD model allows for a more comprehensive consideration of the impacts of diverse factors on land use change [20]. In simulating the spatial distribution of land use, the Patch-Generation Land Use Simulation (PLUS) model proposed by Liang incorporates the random forest algorithm [8,21]. In comparison to the previous cellular automata model and the FLUS model, the PLUS model shows higher precision in simulating future land use. Given the limitations of a single model to predict land use, integrating the SD and PLUS models facilitates more effective modeling of prospective land use under various future climate scenarios [22].
In addition, the majority of present-day studies have concentrated on the construction and stabilization of ecological networks. Patterns of ecological networks over time and space, as well as factors affecting the evolution of ecological networks, have not been fully considered [23,24]. This may reduce the ecological contribution of ecological network structures and elements in regional urban planning, as well as sustainability efforts such as ecological conservation and restoration. GeoDetector, however, is a statistical approach that has been used to examine spatial divergence and reveal its underlying drivers [25]. Analyzing the drivers of change in ecological networks through GeoDetector will enhance the understanding of the networks and contribute to the sustainability of urban ecological spaces [26].
Shenmu City is situated at the confluence of the Maowusu Sandland and the Loess Plateau, which is a typical agricultural and animal husbandry intertwined region. Owing to the significant influence of climate and other natural conditions, the topography of the territory includes a variety of landforms, such as wind-blown sand areas, grasslands, loess hills, gullies, and river valleys. As a significant energy and mineral center in China, rapid local urbanization and associated land development initiatives, as well as a particular increase in coal resource extraction, have dramatically altered land use. Recently, driven by the combination of climate change and land use change, Shenmu City has gradually experienced landscape fragmentation, reduced landscape connectivity, and ecosystem degradation [5]. Consequently, this research sought to (1) simulate the land use distribution in Shenmu City under multi-climate scenarios with the SD-PLUS model in 2035, and examine the spatiotemporal dynamic changes in various land use types from 2000 to 2035; (2) construct and compare the spatiotemporal change characteristics of ecological network elements across the “historical–present–future” periods; (3) identify priority areas for sustainable future urban development based on ecological network elements under the optimal future climate scenario and propose corresponding protection and restoration strategies; and (4) explore the drivers of spatiotemporal heterogeneity of ecological network elements across different periods and climate scenarios using GeoDetector, thereby providing a scientific basis for the implementation of ecological protection and restoration projects in Shenmu City.

2. Study Area and Data
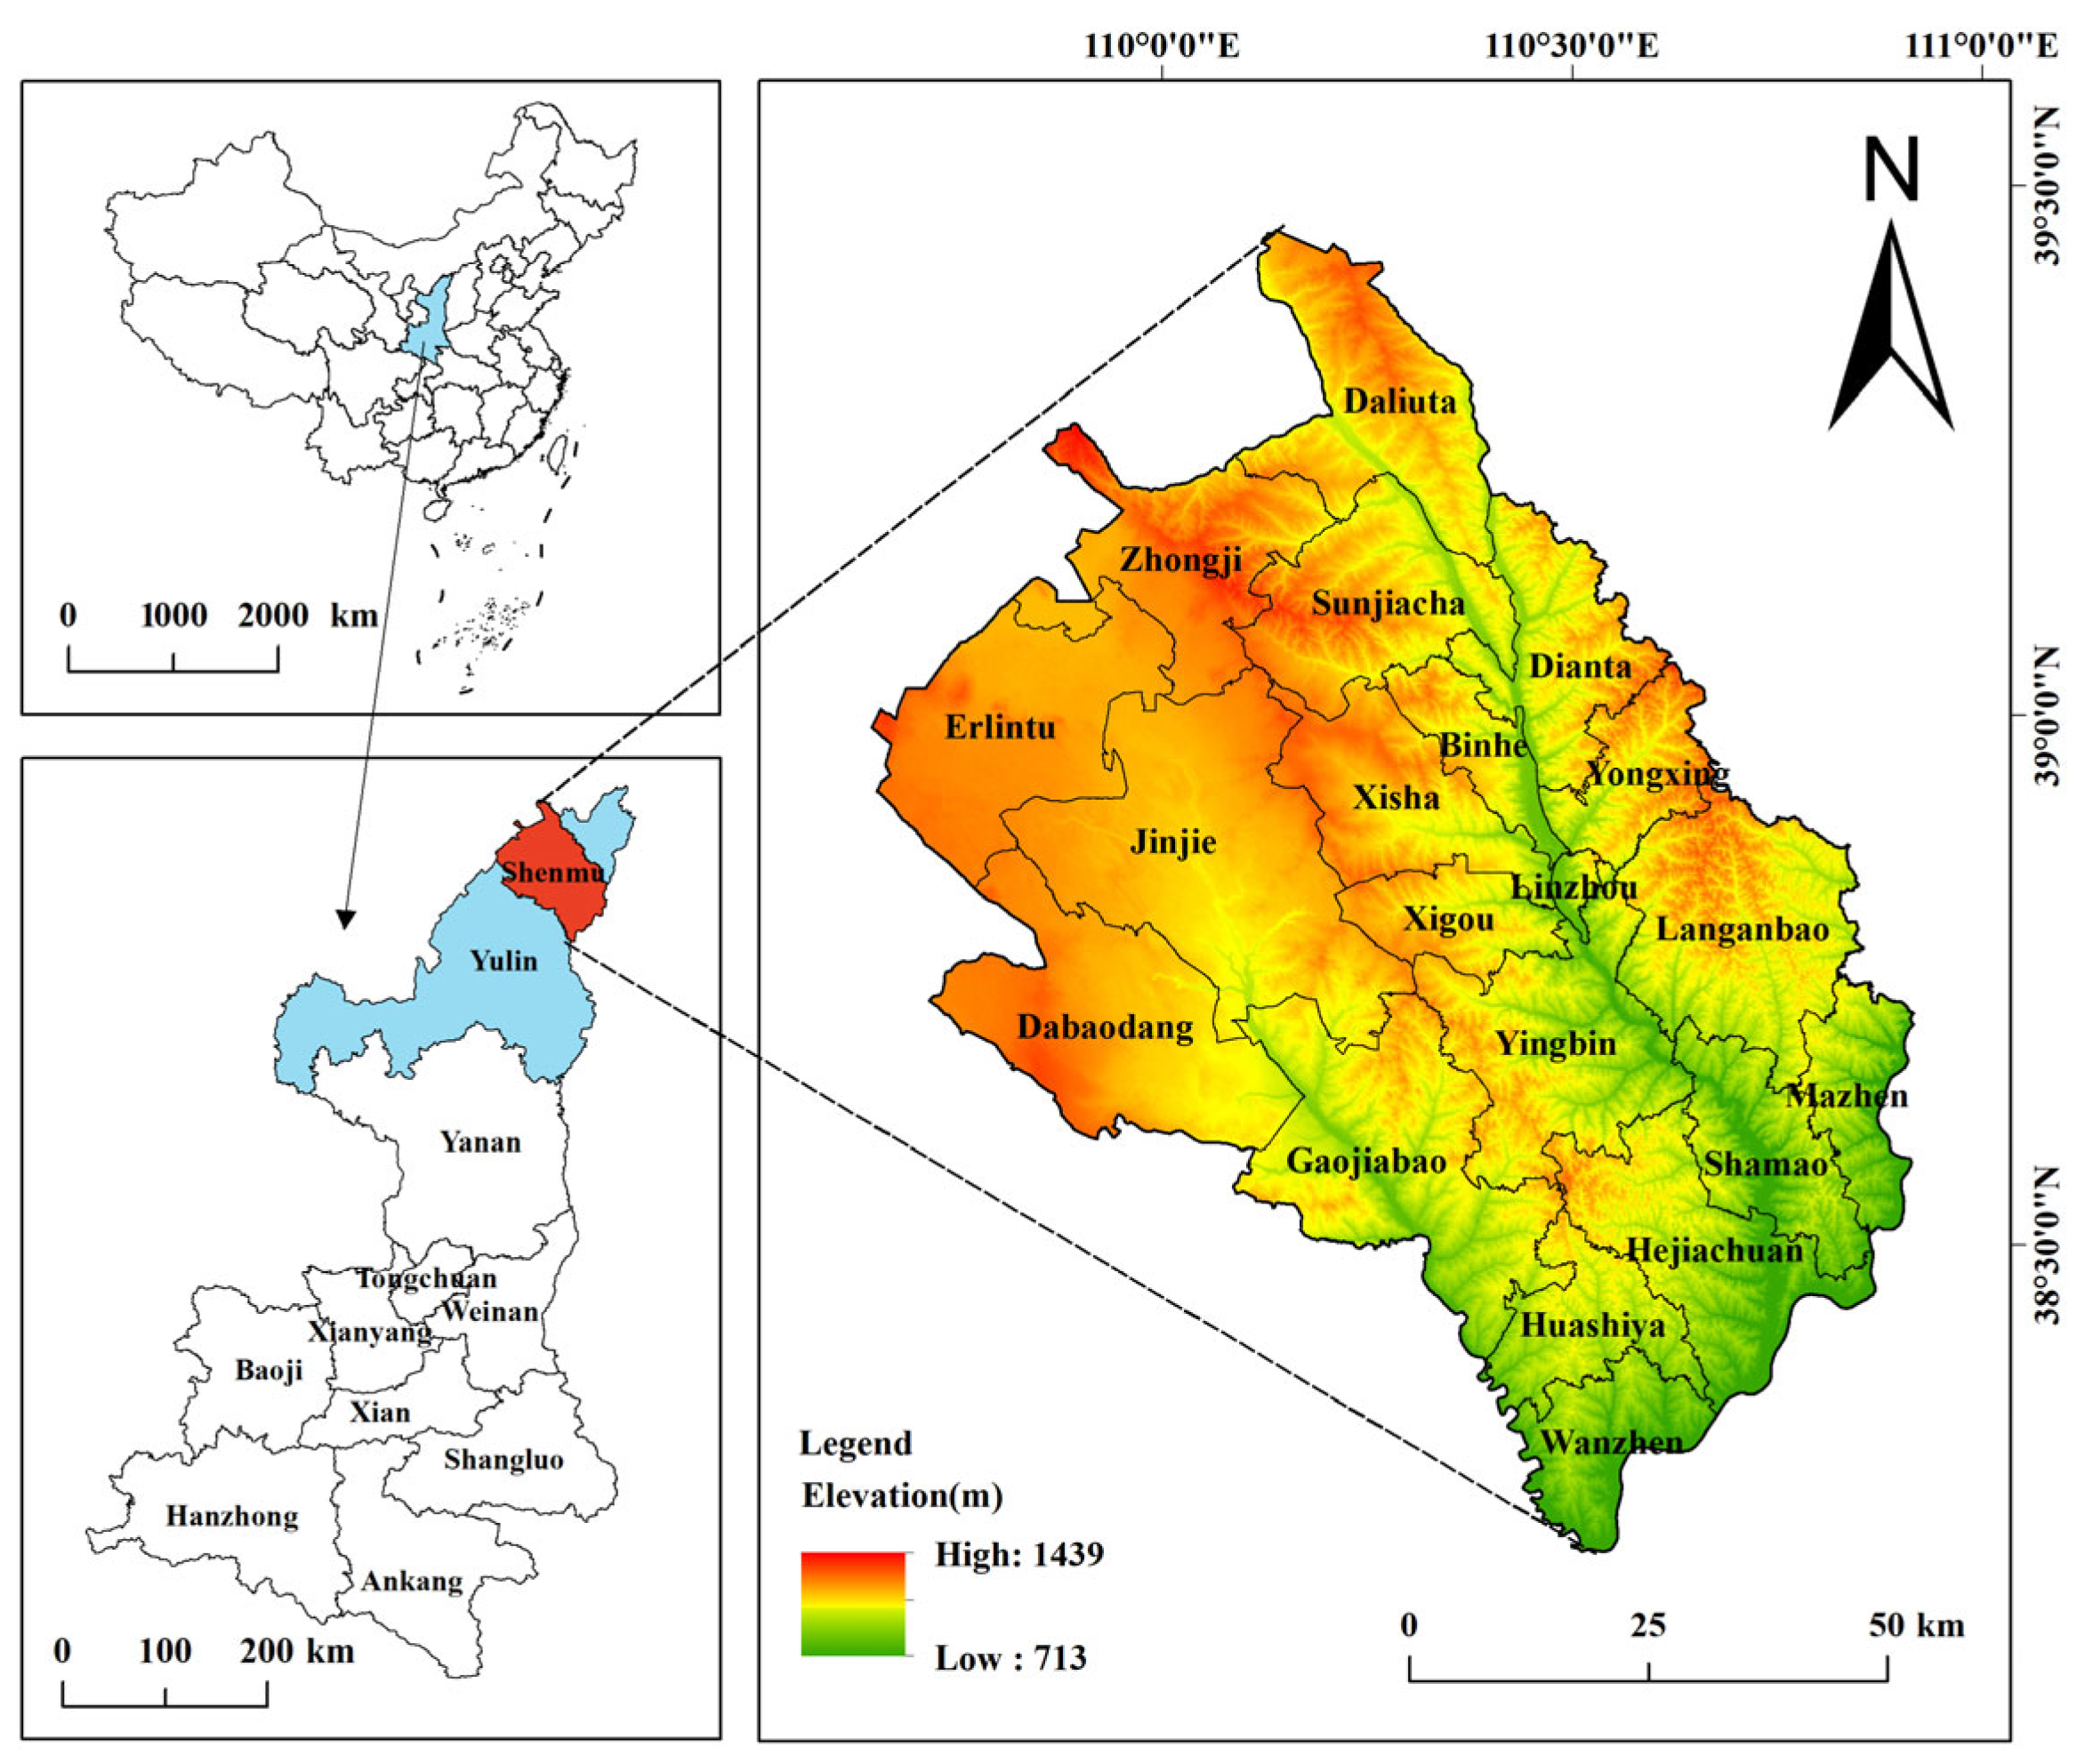
2.1. Study Area

Shenmu City, situated in the northernmost part of Yulin City in Shaanxi Province, located in the Loess Plateau region (Figure 1), covers an area of approximately 7474.64 km2, making it the largest county-level city in the province. Its geographic coordinates range between latitude 38°23′–39°27′ N and longitude 109°40′–110°55′ E. Shenmu City is in a dry and semi-arid monsoon climate zone, with an annual precipitation of 300–600 mm; the average annual temperature is 9–11 °C. The main rivers and lakes in the city include the Yellow River and its first-class tributaries, the Kuye River and the Tuwei River, as well as the largest freshwater lake in Shaanxi Province, located in the Hongjiannao Nature Reserve. Shenmu is the core area of the national-level high-end energy and chemical base in northern Shaanxi, and is the largest coal-producing county (city) in China. Ecological projects implemented since the 1990s have improved local ecosystem services. However, with climate change and rapid urbanization, local ecosystems have gradually degraded, and the conflict between ecological protection and urban development has become increasingly important. Therefore, constructing ecological networks in Shenmu City, along with the quantitative analysis of ecological issues, clarification of restoration and protection priorities, and active exploration of ecological restoration strategies, are all highly significant for promoting sustainable development in the city.

2.2. Data

The main research data used in this study included land use data from 2000 to 2020, climate data, population data, gross domestic product (GDP) data, soil type data, Digital Elevation Model (DEM) data, normalized difference vegetation index data, nighttime light data, point of interest data, roads, nature reserve vector data, SSP-RCP prediction data, relevant statistical yearbook data, and land spatial planning, as shown in Table 1. The land use data came from the China National Land Use and Cover Change dataset, and we reclassified the land use types into six categories: cultivated land, woodland, grassland, water, construction land, and unused land. According to the SSP-RCP data, precipitation and temperature data were from the National Science & Technology Infrastructure of China (https://loess.geodata.cn). GDP data were obtained from the global gridded GDP projection data of Murakami [27]. The population data were the multi-scenario, global 1 km grid population distribution from SSPs 1–5 [28]. The urbanization rate was established based on the 2010–2100 simulation data for provincial urbanization rates of China in conjunction with scenarios reflecting changes in the actual urbanization rate of Shenmu City [29]. All data were standardized to a projected geographic coordinate system with a spatial accuracy of 30 m by cropping and resampling procedures in ArcGIS 10.8.1.

3. Materials and Methods

Firstly, we used the SD-PLUS coupled model to simulate the spatial distribution of land use in Shenmu City in 2035, considering the SSP119, SSP245, and SSP585 climate scenarios, and to analyze the dynamic changes in land use from 2000 to 2035. Subsequently, we constructed and analyzed the spatiotemporal dynamics of the ecological networks and their elements from 2000 to 2035. We then compared the ecological networks in 2020 and 2035 to obtain the optimal future climate scenarios. Finally, we used GeoDetector to analyze the drivers of the distribution of ecological sources in Shenmu City (Figure 2).

3.1. Multi-Scenario Simulation of Land Use Under Climate Change

3.1.1. SSP-RCP Scenario Settings

The SSP and RCP scenario frameworks have been used extensively, and the scenarios not only enhance the predictive power of the models, but also emphasize the role of different socioeconomic development patterns in driving climate change. In the present study, we selected SSP119, SSP245, and SSP585, which are the more likely scenarios, based on data availability. The SSP119 scenario, a combination of SSP1 and RCP1.9, is the climate scenario with the lowest level of radiative forcing, in which land is tightly regulated and grasslands, woodlands, and waters are well preserved, with an emphasis on the use of renewable energy sources and expansion of ecological reserves. The SSP245 scenario combines SSP2 and RCP4.5, with intermediate levels of land use and radiative forcing, revealing a scenario with intermediate vulnerability and close continuation of the status quo, and the overall situation is close to a natural development scenario that maintains the status quo path. SSP585 represents a combination of SSP5 and RCP8.5, exhibiting the highest levels of radiative forcing. This scenario focuses more on economic development and reliance on fossil fuels for electricity generation, resulting in elevated greenhouse gas emissions [30,31]. These three scenarios represent different future development paths and climate scenarios, and are, to some extent, representative.

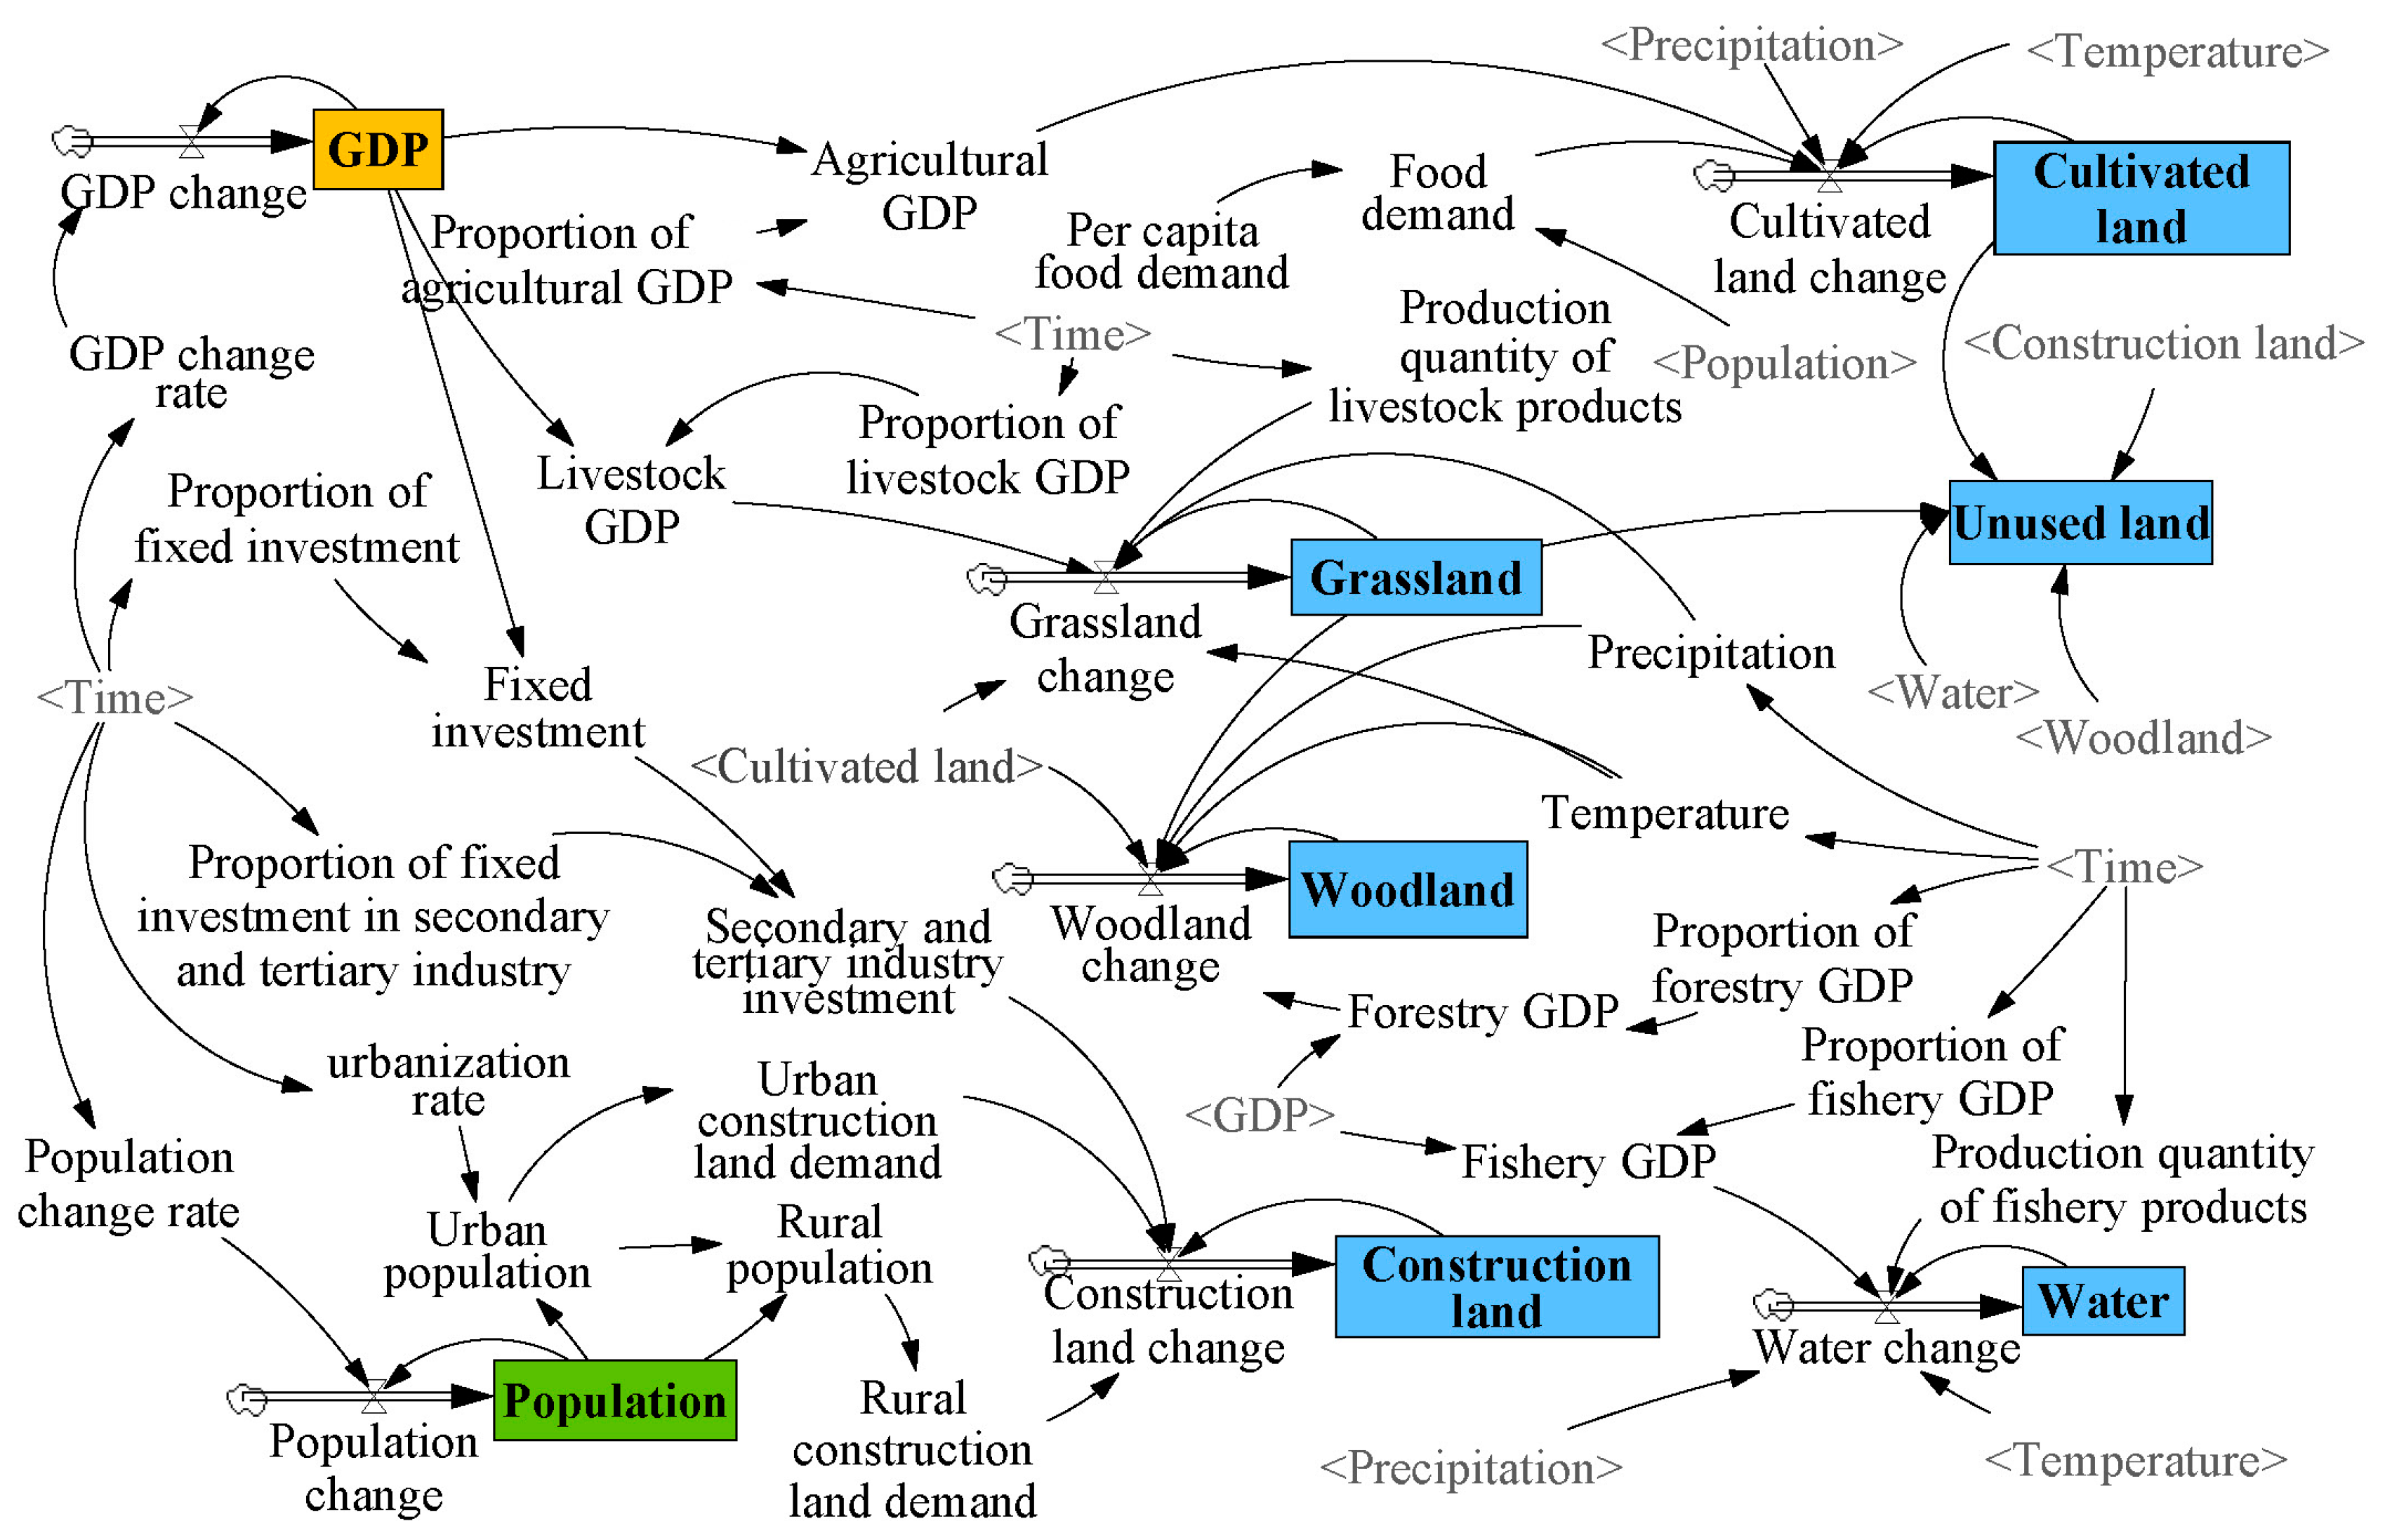
3.1.2. SD Model Construction

In the present study, an SD model containing four subsystems was constructed: climate, land use, population, and economy. Among them, the land use subsystem is the core of the SD model, aiming to determine the quantitative functional relationship between different influencing factors and land use types. The climate subsystem includes precipitation and temperature, reflecting the dynamic impacts of precipitation and temperature change on cultivated land, forest land, grassland, and water, which are finally reflected in land use changes. The population subsystem reflects the changes in demand for agricultural products and livestock products caused by population changes, which indirectly affect land use change. The economic subsystem reflects the impact of fixed asset inputs on different industries, driving change in cultivated land, woodland, water, and construction land [32].
We constructed the SD model using Vensim PLE 10.1.0 (Figure 3), and because of the lag between the statistical yearbooks of Yulin City and Shenmu City, the time period of the simulation test for historical data was set as 2010–2020, while the time boundary of the system was from 2010 to 2035, and the time step was set to 1 year. After continuously debugging the relevant parameters and meeting the accuracy requirements, the climate data for each year in the three scenarios were calculated by trimming and inputting them into the model, using 2020 as the starting year. The average growth rates of the other relevant parameters were calculated based on previously listed data in Table 2, where the urbanization rate was set with reference to the forecast data and in combination with the actual urbanization rate of Shenmu City. Finally, the demand values for cultivated land, woodland, grassland, water, construction land, and unused land in Shenmu City under the three climate scenarios in 2035 were derived through simulation.

3.1.3. PLUS Model Simulation

The Land Expansion Analysis Strategy module of the PLUS model explores the correlation between the degree of expansion and drivers of various land use types by using random forests to determine the growth potential of different land use types [21]. In the PLUS model, the Cellular Automata Random Seeds module has random seed generation and a threshold decrement mechanism that can limit the creation of multiple land use patches and model how different land use types will spread in space in future [33]. After several experiments, 15 driving factors were selected for the PLUS model based on 2005 and 2020 land use data, taking into account natural, climatic, social, and transportation factors. Natural factors included DEM, slope, soil type, normalized difference vegetation index, and distance from water. Climatic factors mainly included annual precipitation data and average annual air temperature of Shenmu City. Social factors included GDP, population, nighttime light data, distance to settlements, distance to industrial and mining enterprises, distance to railroads, distance to highways, and distance to other roads. After referring to related literature [8,34], neighborhood weights were established for various land use types and the conversion cost matrix for the three climate scenarios was configured through multiple experimental modifications.
The kappa coefficient was used to assess the reliability of land use, comparing the 2020 land use types to the simulation results; the kappa coefficient is calculated as follows:
k = p o p e 1 p e
where po represents the ratio of simulated raster data to actual matched raster data; p e is the correctness rate expected to be obtained under stochastic conditions; and k results should range between 0 and 1.

3.2. Methods of Constructing and Assessing Ecological Networks

Ecological sources are core ecological patches in cities and are important ecological spaces that preserve the integrity of urban ecosystems and provide habitats for organisms. We adopted the “MSPA–habitat quality assessment–landscape connectivity assessment–nature reserve overlay” model to identify the ecological source areas. First, land use types with high ecological value [35], including woodland, grassland, and water, were screened through the MSPA to serve as the primary ecological sources. Next, high-value areas of habitat quality in Shenmu City were extracted for spatial superposition to obtain the secondary selection areas. Subsequently, patches with higher landscape connectivity were calculated to serve as a tertiary selection of ecological sources. Considering the spatial scale required for the ecological functions of the ecological sources [36], patches smaller than 10 km2 were excluded and the nature reserves in Shenmu City were superimposed to obtain the final ecological sources.

3.2.1. Identification of Ecological Sources

MSPA is an analytical method based on morphological principles that is used to identify topological relationships between pixel elements of raster images and spatial structures, and it is important for the screening of important habitat patches. The MSPA is able to divide the selected foreground space into seven landscape types: core, island, loop, edge, perforation, bridge, and branch [24]. Among them, core is an ecological patch that is undisturbed by the edge effect; it serves the ecological functions of providing space for species habitats and maintaining landscape connectivity, and it is generally treated as a potential ecological source. We identified the core area by assigning a value of 2 to woodland, grassland, and water, which were less disturbed by anthropogenic activities and had higher ecosystem service values, as foreground data, and assigning 1 to other land types as background data, with the edge width set to 60 m.
Although MSPA can identify ecological sources based on the spatial morphology and structure of patches, there are some deficiencies in the identification of ecological service functions. Habitat quality is a critical ecosystem service function that reflects the health of ecosystems. By integrating land use and threat factors to biodiversity, habitat quality assessments provide a comprehensive evaluation of biodiversity in the study area [37]. We used the InVEST model to assess habitat quality, categorizing the results into five grades using the equal interval method. The top two grades were retained and spatially overlaid with the core area identified by MSPA, serving as the secondary selection areas for screening ecological sources. By referring to literature about the study area and applying the InVEST manual [38], we selected cultivated land, constructed land, and unused land as coercion factors and set coercion factor attributes and threat sensitivity (Table 3, Table 4). The assessment formula is as follows:
Q x j = H j 1 D x j z D x j z + K z
Qxj indicates the level of habitat quality in raster cell x for land use type j; Hj is the habitat suitability leveling score for land use type j; D x j z refers to the level of stress to which land use type j is subjected to raster cell x; Z is generally usually set to 2.5; K is generally taken to be 0.5.
The landscape connectivity is the degree to which the landscape promotes or obstructs species migration and energy flow, and it can be assessed in terms of functional connectivity to ecological sources [39,40]. The probability of connectivity (PC), patch importance (dPC), and integral connectivity (IIC) indicators can effectively reveal the contributions of different ecological sources to maintaining the overall connectivity of ecological networks as well as their relative importance in ecological networks [41]. Conefor 2.6 software was used, and the connection distance between core patches was set to 2 km and the connection probability to 0.5 [42]. Subsequently, we chose patches with both IIC and dPC ≥ 1 as the tertiary selection for ecological sources. The calculation formulae are as follows:
P C = i = 1 n j = 1 n P i j a i   a j A L 2
d P C = P C P C remove P C
I I C = i = 1 n j = 1 n a i a j 1 + n l i j A L 2
where n denotes the quantity of patches, a i and a j signify the areas of patches i and j; A L 2 denotes the area of the landscape; P i j denotes the maximum probability of potential connectivity between patches i and j; P C r e m o v e is the index of PC after removing a given element in the landscape; and n l i j is the quantity of connections in the shortest path between patch i and patch j.

3.2.2. Construction of Ecological Resistance Surfaces

To estimate the dispersal distances and shortest paths of species, the ecological resistance surfaces were one of the bases for constructing ecological corridors [43]. Through quantifying the ecological resistance of regions, the difficulty of species migration can be visualized, thus providing guidance for biodiversity conservation and ecosystem restoration. Meanwhile, the use of ecological resistance surfaces, which can ensure least-cost path connections between ecological sources and enhance landscape connectivity, is an essential strategy for achieving species migration and habitat expansion in the regions. By referring to the related literature and following operationalization principles [24,42], we selected the MSPA landscape type, land use type, DEM, slope, and distance from water as resistance factors for the ecological resistance surfaces (Table 5). We used the expert scoring method to set resistance values and assigned weights to single resistance surfaces using hierarchical analysis to obtain composite resistance surfaces through weighted calculations.

3.2.3. Extraction of Ecological Corridors

Ecological corridors are strips of areas that connect ecological source patches and are necessary pathways for the migration and dispersal of organisms. Ecological corridor identification is critical for landscape connectivity, the flow of ecological network components, and regional ecological security. We set the cost-weighted distance in the Linkage Mapper 3.0.0 tool to 20 km to determine the least-cost paths for energy transfer between ecological sources [44].

3.2.4. Assessment of Ecological Networks

The ecological network indices reflect the characteristics of ecological network structure, and their values are positively correlated with corridor connectivity and network complexity [45]. Among them, the network circuitry (α) index reflects the degree of network looping, indicating the degree of possible selection of migration routes for energy, materials, and species. The line point rate (β) index indicates the mean value of the number of connections to each node. The network connectivity (γ) index indicates the ratio of the quantity of linked channels to the maximum possible number of connected channels inside the network [46]. The calculation formulae are as follows:
α = L v + 1 2 v 5
β = L v
γ = L 3 ( v 2 )
where L denotes the quantity of ecological corridors and v represents the quantity of ecological nodes.

3.3. Identification of Ecological Restoration Priority Areas

3.3.1. Identification of Ecological Pinch Points

In the present study, the importance of landscape elements in ecological corridors was identified based on the current density in circuit theory. In raster data, the current density is defined as the magnitude of current passing through a single image element, and areas with a high current density indicate a greater probability of electrons passing through a circuit [12]. These narrow or critical passages in the pathways of species movement are known in ecological networks as ecological pinch points, which are vital for dimensional energy flow and biodiversity. If these pathways are blocked, they may have far-reaching consequences for the entire ecosystem [47]. The pinch point mapper module in the Linkage Mapper tool captures current density distributions in the landscape to determine the location of ecological pinch points [48]. The cost-weighted corridor “width” was set to 10 km, superimposed on the results of the “all-to-one” model and the “pairwise” model, and classified into five categories using the natural breakpoint method, selecting those with the certain area of the highest value as the ecological pinch points.

3.3.2. Identification of Ecological Barrier Points

Ecological barrier points, which are areas with the largest current drops, are areas in the ecological network that would constitute an obstacle to the movement of species [12]. They significantly influence corridor quality, and they are areas that require priority for ecological restoration [49]. Ecological barrier points were identified through the barrier mapper module. In the present study, we set the search at 210 m and the cost-weighted corridor “width” at 10 km, and the natural breakpoint method was used to classify five categories and extract the highest values as ecological barrier points [50].

3.4. GeoDetector

GeoDetector is a set of statistical methods for detecting spatial dissimilarities, as well as revealing the driving forces behind them, allowing for the quantitative detection and identification of spatial attributes and the interactions between their explanatory factors, including factor detector, interaction detector, ecological detector, and risk detector [51]. Ecological sources are the core elements that reflect the characteristics of ecological networks. Therefore, we chose to use the factor detector and the interaction detector to analyze the driving factors of the distribution of ecological sources. The factor detector is designed to detect the spatial divergence of the dependent variable, and the q-value signifies the explanatory capacity of the independent variable (X) on the dependent variable (Y); a higher q-value denotes a more substantial explanatory influence [52]. The formula for the factor detector is as follows:
q = 1 h = 1 L N h σ h 2 N σ 2
where q represents the detection index value; h denotes the stratification of the independent variable Y or the dependent variable X; N and N h signify the total number of sample units in the entire domain and in layer h ; and σ h 2 and σ 2 indicate the discrete variances of the values in layer h and the overall domain Y [53].
The interaction detector is used to determine the interaction of two different independent variables and to quantify the magnitude of the effects of the interaction on the dependent variables. Specifically, this analytical tool examines whether the synergistic action of factors X1 and X2 enhances or diminishes their collective explanatory power regarding dependent variable Y, or, alternatively, determines if these factors exert mutually independent effects on Y [54]. The geographical distribution of ecological sources in Shenmu City was designated as the dependent variable (Y), informed by prior research and the present conditions in Shenmu City [55]. Six factors, namely, DEM (X1), slope (X2), population (X3), GDP (X4), precipitation (X5), and temperature (X6), were selected as the independent variables, to comprehensively explore the driving mechanisms for the formation and evolution of ecological networks.

4. Results

4.1. Spatiotemporal Dynamic Change Characteristics in Land Use

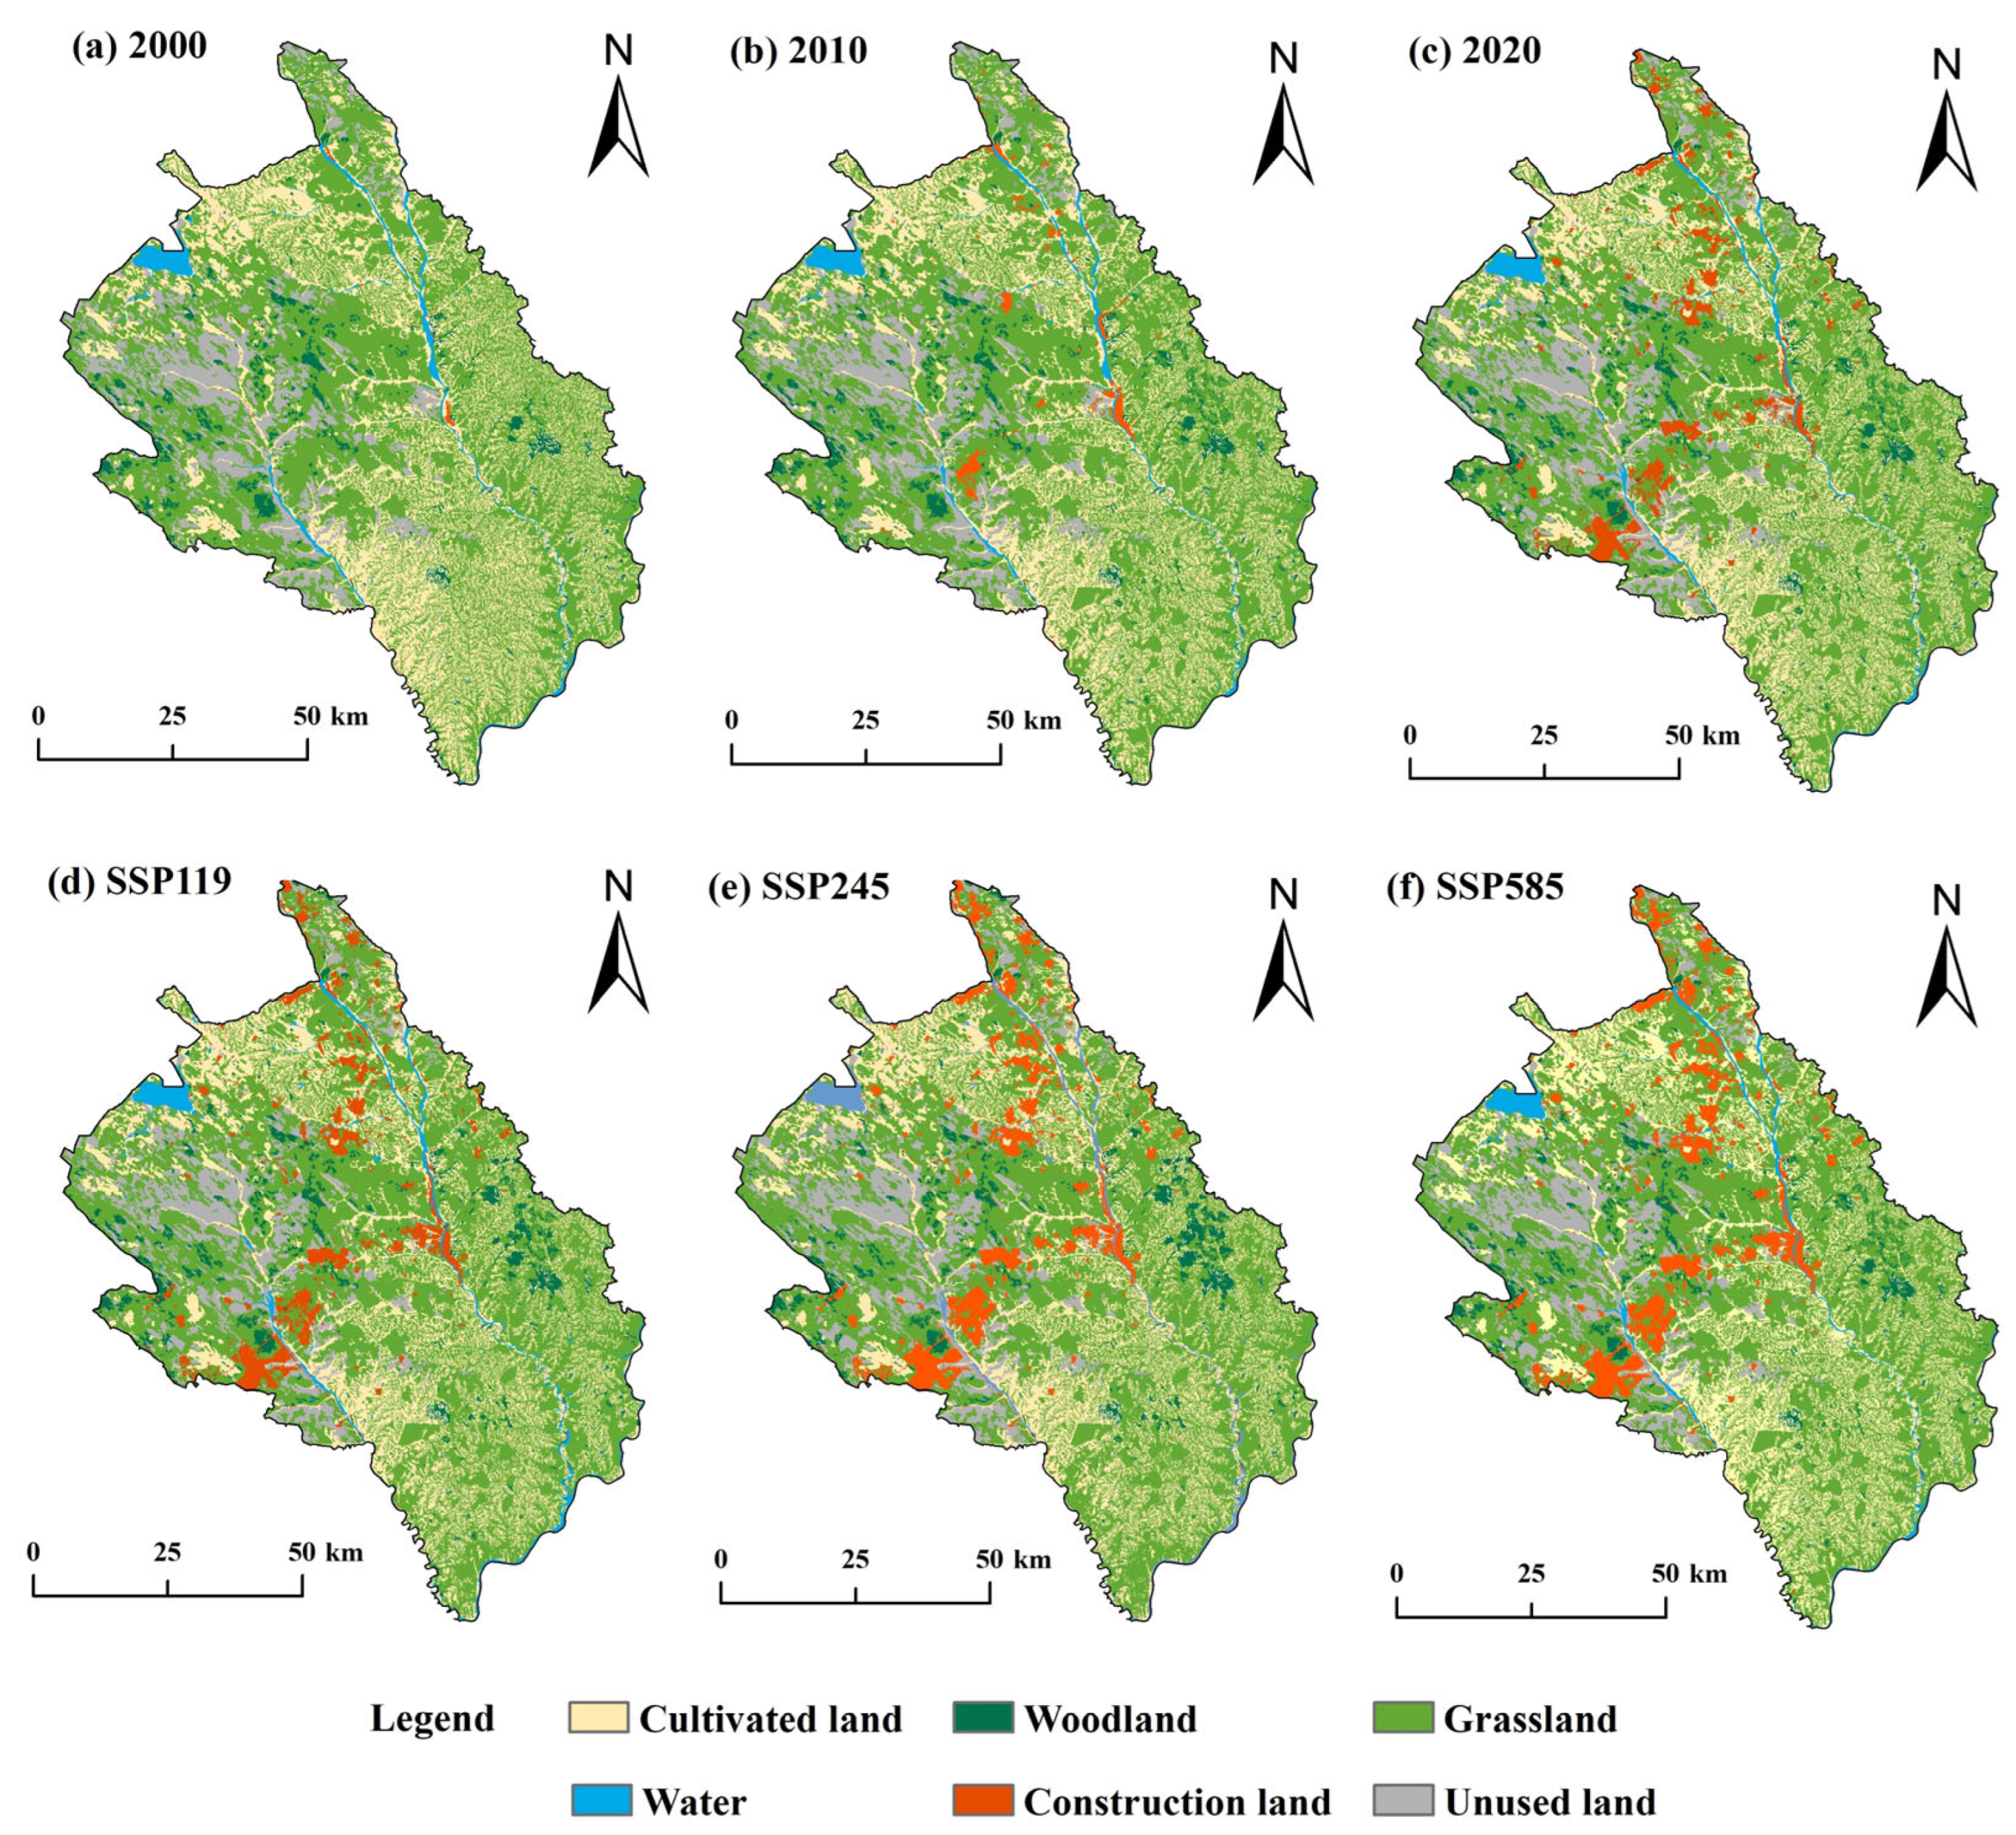
4.1.1. “Historical–Present” Land Use Changes

The land use from 2000 to 2020 indicated that grassland consistently constituted more than 50% of the entirety of the area in Shenmu City (Figure 4), making it the dominant land use type, distributed in all parts of the city, with large patches concentrated in the central and western parts. Cultivated land constituted the second largest land use type, scattered throughout Shenmu City, accounting for nearly 20% of the total. The primary type of land use expansion during the “historical–present” period was construction land, which expanded by 275.73 km2 in 2020 compared to the level in 2000. Before 2000, construction land was distributed in small amounts in a point-like manner in areas such as Linzhou Street, Dianta Town, and Jinjie Town. From 2010 onwards, influenced by coal mining and urban expansion, it expanded mainly in the areas of Linzhou Street, Dabaodang Town, Jinjie Town, and Sunjiacha Town. Cultivated land experienced the most significant transfer among land use types, with a total reduction of 257.57 km2. Overall, the land use types in the city have shifted toward urbanization, adversely affecting agricultural production and cropland security.

4.1.2. Future Land Use Changes Under Climate Change Multi-Scenarios

The calculated kappa coefficient of our model is 0.81 and the total precision is 87.67%; the error remains within acceptable limits and can be used to simulate future land use. The simulation results showed that, across the three future climate scenarios, both cultivated and unused land areas in Shenmu City will exhibit a declining trend in all scenarios (Figure 4). Cultivated land decreases the most in the SSP245 scenario, projected to drop by 99.13 km2 by 2035. Woodland will decrease by 21.23 km2 in scenario SSP585, whereas it will increase by 28.84 km2 and 28.17 km2 in scenarios SSP119 and SSP245, respectively. In SSP119, grassland will expand by 77.42 km2 by 2035 from its value in 2020, while it will continue to degrade by 51.30 km2 and 69.19 km2 under the SSP245 and SSP585 scenarios. The construction land will exhibit a distinct increase under all scenarios, particularly in the SSP585 scenario, which anticipates the most significant expansion of 170.94 km2, reflecting an increase of 58.21%. The general distribution of land use in 2035 will resemble that of 2020. Woodland will still be situated predominantly in the southeast and northwest of Shenmu City, but there will be a reduction in woodland in the Langanbao Town and Yongxing Street areas under the SSP585 scenario in comparison to in the other two scenarios. The construction land will expand from the existing areas, mainly in the west–central and northeastern parts of Shenmu City, such as Dianta Town, Jinjie Town, and Linzhou Street. Water will continue to vary around reservoirs, lakes, rivers, and wetlands within the Hongjiannao, Kuye, and Tuwei River basins.

4.2. Spatiotemporal Dynamic Change Characteristics in Ecological Networks

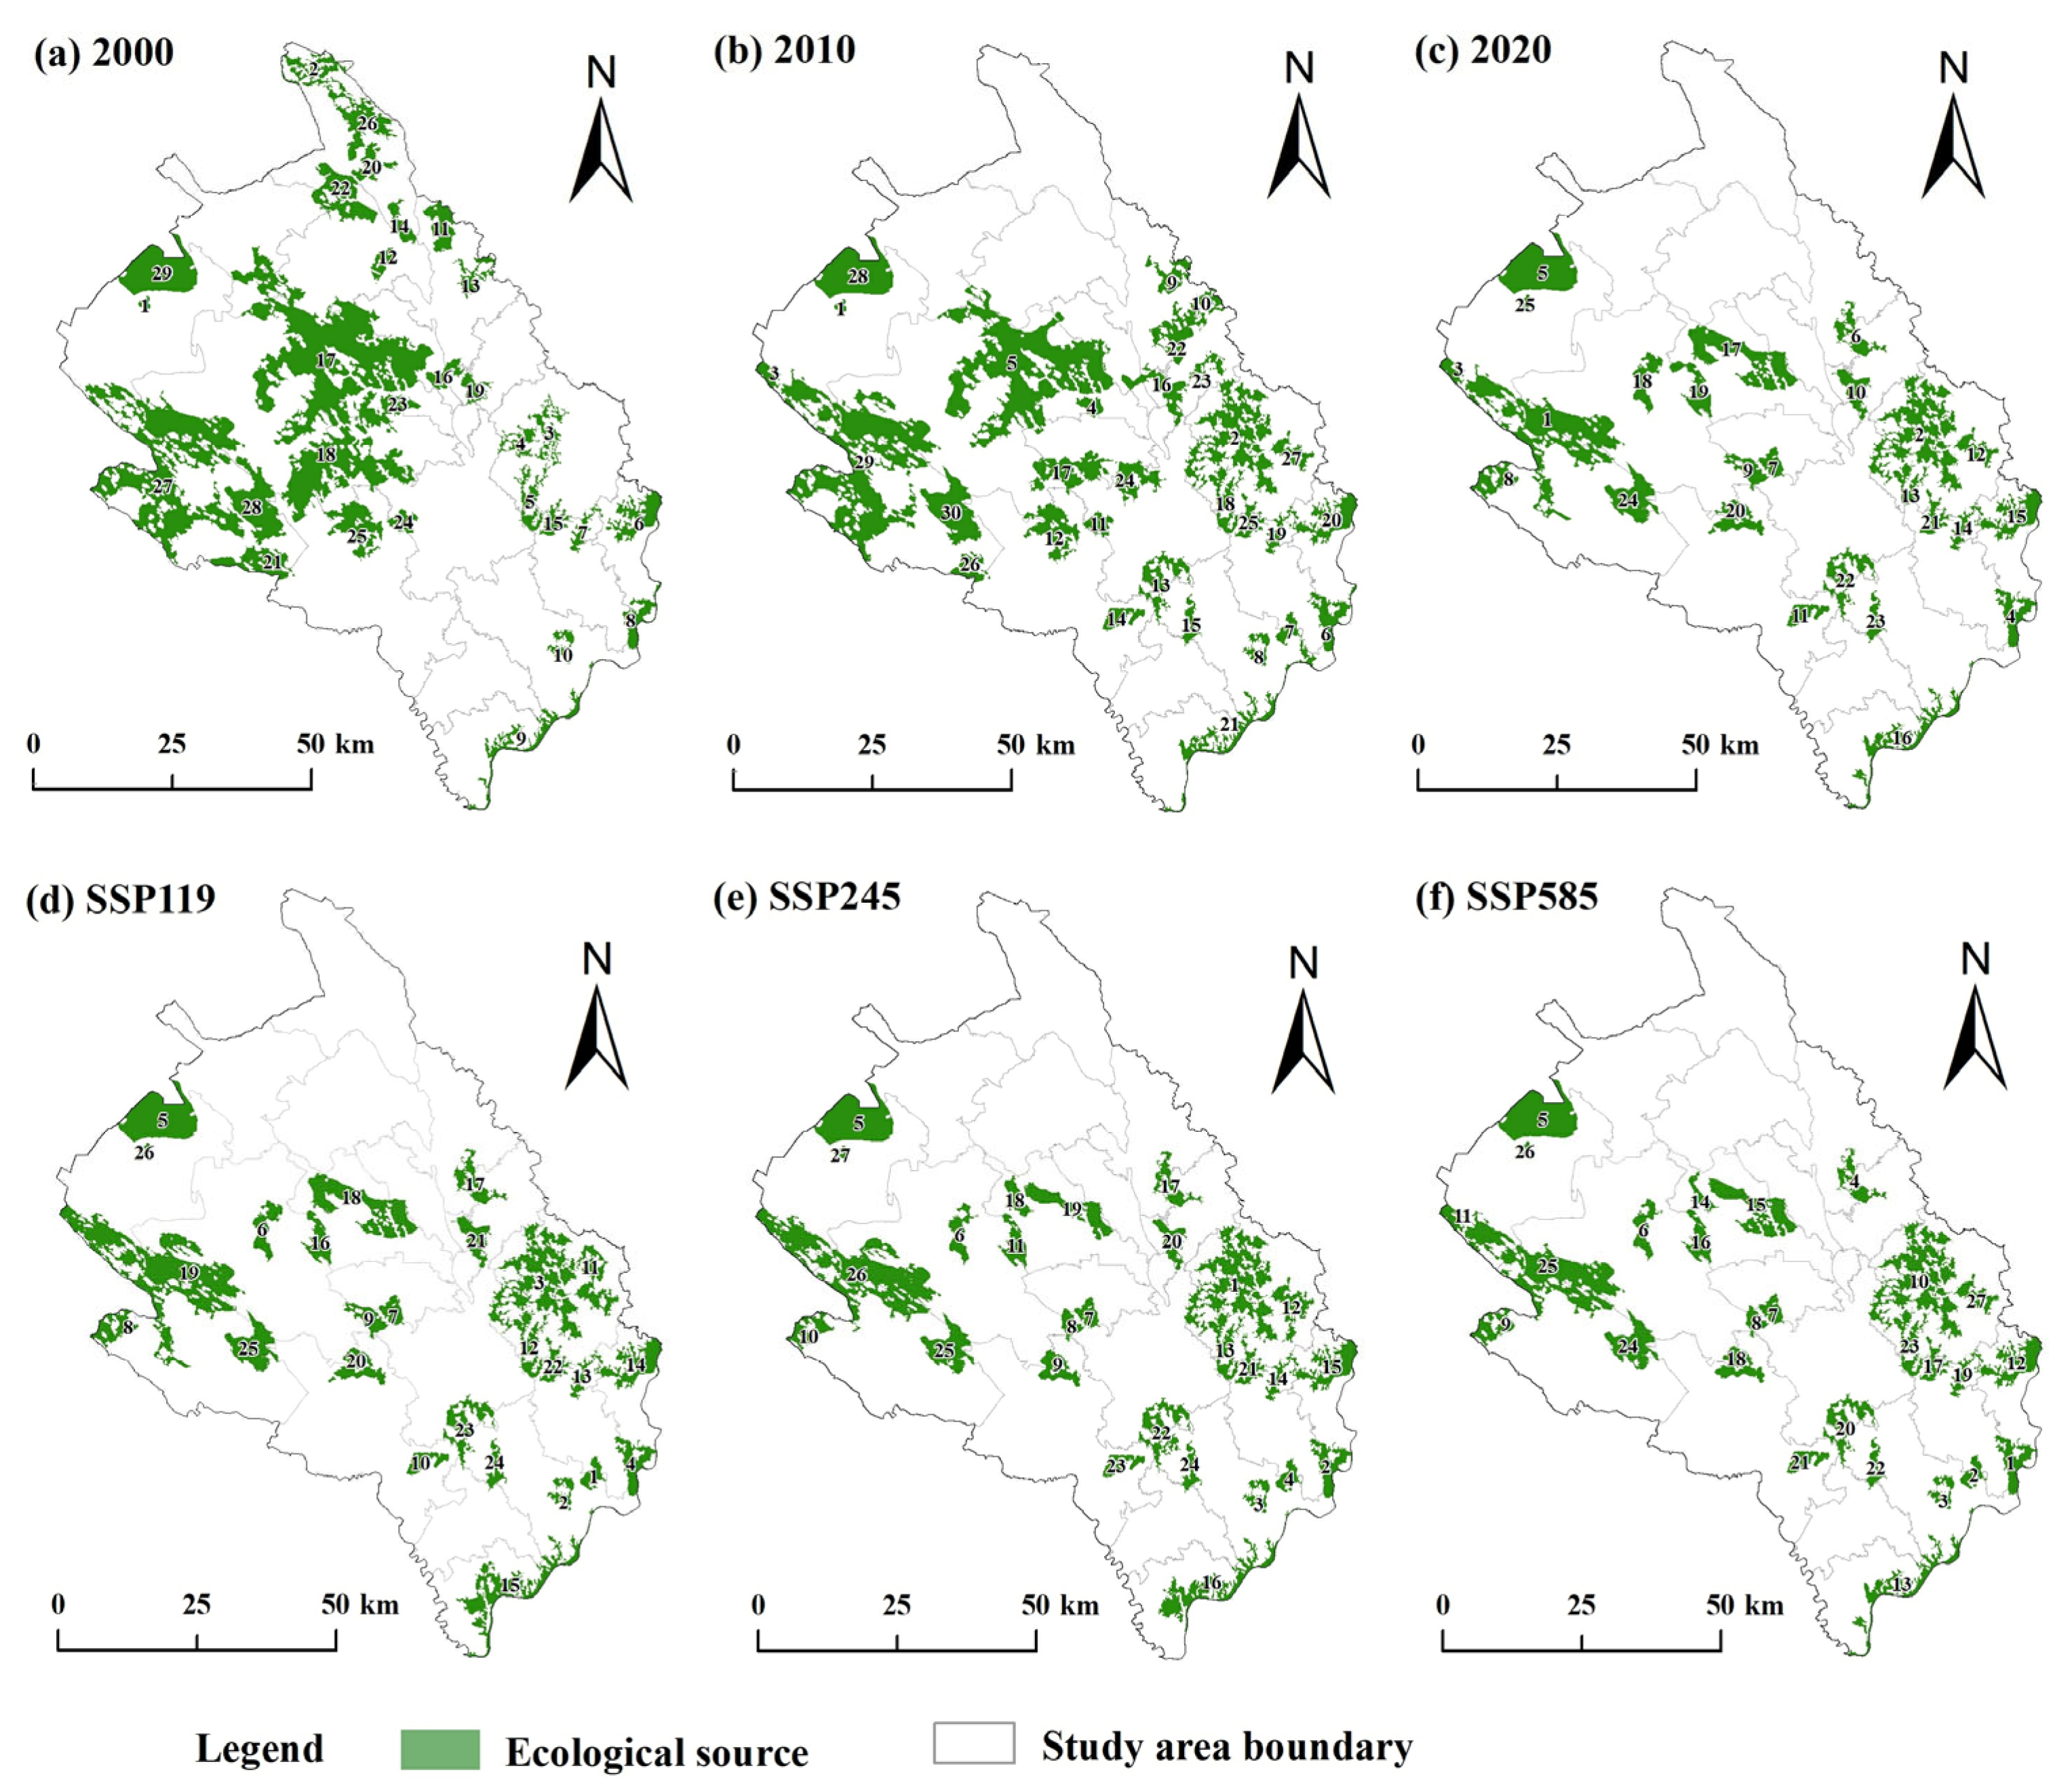
4.2.1. Dynamic Changes in Ecological Sources

In the years 2000, 2010, and 2020, the quantities of ecological sources in Shenmu City were 29, 30, and 25, respectively (Table 6). The extent of ecological sources exhibited a declining tendency, decreasing by an overall 613.82 km2 over the two-decade span, and the 2010–2020 interval showed the most dramatic decline in ecological sources. The gradual encroachment, isolation, and dividing of some large ecological sources reduced the size and diversity of the biological habitats in the areas, weakened their carrying capacity, and led to a gradual loss of ecological functions. For 2035, there are projected 26, 27, and 27 ecological sources for the three climate scenarios, respectively (Table 6). Compared with 2020, the ecological source area will increase in all scenarios excluding the SSP585 scenario, which decreased, with the SSP119 scenario showing the largest increase (95.00 km2).
In terms of spatial distribution (Figure 5), apart from nature reserves, the ecological sources in Shenmu City in 2000 were mainly in the central and northern parts of the city. However, from 2010 onward, the ecological sources in the north–central area were gradually lost, particularly in Daliuta Town and the southern part of Jinjie Town, which were impacted by coal mining and the establishment of industrial parks, resulting in a decline in the ecological source area. In contrast, in parts of southeastern Shenmu, ecological sources expanded due to increased woodland and grassland. The ecological sources in the scenarios for 2035 are predicted to have a primary increase in ecological sources in the southeast, near the Yellow River in Shamao Town and Hejiachuan Town. The ecological sources under the SSP119 and SSP245 scenarios will increase in the Yellow River mudflats south of Wanzhen Town and in the wind–sand grass shoal areas northwest of Jinjie Town. Under the SSP585 scenario, ecological sources are projected to be lost in the western part of Yongxing Street. In the central part of Xisha Street, the degree of reduction in ecological sources is expected to vary across different scenarios owing to the influence of urban sprawl in the area.

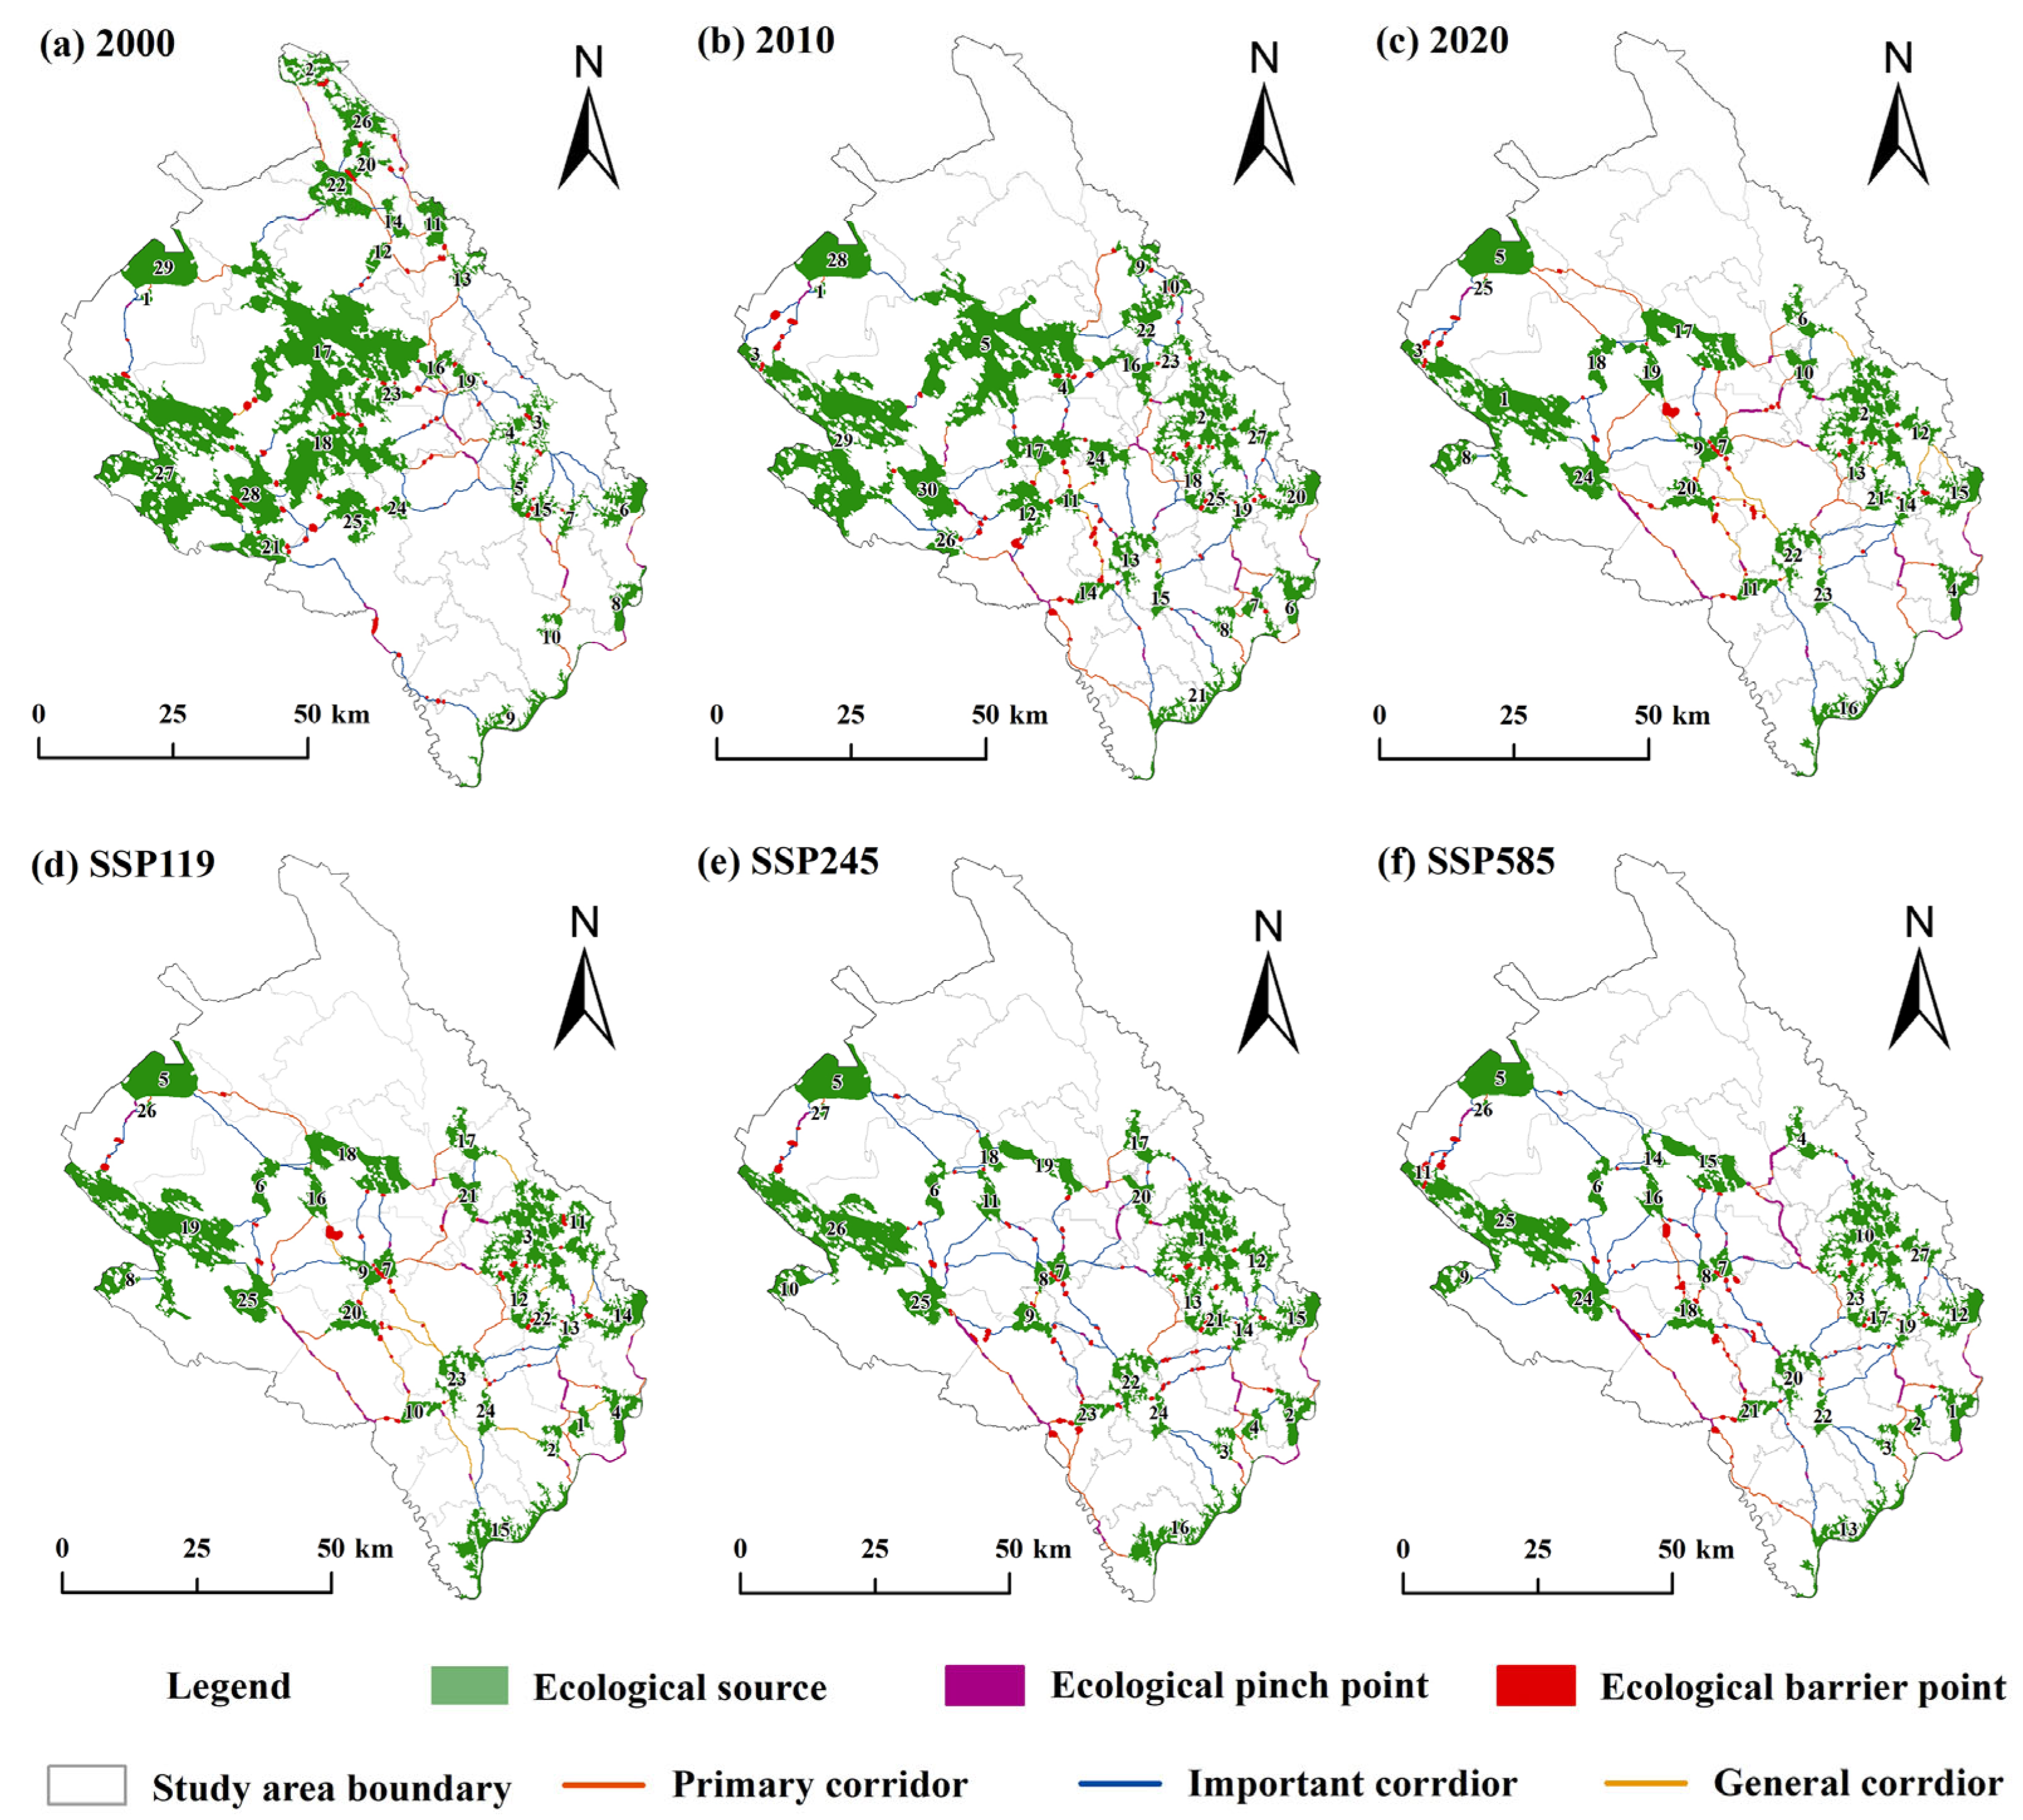
4.2.2. Dynamic Changes in Ecological Corridors

The overall ecological resistance value of Shenmu City is high, and the mean value of the ecological resistance surfaces showed a gradual upward trend. High-resistance areas were primarily situated in the areas including Linzhou Street, Jinjie Town, and Dabaodang Town. The areas were defined by large areas of wind–sand grass shoal areas and construction lands, which impeded species migration and energy transfer between ecological sources, thus weakening the linkages between ecological sources. The low resistance areas were primarily in the areas of Xisha Street, Yongxing Street, and Langanbao Town. The areas are in woodlands and grasslands of higher habitat quality, which are more conducive to species habitation and energy transfer among ecological sources. Based on the linkage mapping tool, we extracted 63, 71, and 56 ecological corridors for the years 2000, 2010, and 2020, respectively (Table 6), with the total length of the corridors being 568.82 km, 616.47 km, and 609.44 km, respectively. The ecological corridors in Shenmu City consisted mainly of grasslands and waters, which vary in spatial distribution over different time periods (Figure 6). In 2000, urban ecological corridors were more numerous in the central and eastern parts of the city, while they were less distributed in the southern part. In 2010 and 2020, the number and complexity of ecological corridors increased more evenly in the central and southern parts, but there was some loss in the northeastern part.
The SSP119, SSP245, and SSP585 scenarios predict the quantity of ecological corridors in 2035 to be 58, 60, and 60, respectively, with minimal differences between them. However, the total length of the ecological corridors under the SSP119, SSP245, and SSP585 scenarios differs, with projections of 584.92 km, 671.86 km, and 705.39 km, respectively. The total length of ecological corridors will be the shortest in the SSP119 scenario, indicating that the implementation of the “Grain for Green” project, along with other ecological restoration projects, will positively impact species migration and energy flow among different source patches. The increase in woodland and grassland areas will reduce the resistance values in the areas, thereby reducing the required ecological corridor distances between the different ecological sources. Spatially, the general orientation of the ecological corridors in the scenarios will be similar in the northwestern part of the city (Figure 6). However, in the southeastern part of the city, the ecological corridor lengths in the SSP245 and SSP585 scenarios will be longer than those in the SSP119 scenario. This difference is due to the distinction between ecological sources and ecological resistance surfaces under different scenarios. Notably, the longer ecological corridors are primarily distributed in the Tuwei River Basin in the southwestern part of the city. These areas exhibit a high concentration of cultivated land, unused land, and construction land, resulting in significant ecological resistance, as well as a low number and fragmented distribution of ecological source patches. The ecological corridors are characterized by a riverine distribution pattern, with both sides of the corridors subject to intense disturbances from human construction activities, making them more prone to fragmentation and damage. This situation further increases the risks and uncertainties in biological migration and energy flow processes.

4.2.3. Assessment Results of Ecological Networks

In the years 2000, 2010, and 2020, the α index of the ecological networks in Shenmu City was recorded at 0.66, 0.76, and 0.71, respectively (Table 6). This trend of increasing and then decreasing reflected the changes in the efficiency and structure of material and energy flow in the ecological network. The tendency of the beta and gamma indices to increase and then decrease is further evidence of this volatility trend. In 2035, the α, β, and γ indices are projected to vary across the three scenarios, with SSP119 and SSP585 showing increases in all three indices compared to in 2020. Under the two scenarios SSP119 and SSP585, there will be increased circulation among different ecological sources and enhanced connectivity of ecological networks, contributing to the enhancement of local biodiversity. Although the indices of the SSP585 scenario will be slightly higher than those of the SSP119 scenario, the ecological source area of the SSP119 scenario will be 134.57 km2 larger than that of the SSP585 scenario. This suggests that implementing land control, ecological restoration, and conservation projects under the SSP119 scenario will enhance species exchange and energy flow, promote sustainable urban environments, and represents the optimal approach for future ecological management.

4.3. Analysis of Dynamic Changes in Ecological Nodes

4.3.1. Ecological Pinch Points Change Analysis

Comparing ecological network elements across different time periods and assessing the predicted outcomes of ecological restoration and protection can offer significant guidance for future ecological restoration and urban planning efforts. We generated a distribution map of ecological pinch points in Shenmu City for the three time periods by overlaying the analysis, merging the overlapping areas of the two models, and eliminating the redundant ecological pinch points. The numbers of ecological pinch points in 2000, 2010, and 2020 were 19, 27, and 22, respectively, indicating an increasing trend followed by a decrease. Spatially, the pinch points were predominantly located in areas such as wetlands, grasslands, and woodlands in the central and southeastern parts of the city, which fall into the land use category of high habitat quality (Figure 7). The ecological pinch points in the SSP119, SSP245, and SSP585 scenarios are projected to increase by 2035 compared with in 2020, with 27, 30, and 30 pinch points, respectively. Although the distribution of ecological pinch points will continue to resemble that in 2020 under all three scenarios, it will be partially differentiated by differences in ecological networks and resistance surfaces.

4.3.2. Ecological Barrier Points Change Analysis

The analysis revealed that the numbers of ecological barrier points in Shenmu City were 62, 68, and 49 in 2000, 2010, and 2020, respectively, with corresponding areas of 51.45 km2, 53.33 km2, and 39.98 km2, demonstrating an initial increase followed by a decline. By 2035, under the SSP119 scenario, the number of ecological barrier points is projected to decrease to 40 with an area of 36.03 km2, lower than the 2020 baseline. This indicates that ecological control strategies and restoration efforts are expected to positively enhance the structural stability of ecological networks. In contrast, under the SSP245 and SSP585 scenarios, the number of ecological barrier points is anticipated to rise to 66 and 74, covering areas of 49.74 km2 and 50.13 km2, respectively, both exceeding the 2020 levels.
Spatially, ecological barrier points are predominantly concentrated in the central and western regions of the study area. From 2000 to 2010, these points exhibited outward expansion from the central area, whereas by 2020, concurrent contraction in peripheral areas and clustering in the central region were observed. Under future scenarios, the spatial distribution patterns of ecological barrier sites across all three scenarios will be approximately the same as those observed in 2020, although inter-scenario differences in quantity and spatial layout will persist. In the SSP119 scenario, the spatial distribution of ecological barrier points will be more decentralized. Under the SSP245 scenario, the newly formed points will concentrate in urban expansion zones, such as the northwestern industrial area. In the SSP585 scenario, a dual “center–periphery” clustering pattern will emerge, characterized by increased resistance to species migration and impeded connectivity of ecological networks, exacerbating ecological network fragmentation.

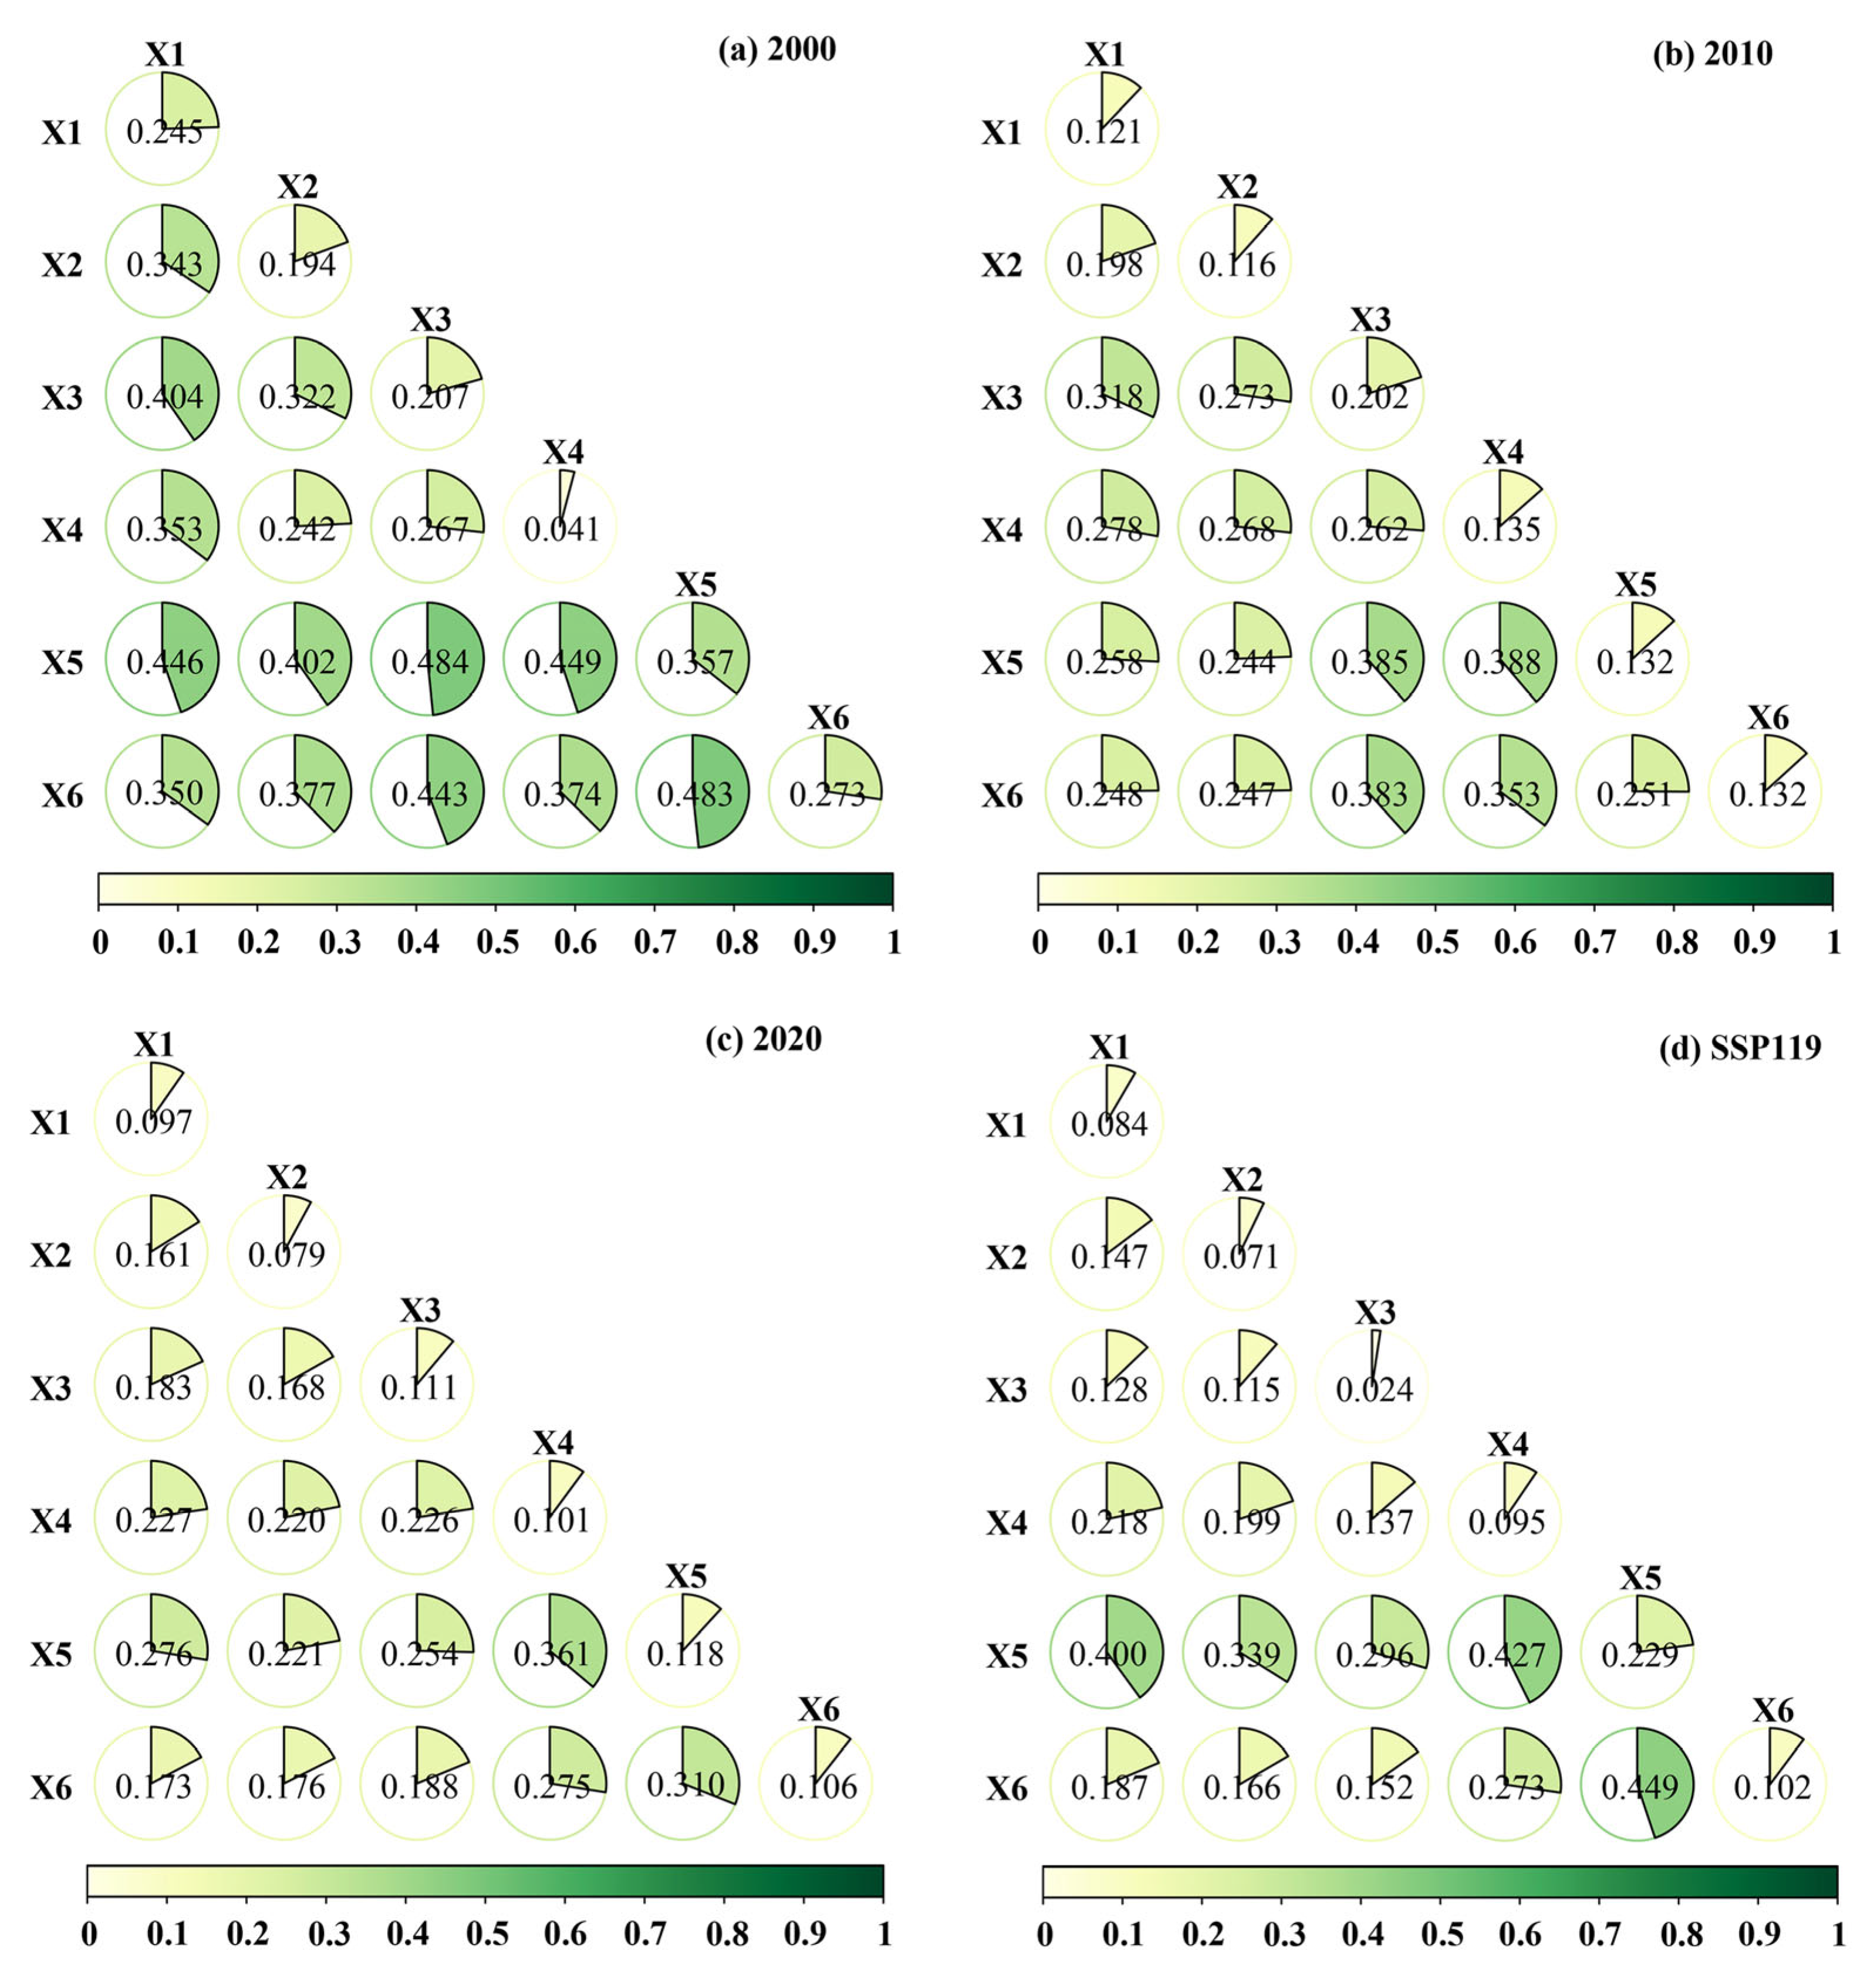
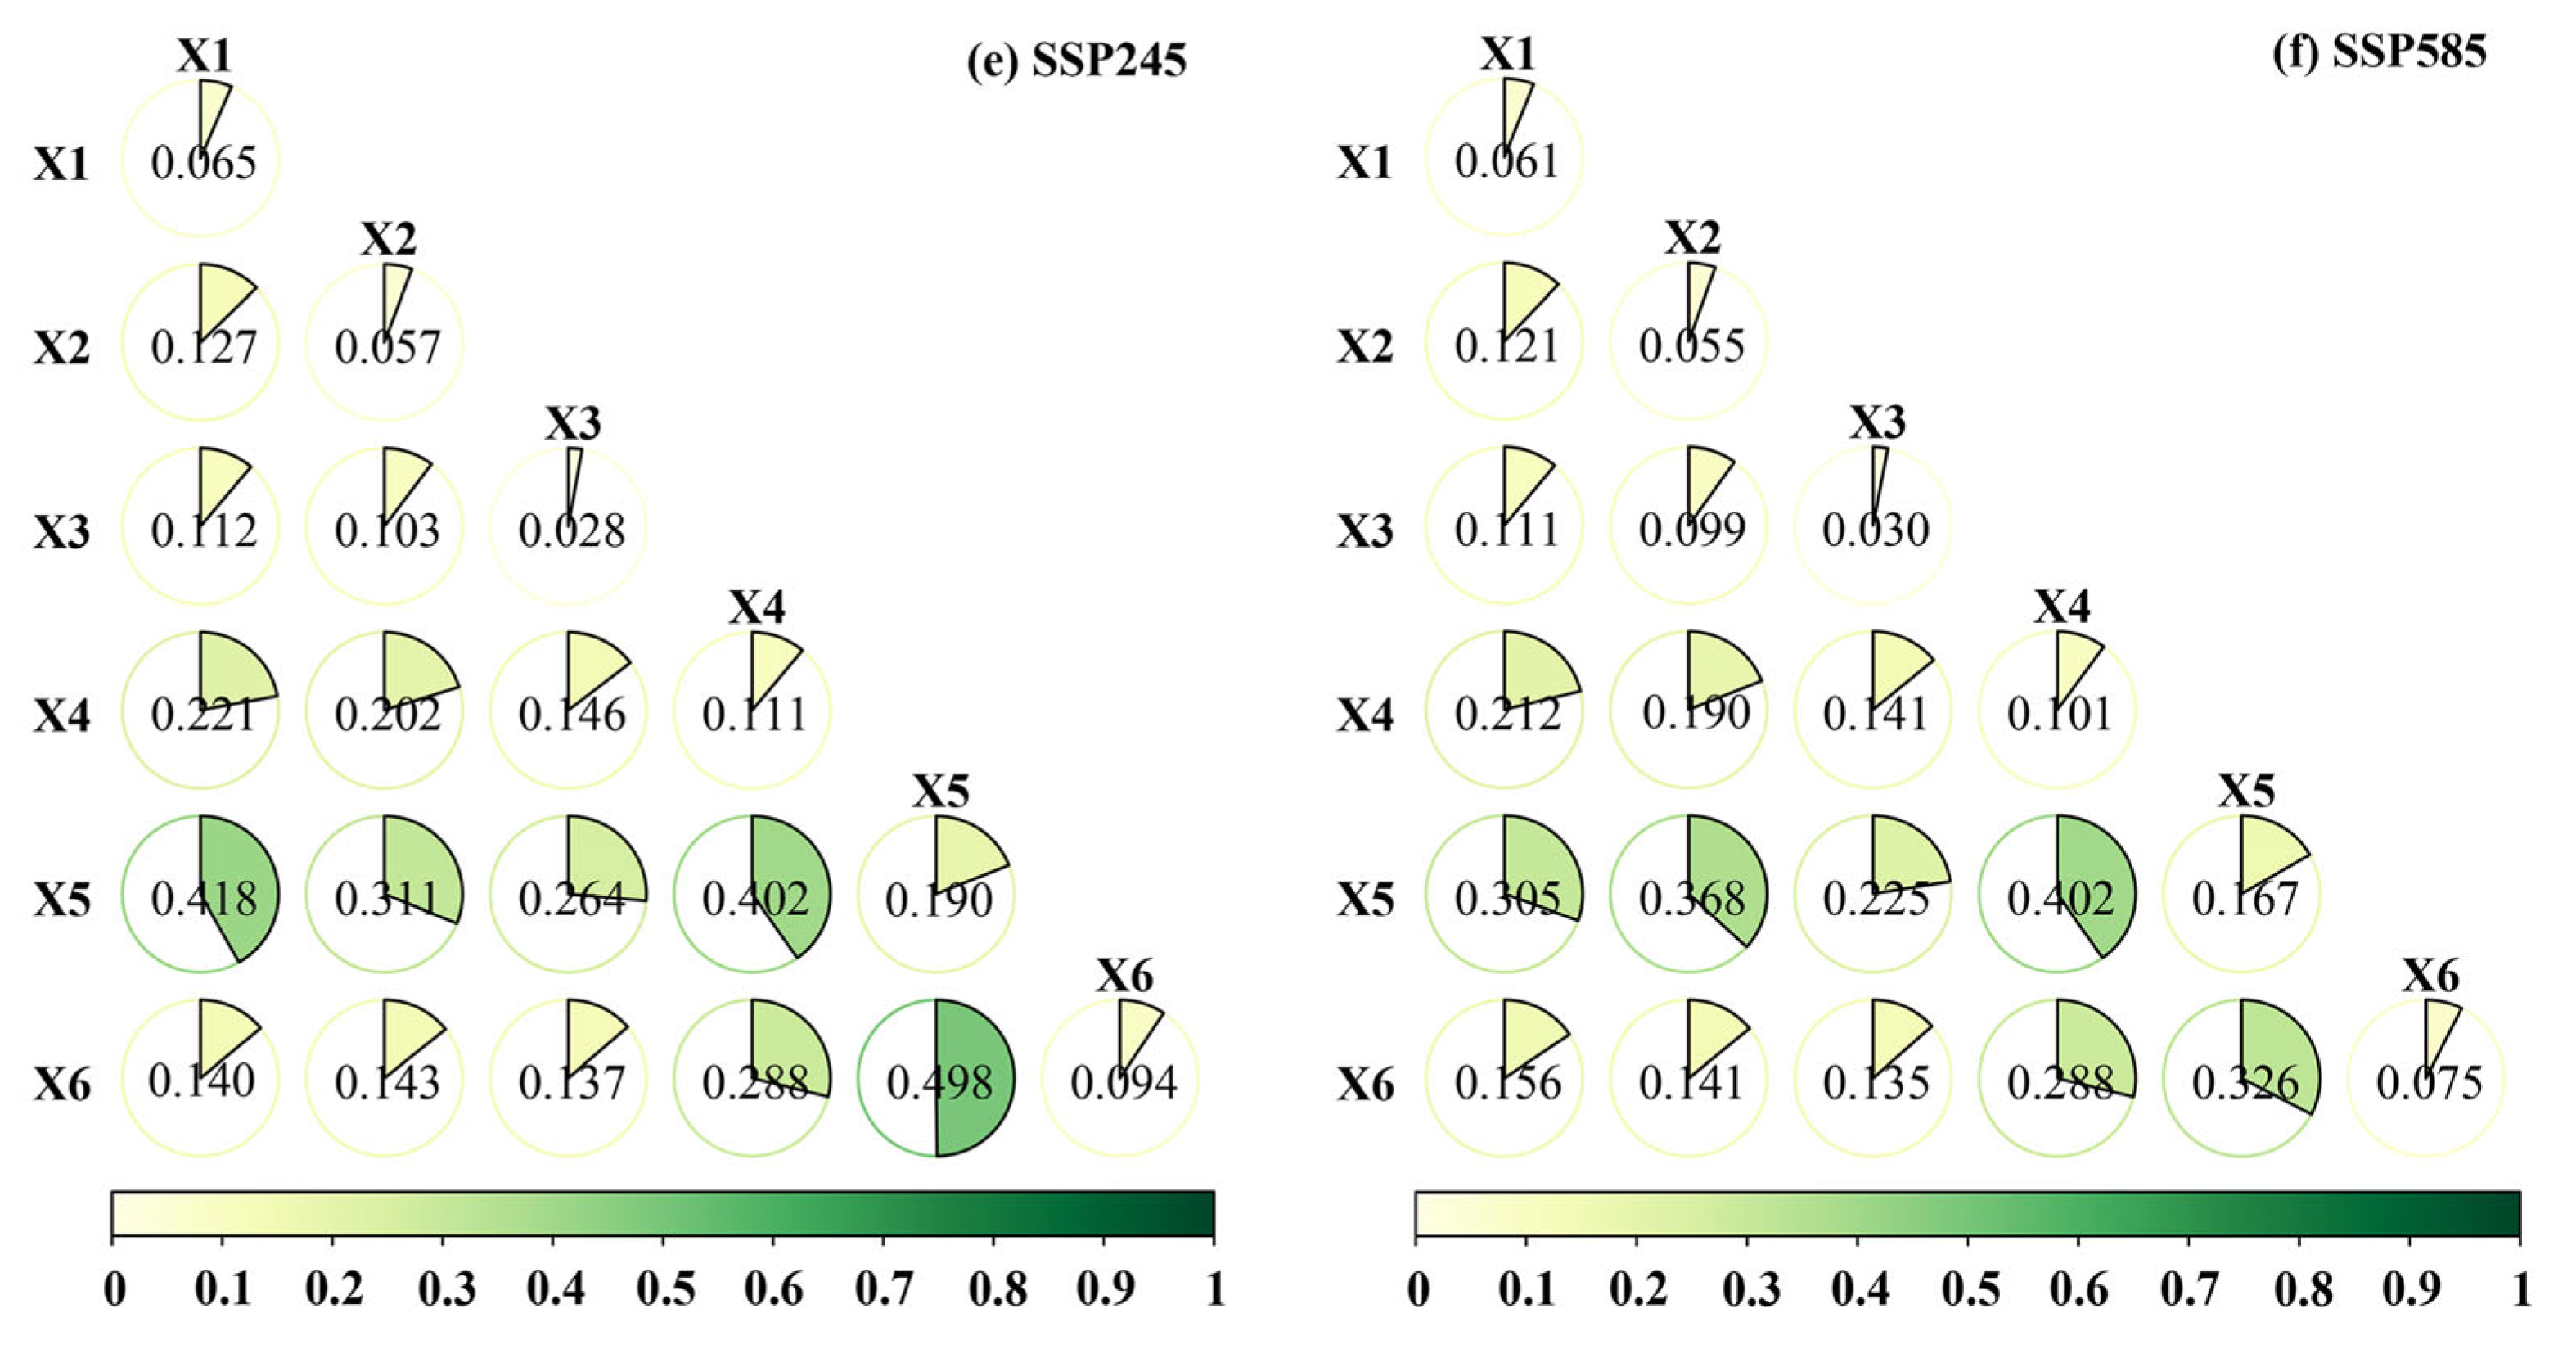
4.4. GeoDetector Analysis

We examined the drivers of the ecological networks through an analysis of the factors affecting the distribution of ecological sources in Shenmu City. The factor detector results revealed that from 2000 to 2035, the variables affecting the distribution of ecological sources differed in the degree of the influence in different time periods (Figure 8). The average q-value of precipitation, which was 0.19 among the factors affecting the ecological source spatial distribution, had the highest degree of influence, followed by temperature. This indicated that climatic factors significantly influence the ecological networks in Shenmu City. The GDP was the factor with the highest variation in its degree of influence across different periods. From 2000 to 2035, the interaction detector results exhibited both two-factor enhancement and nonlinear enhancement, suggesting that the spatiotemporal evolution of the ecological sources in Shenmu City was the consequence of the interaction of a variety of factors (Figure 9). The interactions between precipitation and the other influencing factors are the most prominent, with the highest mean value for the precipitation ∩ GDP interaction (q = 0.405), followed by precipitation ∩ temperature (q = 0.386).

5. Discussion

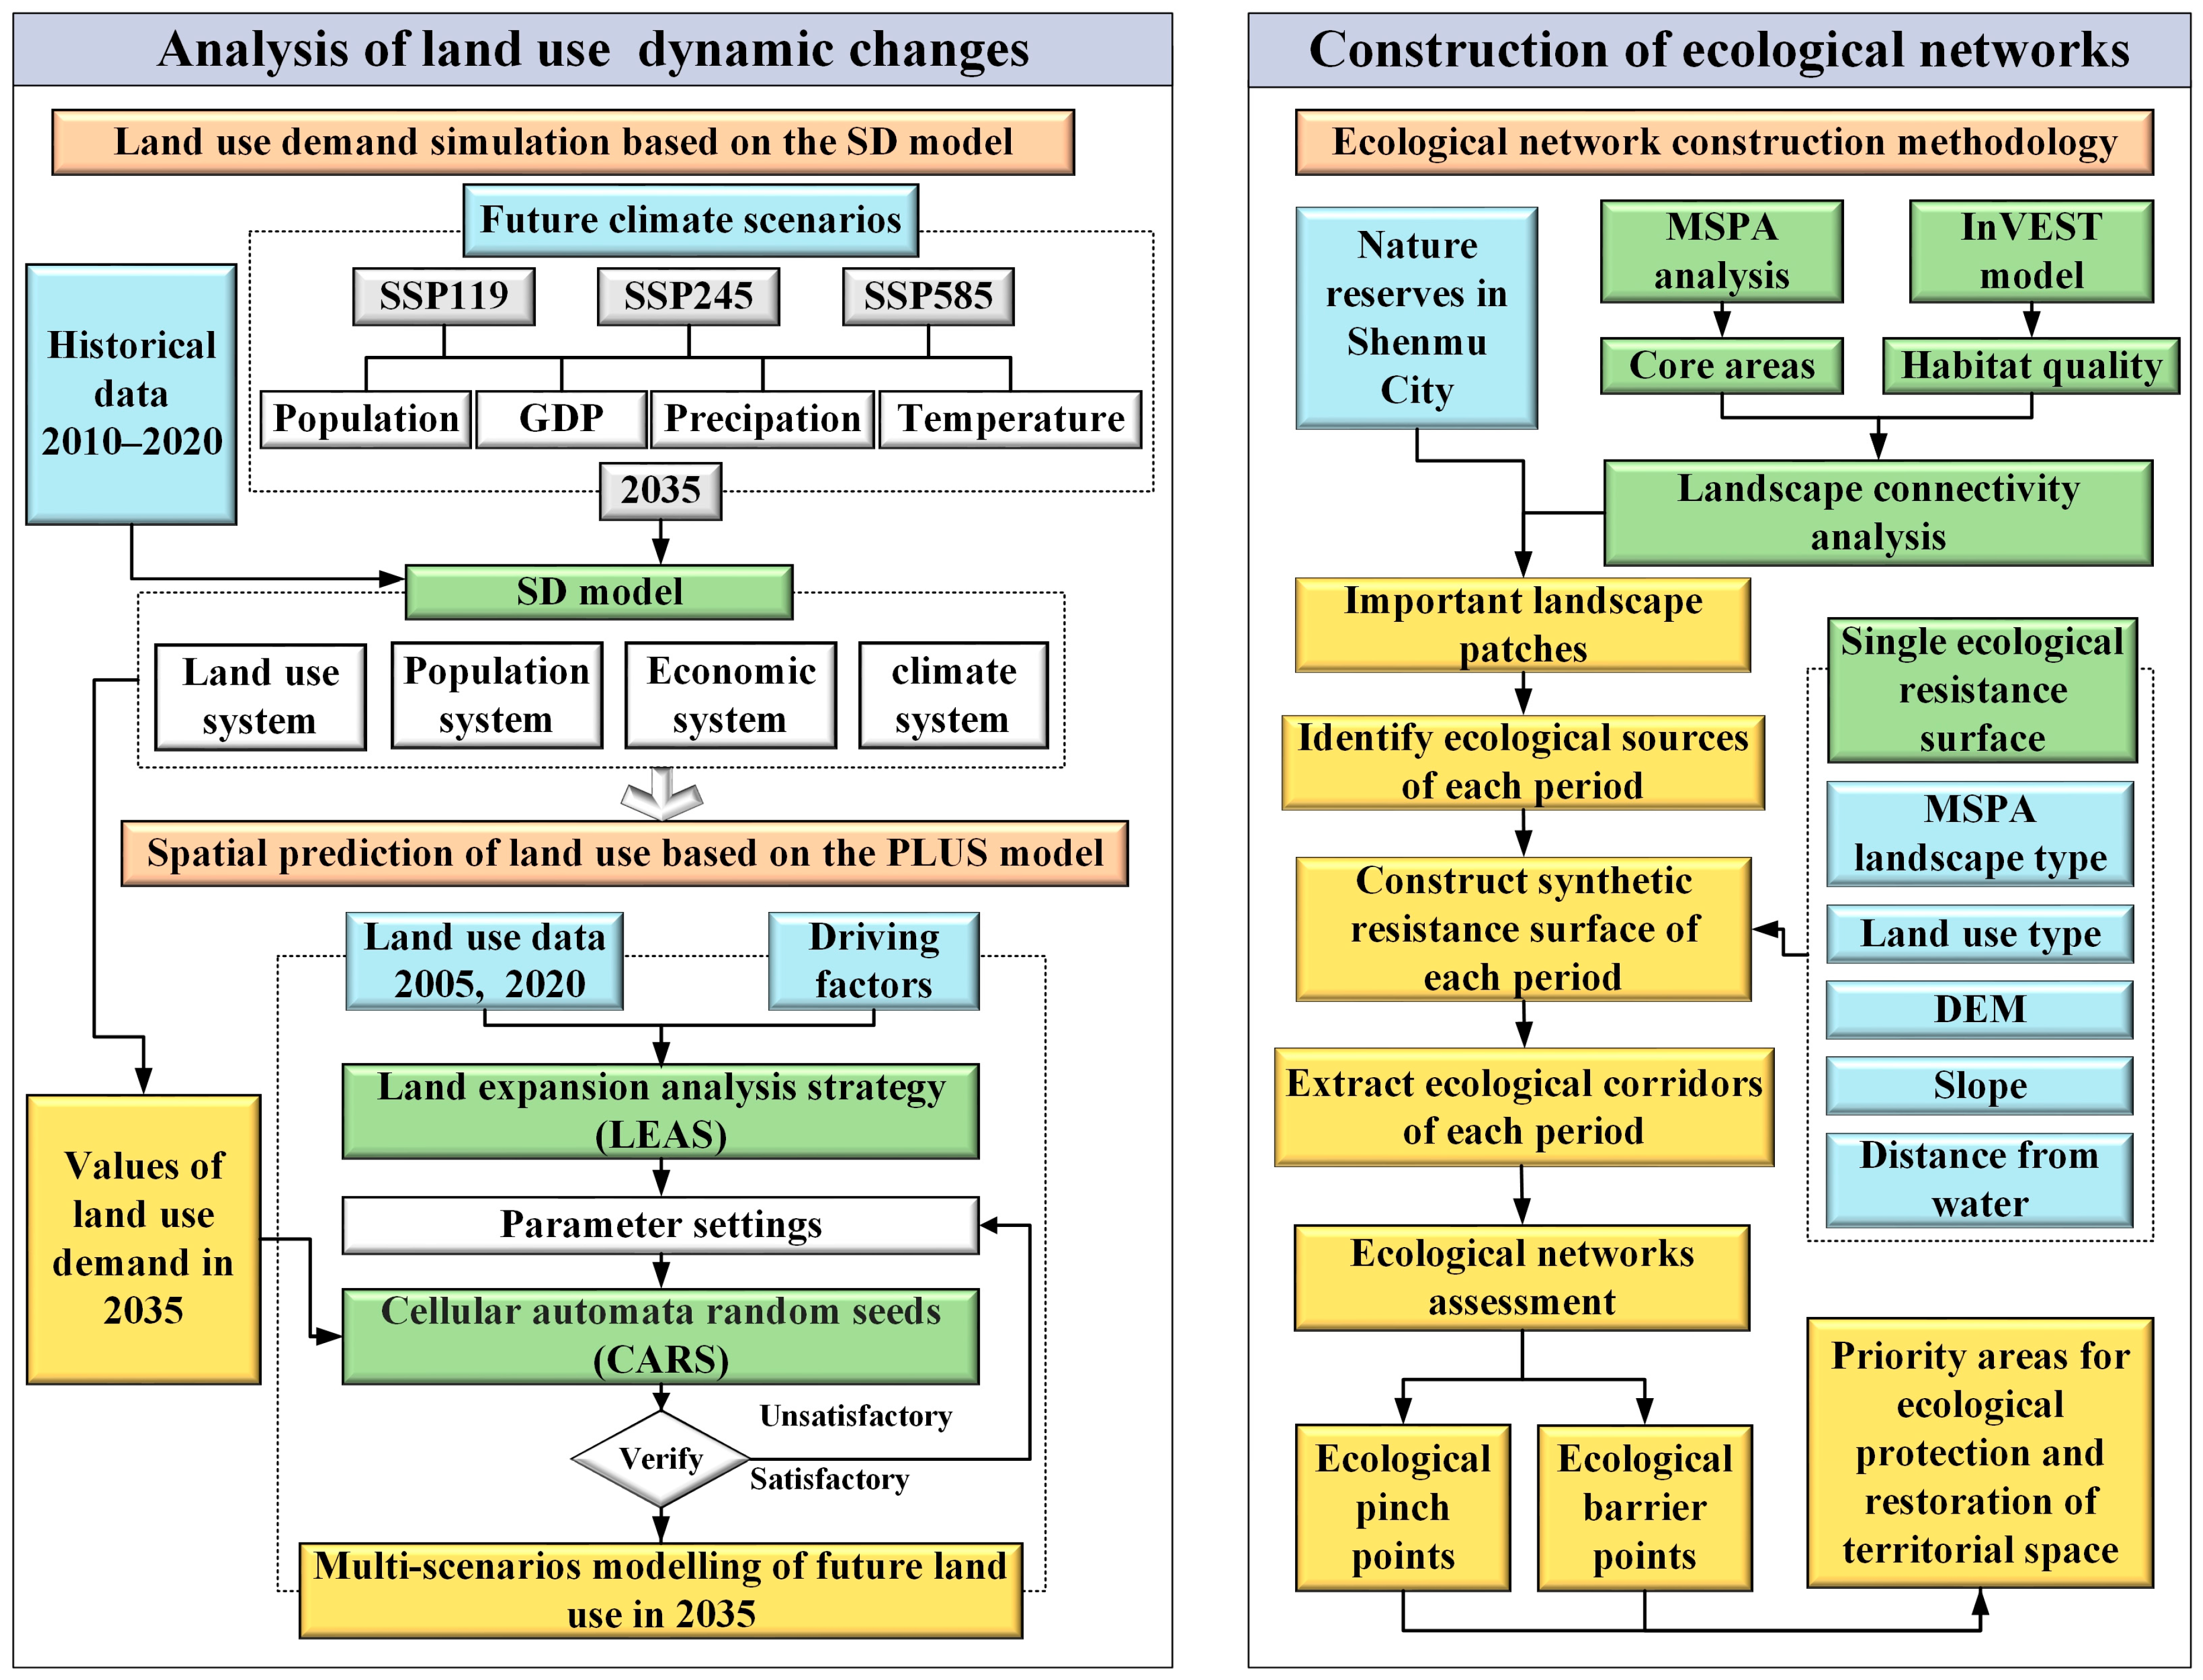
5.1. Framework of Ecological Network Analysis in Multi-Scenarios Under Climate Change

In contemporary academic research, the “ecological source identification–resistance surface construction–corridor extraction–node identification” framework has become crucial for constructing ecological networks and identifying key elements [42]. Ecological network elements and their spatial differentiation mechanisms are influenced significantly by climate change, land use change, and ecological policies. Similarly, dynamic changes in ecological networks also guide, radiate, and drive regional ecological restoration and protection projects and even the optimization and control of territorial spatial planning. Related studies have identified more ecological sources in the southeast part of the city [5,56]. However, the present study enhanced the ecological source identification methodology by incorporating ecological reserves, improving habitat integrity, and minimizing subjectivity in the source identification process. Furthermore, in contrast to prior studies that predominantly focused on the construction of ecological networks [57], we used the SD-PLUS coupled model and the framework for constructing ecological networks to analyze the spatiotemporal dynamics of ecological networks, with a focus on the spatiotemporal heterogeneity of ecological network elements. Over the past two decades, the effects of climate change, urbanization, and coal mining has progressively exacerbated fragments of ecological source patches, which has threatened the ecosystems of Shenmu City and seriously affected the ecological security of the national space. This trend was most pronounced in the central and western parts of the city, where a significant decrease in the extent of ecological sources was observed. By modeling the structure of the ecological network in 2035 under various climatic conditions, the results show that the SSP119 scenario would be preferable over the SSP245 and SSP585 scenarios. The results are consistent with research results from other regions. The SSP245 scenario represents a continuation of current development, with increasing temperatures [58], population growth, and urbanization rates resulting in a 48.73% expansion of construction land, leading to a decrease in habitat quality and reduction in the stability of the ecological network structure. The SSP585 scenario shows rapid economic growth, which leads to a dramatic reduction in ecological land use, with construction land expanding by 58.21%. The increase in greenhouse gas emissions under this scenario also triggers more frequent extreme weather events and droughts, further destroying ecosystems and biodiversity and causing the loss of ecological source areas. A study by Alkemade highlights that SSP5-RCP8.5 exerts the most severe impacts on biodiversity, projecting a 50% loss of original species in grasslands by 2100 [59]. In contrast, the SSP119 scenario would experience the least warming. Under conditions of high economic development, high urbanization, and low population growth, strict control over ecological land such as grassland woodland, combined with the implementation of ecological restoration projects, would effectively enhance the area of ecological sources and stabilize the structure of the ecological network. Men and Pan [60] showed that rigorous land management policies under ecological conservation scenarios yield the highest number of ecological sources and critical ecological corridors, enhancing network connectivity robustness and supporting urban sustainable development. Therefore, it is essential to incorporate climate and land use changes under future climate scenarios into ecological network planning, prioritizing ecological restoration and conservation while ensuring high-quality economic development, so as to promote the sustainable development of urban ecosystems.

5.2. Suggestions and Strategies for Future Ecological Restoration

In future, as the strategy of ecological protection and high-quality development in the Yellow River Basin continues to advance [61], Shenmu City will face the challenges of urban development, ecological restoration, and protection. We constructed and analyzed ecological networks and influencing factors for the years 2000–2035, aiming to attenuate the influence of climate change and rapid urbanization on urban ecosystems. Based on the ecological network elements of the optimal scenario SSP119, we identified 27 ecological pinch points and 40 ecological barrier points, and recommended the points as priorities for future ecological restoration and protection. The specific recommendations are given below.
First, Shenmu City should prioritize the enhancement of ecological source areas by delineating ecological redlines and implementing stringent land management strategies tailored to the distinct characteristics of the areas. The spatial distribution of ecological sources in Shenmu City is uneven, with concentration in the Hongjiannao Nature Reserve, Choubai Nature Reserve, Yaozhen Reservoir, and the southeastern urban periphery. Notably, the northeastern region exhibits a severe deficiency in ecological sources. To address this, the city should not only reinforce existing protected area systems to safeguard native wildlife but also establish ecological buffer zones along the edges of central urban areas. In the western and northeastern mining-degraded zones, efforts should focus on geological environmental protection, ecological restoration, and revegetation of collapsed mining areas. Second, hierarchical management of ecological corridors must be enhanced to improve connectivity. Key ecological corridors in Shenmu City, centered on the Yellow River, Kuye River, and Tuwei River, play vital ecological roles. The development intensity within these corridors should be regulated strictly to minimize human disturbance. Concurrently, ecological water replenishment, flow regulation, and the creation of riparian buffer zones and wetlands should be prioritized to ensure unimpeded animal migration and energy flow. Third, the protection and restoration of ecological nodes are critical. For ecological pinch points, conservation measures should emphasize preserving natural integrity and implementing greening initiatives to enhance the habitat quality while mitigating anthropogenic impacts. Restoring degraded ecosystems through vegetation rehabilitation is essential. The rehabilitation of ecological barrier points is particularly crucial for rebalancing ecosystems, enhancing biodiversity, and improving ecosystem resilience. Artificial structures contributing to barrier points may require removal or relocation to restore corridor accessibility. Where removal is not feasible, alternative solutions such as wildlife tunnels or crossing facilities should be adopted to optimize ecological network functionality.

5.3. Driving Factors Influencing the Ecological Networks

Land use is a key factor in the construction of ecological networks, and it is affected by climate change, natural factors, and socioeconomic conditions [62]. Similarly, the dynamics of ecological network elements are shaped by the interplay between climate and socioeconomic changes. Currently, most studies on constructing ecological networks focus on their construction and optimization [14], whereas we used GeoDetector to identify the magnitudes of the impacts of different factors (DEM, slope, population, GDP, precipitation, and temperature) on the distribution of ecological sources. The study results indicated that, among the factor detections of the driving factors, climatic factors were the key factors influencing the distribution of local ecological sources. Related studies have also indicated that changes in precipitation and temperature influence vegetation growth and animal distribution, in turn affecting habitat and ecological source distribution [63,64]. In the interaction detector results, the mean q-value for precipitation ∩ GDP reached the highest value of 0.405, which indicated that the interaction of precipitation and GDP was the key driver of the changes in the distribution of ecological sources. GDP and population are major factors reflecting human activities, particularly in the context of large-scale coal mining in Shenmu City, where economic activities are primarily construction land. Therefore, the spatiotemporal changes in GDP can reflect urban construction land trends to a certain extent, thus indirectly reflecting patterns and trends in ecological sources due to land use change. In summary, land use change brought about by climate change and urban economic development has dynamically altered local ecological sources, which adversely affect the ecosystem and biodiversity of Shenmu City. To address the challenges, a comprehensive strategy integrating economic restructuring and climate adaptability is essential. Priority should be given to optimizing industrial and mining construction land through economic measures, such as establishing eco-industrial parks for mine land reclamation, adjusting the coal industry structure, and setting up an ecological compensation fund. Concurrently, enhancing the climate adaptability of ecological networks requires implementing intelligent monitoring systems integrated with predictive modeling for critical ecological sources and corridors, complemented by early warning mechanisms. In the northwestern Shenmu loess hilly–grassland transition zone, efforts should be made to accelerate mixed shrub forest rehabilitation and carbon sequestration projects to reinforce ecological buffers. Furthermore, adaptive water management should adopt an eco-agricultural integrated water scheduling model, prioritizing ecological water allocation for key habitats such as Hongjiannao Wetland and vegetation within ecological corridors. Cross-sectoral coordination mechanisms should be formalized to reconcile conservation objectives with socioeconomic development, to ensure the long-term functionality of regional ecological networks under climate change pressures.

5.4. Deficiency and Prospects

The present study analyzed the spatiotemporal dynamics of the ecological networks in Shenmu City from a “historical–present–future” perspective, and provided recommendations for ecological restoration and protection. However, certain limitations must be acknowledged: (1) When simulating future climate scenarios, only three scenarios, SSP119, SSP245, and SSP585, were adopted, and only precipitation and air temperature were selected as climate factors. Therefore, future studies should consider additional climatic factors. (2) The present study was carried out using the downscaling method based on 30 m resolution data; however, due to the diversity of data sources, differences in resolution may lead to limitations in scale. As a result, some of the data from certain years may lack details, which increases the uncertainty of the results of land use simulation and GeoDetector analysis. To address the issue, follow-up studies should have access to higher resolution data wherever possible to improve the reliability of the analysis. (3) To construct the ecological resistance surfaces, elevation, slope, distance from water, MSPA landscape type, and land use type were selected as individual resistance factors, based on previous studies and data availability. However, we did not fully account for factors such as transportation networks, which may lead to discrepancies between the comprehensive resistance surfaces and real conditions. In future studies, an ecological resistance surface should be constructed scientifically by incorporating more reliable historical and future data, including historical traffic networks and traffic planning [65].

6. Conclusions

Given the effects of coupled climate change and land use change on regional ecosystems, it is increasingly crucial to investigate the spatiotemporal dynamics of ecological networks and their drivers from a “historical–present–future” perspective. The results showed the following: (1) From 2000 to 2020, the ecological sources in Shenmu City shrunk by 613.82 km2. The ecological corridors initially increased before declining, whereas the structure of the ecological networks improved and then degraded. The predictions indicate that by 2035, ecological sources under both SSP119 and SSP245 scenarios will expand, with the ecological network structure under SSP119 and SSP585 becoming more stable. (2) Between 2000 and 2020, the number of ecological pinch points and ecological barrier points in Shenmu City initially rose and subsequently declined, whereas the area of ecological barrier points decreased consistently. In 2035, the number of ecological pinch points is projected to increase under all three climate change scenarios, while the number and area of ecological barrier points increase under the SSP245 and SSP585 scenarios and decrease under the SSP119 scenario. Under the optimal SSP119 scenario, 27 ecological pinch points and 40 ecological barrier points were identified as priority areas for future ecological protection and restoration projects in Shenmu City. (3) According to the results driving factor analysis by GeoDetector, precipitation exhibits the strongest explanatory power regarding the ecological source distribution. The interaction between precipitation and other factors is the most prominent, and the interaction with GDP is the strongest. (4) The SSP119 scenario indicates that restricting land conversion, establishing ecological buffer zones, and implementing active ecological restoration strategies and projects could facilitate protection and improvement of ecological network conditions.
The present study establishes an integrated assessment framework for analyzing spatiotemporal evolution and drivers of ecological networks across historical, contemporary, and future multi-climate scenarios. It provides valuable scientific guidance for sustainable ecological networks in Shenmu City and serves as a reference for similar cities to address future ecological restoration, conservation, and sustainability in the context of climate change.

Author Contributions

H.B.: conceptualization, data curation, formal analysis investigation, writing—original draft, writing—review and editing. Y.Z.: data curation, formal analysis, writing—original draft, writing—review and editing. J.H.: resources, visualization, writing—original draft, writing—review and editing; H.C.: conceptualization, data curation, formal analysis investigation, methodology, writing—original draft, writing—review and editing. All authors have read and agreed to the published version of the manuscript.

Funding

This study was funded by the National Natural Science Foundation of China (Grant No. 72541007).

Data Availability Statement

The original contributions presented in this study are included in the article. Further inquiries can be directed to the corresponding author.

Conflicts of Interest

Author Haopeng Chen was employed by the company Yellow River Engn Consulting Co., Ltd. The remaining authors declare that the research was conducted in the absence of any commercial or financial relationships that could be construed as a potential conflict of interest.

Abbreviations

The following abbreviations are used in this manuscript:
MSPAMorphological spatial pattern analysis
SSPsShared Socioeconomic Pathways
RCPsRepresentative Concentration Pathways
SDSystem dynamics
DEMDigital Elevation Model
PLUSPatch-generating Land Use Simulation

References

  1. Pörtner, H.-O.; Scholes, R.; Arneth, A.; Barnes, D.; Burrows, M.T.; Diamond, S.; Duarte, C.M.; Kiessling, W.; Leadley, P.; Managi, S. Overcoming the coupled climate and biodiversity crises and their societal impacts. Science 2023, 380, eabl4881. [Google Scholar] [CrossRef] [PubMed]
  2. Ren, Y.; Zhang, B.; Chen, X.; Liu, X. Analysis of spatial-temporal patterns and driving mechanisms of land desertification in China. Sci. Total Environ. 2024, 909, 168429. [Google Scholar] [CrossRef] [PubMed]
  3. Su, Y.; Ma, X.; Feng, Q.; Liu, W.; Zhu, M.; Niu, J.; Liu, G.; Shi, L. Patterns and controls of ecosystem service values under different land-use change scenarios in a mining-dominated basin of northern China. Ecol. Indic. 2023, 151, 110321. [Google Scholar] [CrossRef]
  4. Peters, M.K.; Hemp, A.; Appelhans, T.; Becker, J.N.; Behler, C.; Classen, A.; Detsch, F.; Ensslin, A.; Ferger, S.W.; Frederiksen, S.B. Climate–land-use interactions shape tropical mountain biodiversity and ecosystem functions. Nature 2019, 568, 88–92. [Google Scholar] [CrossRef]
  5. Wei, X.; Lin, L.; Feng, X.; Wang, X.; Kong, D.; Lin, K.; Yang, J. Construction of ecological security pattern and quantitative diagnosis of ecological problems in Shenmu City. Acta Ecol. Sin. 2023, 43, 82–94. [Google Scholar] [CrossRef]
  6. Kosma, M.; Laita, A.; Duflot, R. No net loss of connectivity: Conserving habitat networks in the context of urban expansion. Landsc. Urban Plan. 2023, 239, 104847. [Google Scholar] [CrossRef]
  7. Chen, H.; Yan, W.; Li, Z.; Wende, W.; Xiao, S. A framework for integrating ecosystem service provision and connectivity in ecological spatial networks: A case study of the Shanghai metropolitan area. Sustain. Cities Soc. 2024, 100, 105018. [Google Scholar] [CrossRef]
  8. Cai, G.; Xiong, J.; Wen, L.; Weng, A.; Lin, Y.; Li, B. Predicting the ecosystem service values and constructing ecological security patterns in future changing land use patterns. Ecol. Indic. 2023, 154, 110787. [Google Scholar] [CrossRef]
  9. Liu, S.; Xia, Y.; Ji, Y.; Lai, W.; Li, J.; Yin, Y.; Qi, J.; Chang, Y.; Sun, H. Balancing Urban Expansion and Ecological Connectivity through Ecological Network Optimization—A Case Study of ChangSha County. Land 2023, 12, 1379. [Google Scholar] [CrossRef]
  10. Huang, B.-X.; Chiou, S.-C.; Li, W.-Y. Landscape Pattern and Ecological Network Structure in Urban Green Space Planning: A Case Study of Fuzhou City. Land 2021, 10, 769. [Google Scholar] [CrossRef]
  11. Bai, H.; Li, Z.; Guo, H.; Chen, H.; Luo, P. Urban green space planning based on remote sensing and geographic information systems. Remote Sens. 2022, 14, 4213. [Google Scholar] [CrossRef]
  12. McRae, B.H.; Dickson, B.G.; Keitt, T.H.; Shah, V.B. Using circuit theory to model connectivity in ecology, evolution, and conservation. Ecology 2008, 89, 2712–2724. [Google Scholar] [CrossRef] [PubMed]
  13. Chen, X.; Kang, B.; Li, M.; Du, Z.; Zhang, L.; Li, H. Identification of priority areas for territorial ecological conservation and restoration based on ecological networks: A case study of Tianjin City, China. Ecol. Indic. 2023, 146, 109809. [Google Scholar] [CrossRef]
  14. Mu, H.; Li, X.; Ma, H.; Du, X.; Huang, J.; Su, W.; Yu, Z.; Xu, C.; Liu, H.; Yin, D. Evaluation of the policy-driven ecological network in the Three-North Shelterbelt region of China. Landsc. Urban Plan. 2022, 218, 104305. [Google Scholar] [CrossRef]
  15. Li, M.; Liu, S.; Wang, F.; Liu, H.; Liu, Y.; Wang, Q. Cost-benefit analysis of ecological restoration based on land use scenario simulation and ecosystem service on the Qinghai-Tibet Plateau. Glob. Ecol. Conserv. 2022, 34, e02006. [Google Scholar] [CrossRef]
  16. Arnell, N.W.; Lowe, J.A.; Bernie, D.; Nicholls, R.J.; Brown, S.; Challinor, A.J.; Osborn, T.J. The global and regional impacts of climate change under representative concentration pathway forcings and shared socioeconomic pathway socioeconomic scenarios. Environ. Res. Lett. 2019, 14, 084046. [Google Scholar] [CrossRef]
  17. Eyring, V.; Bony, S.; Meehl, G.A.; Senior, C.A.; Stevens, B.; Stouffer, R.J.; Taylor, K.E. Overview of the Coupled Model Intercomparison Project Phase 6 (CMIP6) experimental design and organization. Geosci. Model Dev. 2016, 9, 1937–1958. [Google Scholar] [CrossRef]
  18. Chen, J.; Dong, Z.; Shi, R.; Sun, G.; Guo, Y.; Peng, Z.; Deng, M.; Chen, K. Urban Multi-Scenario Land Use Optimization Simulation Considering Local Climate Zones. Remote Sens. 2024, 16, 4342. [Google Scholar] [CrossRef]
  19. Shen, Q.; Chen, Q.; Tang, B.-s.; Yeung, S.; Hu, Y.; Cheung, G. A system dynamics model for the sustainable land use planning and development. Habitat Int. 2009, 33, 15–25. [Google Scholar] [CrossRef]
  20. Ji, X.; Sun, Y.; Guo, W.; Zhao, C.; Li, K. Land use and habitat quality change in the Yellow River Basin: A perspective with different CMIP6-based scenarios and multiple scales. J. Environ. Manag. 2023, 345, 118729. [Google Scholar] [CrossRef]
  21. Liang, X.; Guan, Q.; Clarke, K.C.; Liu, S.; Wang, B.; Yao, Y. Understanding the drivers of sustainable land expansion using a patch-generating land use simulation (PLUS) model: A case study in Wuhan, China. Comput. Environ. Urban Syst. 2021, 85, 101569. [Google Scholar] [CrossRef]
  22. Liu, X.; Liang, X.; Li, X.; Xu, X.; Ou, J.; Chen, Y.; Li, S.; Wang, S.; Pei, F. A future land use simulation model (FLUS) for simulating multiple land use scenarios by coupling human and natural effects. Landsc. Urban Plan. 2017, 168, 94–116. [Google Scholar] [CrossRef]
  23. Gao, J.; Gong, J.; Li, Y.; Yang, J.; Liang, X. Ecological network assessment in dynamic landscapes: Multi-scenario simulation and conservation priority analysis. Land Use Policy 2024, 139, 107059. [Google Scholar] [CrossRef]
  24. Shen, Z.; Wu, W.; Tian, S.; Wang, J. A multi-scale analysis framework of different methods used in establishing ecological networks. Landsc. Urban Plan. 2022, 228, 104579. [Google Scholar] [CrossRef]
  25. Wang, J.; Xu, C.D. Geodetector: Principle and prospective. Acta Geogr. Sin. 2017, 72, 116–134. [Google Scholar] [CrossRef]
  26. Gan, L.; Halik, Ü.; Shi, L.; Welp, M. Ecological risk assessment and multi-scenario dynamic prediction of the arid oasis cities in northwest China from 1990 to 2030. Stoch. Environ. Res. Risk Assess. 2023, 37, 3099–3115. [Google Scholar] [CrossRef]
  27. Murakami, D.; Yoshida, T.; Yamagata, Y. Gridded GDP projections compatible with the five SSPs (shared socioeconomic pathways). Front. Built Environ. 2021, 7, 760306. [Google Scholar] [CrossRef]
  28. Wang, X.; Meng, X.; Long, Y. Projecting 1 km-grid population distributions from 2020 to 2100 globally under shared socioeconomic pathways. Sci. Data 2022, 9, 563. [Google Scholar] [CrossRef]
  29. Chen, Y.; Guo, F.; Wang, J.; Cai, W.; Wang, C.; Wang, K. Provincial and gridded population projection for China under shared socioeconomic pathways from 2010 to 2100. Sci. Data 2020, 7, 83. [Google Scholar] [CrossRef]
  30. Yun, X.; Tang, Q.; Li, J.; Lu, H.; Zhang, L.; Chen, D. Can reservoir regulation mitigate future climate change induced hydrological extremes in the Lancang-Mekong River Basin? Sci. Total Environ. 2021, 785, 147322. [Google Scholar] [CrossRef]
  31. Li, S.; Zhou, Y.; Yue, D.; Zhao, Y. Streamflow Variation under Climate Conditions Based on a Soil and Water Assessment Tool Model: A Case Study of the Bailong River Basin. Sustainability 2024, 16, 3901. [Google Scholar] [CrossRef]
  32. Hermanns, T.; Helming, K.; Schmidt, K.; König, H.J.; Faust, H. Stakeholder Strategies for Sustainability Impact Assessment of Land Use Scenarios: Analytical Framework and Identifying Land Use Claims. Land 2015, 4, 778–806. [Google Scholar] [CrossRef]
  33. Zhao, Y.; He, L.; Bai, W.; He, Z.; Luo, F.; Wang, Z. Prediction of ecological security patterns based on urban expansion: A case study of Chengdu. Ecol. Indic. 2024, 158, 111467. [Google Scholar] [CrossRef]
  34. Jia, T.; Peihao, S.; Xijun, H.; Cunyou, C.; Baojing, W.; Siwen, Z. Coupled effects of land use and climate change on water supply in SSP–RCP scenarios: A case study of the Ganjiang river Basin, China. Ecol. Indic. 2023, 154, 110745. [Google Scholar]
  35. Liu, Y.; Huang, X.; Li, J.; Wang, Z.; Xu, C.; Xu, Y. Ecological connectivity analysis of typical coastal areas in China: The case of Zhangzhou City, Fujian Province. Urban Clim. 2024, 53, 101826. [Google Scholar] [CrossRef]
  36. Gao, J.; Du, F.; Zuo, L.; Jiang, Y. Integrating ecosystem services and rocky desertification into identification of karst ecological security pattern. Landsc. Ecol. 2020, 36, 2113–2133. [Google Scholar] [CrossRef]
  37. Sharp, R.; Chaplin-Kramer, R.; Wood, S.; Guerry, A.; Tallis, H.; Ricketts, T.; Nelson, E.; Ennaanay, D.; Wolny, S.; Olwero, N.; et al. InVEST User’s Guide; The Natural Capital Project, Stanford University: Stanford, CA, USA, 2018. [Google Scholar]
  38. Ji, Y.; Jia, L.; YANG, L.A.; Li, Y.; Dong, Q. Spatio-temporal Evolution and Prediction Analysis of Habitat Quality in Yulin City Coupled with InVEST-PLUS Model. J. Soil Water Conserv. 2023, 37, 123–132. [Google Scholar] [CrossRef]
  39. McRae, B.H.; Hall, S.A.; Beier, P.; Theobald, D.M. Where to restore ecological connectivity? Detecting barriers and quantifying restoration benefits. PLoS ONE 2012, 7, e52604. [Google Scholar] [CrossRef]
  40. Saura, S.; Torné, J. Conefor Sensinode 2.2: A software package for quantifying the importance of habitat patches for landscape connectivity. Environ. Model. Softw. 2009, 24, 135–139. [Google Scholar] [CrossRef]
  41. Taylor, P.D.; Fahrig, L.; Henein, K.; Merriam, G. Connectivity is a vital element of landscape structure. Oikos 1993, 68, 571–573. [Google Scholar] [CrossRef]
  42. Xu, X.; Wang, S.; Rong, W. Construction of ecological network in Suzhou based on the PLUS and MSPA models. Ecol. Indic. 2023, 154, 110740. [Google Scholar] [CrossRef]
  43. Ye, Y.; Su, Y.; Zhang, H.-O.; Liu, K.; Wu, Q. Construction of an ecological resistance surface model and its application in urban expansion simulations. J. Geogr. Sci. 2015, 25, 211–224. [Google Scholar] [CrossRef]
  44. McRae, B.H.; Shah, V.; Edelman, A. Circuitscape: Modeling landscape connectivity to promote conservation and human health. Nat. Conserv. 2016, 14, 1–14. [Google Scholar]
  45. Cook, E.A. Landscape structure indices for assessing urban ecological networks. Landsc. Urban Plan. 2002, 58, 269–280. [Google Scholar] [CrossRef]
  46. Ohlmann, M.; Miele, V.; Dray, S.; Chalmandrier, L.; O’connor, L.; Thuiller, W. Diversity indices for ecological networks: A unifying framework using Hill numbers. Ecol. Lett. 2019, 22, 737–747. [Google Scholar] [CrossRef]
  47. Li, Q.; Zhou, Y.; Yi, S. An integrated approach to constructing ecological security patterns and identifying ecological restoration and protection areas: A case study of Jingmen, China. Ecol. Indic. 2022, 137, 108723. [Google Scholar] [CrossRef]
  48. Dickson, B.G.; Albano, C.M.; Gray, M.E.; Mcclure, M.L.; Schumaker, N.H. Circuit-theory applications to connectivity science and conservation. Conserv. Biol. 2018, 33, 239–249. [Google Scholar] [CrossRef]
  49. Liu, H.; Zhang, G.; Li, T.; Ren, S.; Chen, B.; Feng, K.; Li, W.; Zhao, X.; Qin, P.; Zhao, J. Importance of ecosystem services and ecological security patterns on Hainan Island, China. Front. Environ. Sci. 2024, 12, 1323673. [Google Scholar] [CrossRef]
  50. An, Y.; Liu, S.; Sun, Y.; Shi, F.; Beazley, R. Construction and optimization of an ecological network based on morphological spatial pattern analysis and circuit theory. Landsc. Ecol. 2021, 36, 2059–2076. [Google Scholar] [CrossRef]
  51. Chen, M.; Bai, Z.; Wang, Q.; Shi, Z. Habitat Quality Effect and Driving Mechanism of Land Use Transitions: A Case Study of Henan Water Source Area of the Middle Route of the South-to-North Water Transfer Project. Land 2021, 10, 796. [Google Scholar] [CrossRef]
  52. Li, X.; Li, S.; Zhang, Y.; O’Connor, P.J.; Zhang, L.; Yan, J. Landscape Ecological Risk Assessment under Multiple Indicators. Land 2021, 10, 739. [Google Scholar] [CrossRef]
  53. Chen, T.; Feng, Z.; Zhao, H.; Wu, K. Identification of ecosystem service bundles and driving factors in Beijing and its surrounding areas. Sci. Total Environ. 2020, 711, 134687. [Google Scholar] [CrossRef] [PubMed]
  54. Yi, S.; Zhou, Y.; Zhang, J.; Li, Q.; Liu, Y.; Guo, Y.; Chen, Y. Spatial-temporal evolution and motivation of ecological vulnerability based on RSEI and GEE in the Jianghan Plain from 2000 to 2020. Front. Environ. Sci. 2023, 11, 1191532. [Google Scholar] [CrossRef]
  55. Li, T.; Jia, B.; Liu, W.; Zhang, Q.; Jiang, S. Spatio-temporal dynamics and influencing factors of ecological security network elements in Yichang, Hubei Province. Acta Ecol. Sin. 2023, 43, 6154–6169. [Google Scholar]
  56. Wu, J.; Siyu, L.; Shuai, B. Identification and optimization of ecological corridors in Shenmu City based on landscape ecological security. Arid Zone Res. 2021, 38, 1120–1127. [Google Scholar] [CrossRef]
  57. Li, Q.; Jing, X.B.; Zhang, X.L.; Han, B.; Li, H.B.; Zhou, Y.K. Comparison and Evaluation of the Ecological Network Construction Method Based on Principles of Landscape Ecology. Acta Ecol. Sin. 2023, 43, 1461–1473. [Google Scholar] [CrossRef]
  58. Chen, Z.; Liu, Z.; Zhang, L.; Wei, X.; Hong, Z. Multi-scenario Simulation of LUCC and Spatio-temporal Evolution and Prediction of Habitat Quality in Nanchang City. Trans. Chin. Soc. Agric. Mach. 2023, 54, 170–180. [Google Scholar]
  59. Nunez, S.; Alkemade, R.; Kok, K.; Leemans, R. Potential biodiversity change in Central Asian grasslands: Scenarios for the impact of climate and land-use change. Nat. Rev. Cancer 2020, 20, 39. [Google Scholar] [CrossRef]
  60. Men, D.; Pan, J. Ecological network identification and connectivity robustness evaluation in the Yellow River Basin under a multi-scenario simulation. Ecol. Model. 2023, 482, 110384. [Google Scholar] [CrossRef]
  61. Chen, Y.; Zhu, M.; Lu, J.; Zhou, Q.; Ma, W. Evaluation of ecological city and analysis of obstacle factors under the background of high-quality development: Taking cities in the Yellow River Basin as examples. Ecol. Indic. 2020, 118, 106771. [Google Scholar] [CrossRef]
  62. Das, M.; Das, A.; Pereira, P. Impact of urbanization induced land use and land cover change on ecological space quality-mapping and assessment in Delhi (India). Urban Clim. 2024, 53, 101818. [Google Scholar] [CrossRef]
  63. Tong, Z.; Zhang, Z.; Lu, Y.; Liu, Y.; An, R.; Luo, X.; Liu, S.; Zhang, B. Optimization of ecological network function and structure by coupling spatial operators and biomimetic intelligent algorithm. J. Clean. Prod. 2024, 142794. [Google Scholar] [CrossRef]
  64. Li, G.; Fang, C.; Li, Y.; Wang, Z.; Sun, S.; He, S.; Qi, W.; Bao, C.; Ma, H.; Fan, Y. Global impacts of future urban expansion on terrestrial vertebrate diversity. Nat. Commun. 2022, 13, 1628. [Google Scholar] [CrossRef]
  65. Wei, J.; Zhang, Y.; Liu, Y.; Li, C.; Tian, Y.; Qian, J.; Gao, Y.; Hong, Y.; Liu, Y. The impact of different road grades on ecological networks in a mega-city Wuhan City, China. Ecol. Indic. 2022, 137, 108784. [Google Scholar] [CrossRef]
Figure 1. Geographical location.
Land 14 01120 g001
Figure 2. Framework for constructing and assessing ecological networks: (a) simulation of land use distribution in 2035 under different scenarios; (b) construction of ecological networks for different periods and scenarios.
Land 14 01120 g002
Figure 3. Land use SD stock flow map in Shenmu City.
Land 14 01120 g003
Figure 4. Land use distribution in 2000 (a), 2010 (b), 2020 (c), and 2035 (d) for SSP119 scenario, (e) for SSP245 scenario, and (f) for SSP585 scenario.
Land 14 01120 g004
Figure 5. Ecological source distribution for 2000 (a), 2010 (b), 2020 (c), and 2035 (d) for SSP119 scenario, (e) for SSP245 scenario, and (f) for SSP585 scenario.
Land 14 01120 g005
Figure 6. Ecological corridor distribution for 2000 (a), 2010 (b), 2020 (c), and 2035 (d) for SSP119 scenario, (e) for SSP245 scenario, and (f) for SSP585 scenario.
Land 14 01120 g006
Figure 7. Ecological node distribution for 2000 (a), 2010 (b), 2020 (c), and 2035 (d) for SSP119 scenario, (e) for SSP245 scenario, and (f) for SSP585 scenario.
Land 14 01120 g007
Figure 8. Factor detector results for 2000, 2010, 2020, and 2035 (SSP119 scenario, SSP245 scenario, and SSP585 scenario). (X1–X6: DEM, slope, population, GDP, precipitation, temperature).
Land 14 01120 g008
Figure 9. Interaction detector results for 2000 (a), 2010 (b), 2020 (c), and 2035 (d) for SSP119 scenario, (e) for SSP245 scenario, and (f) for SSP585 scenario. (X1–X6: DEM, slope, population, GDP, precipitation, temperature).
Land 14 01120 g009aLand 14 01120 g009b
Table 1. Data types and sources.
Data TypeDateYearData Source
Land useLand use data2000–2020http://www.resdc.cn
Natural factorsDEM2020http://www.gscloud.cn
Slope2020Extracted from DEM
NDVI2020https://doi.org/10.12199/nesdc.ecodb.rs.2021.012
Soil type2020https://www.resdc.cn
Precipitation2000–2020http://www.geodata.cn/
https://doi.org/10.5194/essd-11-1931-2019
Temperature2000–2020
Socioeconomic factorsNighttime light data2020http://nnu.geodata.cn/
GDP2000–2020http://www.resdc.cn
Population2000–2020https://www.worldpop.org/
POI2020https://www.openhistoricalmap.org
Roads2020https://www.openhistoricalmap.org
Nature reserve vector data Shenmu City Natural Resources Bureau
Statistical Yearbooks of Yulin City2010–2020Yulin City Statistics Bureau
Statistical Yearbooks of Shenmu City2010–2020Shenmu City Statistics Bureau
Overall planning ofLandspace in shenmu City (2021–2035 year) Government disclosure
Table 2. SSP-RCP scenarios parameter settings.
SSPs-RCPs Scenarios2020–20302030–2035
SSP119SSP245SSP585SSP119SSP245SSP585
Rate of GDP change (%)8.626.4610.604.622.495.86
Rate of population change (%)−0.28−0.16−0.23−0.50−0.35−0.45
Rate of change in urbanization rate (%)0.760.690.760.540.460.54
Table 3. Influence distance and weight of threat factors.
Stress FactorMaximum Impact DistanceWeightDecay Type
Cultivated land40.6Linear
Construction land81Exponential
Unused land30.3Linear
Table 4. Habitat suitability of each species and sensitivity to different threat factors.
Land Use TypeHabitat SuitabilitySensitivity
Cultivated LandConstruction LandUnused Land
Cultivated land0.450.30.40.35
Woodland10.650.70.5
Grassland0.80.550.650.6
Water0.850.70.70.5
Construction land0000
Unused land0.150.10.150.1
Table 5. Assignment of ecological resistance factors and resistance value.
CategoryMSPA Landscape TypeLand Use TypeDEM (m)Slope (°)Distance from
Water (m)
GradeValueGradeValueGradeValueGradeValueGradeValue
SubclassCore1Woodland1<7501<51<5001
Bridge10Water10750–950305~1530500–100030
Loop, Branch30Grassland20950–11505015~20501000–150050
Islet, Edge50Cultivated land501150–13507020~30701500–200070
Perforation70Unused land70>135090>3090>200090
Background90Construction land100
Weights0.350.280.160.130.08
Table 6. Ecological network elements and assessment.
Years/
Scenarios
Ecological
Source
Source Area (km2)Ecological CorridorCorridor Length (km)α Indexβ Indexγ Index
2000291523.9363568.820.662.170.78
2010301403.9271616.470.762.370.85
202025910.1156609.440.712.240.81
SSP119261005.1159584.920.722.270.82
SSP24527927.8860671.860.692.220.80
SSP58527878.2562705.390.732.300.83
Disclaimer/Publisher’s Note: The statements, opinions and data contained in all publications are solely those of the individual author(s) and contributor(s) and not of MDPI and/or the editor(s). MDPI and/or the editor(s) disclaim responsibility for any injury to people or property resulting from any ideas, methods, instructions or products referred to in the content.

