Article

Coupling Relationship Between City Development and Ecosystem Service in the Shandong Peninsula Urban Agglomeration

1
School of Land Science and Technology, China University of Geosciences (Beijing), Beijing 100089, China
2
Research Center of Territorial & Spatial Planning, Ministry of Natural Resources, Beijing 100034, China
3
Shandong Territorial and Spatial Planning Institute, Jinan 250014, China
4
China Land Surveying and Planning Institute, Beijing 100035, China
*
Authors to whom correspondence should be addressed.
Land 2025, 14(5), 1119; https://doi.org/10.3390/land14051119
Submission received: 21 March 2025 / Revised: 14 May 2025 / Accepted: 14 May 2025 / Published: 21 May 2025

Abstract

:
Reconstructing relationships between urban agglomeration and relevant ecosystems from an ecosystem services perspective and quantitatively assessing their interactive status holds significant implications for achieving coordinated development. Taking Shandong Peninsula Urban Agglomeration (SPUA) as our study area, we developed a Cities-ESV Coupling Index (I) serving as a composite metric for assessing city–ecosystem coupling dynamics through a multidimensional framework encompassing the following: (1) urban development level, (2) ecosystem service value (ESV), (3) ecosystem service physical quantity, and (4) spatial balance degree of ecosystem service, operationalized through 10 selected indicators. Our methodology integrates ESV quantification, biophysical assessment, correlation analysis modeling, and spatial autocorrelation modeling to comprehensively evaluate coupling relationships between cities and ecosystems across 16 cities and 78 counties. This study innovatively integrates ESV quantification with biophysical assessment methodologies in indicator selection, while strategically incorporating spatial agglomeration metrics. The multidimensional framework effectively addresses the prevalent oversimplification in existing ecosystem service measurement paradigms. The findings are as follows: the total ESV is 13,977.87 × 108 CNY/a, which accounts for about 20% of the total GDP of SPUA. The Cities-ESV coupling index (I) of four cities, including Dongying, Linyi, Yantai, and Weifang, ranks among the top in SPUA, while that of seven counties, namely Weshan, Qixia, Yiyuan, Yishui, Mengyin, and Linqu, is at a relatively high-level. The conclusion is as follows: the total ESV in SPUA had been continuously decreasing. The coupling relationship between cities and ecosystems are significantly negatively correlated, and the Cities-ESV coupling index (I) of SPUA has obvious regional differentiation characteristics. Therefore, differentiated ecological land protection policies should be formulated to curb the trend of continuous decline in ESV.

1. Introduction

Ecosystem services (ESs), the foundational natural environmental conditions upon which human survival depends [1], have rapidly emerged as a prominent scientific focus since their conceptualization in the previous century. The assessment of ecosystem services has been extensively applied to investigate human–environment interactions across various geographical contexts [2,3]. Human society is the object that the ecosystem serves, and the place where human activities are most concentrated is the city, so the competitive and even contradictory relationship between human beings and ecosystems is embodied in the relationship between cities and ecosystems. As the urbanization process continues, the scale, population, economic development, and land-use structure of cities are deeply influenced by the capacity of ecosystem service in the region, and at the same time, urban development is constantly changing the ecosystem of the region and its ability to provide well-being for human beings. Urban agglomerations, as a domain spatial carrier of productivity distribution and the main form of urbanization development [4], will have a greater impact on the structure, function, and layout of regional ecosystem services in a wider range and a more profound way. The 20th National Congress of Communist Party of China further emphasized that nature is the basic condition for human survival and development while implementing the new urbanization strategy, and the concept of “green mountains and clear waters are invaluable assets” must be firmly established and practiced. The nation should promote urban development from the standpoint of harmonious coexistence between man and nature [5]. The Shandong Peninsula Urban Agglomeration (Short for “SPUA”) is a city cluster in eastern China where the population is large and the land is scarce, and resource constraints are becoming increasingly pressing. In recent years, it has received great attention from the State Council, and has shown strong development momentum, becoming the leading city cluster for the national strategy of ecological protection and high-quality development of the Yellow River and having a very strong driving effect on the Yellow River Basin. Strengthening research on the relationship between cities and ecosystems in the SPUA area and exploring the institutional system and path model for the coordinated development of the human–land relations in this area can enrich the connotation of urbanization development, promote the high-quality transformation and coordinated development of the SPUA, and provide a demonstration for the coordinated development of human–land relations in city clusters across the country.
In terms of the relationship between cities and ecosystems, many domestic scholars have conducted extensive empirical studies from various dimensions such as demography [6], industry, environment [7], and land-use change [8]. Some scholars studied the relationship between the population urbanization and land urbanization, drawing conclusions that population agglomeration has led to continuously increasing pressure on resources and the environment [9]. China’s urbanization reveals critical human–land tensions through inefficient land utilization [10], cultivated land loss [11], and ecological degradation [12]. Researchers of sustainable urbanization have proposed solutions that emphasize the coordinated balance of economic development, population growth, and land expansion [13]. However, most studies predominantly employ land-use area changes as the primary metric, offering limited capacity to characterize the relationship between urban systems and ecosystem dynamics. Some scholars have further investigated the relationship between urban development and ecosystem services, yielding reference-worthy research outcomes on spatial interaction characteristics and agglomeration patterns [14], coupling mechanisms with interactive stress effects [15], contextual element characteristics [16], and coupling coordination relationships [17] by employing methodologies such as spatial correlation analysis [14], gravity models [16], and coupling coordination models [17]. Scholars have also assessed urban-development coupling relationships with ecosystems across industrial, transportation, spatial, and social dimensions [15,17,18,19,20]. Furthermore, this process is widely recognized as fundamental to coupled urban–ecological system development [21,22]. For instance, Huang Xin et al. [23] studied the theoretical basis and analytical framework of urban social–ecological systems research, believing that the relationship between cities and ecosystems has the characteristics of fragility, resilience, and adaptability. Li Huyue et al. [24] assessed and predicted the ecosystem service value of the Qianzhong urban agglomeration, reporting that in ecological protection scenarios effective solutions can be found to resolve the ecological environmental problems caused by urbanization. In the study on the spatial and temporal characteristics of ecosystem services and ecological functions zoning in the Guanzhong Plain urban agglomeration, Zhang Xin et al. [25] believe that the results of ecosystem services assessment accurately reflect the level and changes in the ecosystem’s contribution to human society development within the urban agglomeration. Zhong Jingqiu et al. [26] tried to provide a multidisciplinary perspective for the spatial reconstruction of the human–land relationship and sustainable development through cultural services of ecosystems, and they think that ecosystem services are the key factor in guiding the spatial reconstruction of the human–land relationship and also the belt between urban development and ecosystem services in the study on the human–land relationship. This demonstrates that urban–ecological coupling relationships exhibit universal prevalence, mutually causal dynamics, and regionally distinct patterns. However, existing research has predominantly focused on single-dimensional approaches, emphasizing either the economic valuation of ecosystem services or physical quantity assessments of selected ecosystem functions. These limitations hinder comprehensive analysis of multidimensional relationships between urban development and ecosystem services [27], as an integrated indicator system for systematically measuring such coupling mechanisms has yet to be established. For instance, construction land expansion induces multidimensional degradation of ecosystem services [28], extending beyond mere reductions in their economic valuation. Furthermore, given the inherent uncertainties in ecosystem service value assessments, correlation analyses between urban development and service valuations prove insufficient for scientifically reconstructing urban–ecological coupling relationships. This necessitates rectification through multidimensional indicators encompassing physical quantity assessments, structural configurations of ecosystem services, and spatial distribution patterns [29].
This paper attempts to deeply study the specific relationship with features of obvious integrity and difference between the overall level of urban economy and society and the ecosystem services that these cities enjoy, while comprehensively considering relevant indicators such as urban population, economy, and land-use structure from the perspective of an ecosystem service assessment, so as to explore the internal relationship and basic law between cities and ecosystems, scientifically judge the relationship and state between city and ecosystem, and identify the existing problems in the human–land relationship. This paper is of great practical significance for the scientific formulation of territorial spatial planning, accurate determination of the scale, form, and development direction of cities, as well as the protection of regional ecosystems. This study advances three key contributions: (1) a dual assessment framework: simultaneously employing economic valuation and biophysical quantification to evaluate total ecosystem services across cities, mitigating valuation uncertainties through methodological triangulation; (2) spatial equilibrium analysis: applying equilibrium degree metrics to quantify spatial agglomeration patterns of ecosystem service typologies and cumulative service stocks, thereby embedding spatial explicitness into urban–ecological coupling relationships; (3) regional knowledge generation: focusing on Shandong Peninsula Urban Agglomeration as a critical test bed, this work addresses a critical research gap while providing theoretical foundations for coordinated development under the Yellow River Basin’s national strategy of ecological conservation and high-quality development.

2. The Study Area and Data Sources

2.1. Overview of the Study Area

SPUA is located in Shandong Province in the lower reaches of the Yellow River as shown in Figure 1, bordering the Beijing–Tianjin–Hebei city cluster to the north, the Yangtze River Delta city cluster to the south, the Central Plains Economic Zone to the west, the Bohai Sea and the Yellow Sea to the east, surrounding the Bohai Sea together with the Liaodong Peninsula, and facing the Korean Peninsula and the Japanese islands across the sea. The SPUA is an important hub of “One Belt and One Road” strategic convergence, an important part of the Bohai Sea Economic zone, and a mature city cluster in the spatial structure of “one axis, two regions and five levels” of the Yellow River Basin, with a total of 16 prefecture-level cities, 26 county-level cities, 52 counties, and 1072 towns, with a total land area of 158,000 km2, accounting for 1.64% of the country’s total area. By the end of 2022, the total population of SPUA was 101.63 million (101.65 million in 2020), accounting for 7.20% of the total population of China, and the regional GDP reached CNY 8.74 trillion (CNY 7.28 trillion in 2020), accounting for 7.30% of the total of the nation. The SPUA has an important position in the national territorial spatial planning, and the central government has repeatedly stressed that the SPUA should play a leading role to promote the high-quality development of central cities and city clusters along the Yellow River. However, compared with other urban agglomerations in China, the SPUA has such features as a long history of farming, a high intensity of land development and utilization, a shortage of water resources, and a relatively low proportion of ecological land such as arable land, forest, wetland, etc. [30]. In addition, in recent years, the rapid expansion of cities brought the continuous reduction in ecological land and the persistent degradation of ecosystem service functions. The traditional industry development of high energy consumption and high pollution such as from the petroleum, chemical, and steel industries have been putting great pressure on regional ecosystem services. The coordinated development of cities and ecosystems has become a key issue for the ecological protection and high-quality development of the Yellow River Basin.

2.2. Data Source and Processing

Functioning as a pivotal driver of global environmental change, land-use/cover change (LUCC) fundamentally restructures ecosystem configurations and functional processes, thereby critically determining the capacity of ecosystems to sustain service provisioning. In this paper, land-use survey data from 1996 to 2020 are used as the main data source for Ecosystem Services Value (ESV) assessment in the study on the spatio-temporal characteristics and basic rules of the coupling relationship between the SPUA and ecosystem services over the past 25 years. The data are from the Land Survey of Shandong Province. As a critical component of the terrestrial carbon cycle, net primary productivity (NPP) not only directly quantifies the productive capacity of vegetation communities but also serves as a biophysical indicator of the quality status of terrestrial ecosystems. Furthermore, it constitutes a pivotal determinant in characterizing carbon source/sink dynamics and modulating key ecological regulation processes [31]. The Normalized Difference Vegetation Index (NDVI) and MODIS13Q1 vegetation type map are used to calculate the net vegetation primary productivity. The data are from the NASA data platform (https://data.nasa.gov/dataset/, accessed on 1 March 2025). Habitat quality fundamentally underpins ecosystem service provisioning through biophysical mediation mechanisms, while the functional efficacy of ES conversely serves as a diagnostic indicator for evaluating habitat sustainability trajectories. Meteorological data such as precipitation, temperature, wind speed, relative humidity, sunshine duration, and snow depth are processed by an interpolation method to calculate the habitat quality index. These data are obtained from the national meteorological data network (http://data.cma.cn/, accessed on 1 March 2025). Functioning as a critical constituent of ecosystem regulating services, soil conservation capacity demonstrates intrinsic linkages with the integrated provisioning functionality of ecosystem services. The data of soil texture (coarse sand, silty sand, clay, and organic matter), soil depth, and CaCO3 from the Chinese Soil data set with a scale of 1:1,000,000 are used to calculate the total value of soil conservation services. The data are from Nanjing Institute of Soil Research, Chinese Academy of Sciences. Carbon stock, functioning as a fundamental metric for studying biosphere–atmosphere carbon exchange, requires precise quantification of ecosystem organic carbon pool magnitudes and elucidation of their spatio-temporal distribution patterns. This analytical framework is critical for evaluating the functional significance of diverse ecosystems within terrestrial carbon cycling frameworks, while simultaneously enhancing predictive capacity regarding ecosystem-specific responses and feedback mechanisms in climate change scenarios [32]. Land-use type data are used to calculate the carbon storage services of each city. The data are from the Land Survey of Shandong Province. Based on GIS processing, the 2000 national geodetic coordinate system (CGCS2000) is adopted, and the spatial resolution of the unified raster data is 250 m.
With the aid of the Geographic Information System (GIS), and referring to the research on ecosystem classification by scholars, the land-use types from 1996 to 2020 were screened. Land types with ecological service functions were selected, comparatively analyzed, and re-numbered to form a database of ecosystem changes. Data such as the yields of grains, fruits, and tea, as well as price indices in the SPUA, were obtained from materials like the Shandong Statistical Yearbook and the China Rural Statistical Yearbook from 1997 to 2021. These data were used to evaluate the economic value of the basic equivalent factors of ESV. Data on population, gross domestic product, etc., were sourced from the Shandong Statistical Yearbook. Data on the area of classified land use, the total area of each research unit, and the area of construction land were obtained from the data of land-use status surveys.

3. Research Methods

The framework of this paper is shown in Figure 2. To study the coupling relationship between city development and ecosystem service in the SPUA, this paper first constructed an indicator system including socioeconomic development dimension, total ecosystem services dimension, and spatial pattern dimension. Then, by ecosystem service value assessment methods, material quality assessment methods, and spatio-temporal analysis methods, the results of the evaluation analyses were draw. Finally, the evaluation conclusion summaries were established to measure the coupling relationship of each city in the SPUA.

3.1. Indicator Selection

The material quantity and value of ecosystem services as well as the equilibrium of ecosystem services were selected as ecosystem service indicators, and urban population size, economic scale, and urban construction land scale were selected as socioeconomic development indicators for the SPUA; then, an index system for the coupling relationship between urban development and ecosystem services was further developed (see Table 1). The Delphi method was utilized to determine the weights of each indicator, and then the coupling index (C) between urban development and ecosystem services was calculated. The value range of the coupling index is [0, 100]. A higher coupling index value indicates a better relationship between urban development and ecosystem services, namely a higher contribution rate of the ecosystem to urban development and less pressure exerted by urban development on the ecosystem. Conversely, a lower coupling index value suggests a worse relationship between urban development and ecosystem services, namely a lower contribution rate of the ecosystem to urban development and greater pressure exerted by urban development on the ecosystem [33,34].

3.2. Ecosystem Service Assessment Model

3.2.1. Ecosystem Service Value Assessment Model

Considering the natural conditions and socioeconomic realities of the SPUA, and based on high-precision national land survey data, the equivalent factor method was primarily employed. Combined with field investigation data, the market price method, contingent valuation method, shadow price method, and substitute project method were used to revise the equivalent factor table and unit equivalent economic value of Xie Gaodi et al. [45] The calculation formula is as follows:
V t = j = 1 m i = 1 n D s F i j A i i = 1 ,   2 ,   ,   n ;   j = 1 ,   2 ,   ,   m
In the equation, V t represents the total ESV of the city; Ds denotes the economic value per unit equivalent factor in Shandong Province; Fij corresponds to the equivalent factor of the j-th ecosystem service for the i-th ecosystem category within the city’s jurisdiction; and Ai indicates the spatial area of the i-th ecosystem category in the urban administrative region [46,47].

3.2.2. Material Quality Assessment Model for Ecosystem Services

(1) Net Vegetation Primary Productivity
Remote sensing imagery was utilized to extract NDVI data for estimating the inter-annual variations and seasonal dynamics of net primary productivity (NPP) in the SPUA [48]. The NPP values were calculated by using the Carnegie–Ames–Stanford Approach (CASA) model. The formula is expressed as follows:
N P P x , t = A P A R ( x , t ) × ε ( x , t )
where NPP represents the net primary productivity of vegetation (g/m2 measured as C); APAR denotes the absorbed photo-synthetically active radiation (MJ/m2); and ε refers to the actual light use efficiency (g/MJ, measured as C). Specific methodologies were referenced from studies by Zhang et al. [49] and Zhu et al. [50].
(2) Habitat Quality
Habitat quality is an important indicator reflecting biodiversity, which is widely used for the quantitative evaluation of the habitat conditions of animals and plants. It is applicable to large-scale areas or regions where it is difficult to collect field data. In this study, the habitat quality module in the InVEST model is adopted to quantitatively evaluate the habitat quality status within the SPUA. The specific calculation formula is as follows:
Q x j = H j ( 1 D x j z D x j z + k z )
In the formula, Q x j is the habitat quality of the x-th grid of the j-th land-use type, with a value range of [0, 1], and it is dimensionless. The larger the value, the higher the habitat quality and the better the biodiversity, and vice versa; H j represents the habitat suitability degree of the j-th land-use type. D x j represents the habitat degradation index, which is calculated by referring to the relevant literature; k is the half-saturation coefficient, taking half of the size scale value of the unit grid; Z represents the normalization constant, which is an inherent conversion coefficient of the module and takes a value of 2.5 [40].
(3) Soil Conservation Service
The Revised Universal Soil Loss Equation (RUSLE) is used to estimate the soil conservation amount of the ecosystem [43]. The formula is as follows:
S C = R × K × L × S × ( 1 C × P )
In the formula, S C represents the soil conservation amount (t/hm2/yr); R is the rainfall erosivity, with the unit of MJ·mm/(hm2·h·a) [44]; K is the soil erodibility, with the unit oft·hm2/(hm2·MJ·mm) [51]; L, S, C, and P, respectively, represent the slope length factor, slope gradient factor, vegetation coverage factor, and soil conservation measure factor, which are calculated by referring to the results of previous research [52,53,54,55].
(4) Carbon Storage
Referring to relevant research results [56,57,58,59,60], according to the land-use types and their corresponding carbon densities, the carbon sequestration service module of the InVEST model is adopted to evaluate the regional carbon storage and quantify the carbon storage in the study area. The calculation formula is as follows:
C i = i = 1 n ( C i a b o v e + C i b e l o w + C i i d e a d + C i s o i l )
In the formula, Ci is the total carbon density of land-use type i, with the unit of t/hm2; Ciabove, Cibelow, Cidead, and Cisoil are, respectively, the above-ground carbon density, below-ground carbon density, carbon density of dead organic matter, and soil organic matter carbon density of land-use type i. The carbon density parameters are obtained according to relevant research [61].

3.3. Analysis Model of the Relationship Between City and Ecosystem

(1) Temporal Synergy Model
The Pearson correlation coefficient (r) is used as the measurement index for the synergy relationship between the city and the ecosystem. The model is as follows:
r = i = 1 n V 1 i V ¯ 1 V 2 i V ¯ 2 i = 1 n V 1 i V ¯ 1 2 i = 1 n V 2 i V ¯ 2 2
In the formula, r is the Pearson correlation coefficient, representing the mutual relationship between the urban economic and social indicators and ESV. The value range of r is [−1, 1]. When r > 0, it indicates a positive correlation; when r < 0, it indicates a negative correlation. The larger the absolute value of r, the stronger the correlation between the two, and vice versa. V1 is the ESV, V2 represents the economic and social development indicators, including the total population, the total Gross Domestic Product (GDP), and the total amount of construction land. n represents the time interval of 25 years.
(2) Spatial Autocorrelation Model
The spatial autocorrelation model is used to analyze the spatial distribution of the coupling index of SPUA. Global Moran’s I is employed to measure the significance of the global spatial autocorrelation of the coupling index of the SPUA. The formula is as follows:
M o r a n s   I = n i = 1 n j = 1 n w i j ( x i x ¯ ) ( x j x ¯ ) ( i = 1 n j = 1 n w i j ) i = 1 n ( x i x ¯ ) 2
In the formula, M o r a n s I is the spatial autocorrelation index, with a value range of [−1, 1]. When M o r a n s I > 0, it indicates a positive correlation, that is, the phenomena of high–high aggregation or low–low aggregation are significant; when M o r a n s I < 0, it indicates a negative correlation, that is, the phenomena of high–low adjacency or low–high adjacency are obvious; when M o r a n s I = 0, it means that there is no spatial autocorrelation. n is the number of cities; xi and xj are the coupling indices of cities i and j, respectively; x ¯ is the average value; wij is the spatial weight matrix of the Queen algorithm, which represents the adjacency relationship between cities i and j. It takes a value of 1 when the cities are spatially adjacent and a value of 0 when they are not spatially adjacent.
(3) Cities-ESV coupling index (I)
To eliminate dimensional discrepancies in the raw data, normalization was performed using the following formula:
x i j = x i j x j m i n x j m a x x j m i n
In the formula, x i j   a n d   x i j denote the normalized and original values, respectively, of the jth indicator for the ith city, where x j m a x and x j m i n represent the maximum and minimum values of the jth indicator. The coupling index for each city was calculated using the linear weighting method as follows:
City ESV   coupling   index   I = j = 1 n w j × x i j
In the formula, Cities-ESV coupling index I represents the coupling index between urban development and ES, ranging from 0 to 1. A higher Cities-ESV coupling index I value indicates greater harmony between urban development levels and ecosystem services, while a lower Cities-ESV coupling index I value suggests poorer coordination between these two dimensions. The weight coefficients wi were obtained using the Delphi model [62], as detailed in Table 1.

4. Result Analysis

4.1. Analysis of the Results of the Coupling Relationship

The coupling relationship between urban development and ecosystems across the Peninsula Urban Agglomeration was quantified using the Cities-ESV coupling index (I) as shown in Formula (9). Among the prefecture-level cities in the SPUA (see Figure 1 and Table 2 for details), Dongying City has the highest coupling index, which is 0.688. Dongying City is located in the Yellow River Delta area, with a coastline of up to 412.67 km and a coastal tidal flat area of 122,500 hectares (12.25 × 10⁴ hm2). The high proportion of ESV of wetlands has greatly increased the city’s coupling index, but the structural equilibrium degree is relatively low. This is followed by Linyi City, Yantai City, and Weifang City, with coupling indices of 0.583, 0.535, and 0.513, respectively. These cities have a suitable climate and complex terrain, with extensive distribution of forest land and orchard land. The services of the ecosystem, such as the net primary productivity of vegetation, habitat quality index, soil conservation services, and carbon storage services, are relatively prominent.
The coupling indices of six cities, namely Jining City, Weihai City, Binzhou City, Tai’an City, Jinan City, and Rizhao City, are between 0.3 and 0.4. The main influencing factors of the coupling indices of these six cities are the large total population size, rapid economic development, and continuous expansion of the scale of construction land, which exerts great pressure on the ecosystem. Both the average level and the contribution rate of the ecosystem services in Jinan City are relatively low. In Jining City, due to the concentrated distribution of the wetlands in Nansi Lake, the equilibrium degree is relatively low.
The coupling indices of five cities, namely Qingdao City, Dezhou City, Heze City, Zibo City, and Liaocheng City, are between 0.2 and 0.3, accounting for 31.25% of the total number of units. Among them, Qingdao City and Zibo City have relatively rapid economic and social development, a large population, and a high proportion of construction land, which exerts great pressure on the slightly advantageous ecosystem. In Dezhou City, Heze City, and Liaocheng City, plains are widely distributed, and the cultivated land area accounts for an absolute proportion. The scarcity of ecological resources, coupled with the pressure of population and social and economic development, leads to their relatively low coupling indices. Zaozhuang City has a large population and scarce ecological resources, and the service index of its ecosystem is only 0.180.
Weishan County has the highest coupling index among county-level cities, which is 0.621. The area of the Nansi Lakes within Weishan County accounts for 72.88% of the total area. The excessively high proportion of the service value of the wetland ecosystem leads to a relatively low equilibrium degree.
There are five county-level cities, namely Qixia City, Yiyuan County, Yishui County, Mengyin County, and Linqu County, whose coupling indexes are between 0.4 and 0.5, ranking among the top in the province. These cities are characterized by widespread mountainous and hilly areas and numerous rivers within their territories. Their indicators such as net primary productivity of vegetation, habitat quality index, soil conservation service, and carbon storage service are relatively high. The pressures from population, economy, etc., are not significant, and the structural equilibrium degree is also relatively high.
There are 19 county-level cities with a coupling index between 0.3 and 0.4, which is at the provincial average level. There are 24 county-level cities with a coupling index between 0.2 and 0.4, accounting for 30.77% of the total number of county-level cities. These cities have relatively fewer ecological resources. The pressures on the ecosystem caused by population, economic development, and the expansion of construction land are relatively large, and they are mostly distributed in the transitional zones between plain areas and mountainous and hilly areas.
There are 30 county-level cities with a coupling index between 0.1 and 0.2, accounting for 38.46% of the total number of county-level cities. Most of these cities are distributed in plain areas, where human activities are frequent within their jurisdiction. The population, economic and social development, construction land, etc., have brought great pressure to the urban ecosystem. In addition, the land use in these cities is relatively simple, mainly consisting of cultivated land. The ecological resources are relatively scarce, and the species diversity is not high, resulting in a relatively low structural equilibrium degree of the ecosystem services. See Figure 3 for details.

4.2. Evolution Characteristics of the Coupling Relationship Between Socioeconomic Development and Ecosystem Services in SPUA

Studying the overall situation of the socioeconomic development and ecosystem services in the SPUA as well as their temporal evolution characteristics is a prerequisite for accurately grasping the human–land relationship between cities and the ecosystem. According to the availability of data, data such as the total economic volume, population, scale of construction land, and ESV of the SPUA since the detailed land survey in 1996 are selected as the measurement indicators for the temporal evolution of the coupling relationship between the socioeconomic development and ecosystem services in the SPUA. The evolutionary trends and coupling relationship between cities and the ecosystem in the Peninsula Urban Agglomeration over the past 25 years are studied.
The total land area of the SPUA is 158,000 km2 (15.8 × 10⁴ km2), accounting for approximately 1.64% of the total area of the country. The total area of ecological land is 12,333,700 hectares (1233.37 × 104 hm2), accounting for 78.01% of the total area of the SPUA and approximately 1.00% of the total area of ecological land in the country. The ESV is CNY 1,397,787 million (13,977.87 × 108 CNY), which is 19.20% of the gross production value. The per capita ESV is CNY 13,750.98 per person per year (13,750.98 CNY/P/a). The contribution rate of ESV to GDP is 0.191, and the contribution rate to construction land is CNY 441,800 per hectare per year (44.18 × 10⁴ CNY/hm2/a). The total amount of net primary productivity services of vegetation is 995 million tons (9.95 × 10⁸ tons), the total amount of soil conservation services is 19 million tons (0.19 × 10⁸ tons), the average value of the habitat quality service index is 0.378, and the total amount of carbon storage services is 1168 million tons (11.68 × 10⁸ tons).
From 1996 to 2020, the total economic volume of the SPUA kept increasing. The regional gross domestic product grew from CNY 588.38 billion to CNY 7279.817 billion, with an average inter-annual change rate of 11.17%. The total population witnessed a slow growth, rising from 87.38 million to 101.65 million, with an average inter-annual change rate of 0.63%. The total scale of construction land expanded rapidly, increasing from 1,949,000 hectares (194.90 × 10⁴ hectares) to 3,163,800 hectares (316.38 × 10⁴ hectares), with an average inter-annual change rate of 2.08%. The ESV showed a decreasing trend amidst fluctuations, dropping from CNY 1437.332 billion per year in 1996 to CNY 1397.787 billion per year in 2020, with an average inter-annual change rate of −0.44%. See Table 3 and Figure 3 for details.
The Person correlation coefficient (r) was used as the measurement index for the coupling relationship between urban economic and social development and ESV. The results showed that over the past 25 years, the Person correlation coefficient r between the total population and the total ESV of the Peninsula Urban Agglomeration was −0.7215, the Person correlation coefficient r between the regional gross domestic product and the total ESV was −0.7715, and the Person correlation coefficient r between the total scale of construction land and the total ESV was −0.7199. It can be seen that over the past 25 years, there has been a significant negative coupling relationship among the economy, population, construction land, and ESV in the Peninsula Urban Agglomeration.

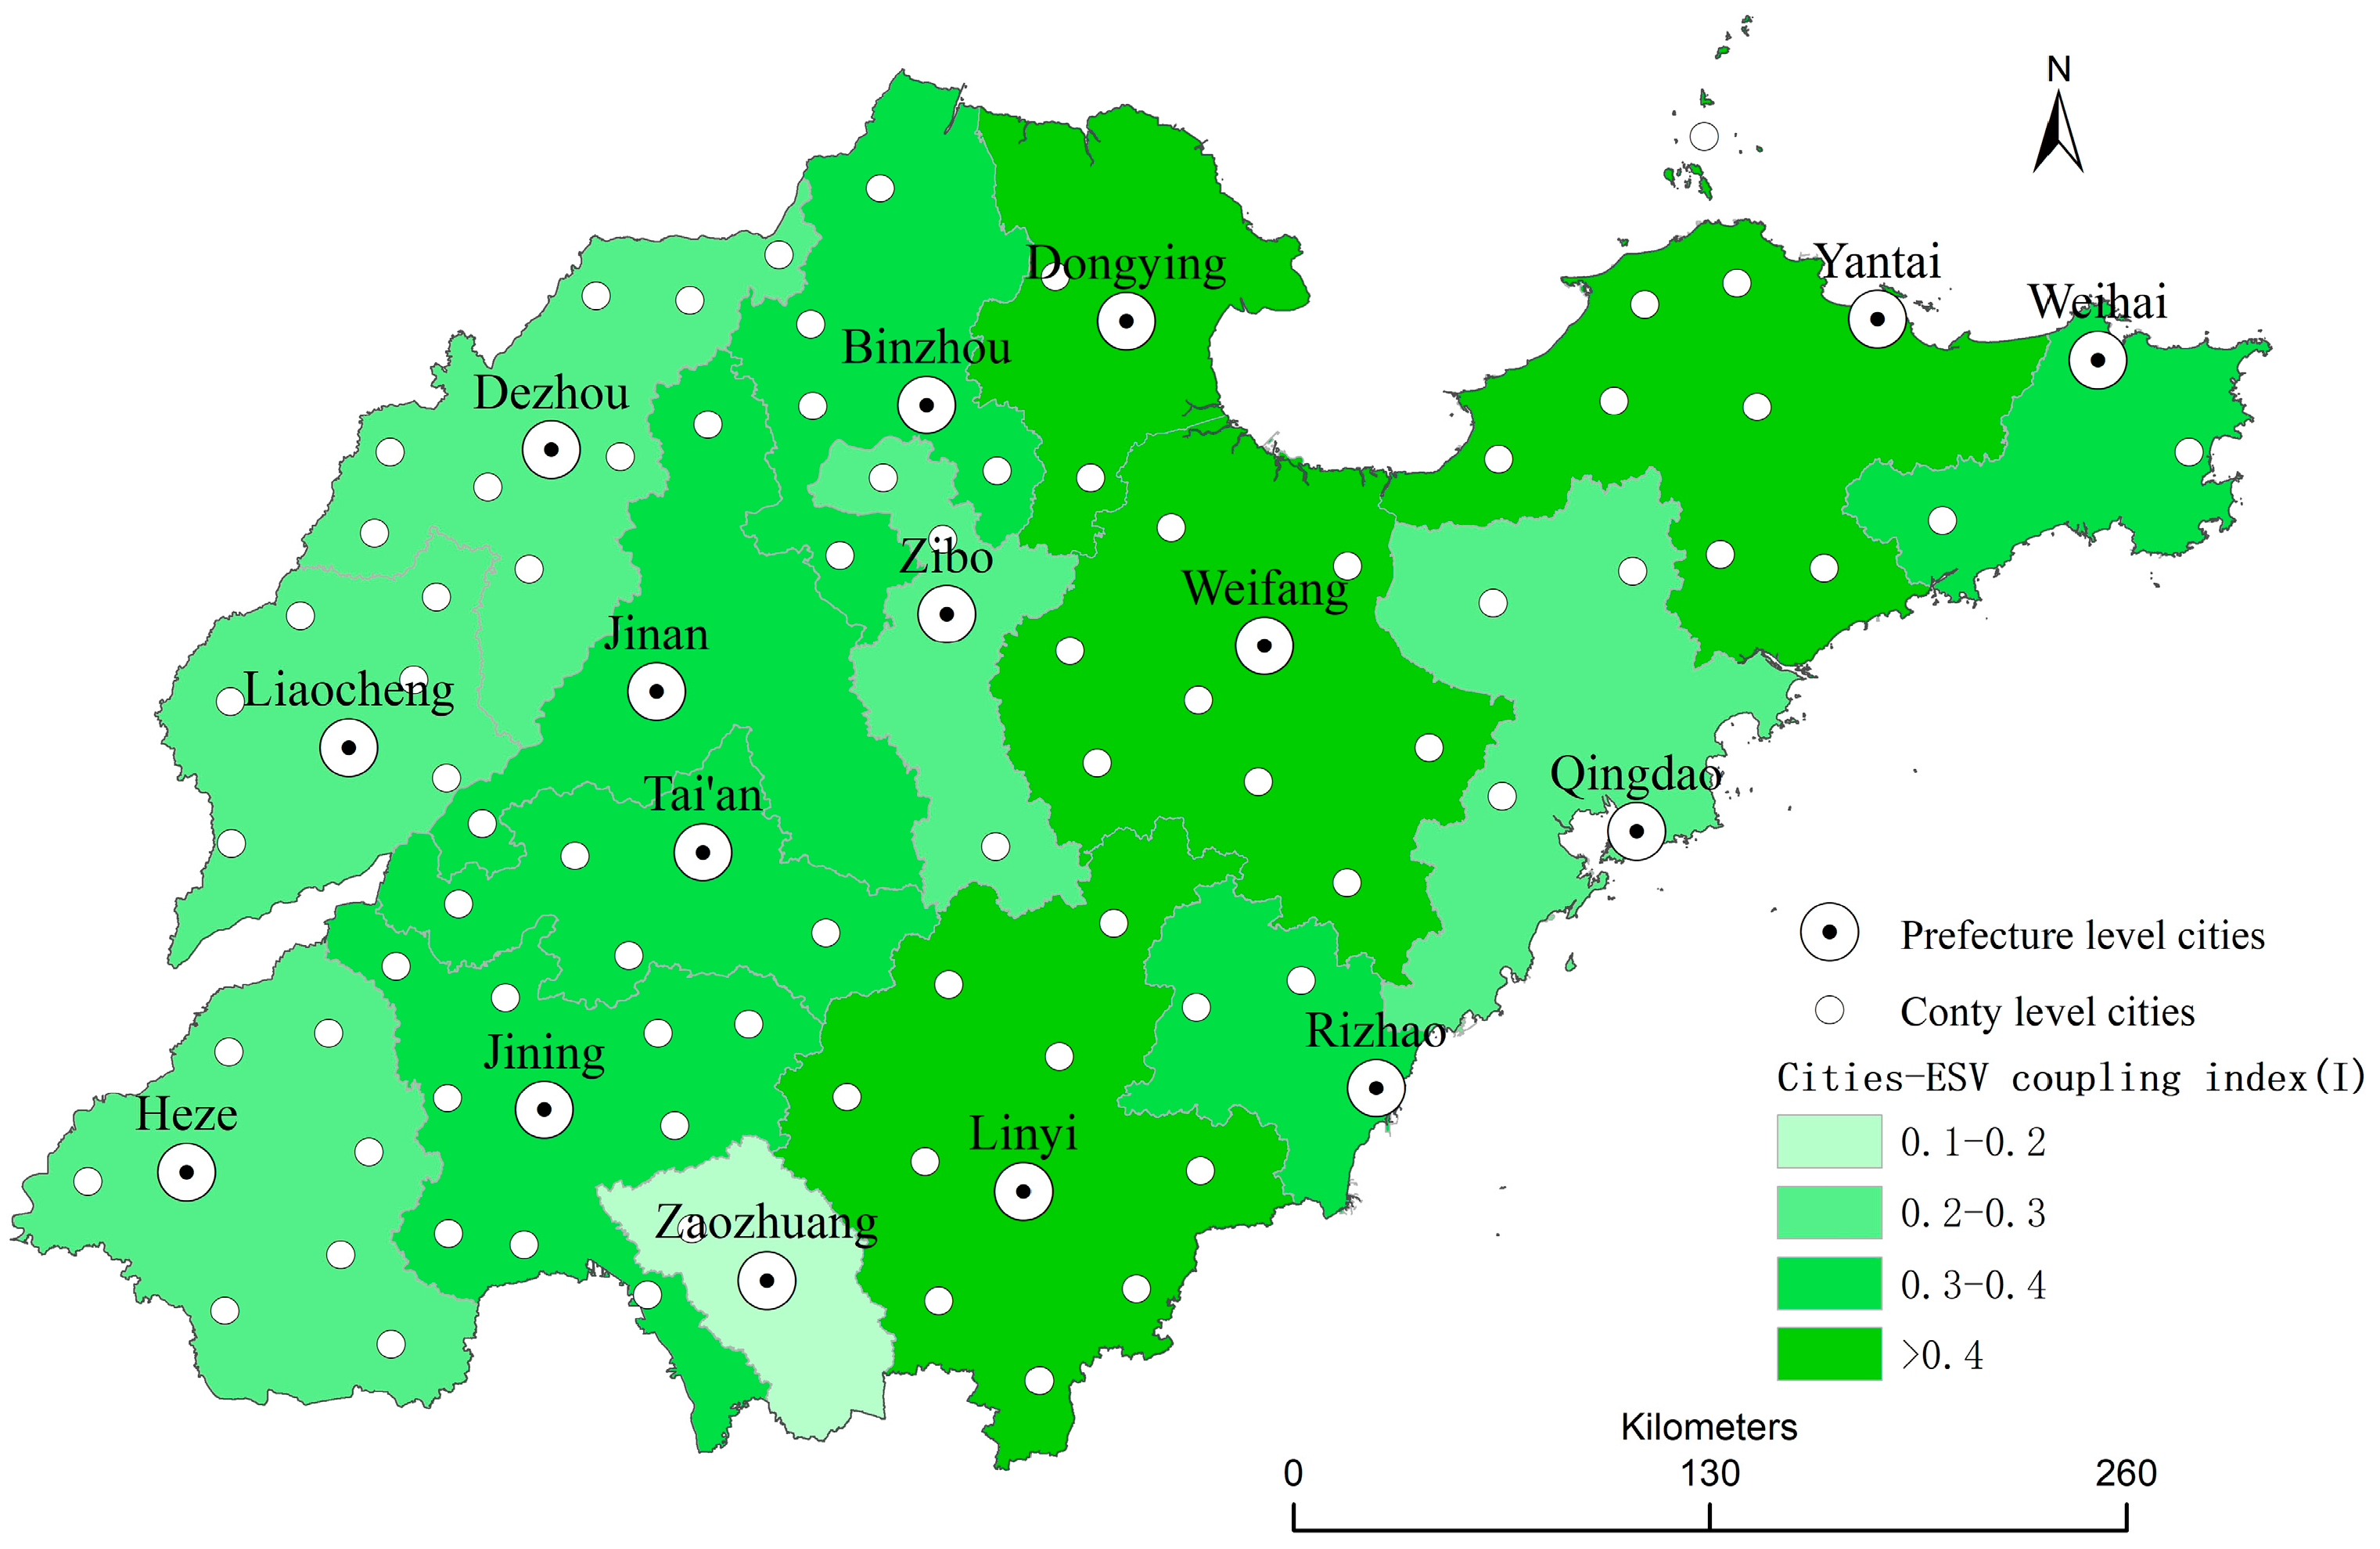
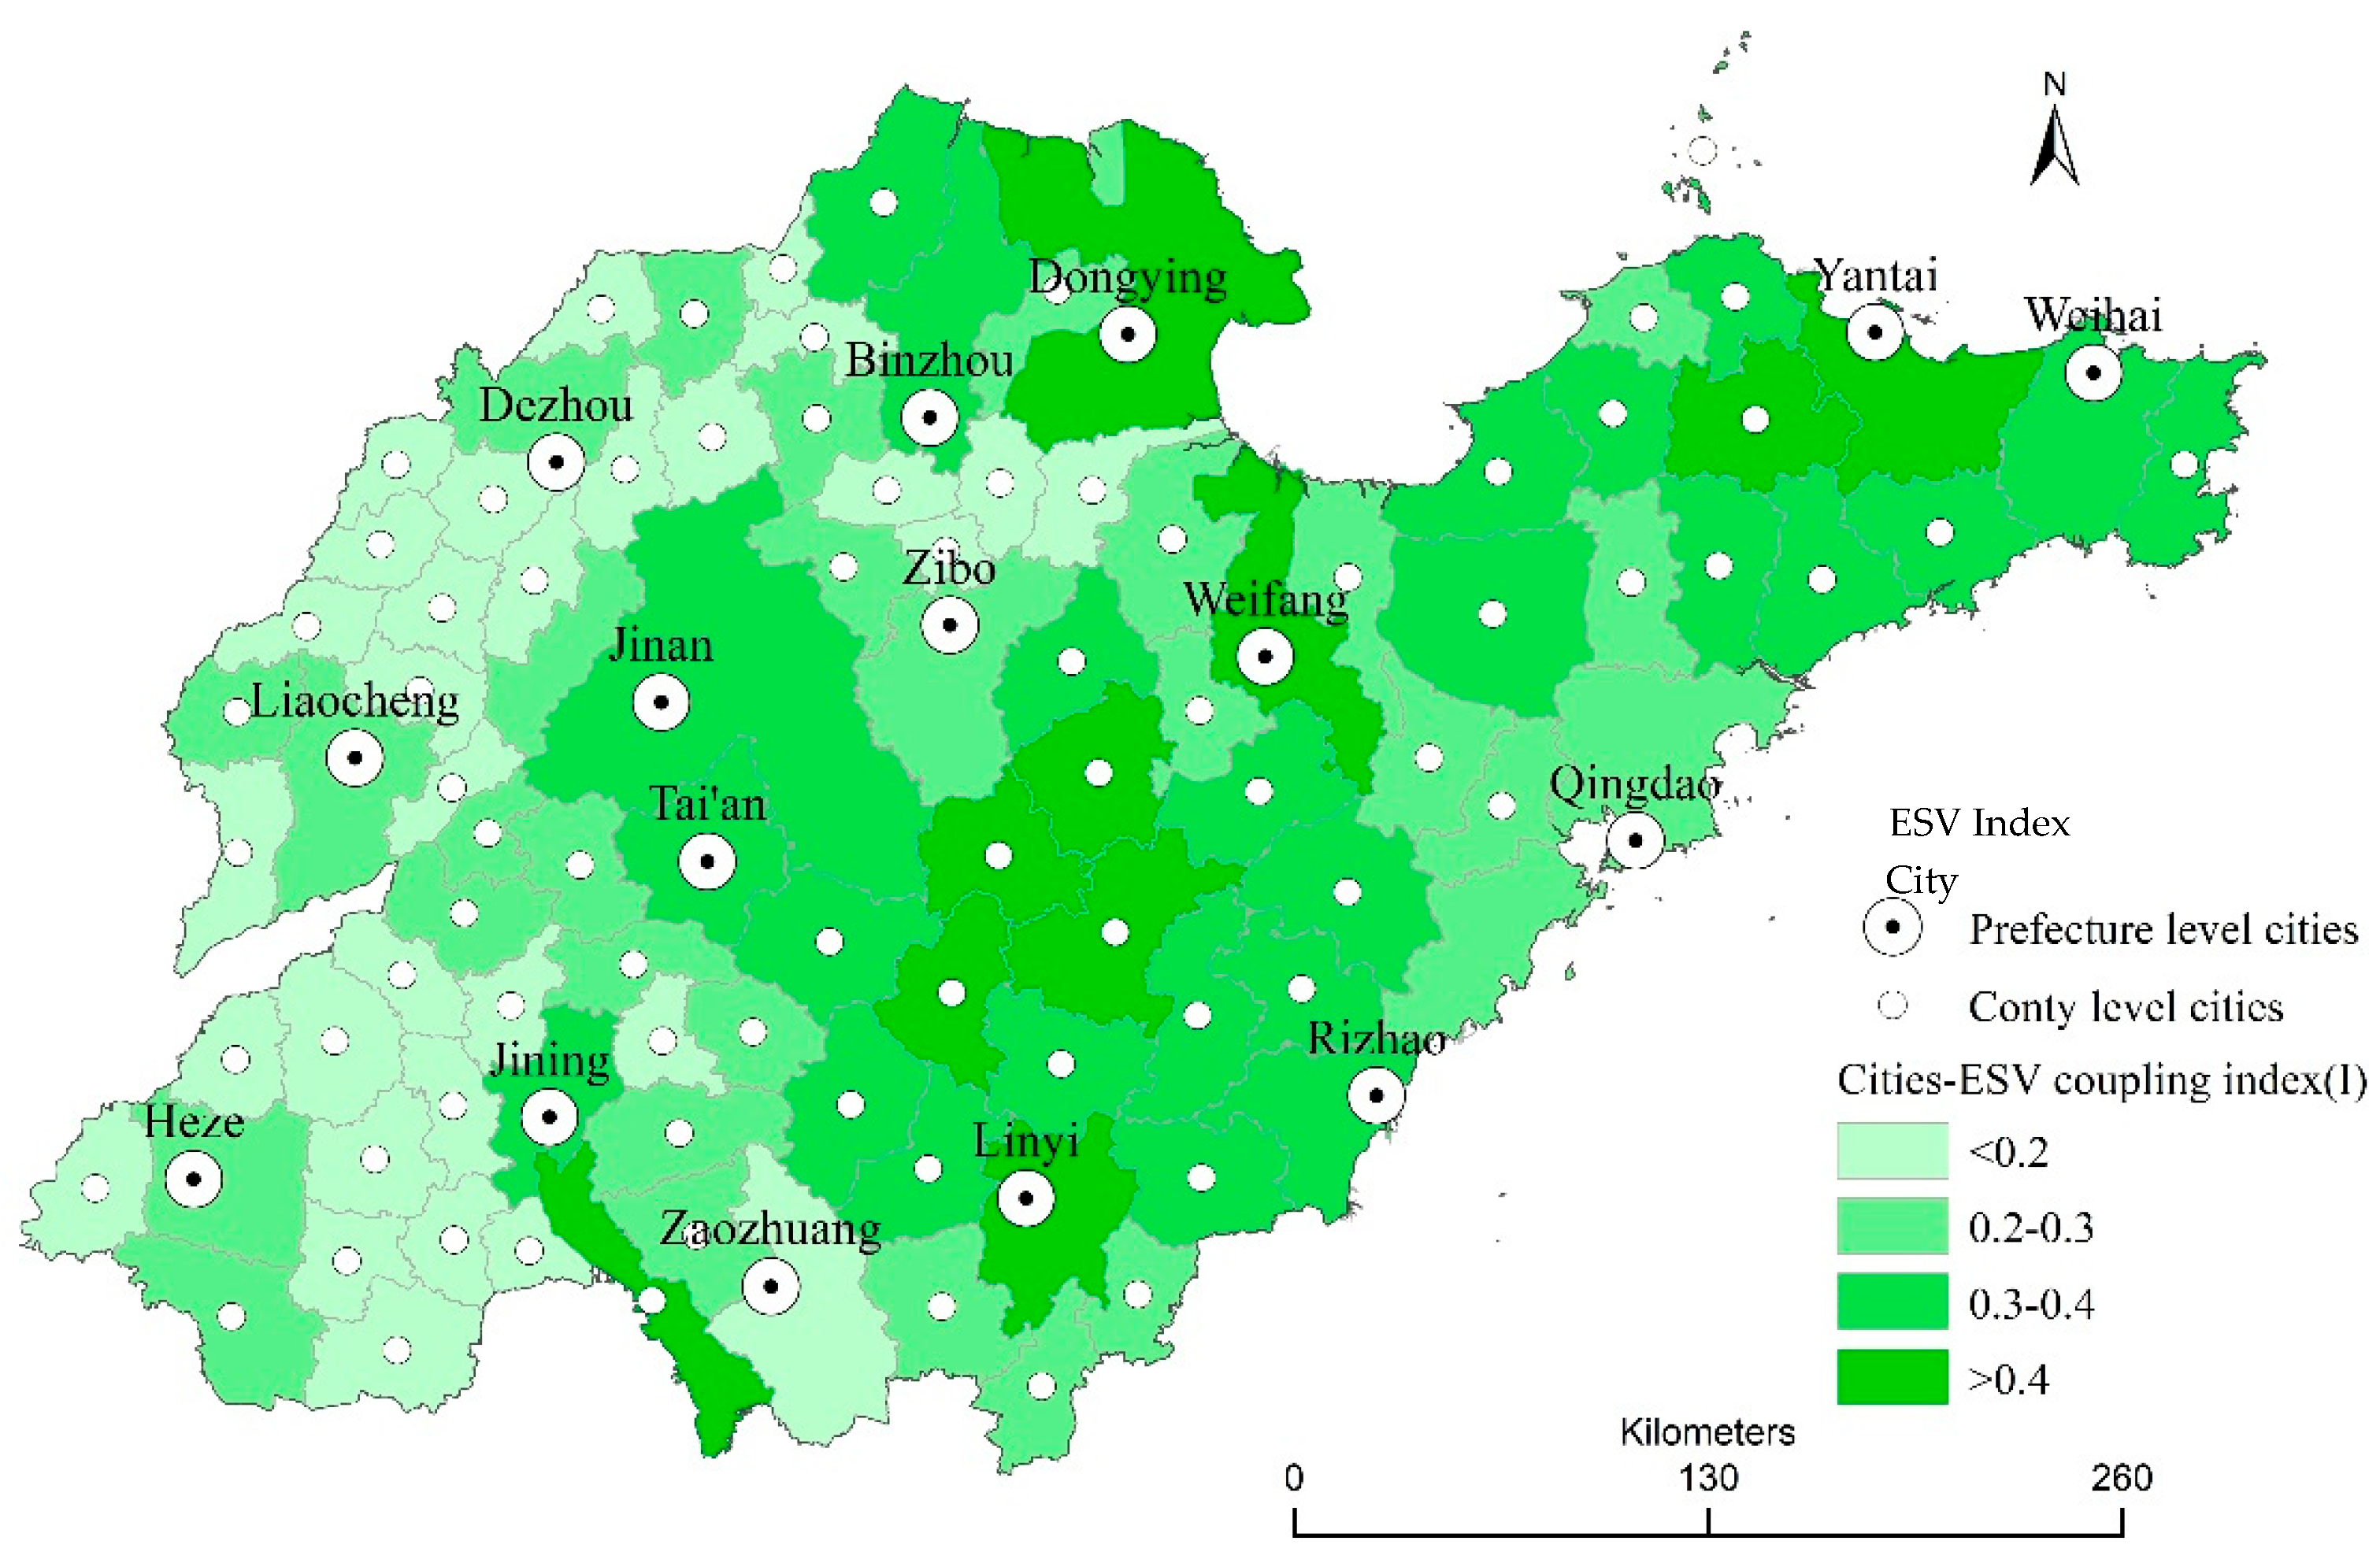
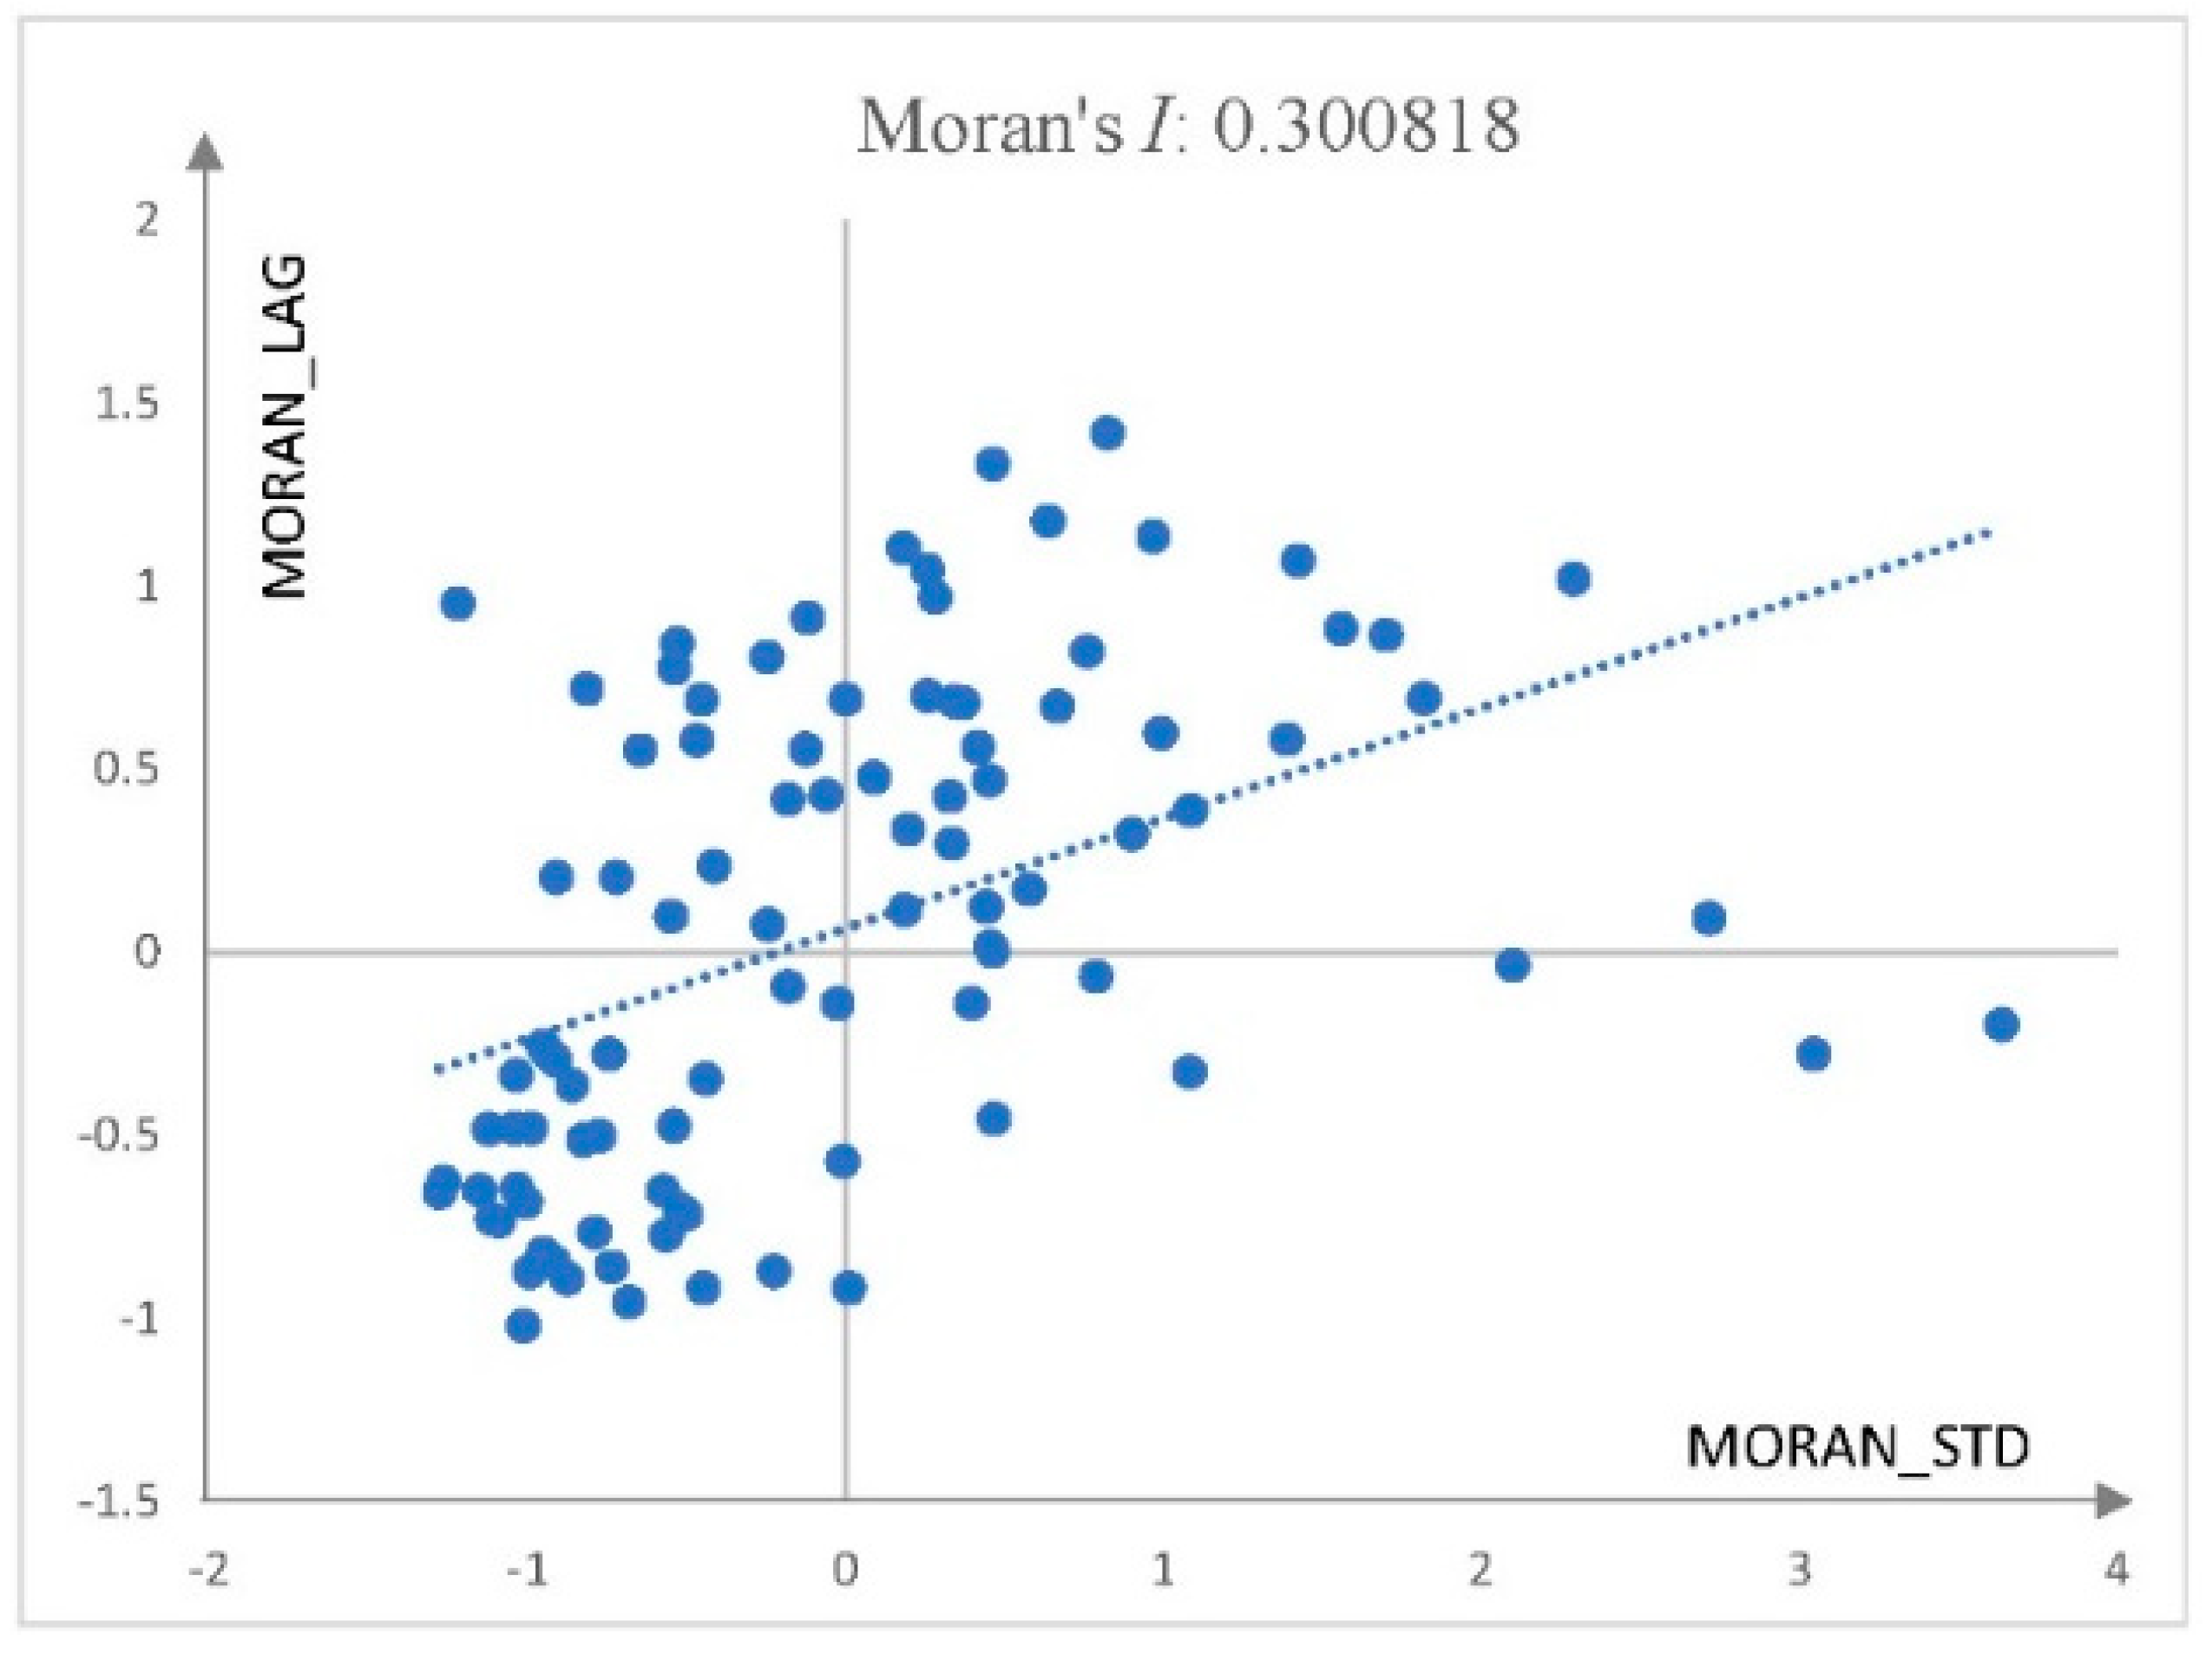
4.3. Spatial Distribution Characteristics of Cities-ESV Coupling Index (I)

The coupling relationship index between urban development and ecosystem services in the Peninsula Urban Agglomeration shows a positive correlation in spatial distribution. The global spatial autocorrelation Moran’s I index is 0.3008 (Figure 4), indicating that the coupling indexes of various cities within the Peninsula Urban Agglomeration have the characteristics of high–high, high–low, low–high, and low–low clustered distributions in spatial distribution, but it is not very significant.
From the perspective of local spatial autocorrelation characteristics, there are phenomena of high–high clustering and low–low clustering. The coupling indexes of cities such as Yantai City, Penglai City, Weihai City, and Rushan City in the eastern part of the Peninsula Urban Agglomeration show the characteristics of high–high clustering. The coupling indexes of cities such as Anqiu, Yiyuan, Yishui, Mengyin, Yinan, and Feixian in the central part show the characteristics of high–high clustering. The coupling indexes of some cities in Liaocheng City, Dezhou City, and Heze City in the western part show the characteristics of low–low clustering. There is a phenomenon of high–high clustering within Dongying City in the northern part, but it is not obvious (Figure 5 and Figure 6).

5. Discussion and Conclusions

5.1. Discussion

5.1.1. The Relationship Between Urban Development and Ecosystem Services

There is a relatively obvious correlation between urban development and ecosystem services [14,16], and it is a coupled development process [21,22]. Rapid urban expansion has had a profound impact on the structure and function of regional ecosystems [63,64]. The increase in built-up land has seriously squeezed the space of ecological land [65,66]. Our study (1996–2020) reveals a critical decoupling phenomenon: while the SPUA exhibited sustained GDP growth, incremental population expansion, and rapid built-up area proliferation, its ESV demonstrated significant depletion declining from 1.437322 × 10¹² CNY/a to 1.397787 × 10¹² CNY/a, with a mean annual depletion rate of −0.44%. These findings not only empirically validate the intricate coupling between urban development and ecosystem service regimes, but also delineate their spatio-temporal trajectory, while highlighting the progressive depletion of ecosystem services as a critical sustainability challenge confronting the Peninsular Urban Agglomeration amidst intensifying urbanization processes. Spatial analysis of the Cities-ESV coupling index (I) delineates critical conflict zones, including municipalities such as Qingdao, Zibo, Dezhou, Heze, Liaocheng, and Zaozhuang, alongside 30 counties exhibiting sub-0.2 coupling indices. This discovery provides data support for further protecting the ecosystem. Next, governance interventions should prioritize awareness of significance of ecosystem service through multilateral engagement with global initiatives—including the Millennium Ecosystem Assessment (MA), The Economics of Ecosystems and Biodiversity (TEEB), and the Intergovernmental Science-Policy Platform on Biodiversity and Ecosystem Services (IPBES) [67]. Furthermore, the government could implement policy instruments to further intensify efforts in ecological and environmental protection, scientifically adjust the structure of ecological land use, and expand the space for ecological land use, among other measures, to curb the continuous reduction trend in ESV.

5.1.2. ES Assessment

The level of ecosystem services is a key element related to the high-quality development of cities and of shaping new high-quality spaces in urban agglomerations, and it is an important indicator for diagnosing the development status of cities [38]. China has long been aware of this issue. For instance, in the “Overall Plan for the Reform of the Ecological Civilization System” issued by the Central Committee of the Communist Party of China and The State Council in 2015, it was explicitly proposed to “establish accounting methods for assets and liabilities of water resources, land resources, forest resources, etc.”. “Establish a system of paid use of resources and ecological compensation that reflects market supply and demand and the scarcity of resources, and embodies natural value and intergenerational compensation”, etc. It can be seen that conducting ES assessment and clarifying the total value and material amount of ecosystem services in the Peninsula Urban Agglomeration is an important foundation for achieving the balance sheet accounting of natural resources and ecological compensation.
However, compared with the level of urban development, the status of ecosystem services is relatively difficult to measure, and the relevant assessment still remains at the stage of research and exploration. Methods such as value assessment and physical quality assessment of ecosystem services are currently commonly used ones. This paper draws on previous studies and uses the equivalent factor method to evaluate the ecosystem service value of each city in SPUA. Compared with the studies of Costanza et al. [1] and Xie Gaodi et al. [68], the ecosystem service value per unit area is relatively high, but it is close to the estimates of Xie Gaodi et al. [45] and Xue MG et al. [69]. The main reasons are as follows: (1) the value of ecosystem services in the early studies is generally low, while in recent studies it is relatively high; (2) this research is estimated based on the primary agricultural product output and product prices obtained from the actual sample site investigation, which is more in line with the actual situation in Shandong. (3) Price changes are also an important factor affecting the assessment of the value of ecosystem services.

5.1.3. Application and Advantages of Cities-ESV Coupling Index (I)

In the study of the relationship between urban development and ecosystem services, population, GDP, and construction land area are commonly used indicators to measure the level of urban development [38,70]. Some scholars combine the value of ecosystem services to study the relationship between cities and ecosystems [33,38,71]. Meanwhile, another group of scholars are more inclined to combine the physical quality assessment methods of ecosystem services [25,72]. Few studies have simultaneously assessed the value of ecosystem services using both value quantity and physical quantity. In this paper, the Cities-ESV coupling index (I), based on referring to previous studies, adopts value quantity assessment while selecting four indicators, namely net vegetation primary productivity, habitat quality index, soil conservation services, and carbon storage, to measure the physical quality of ecosystem services. The main purpose is to minimize the uncertainty of the value of ecosystem services as much as possible, and the actual effect is also quite obvious. In addition, this paper simultaneously selects two indicators that can reflect the spatial layout: the spatial balance degree and structural balance degree. However, few previous studies have taken into account the impact of the spatial layout of the ecosystem on urban development. Our results contributed to providing an effective method for ecosystem services assessment.

5.1.4. Limitations and Implications for Measuring the Coupling Relationship Between Urban Development and ES

In this study, we applied the value quantity, physical quantity, and spatial balance degree to evaluate the basic state of ecosystem services. In view of the research of our ancestors, due to simplicity, the equivalent factor method has been widely applied in the assessment of ESV. However, there are some uncertainties and criticisms for this method. It was an expert-based method and has high subjective limitations and lacked conformity [73,74]. Great efforts have been made in methods such as sample point investigation and quality assessment of synchronous reference objects to try to eliminate this uncertainty. However, more data or more in-depth research are still needed to make this assessment method more in line with the actual value of ecosystem services. Therefore, the verification work of ecosystem service value assessment is also a scientific issue worthy of further study. Furthermore, the relationship between urban development and ecosystem services is complex and difficult to measure. In view of the difficulty of data collection, this paper only selects 10 relatively easily accessible indicators to judge their interrelationship, and the selected measurement method is also relatively simple. The aim is to provide a new idea and research perspective for the study of the relationship between cities and ecosystems. To fully understand this relationship, it is necessary to collect more data and materials and design more methods. And the research results can indeed reflect the problems existing in the coordinated development of the two, providing decision support for urban planning and managers.

5.2. Conclusions

There exists an obvious and complex coupling relationship between urban development and ecosystems. Studying and reconstructing this relationship has become a scientific issue of common concern in the current academic circle, which is of great significance for protecting regional ecosystems and promoting the coordinated development of cities and ecosystems. In this study, based on models such as the value assessment of ecosystem services, the physical quality assessment of four types of ecosystem services, and the spatial distribution of ecosystem services, ten indicators were selected, including urban population, GDP, construction land area, ESV, ecosystem service physical quality (NPP, habitat quality, soil conservation, and carbon storage), and ecosystem service balance degree (structural balance degree and spatial balance degree). The Cities-ESV coupling index (I) was constructed to study the relationship between urban development and ecosystems in 16 cities and 78 counties of the SPUA. Furthermore, by using the temporal coordination model and the spatial autocorrelation model, the development trends of cities and ecosystems in the SPUA, as well as the spatial distribution and aggregation status, were analyzed. The findings reveal a significant inverse correlation between urban sprawl and ESV within the Peninsular Urban Agglomeration, with metropolitan encroachment into ecological spaces exerting measurable pressure on biophysical systems. Spatial autocorrelation analysis of the Cities-ESV coupling index (I) demonstrates localized clustering patterns (high–high, high–low, low–high, and low–low). High–high clusters predominantly concentrate in the eastern and central sectors, whereas low–low clusters dominate the western periphery. Notably, Dongying City in the northern sector exhibits fragmented high–high clustering. Four cities and five counties demonstrate a superior Cities-ESV coupling index (I) value, indicating synergistic urban–ecological coordination, while in other cities and counties, ecosystems impose constraints on urban development. These spatially explicit insights provide the scientific underpinning for the evaluation of the coupling relationship between urban development and ecosystems, policy making of rationally protecting and conserving ecosystems, as well as scientific formulation of territorial spatial planning.

Author Contributions

Conceptualization, Q.G.; Methodology, Y.L.; Software, X.T.; Validation, G.A. and Z.S.; Formal Analysis, Y.L.; Investigation, X.L.; Resources, X.L.; Data Curation, Z.S.; Writing—Original Draft, Q.G.; Writing—Review and Editing, G.A.; Supervision, Z.T. and M.F.; Project Administration, Z.T.; Funding Acquisition, Q.G. All authors have read and agreed to the published version of the manuscript.

Funding

This work was supported by two projects: (1) Rapid Identification and Evaluation Early Warning Technology for the Bottom-line Control Status of Territorial Space Security (2023YFC3804003); (2) Construction of the Monitoring Network for the Implementation of Territorial Spatial Planning in Shandong Province and the Monitoring of Ecological Red Lines.

Institutional Review Board Statement

Not applicable.

Informed Consent Statement

Not applicable.

Data Availability Statement

No new data were created or analyzed in this study. Data sharing is not applicable to this article.

Acknowledgments

We would like to acknowledge all the teachers and co-workers who participated in the data downloading and processing and wrote, revised, and reviewed the original draft.

Conflicts of Interest

The authors declare no conflicts of interest.

References

  1. Costanza, R.; D’Arge, R.; de Groot, R.; Farber, S.; Grasso, M.; Hannon, B.; Limburg, K.; Naeem, S.; O’Neill, R.V.; Paruelo, J.; et al. The value of the world’s ecosystem services and natural capital. Ecol. Econ. 1998, 25, 3–15. [Google Scholar] [CrossRef]
  2. Kumar, M.; Kumar, P. Valuation of the ecosystem services: A psycho-cultural perspective. Ecol. Econ. 2008, 64, 808–819. [Google Scholar] [CrossRef]
  3. Huynh, L.T.M.; Gasparatos, A.; Su, J.; Lam, R.D.; Grant, E.I.; Fukushi, K. Linking the nonmaterial dimensions of human-nature relations and human well-being through cultural ecosystem services. Sci. Adv. 2022, 8, eabn8042. [Google Scholar] [CrossRef]
  4. Chen, L.; Sun, R.; Sun, T.; Yang, L. Eco-security pattern building in urban agglomeration: Conceptual and theoretical thinking. Acta Ecol. Sin. 2021, 41, 4251–4258. [Google Scholar]
  5. Xi, J. Hold High the Great Banner of Socialism with Chinese Characteristics and Strive in Unity to Build a Modern Socialist Country in All Respects: Report to the 20th National Congress of the Communist Party of China. Qianjin 2022, 6, 4–26. [Google Scholar]
  6. Li, C.; Zhao, J. Research on Spatiotemporal Pattern and Influencing Factors of Supply-Demand Matching in the Yangtze River Delta Urban Agglomeration. Ecol. Econ. 2022, 38, 160–169. [Google Scholar]
  7. Cai, W.; Tu, F. Study on Coupling and Coordination Relationship Between Urbanization and Eco - environment in Wuhan City Circle. Resour. Dev. Mark. 2019, 35, 1368–1374. [Google Scholar]
  8. You, G.; Wang, P.; Cao, J.; Hu, Y. Analysis of Spatial-temporal Evolution and Coupling Effects of Land Use and Ecosystem Services in a Resource-based City. J. Southwest For. Univ. (Nat. Sci.) 2025, 45, 117–127. [Google Scholar]
  9. Huang, J.; Na, Y.; Guo, Y. Spatiotemporal characteristics and driving mechanism of the coupling coordination degree of urbanization and ecological environment in Kazakhstan. J. Geogr. Sci. 2020, 30, 1802–1824. [Google Scholar] [CrossRef]
  10. Kovács, Z.; Farkas, Z.J.; Egedy, T.; Kondor, A.C.; Szabó, B.; Lennert, J.; Baka, D.; Kohán, B. Urban sprawl and land conversion in post-socialist cities: The case of metropolitan Budapest. Cities 2019, 92, 71–81. [Google Scholar] [CrossRef]
  11. Jin, Y.; Zhao, K.; Xiao, G. The Economic Compensation Zoning of the Cultivated Land Protection in Shaanxi Province: From the Perspective of Food and Ecological Security. China Land. Sci. 2015, 29, 12–19. [Google Scholar]
  12. Tong, Y.; Pan, Y.; Zhang, M.; Xu, L. Analysis on coupling and coordination between population urbanization and land urbanization in Yunnan Province. World Reg. Stud. 2020, 29, 120–129. [Google Scholar]
  13. Bai, X.; Shi, P.; Liu, Y. Society: Realizing China’s urban dream. Nature 2014, 509, 158–160. [Google Scholar] [CrossRef] [PubMed]
  14. Ou, Y.; Zhu, X.; He, Q. Spatial interaction between urbanisation and ecosystem services: A case study in Changsha-Zhuzhou-Xiangtan urban agglomeration, China. Acta Ecol. Sin. 2019, 39, 7502–7513. [Google Scholar]
  15. Fang, C.; Zhou, C.; Gu, C.; Chen, L.; Li, S. Theoretical analysis of interactive coupled effects between urbanization and eco-environment in mega-urban agglomerations. Acta Geogr. Sin. 2016, 71, 20. [Google Scholar] [CrossRef]
  16. Feng, S.; Tang, Z.; Yu, L.; Guo, C.; Tang, M.; Yang, Z. Collaborative construction of ecological network in urban agglomerations: A case study of Guangdong-Hong Kong-Macao Greater Bay Area. Acta Ecol. Sin. 2022, 42, 8223–8237. [Google Scholar]
  17. Huang, H.; Li, D. Evaluation of coupling and coordination relationship between urbanization and ecological environment in China’s urban agglomerations. Jiangsu Agric. Sci. 2018, 46, 5. [Google Scholar]
  18. Wang, S.; Fang, C.; Wang, Y. Quantitative investigation of the interactive coupling relationship between urbanization and eco-environment. Acta Ecol. Sin. 2015, 35, 11. [Google Scholar]
  19. Huang, H. Comparative study on coordinated development of urbanization and eco - environment of China’s urban agglomerations. Ecol. Econ. 2016, 32, 4. [Google Scholar]
  20. Zhang, J.; Jiao, W.; Han, B. Characteristics of coordination changes and spatial coupling relationship between urbanization and ecosystem services. Acta Ecol. Sin. 2020, 40, 12. [Google Scholar]
  21. Liu, Y.; Wang, S. Couping coordinative degree and interactive coercing relationship between urbanization and eco-enviroment in pearl river delta. Human. Geogr. 2015, 30, 8. [Google Scholar]
  22. Holt, A.R.; Mears, M.; Maltby, L.; Warren, P. Understanding spatial patterns in the production of multiple urban ecosystem services. Ecosyst. Serv. 2015, 16, 33–46. [Google Scholar] [CrossRef]
  23. Huang, X.; Han, L.; Zhao, Y.; Huang, X. Theoretical foundations and analytical frameworks for urban socio-ecological system. Acta Ecol. Sin. 2024, 44, 6892–6905. [Google Scholar]
  24. Li, H.; Dai, Q.; Hu, Z.; Gui, Y. Evaluation and Prediction of Ecosystem Service Value in Urban Agglomeration of Central Guizhou. Res. Soil. Water Conserv. 2024, 31, 248–257. [Google Scholar]
  25. Zhang, X.; Zhang, D.; Zhang, G.; Song, M. Spatiotemporal characteristics of ecosystem services and ecological function areas in Guanzhong Plain urban agglomeration. Arid. Land. Geogr. 2024, 47, 1587–1595. [Google Scholar]
  26. Zhong, J.; Gao, M.; Zhao, Y.; Peng, S.; Wang, M. Spatial variation of the cultural ecosystem services pattern and influencing factors in the coastal areas: Evidence from Ramsar Sites in China. Acta Geogr. Sin. 2024, 79, 76–96. [Google Scholar]
  27. Bai, Y.; Deng, X.; Jiang, S.; Zhang, Q.; Wang, Z. Exploring the relationship between urbanization and urban eco-efficiency: Evidence from prefecture-level cities in China. J. Clean. Prod. 2017, 195, S1990388463. [Google Scholar] [CrossRef]
  28. Qiu, L.; Pan, Y.; Zhu, J.; Amable, G.S.; Xu, B. Integrated analysis of urbanization-triggered land use change trajectory and implications for ecological land management: A case study in Fuyang, China. Sci. Total Environ. 2019, 660, 209–217. [Google Scholar] [CrossRef]
  29. An, G. Construction and Application of Evaluation System for Land Ecosystem Service Value in Shandong Province. Ph.D. Thesis, Shandong Normal University, Jinan, China, 2024. [Google Scholar]
  30. An, G. Spatiotemporal evolution and protection zoning of ecological land in Shandong Province based on EKC & Lorenz Curve. China Land. Sci. 2018, 32, 89–96. [Google Scholar]
  31. Sun, R.; Zhu, Q. Distribution and Seasonal Change of Net Primary Productivity in China from April, 1992 to March, 1993. Acta Geogr. Sin. 2000, 67, 36–45. [Google Scholar]
  32. Liu, Y. Measurement of Carbon Storage and Ecosystem Service Value of Forest Ecosystems in Liaoning Province. Ph.D. Thesis, Beijing Forestry University, Beijing, China, 2016. [Google Scholar]
  33. Zhou, L.; Li, W.; Wang, Y.; Bian, H.; Wang, Q.; Liu, Y.; Yuan, Z. Spatiotemporal Coupling Characteristics Between Urbanization and Ecosystem Health in Chongqing City. Bull. Soil. Water Conserv. 2023, 43, 397–408. [Google Scholar] [CrossRef]
  34. Yang, G.; Lv, K.; Li, F. Spatial and Temporal Correlation Analysis of Land Use Change and Ecosystem Service Value in Nanchang City Based on Grid Scale. China Land. Sci. 2022, 36, 121–130. [Google Scholar]
  35. Shang, J.; Wang, Z.; Li, L.; Chen, Y.; Li, P. A study on the correlation between technology innovation and the new-type urbanization in Shaanxi province. Technol. Forecast. Soc. 2018, 135, 266–273. [Google Scholar] [CrossRef]
  36. Yu, B. Ecological effects of new-type urbanization in China. Renew. Sustain. Energy Rev. 2021, 135, 110239. [Google Scholar] [CrossRef]
  37. Li, L.; Li, J. Analysis on Coupling and Coordination Between Population Urbanization and Land Urbanization in Yunnan Province. Resour. Dev. Mark. 2017, 33, 39–43. [Google Scholar]
  38. Xiaomin, G.; Chuanglin, F.; Xufang, M.; Dan, C. Coupling and coordination analysis of urbanization and ecosystem service value in Beijing-Tianjin-Hebei urban agglomeration. Ecol. Indic. 2022, 137, 108782. [Google Scholar] [CrossRef]
  39. Zhang, X.; Liu, Y.; Wang, Y.; Yuan, X. Interactive relationship and zoning management between county urbanization and ecosystem services in the Loess Plateau. Ecol. Indic. 2023, 156, 111021. [Google Scholar] [CrossRef]
  40. Gao, Y.; Ma, L.; Liu, J.; Zhuang, Z.; Huang, Q.; Li, M. Constructing Ecological Networks Based on Habitat Quality Assessment: A Case Study of Changzhou, China. Sci. Rep. 2017, 7, 46073. [Google Scholar] [CrossRef]
  41. Zheng, H.; Li, H. Spatial–temporal evolution characteristics of land use and habitat quality in Shandong Province, China. Sci. Rep. 2022, 12, 15422. [Google Scholar] [CrossRef]
  42. Ren, Q.; Liu, D.; Liu, Y. Spatio-temporal variation of ecosystem services and the response to urbanization: Evidence based on Shandong province of China. Ecol. Indic. 2023, 151, 13. [Google Scholar] [CrossRef]
  43. Renard, K.G.; Foster, G.R.; Weesies, G.A.; Mccool, D.K.; Yoder, D.C. Predicting soil erosion by water: A guide to conservation planning with the Revised Universal Soil Loss Equation (RUSLE). Agric. Handb. 1997, 703, 408. [Google Scholar]
  44. Wischmeier, W.H.; Smith, D.D. Predicting Rainfall Erosion Losses—A Guide To Conservation Planning; Department of Agriculture, Science and Education Administration: Washington, DC, USA, 1978. [Google Scholar]
  45. Xie, G.; Zhang, C.; Zhen, L.; Zhang, L. Dynamic changes in the value of China’s ecosystem services. Ecosyst. Serv. 2017, 26, 146–154. [Google Scholar] [CrossRef]
  46. An, G.; Han, Y.; Gao, N.; Ji, L.; Gao, H.; Tan, X.; Xu, Y. Spatial differentiation of ecosystem service value and equilibrium degree in Shandong Province. China Popul. Resour. Environ. 2021, 31, 9–18. [Google Scholar]
  47. Ge, Q.; Xu, W.; Fu, M.; Han, Y.; An, G.; Xu, Y. Ecosystem service values of gardens in the Yellow River Basin, China. J. Arid. Land. 2022, 14, 284–296. [Google Scholar] [CrossRef]
  48. Potter, C.S.; Randerson, J.T.; Field, C.B.; Matson, P.A.; Klooster, S.A. Terrestrial Ecosystem Production: A Process Model Based on Global Satellite and Surface Data. Glob. Biogeochem. Cy. 1993, 7, 811–841. [Google Scholar] [CrossRef]
  49. Zhang, X.; Xiao, W.; Wang, Y. Spatiotemporal Characteristics of NPP in the Three Gorges Reservoir Area and Climate Driving Mechanisms Based on an Improved CASA Model. Acta Ecol. Sin. 2021, 41, 3488–3498. [Google Scholar]
  50. Zhu, W.; Pan, Y.; Zhang, J. Estimation of net primary productivity of Chinese terrestrial vegetation based on remote sensing. J. Plant Ecol. 2007, 31, 12. [Google Scholar]
  51. Williams, J.R.; Jones, C.A.; Kiniry, J.R.; Spanel, D.A. The EPIC Crop Growth Model. Trans. Asae 1989, 32, 497–511. [Google Scholar] [CrossRef]
  52. Ge, Z.; Zhao, C.; Lu, S.; Liu, L.; Wang, J.; Pan, Y. Monitoring and Analyzing the Soil Erosion Changes in Beijing Suburb During the Latest Thirteen Years—A Case Study of Fangshan County of Beijing Suburb. Res. Soil. Water Conserv. 2006, 13, 1–6. [Google Scholar]
  53. Liu, B.Y.; Nearing, M.A.; Risse, L.M. Slope Length Effects on Soil Loss for Steep Slopes. Soil. Sci. Soc. Am. J. 2000, 64, 1759–1763. [Google Scholar] [CrossRef]
  54. Cai, C.; Ding, S.; Shi, Z.; Huang, L.; Zhang, G. Study of Applying USLE and Geographical Information System IDRISI to Predict Soil Erosion in Small Watershed. J. Soil Water Conserv. 2004, 2, 19–24. [Google Scholar]
  55. Fang, L.; Xu, D.; Wang, L.; Niu, Z.; Zhang, M. The study of ecosystem services and the comparison of trade-off and synergy in Yangtze River Basin and Yellow River Basin. Geogr. Res. 2021, 40, 1184–1196. [Google Scholar]
  56. Chuai, X.; Huang, X.; Lai, L.; Wang, W.; Peng, J.; Zhao, R. Land use structure optimization based on carbon storage in several regional terrestrial ecosystems across China. Environ. Sci. Policy 2013, 25, 50–61. [Google Scholar] [CrossRef]
  57. Li, K.R.; Wang, S.Q.; Cao, M.K. Vegetation and soil carbon storage in China. Sci. China Ser. D Earth Sci. 2003, 57, 72–80. [Google Scholar] [CrossRef]
  58. Zhu, L.; Hu, K.; Sun, S.; Liu, Y.; Liang, J. Research on the Spatiotemporal Variation of Carbon Storage in the Coastal Zone of Liaoning Province Based on InVEST Model. Geoscience 2022, 36, 96–104. [Google Scholar]
  59. Dai, R.; Yu, C.; Zhang, J.; Ning, Z.; Wang, Z.; Cheng, X. Analysis on Soil Organic Carbon Storage and the Potential for Carbon Sequestration in the Blue Economic Zone of Shandong Peninsula. J. Jilin Univ. (Earth Sci. Ed.) 2014, 44, 1659–1668. [Google Scholar]
  60. Liu, Q.; Yang, D.; Cao, L.; Anderson, B. Assessment and Prediction of Carbon Storage Based on Land Use/Land Cover Dynamics in the Tropics: A Case Study of Hainan Island, China. Land 2022, 11, 244. [Google Scholar] [CrossRef]
  61. Ma, T.; Li, X.; Bai, J.; Ding, S.; Zhou, F.; Cui, B. Four decades’ dynamics of coastal blue carbon storage driven by land use/land cover transformation under natural and anthropogenic processes in the Yellow River Delta, China. Sci. Total Environ. 2019, 655, 741–750. [Google Scholar] [CrossRef]
  62. Walters, D.; Kotze, D.C.; Rebelo, A.; Pretorius, L.; Job, N.; Lagesse, J.V.; Riddell, E.; Cowden, C. Validation of a rapid wetland ecosystem services assessment technique using the Delphi method. Ecol. Indic. 2021, 125, 107511. [Google Scholar] [CrossRef]
  63. Li, Z.; Hu, B.; Ren, Y. The Supply–Demand Budgets of Ecosystem Service Response to Urbanization: Insights from Urban–Rural Gradient and Major Function-Oriented Areas. Remote Sens. 2022, 14, 5670. [Google Scholar] [CrossRef]
  64. Wu, D.; Zheng, L.; Wang, Y.; Gong, J.; Li, J.; Chen, Q. Characteristics of urban expansion in megacities and its impact on water-related ecosystem services: A comparative study of Chengdu and Wuhan, China. Ecol. Indic. 2024, 158, 111322. [Google Scholar] [CrossRef]
  65. Fan, F.; Wen, X.; Feng, Z.; Gao, Y.; Li, W. Optimizing urban ecological space based on the scenario of ecological security patterns: The case of central Wuhan, China. Appl. Geogr. 2022, 138, 102619. [Google Scholar] [CrossRef]
  66. Li, Q.; Zhou, Y.; Yi, S. An integrated approach to constructing ecological security patterns and identifying ecological restoration and protection areas: A case study of Jingmen, China. Ecol. Indic. 2022, 137, 108723. [Google Scholar] [CrossRef]
  67. An, G.Q.; Huang, H.H.; Liu, Z. Research progress on land use and ecosystem service value assessment in China. J. Univ. Jinan (Nat. Sci. Ed.) 2022, 36, 28–37. [Google Scholar]
  68. Xie, G.; Xiao, Y. Review of agro-ecosystem services and their values. Chin. J. Eco-Agric. 2013, 21, 645–651. [Google Scholar] [CrossRef]
  69. Xu, M.; Xing, L.; Wang, X. Spatial Correction and Evaluation of Ecosystem Services in China. China Land. Sci. 2018, 32, 81–88. [Google Scholar]
  70. Li, P.; Li, T. Spatiotemporal analysis of ecosystem services and the impact of new-type urbanization: A case study of Chengdu, China. Ecol. Indic. 2025, 171, 113191. [Google Scholar] [CrossRef]
  71. Liu, Y.; Zhang, Y. Responses of Ecosystem Services to Land Use/Cover Changes in Rapidly Urbanizing Areas: A Case Study of the Shandong Peninsula Urban Agglomeration. Sustainability 2024, 16, 6100. [Google Scholar] [CrossRef]
  72. Fang, Z.; Xue, S.; Zhou, Q.; Cheng, C.; Bai, Y.; Huang, Z.; Wang, J.; Wang, R.; Wang, Y.; Wu, R.; et al. Unveiling driving disparities between satisfaction and equity of ecosystem services in urbanized areas. Resour. Environ. Sustain. 2024, 18, 100176. [Google Scholar] [CrossRef]
  73. Li, J.; Jiang, H.; Bai, Y.; Alatalo, J.M.; Li, X.; Jiang, H.; Liu, G.; Xu, J. Indicators for spatial–temporal comparisons of ecosystem service status between regions: A case study of the Taihu River Basin, China. Ecol. Indic. 2016, 60, 1008–1016. [Google Scholar] [CrossRef]
  74. Liu, S.; Sun, Y.; Wu, X.; Li, W.; Liu, Y.; Tran, L.P. Driving Factor Analysis of Ecosystem Service Balance for Watershed Management in the Lancang River Valley, Southwest China. Land 2021, 10, 522. [Google Scholar] [CrossRef]
Figure 1. Location of the Shandong Peninsula Urban Agglomeration.
Land 14 01119 g001
Figure 2. Technical roadmap.
Land 14 01119 g002
Figure 3. Distribution of the coupling relationship index between urban development and ecosystem services in 16 cities (regions) of the Shandong Peninsula Urban Agglomeration.
Land 14 01119 g003
Figure 4. Distribution map of the coupling relationship index between urban development and ecosystem services in 78 counties of the Shandong Peninsula Urban Agglomeration.
Land 14 01119 g004
Figure 5. Spatial autocorrelation scatter plot of the coupling relationship index between urban development and ecosystem services in the Shandong Peninsula Urban Agglomeration.
Land 14 01119 g005
Figure 6. Spatial autocorrelation distribution of the coupling relationship index between urban development and ecosystem services in the Shandong Peninsula Urban Agglomeration.
Land 14 01119 g006
Table 1. Comprehensive evaluation indicators for the coupling relationship between urban development and ecosystem services.
Goal LayerSub Target LayerIndicator
Layer
Indicator MeaningWeightReference
Cities-ESV coupling index (I)City
Size
PopulationUrban population sizeNegative indicator, total ecosystem services per capita is positive indicator0.1[35]
EconomyGross city productNegative indicator, ratio of total ESV to total economic output is positive indicator (contribution rate i)0.1[36]
Volume of construction landTotal size of construction landNegative indicator, ESV per construction land unit is positive indicator (contribution rate ii)0.1[37]
Total ecosystem servicesValueTotal ESVPositive indicator0.2[38]
Material quantityIncludes the net vegetation primary productivity, habitat quality index, soil conservation service, carbon storage index, etc. Positive indicatorNet vegetation primary productivity0.05[39]
Habitat quality index0.05[40,41,42]
Soil conservation service0.05[43,44]
Carbon storage index0.05[37,38,39,43]
Ecosystem service balance degreeStructural equilibrium degreeEcosystem services structural equilibriumPositive indicator0.2[29]
Spatial equilibrium degreeEcosystem services spatial equilibrium degreePositive indicator0.1[29]
Table 2. Comprehensive evaluation results of the coupling relationship between urban development and land ecosystem services in various districts and cities in Shandong Province.
OrderCityEva per CapitaESVRate of Contribution iRate of Contribution iiTotal Value of ServicesNet Vegetation Primary ProductivityHabitat QualitySoil Conservation ServiceCarbon StorageStructural EquilibriumSpatial Balance DegreeCities-ESV Coupling Index (I)
1Dongying1.0001.0001.0001.0001.0000.0070.2870.0000.3090.0000.5800.688
2Linyi0.0680.1860.4230.2110.7611.0001.0001.0001.0000.8430.5790.583
3Yantai0.1810.2910.1930.3880.7370.7650.8510.3630.8870.9240.4630.535
4Weifang0.0960.1740.2800.1340.6820.8730.8980.5770.9590.8490.5760.513
5Jining0.1120.4420.4480.4140.7380.5600.5450.1600.5710.1580.0000.397
6Weihai0.2470.4020.2900.5390.2540.0820.1160.0800.1210.7280.9230.384
7Binzhou0.1910.2660.5280.1490.3860.2500.3690.0380.4020.3230.6350.339
8Tai’an0.0670.2140.3230.2560.2470.2720.2640.4460.2630.6900.5690.324
9Jinan0.0430.1540.0000.1320.3280.5030.4650.7770.4490.8010.3010.318
10Rizhao0.1060.2110.2990.2410.1020.0510.0830.3530.0740.8680.8980.311
11Qingdao0.0670.2160.0030.1520.4620.4910.4440.3050.4700.6190.1210.296
12Dezhou0.0710.1070.3050.1260.2800.6130.3380.0010.3460.1910.7370.274
13Heze0.0000.0010.2060.0020.2240.7210.4150.0010.4420.1790.8480.247
14Zibo0.0500.1430.0870.1110.0920.1550.1610.7500.1461.0000.2700.245
15Liaocheng0.0090.0000.2290.0000.0940.4350.1710.0020.1990.3071.0000.214
16Zaozhuang0.0150.1060.2040.0900.0000.0000.0000.2570.0000.7330.5260.180
Table 3. Statistics table on economic, social, and ecosystem service value indicators of Shandong Peninsula Urban Agglomeration from 1996 to 2020.
Statistical ItemGross Regional Production
(CNY 100 Million)
Total Population
(10 Thousand)
Total Volume of Construction Land
(ha)
Esv
(×108 CNY/a)
Maximum value72,798.1710,165.003,163,840.5614,373.32
Minimum value5883.808738.001,948,967.3312,896.97
Mean value31,758.939448.242,376,174.0913,757.99
Standard deviation22,621.07441.23333,985.04581.43
Average interannual rate of change11.17%0.63%2.08%−0.44%
Disclaimer/Publisher’s Note: The statements, opinions and data contained in all publications are solely those of the individual author(s) and contributor(s) and not of MDPI and/or the editor(s). MDPI and/or the editor(s) disclaim responsibility for any injury to people or property resulting from any ideas, methods, instructions or products referred to in the content.

