Article

Assessment of Water Service Levels and User Satisfaction for Domestic Water Use in Emina-Boadi-Kumasi to Achieve the Sustainable Development of Urban Water Supply Systems in Ghana

by
Emmanuel Padmore Mantey
1,*,
Rameshwar S. Kanwar
2 and
Eugene Appiah-Effah
3
1
Department of Civil, Construction and Environmental Engineering, Iowa State University, Ames, IA 50011, USA
2
Department of Agricultural and Biosystems Engineering, Iowa State University, Ames, IA 50011, USA
3
Regional Water and Environmental Sanitation Centre, Kumasi (RWESCK), Department of Civil Engineering, Kwame Nkrumah University of Science and Technology, Kumasi 00233, Ghana
*
Author to whom correspondence should be addressed.
Water 2024, 16(22), 3193; https://doi.org/10.3390/w16223193
Submission received: 15 October 2024 / Revised: 3 November 2024 / Accepted: 5 November 2024 / Published: 7 November 2024
(This article belongs to the Section Water Resources Management, Policy and Governance)

Abstract

:
Access to reliable water supply is critical for sustainable development and public health, yet many peri-urban and rural communities in the developing world face challenges such as poor maintenance, faulty infrastructure, and inadequate governance of water services, hindering the UN’s Sustainable Development Goals (SDG). In Emina-Boadi, a small town in Kumasi, Ghana, residents increasingly rely on boreholes due to substandard service from the Ghana Water Company Limited (GWCL). This shift highlights concerns about water reliability, quality, and affordability, impacting public health and hindering progress toward SDG 6. This case study assesses water service levels using key performance indicators (KPIs) such as quantity, quality, affordability, accessibility, and reliability, focusing on sources like boreholes, hand pumps, piped water, hand-dug wells, rainwater, and surface waters. The study aims to delineate the roles of different water providers, understand community dynamics, and evaluate contributions to rural development and SDG 6 through stakeholder interviews and questionnaires. By leveraging the WASHCost framework, which aims to improve planning methods and the provision of water and sanitation services by addressing the lack of cost information in rural and peri-urban areas, and the Joint Monitoring Programme (JMP) framework, which monitors progress toward global targets related to water, sanitation, and hygiene, the study categorizes indicators and draws connections among them. The findings reveal a significant preference for borehole services, with 87% usage and an 83% reliability rate compared to 13% for GWCL. Daily water consumption averages 60.75 L per person, with on-premises access improving water collection efficiency to 7 min. Dissatisfaction with GWCL services highlights the need for improved delivery aligned with community needs and SDG targets. Adopting sustainable management practices, enhancing infrastructure, and improving governance are crucial for ensuring safe and affordable water access for all residents of Emina-Boadi and similar communities.

1. Introduction

Water is fundamental to sustainable development, energy and food production, ecosystem health, and human survival, covering approximately an area of 71% of the Earth’s surface. However, only a tiny fraction of the planet’s water is freshwater (about 0.7%) and accessible for use, highlighting the critical need for the conservation and management of this precious resource [1]. Despite the ocean being the largest water resource, its high salinity level restricts its use for essential human activities, underscoring the importance of freshwater [2,3]. The UN’s Sustainable Development Goal #6, part of the UN’s 2030 Agenda, emphasizes the need for available and sustainably managed water and sanitation for all, aiming to improve water quality, enhance accessibility for drinking, and reduce waterborne diseases [4,5,6,7,8,9]. The rapid urbanization and population growth, especially in developing regions like Ghana, pose significant threats to available water resources, necessitating efficient usage and management strategies to mitigate the impacts of human activities on water quality and availability [5,10,11,12,13].
Improved water sources, defined as those protected from pollution and contamination, are crucial for safe consumption. In contrast, unimproved sources, including unprotected wells and surface water, present health risks [7,8,9,14,15,16,17,18]. In Ghana, pollution from agricultural and mining activities has degraded water quality, making treatment more costly and driving populations toward less availability of safe water resources [11,19,20,21,22,23]. Water’s essential role in human survival was emphasized at the Mar del Plata Water Conference in 1977, stating the universal right to access quality water in sufficient quantities. Yet, challenges such as climate change-induced floods and the dwindling per capita water resource availability continue to stress Ghana’s water management efforts [11,24,25]. Ghana’s water resources are categorized into groundwater and surface water, with significant systems including the Volta, Southwestern, and Coastal River systems, highlighting the country’s diverse water sources [26,27]. The Community Water and Sanitation Agency (CWSA) oversees water and sanitation development in Ghana’s rural areas, where, as of 2018, 43.94% of the population resides with a 72% rural water coverage, despite a decrease in surface water use from 15% to 11% [28,29]. Challenges such as poor maintenance, faulty hardware, and inadequate service compromise water service quality, often leading to reliance on distant communities for water, adversely affecting Sustainable Development Goals (SDGs) implementation efforts [5,18,30,31]. Rural water facilities frequently depend on costly repairs funded by international donors or government agencies [32,33]. The focus on construction over sustainable management and maintenance, driven by immediate income rather than long-term serviceability, results in high maintenance costs and neglects the system’s aging [34].
Moreover, the prevalence of boreholes, sometimes managed by the Ghana Water Company, raises concerns due to contamination from illegal mining (galamsey) and pollution, making water unsafe for domestic use [9,11,17,32,35,36]. The unreliable availability of improved water sources drives rural residents toward potentially unsafe natural water, highlighting a trust issue in water service providers [37,38]. Notably, in Akatsi and East Gonja districts, 30 to 40% of handpumps are non-functional for over 18 days annually, causing overcrowding and delays in water access, significantly impacting residents’ ability to secure at least 20 L of water per person per day [30,39]. This scenario underscores the flawed emphasis on building water systems over maintaining them, suggesting a need for a shift toward sustainable water service provision focused on lifecycle costs and reliable access [40]. The primary aim of this research is to undertake a comprehensive analysis and assessment of the various sources and quantities/qualities of water utilized by households for drinking and other purposes. Additionally, it seeks to evaluate the accessibility, availability, affordability, and reliability of these water sources, ensuring a thorough understanding of the water service dynamics within the targeted community for sustainable water systems by delineating the roles of different water providers. This study will specifically focus on delineating the roles of different water providers, understanding community dynamics, and evaluating contributions to rural development and progress toward Sustainable Development Goal 6 (SDG 6). Therefore, this paper aims to assess the water service levels in the study area, identify non-satisfactory and non-beneficial sections, and provide recommendations for improved service delivery, aligned with community needs and SDG targets.

2. Materials and Methods

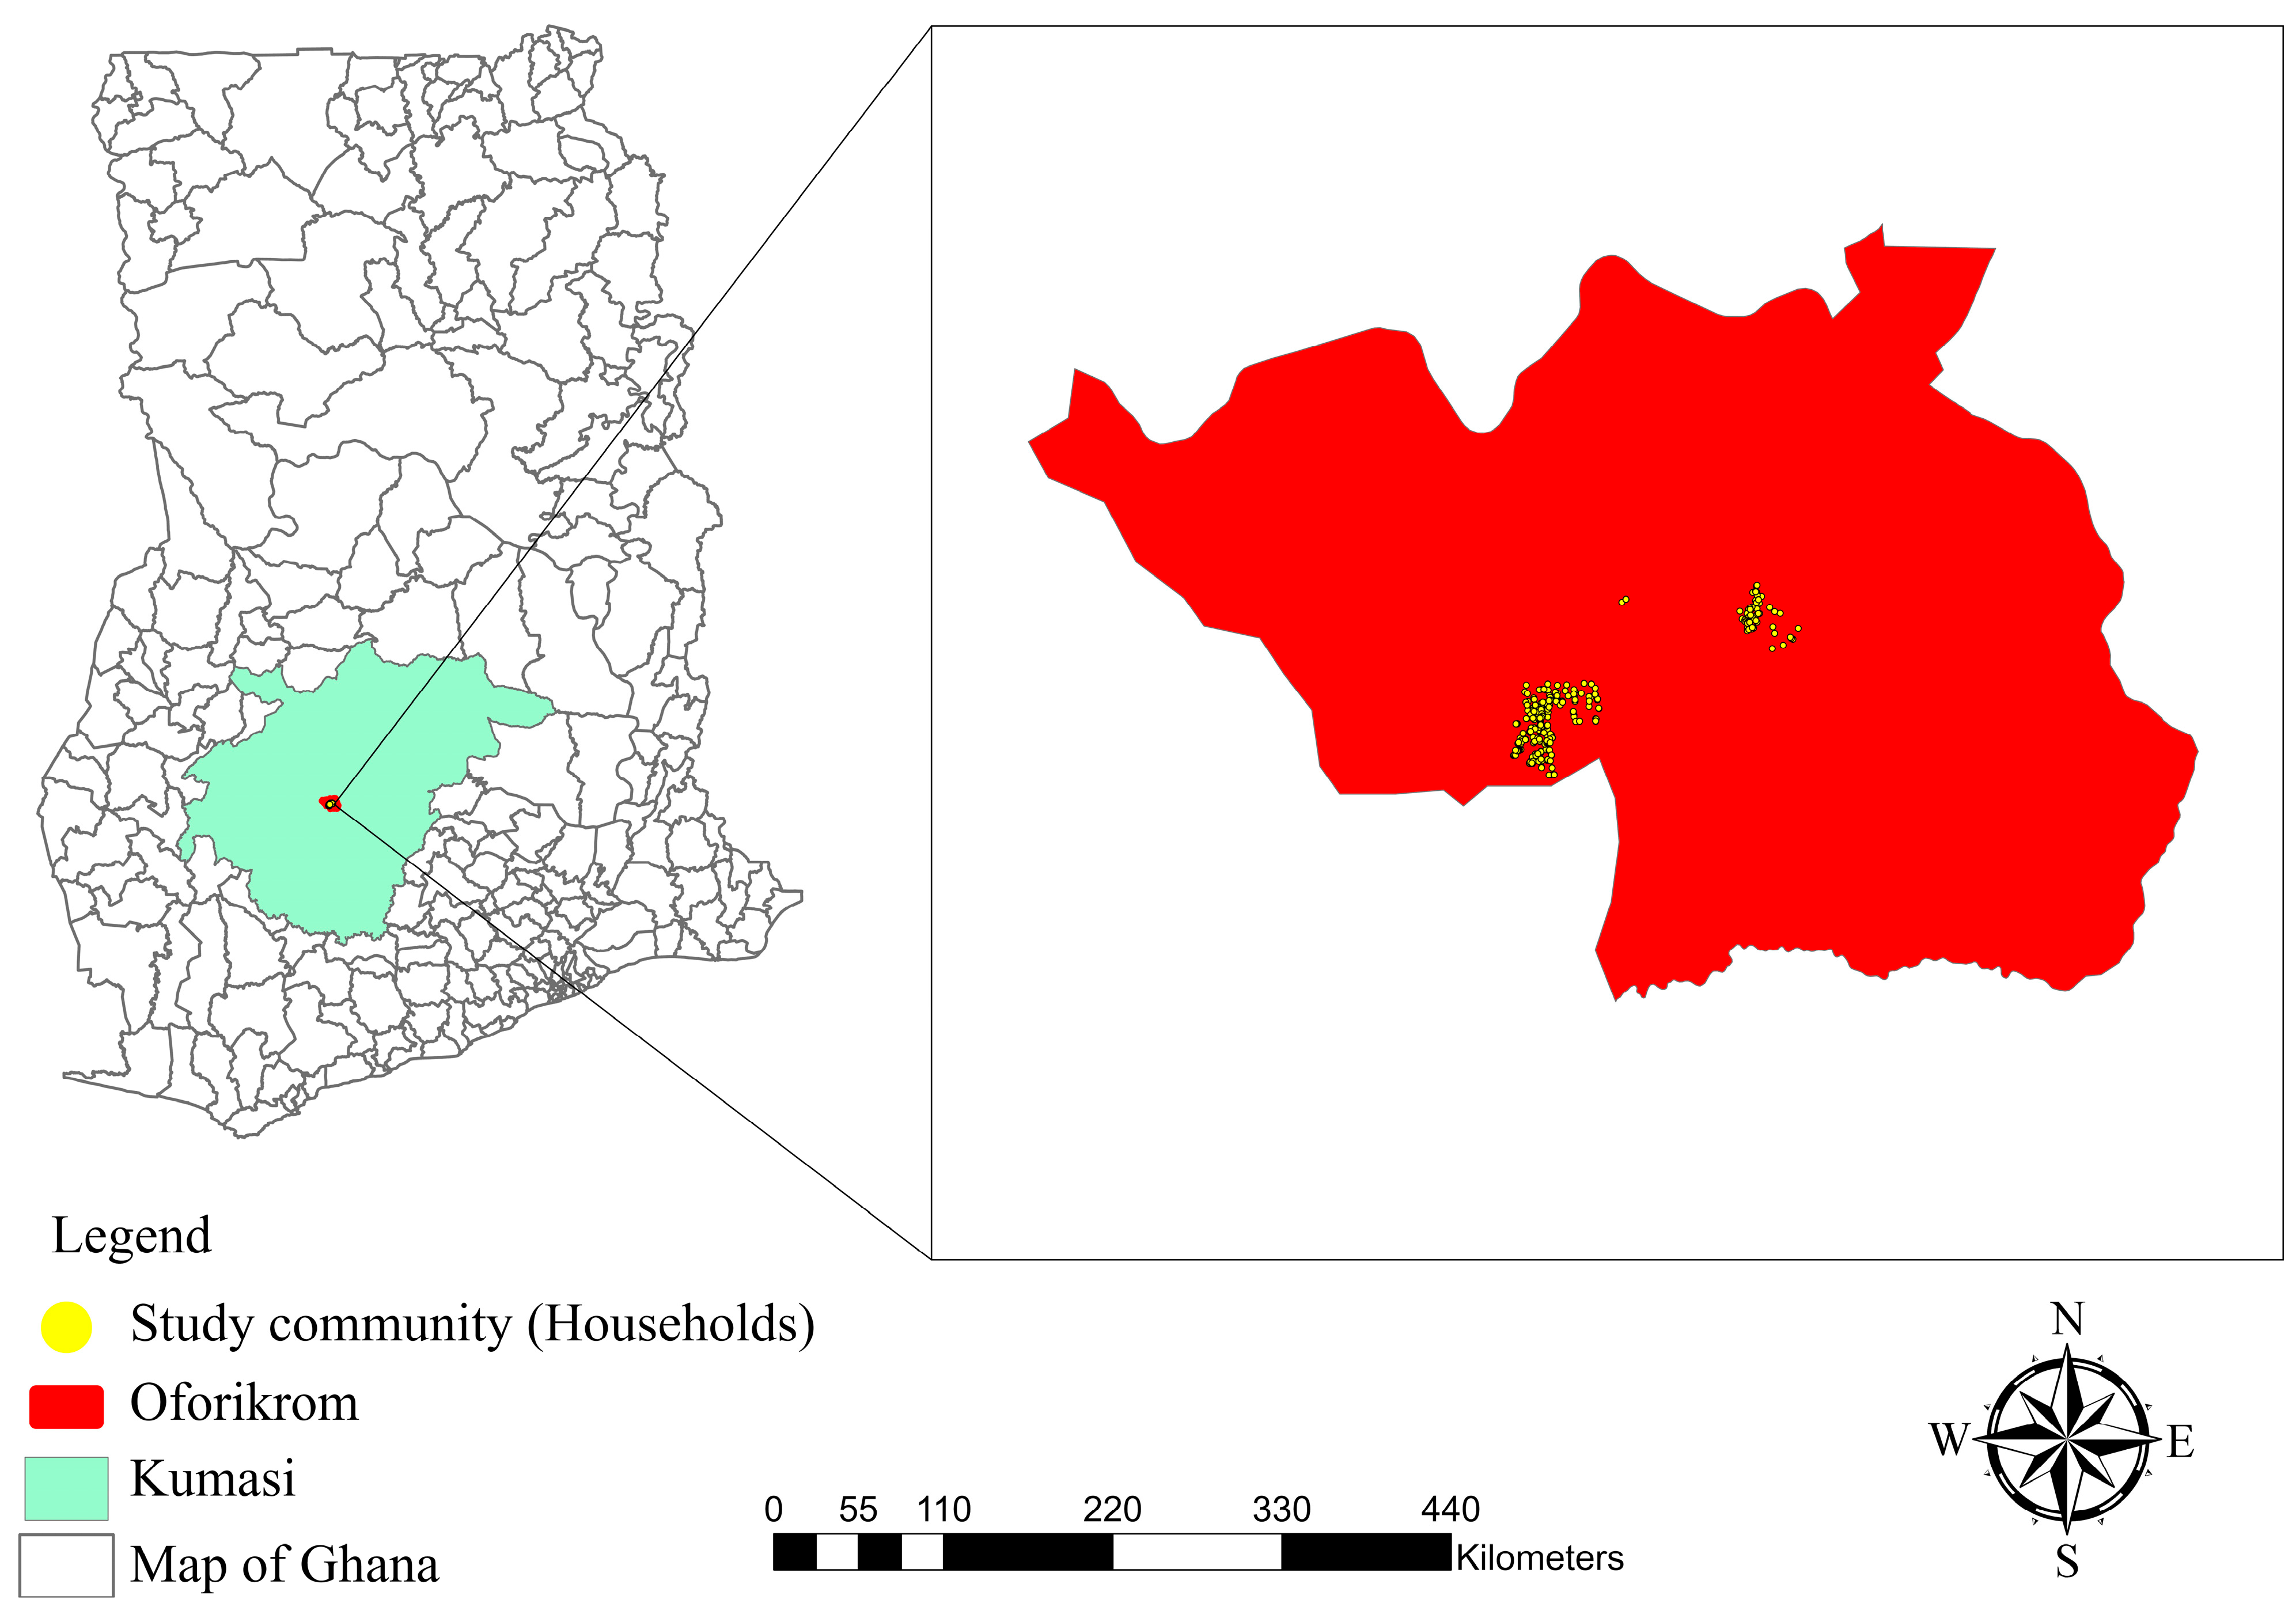
2.1. Site Description and Location

The study was conducted at Emina-Boadi, a small town in the Oforikrom Municipal Assembly in the Ashanti Region of Ghana (Figure 1) [41]. This municipality is situated between latitude 6.35° N and 6.40° S and longitude 1.30° W and 1.35° E with an elevation of 250 to 300 m above sea level [42]. The town is bordered on the north by the Kwame Nkrumah University of Science and Technology (KNUST) campus, to the west by Kotei, to the east by Kentinkrono, and to the south by Oduom. Emina-Boadi has a total area of 657.1 square kilometers, with a total population of 28,860 as of 2015, with 14,666 (50.8%) being males and 14,194 (49.2%) being females [43]. Emina-Boadi is located fifteen kilometers from the center of Kumasi, between latitude 6°40′41″ N and longitude 1°32′32″ W [44].

2.2. Data Collection

This study is based on the results of a survey we conducted among the residents of the Emina-Boadi town regarding the satisfaction level of two water service providers to meet the resident’s domestic water needs on a daily basis. The survey was conducted between 31 July 2020 to 15 August 2020. A well-structured questionnaire (see Questionnaire in Appendix A) with specific questions captured in Table 1 was used to obtain relevant data about the source of water used by the residents of the town, the quality of water received, quantity of water used by the people in a day, the frequency of flow of water in a day, the ease to which water is obtained, and the cost of water per week. Data collection was performed using smartphones running on the iPhone operating system.

2.3. Pilot Testing

Questionnaires were pre-tested to see their functionality since a new software (GIC Collect version 1.0.92) was used to generate questionnaires. GIC Collect is a phone application designed for survey-based data collection just like Kobo Collect [45]. It is compatible with Open Data Kit (ODK) forms, commonly used for mobile data collection. GIC Collect works with or without network connectivity and supports a wide range of question-and-answer types. It displays surveys as a sequence of questions that incorporate survey logic, question constraints, and repeating sub-structures. This makes it suitable for extensive field data collection in various sectors, such as research, environmental assessments, and public health monitoring. Completed surveys stored on phones were transferred over a WIFI or local mobile data network into an online database.

2.4. Sample Size

Since it was impractical to interview the entire community, the study utilized questionnaires targeting households representing a variety of socio-economic backgrounds. One of the limitations of this study was the reluctance of many residents to participate in interviews. This reluctance stemmed from a history of frequent data collection efforts in the town with little to no subsequent implementation of measures to improve their quality of life. Despite this, we were able to collect data from 100 random households representing a variety of socio-economic backgrounds through questionnaires. The socio-economic background of the initial interviewee is particularly crucial in this method, as it sets the foundation for selecting subsequent participants. The first participant was chosen based on their ability to represent a specific socio-economic group or characteristic relevant to the study as seen in Table 1. Typically, this participant is selected due to their accessibility and willingness to participate, often stemming from an existing relationship or involvement in a community where trust has been established. The initial interviewee may also be chosen to provide a diverse perspective within the socio-economic spectrum, ensuring their experiences align with the research objectives. Ultimately, the socio-economic background of the first interviewee is directly tied to the research questions, aiming to capture insights from individuals whose experiences and characteristics are pertinent to the study’s focus, as employed in this study. The full format and content of these questionnaires can be found in the Appendix A section of the paper. To effectively reach our target population, we employed a snowball sampling technique, also known as chain-referral sampling. This method was chosen due to the difficulty in directly identifying or reaching potential respondents within our study criteria. The following steps outline the procedure, as follows:
1. Initial Participants: We began by identifying a small group of initial participants who met the study’s inclusion criteria. These participants were selected through convenience sampling based on our knowledge and preliminary research.
2. Referral Process: Each initial participant was asked to refer other individuals they knew who also met the study criteria. These referred individuals were subsequently contacted and invited to participate in the study.
3. Continued Expansion: This referral process was iteratively repeated, with each new participant being asked to make further referrals. This created a snowball effect, gradually increasing our sample size as more referrals were made.
In cases where referrals were unwilling to participate or unavailable due to absenteeism, we identified alternative households within the community to ensure continuous data collection and minimize bias. The identification of these households was based on the discretion of the interviewer, who employed local knowledge and observational skills to select participants that best represented the community demographics. This approach helped maintain the integrity of our sample and ensured that our data remained comprehensive and inclusive.
To ensure a comprehensive understanding of the socioeconomic backgrounds of all participants, a detailed survey was conducted. This survey collected information on several key indicators, including household location, which provided insights into the distribution of participants across urban, peri-urban, and rural areas. These data helped assess the environmental and infrastructural factors that might influence socio-economic status. Demographic characteristics such as age, gender, family size, and composition were also gathered to understand household dynamics and economic dependency ratios, which significantly impact socioeconomic status. Information on financial status covered household income levels, employment status, and sources of income, allowing for the categorization of households into different economic brackets, such as low-income, middle-income, and high-income groups. Educational status was documented by noting the highest level of education attained by household members, which helps evaluate its impact on economic opportunities and household income. Additionally, data on household assets, including property, vehicles, and electronic devices, were collected to serve as a proxy for assessing wealth and economic stability. The survey also explored the types of water sources used by households, whether improved or unimproved, and the associated costs, providing insight into the financial burden on households and their access to essential services. By analyzing these variables, the study aimed to capture a holistic view of the socio-economic backgrounds of the participants, enabling a comprehensive analysis of how these factors influence access to resources and quality of life.

2.5. Data Analysis

The questionnaires were processed, cleaned, and validated upon downloading from GIC Collect (version 1.0.92). The questionnaires were processed, cleaned, and validated upon downloading from GIC Collect. The data were then analyzed using Microsoft Excel (version 2409) and JASP (version 0.18.3), employing statistical methods to examine the drinking water services based on the 2021 JMP (Joint Monitoring Programme) drinking water service ladder and the WASHCost water service ladder. The JMP drinking water service ladder categorizes water services based on accessibility, availability, and quality to assess the levels of service provided to populations. The WASHCost water service ladder, on the other hand, focuses on the cost and sustainability of water services, assessing the financial aspects related to maintaining and improving water service delivery.
Statistical analyses were conducted at a 95% confidence level. Relative data comparisons were made using logical formulas, and the data were further explored through descriptive analysis, charts, frequency tables, cross-tabulations, and graphs. Throughout the analysis process, all of the data used were meticulously checked for errors to ensure accuracy and reliability.

2.6. Water Service and Management

Water service involves the provision of water to individuals, distinguishing between the mechanisms of delivery (e.g., boreholes and hand pumps) and aspects of the service like quantity, quality, and reliability of water, as well as the accessibility of these facilities [46]. Assessments of water service rely on qualitative data, questioning whether the systems deliver the intended amount of water consistently, are accessible to the entire community, and meet national water quality standards for drinking purposes. Achieving these standards indicates a satisfactory water service level [46].
Water management in Ghana encompasses various systems and agencies to ensure that both rural and urban communities have access to safe and reliable water. In rural areas, the Community Water and Sanitation Agency (CWSA) oversees the implementation of borehole and handpump systems. These systems are crucial for providing potable water to remote and underserved regions. Boreholes, often equipped with handpumps, tap into underground water sources, offering a sustainable and community-managed solution. In urban areas, the Ghana Water Company Limited (GWCL) is the primary body responsible for water distribution. GWCL manages the treatment, transmission, and supply of water to households, businesses, and institutions through an extensive network of pipelines and treatment facilities. Despite these efforts, many residents still resort to bottled water due to the inconsistency in supply and water quality issues, which makes it a costly but sometimes necessary option for daily drinking needs [47]. These integrated systems aim to improve water accessibility, yet challenges remain in ensuring consistent and equitable distribution across all regions.

2.7. Service Level

This was introduced by the WHO and UNICEF’s Joint Monitoring Program (JMP) in 2008 through the “water service ladder,” which aids in categorizing the quality of water services [28,48,49]. This tool, adopted by the Community Water and Sanitation Agency (CWSA) in Ghana, helps set national guidelines for rural water supply, defining acceptable standards across two main levels: point systems and household taps Table 2 Service levels, influenced by engineering, social, and political factors, include a range of indicators from surface water to safely managed drinking water, addressing the Sustainable Development Goals (SDGs) and considering factors like crowding and facility workability over the past year [28,32,50].

2.8. Water Service Indicators

Key Performance Indicators (KPIs) are essential for assessing and benchmarking utility services, guiding continuous improvement, and aligning performance with regulatory, operational, and customer satisfaction goals [51,52]. Additionally, incorporating a framework like WASHCost as a benchmark further enhances this KPI set, particularly for water, sanitation, and hygiene (WASH) services. WASHCost, developed by IRC WASH, offers a reliable benchmark for comparing financial sustainability and affordability across regions or projects [53]. It promotes financial planning and highlights funding gaps that could undermine service quality or accessibility. Integrating WASHCost into the KPI framework thus provides utility providers and policymakers with a comprehensive perspective, linking cost benchmarks to performance areas and ensuring that investments support long-term, equitable, and sustainable service delivery [54,55]. Utilities can efficiently leverage available data, address critical performance areas, and set a foundation for robust benchmarking and continuous service improvement through these KPIs and benchmarks.
These are critical components to assessing water provision, encompassing quantity, quality, accessibility, reliability, and affordability. These dimensions are pivotal in evaluating household water service levels and directly influence access assessments. Access is further shaped by proximity to water sources and available water, offering a comprehensive approach to assessing utility services [50,56,57].
Quantity is fundamental for ensuring sufficient hydration, food preparation, and maintaining hygiene to prevent water-associated diseases. It is measured in liters per capita per day (l/c/d) Table 3, emphasizing the importance of an adequate water supply to sustain bodily functions and mitigate health risks like urinary stones, which are linked to inadequate water consumption [50,57,58]. Data for this metric are often readily available from billing records or storage facilities based on how frequently those facilities are emptied.
Quality addresses water’s chemical and microbiological purity, with contamination posing significant health risks. Enhancing water quality in rural areas is crucial for improving educational outcomes and reducing infections, emphasizing the need for clean water for child development and overall health [60,61,62,63,64]. Naturally found in water, elements like fluoride can have detrimental health effects, such as fluorosis, at high concentrations [65]. This underscores the importance of monitoring water quality, moving beyond the JMP’s improved source indicators, which primarily focus on fecal contamination protection [50,57,66,67,68]. The JMP reports an increase in water free from contamination, highlighting progress in water safety [28].
Accessibility to water involves the ease with which individuals can obtain water, considering the time and distance required for fetching it alongside any associated waiting times. In many developing countries, water collection primarily falls on women and children, with trips averaging an hour each and often necessitating multiple trips daily [50,57]. This is quantified as minutes per capita per day (m/c/d). The significant time spent on water collection can detrimentally impact school attendance and punctuality among children. Additionally, the physical strain of carrying water over long distances can lead to musculoskeletal disorders. The WHO and UNICEF JMP reports of 2021 show increased accessibility of safely managed water in rural Ghana from 11% to 16% [28]. However, challenges remain, including spillage during transportation and potential contamination, underscoring the need for improvements in water collection and storage practices [50]. This metric highlights service equity and areas needing infrastructure expansion.
Reliability in water service refers to the consistency and predictability of access to water, typically aiming for a service to be fully functional 95% of the time. This includes minimal unplanned interruptions and a regular supply that does not necessarily mean 24/7 access but should be predictable [50,57]. Utilities commonly track downtime, providing accessible data for evaluating service resilience and informing maintenance strategies.
The design of distribution networks plays a crucial role in ensuring reliable water delivery. [50] classify reliability into four categories: year-round service, year-round with frequent interruptions, seasonal variation, and daily or seasonal discontinuity. Studies in Ghanaian districts [69] revealed varying levels of functionality and reliability among hand pumps and piped systems Table 4, highlighting the need for diverse water sources to mitigate service failures [57,70,71].
Affordability concerns the economic aspect of water service, defined by the WHO as the household’s expenditure on water services relative to its income [72]. This factor is critical in providing water, sanitation, and hygiene (WASH) services, especially in rural areas where budget constraints can limit access to water at home. The cost of water services encompasses several components, including construction, operation, and maintenance, as well as direct and indirect support costs. Households’ willingness to pay is influenced by various factors such as water quality, convenience, acceptability, and the reliability of the service [72,73].

3. Results and Discussions

3.1. Demographic Characteristics

This includes age, gender, occupation, and the educational status of the respondents under research.

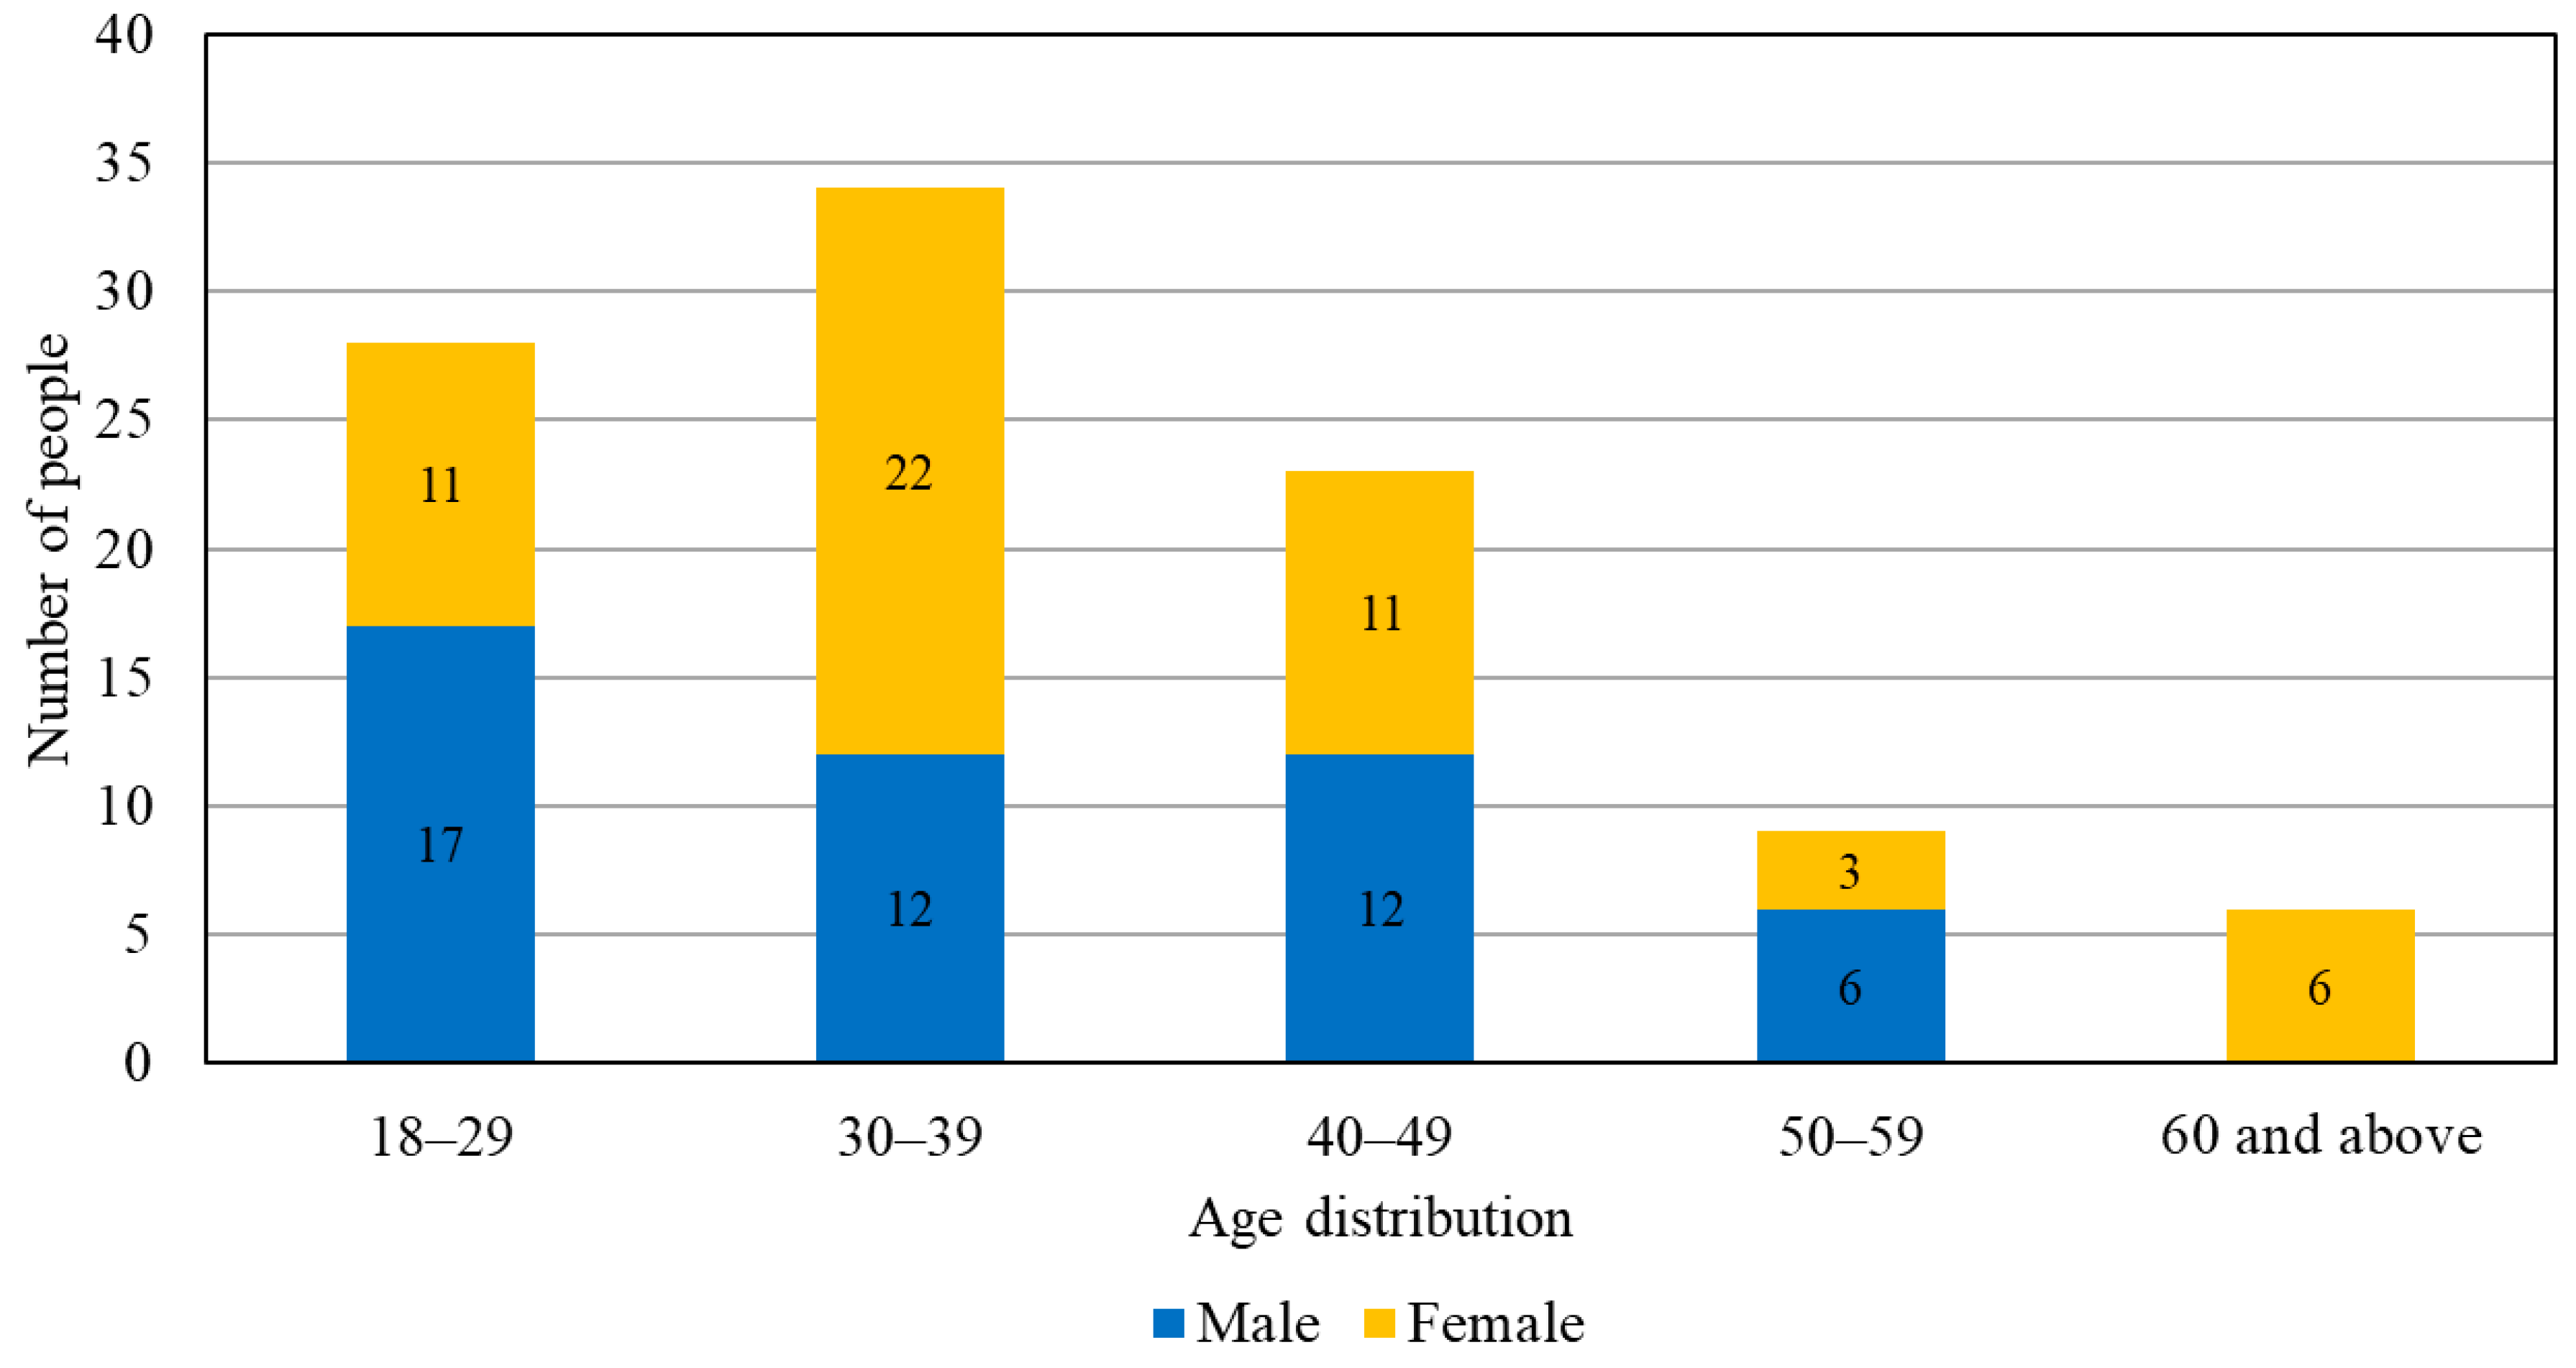
3.1.1. Age and Gender

The data gathered from a survey of 100 respondents reveal a gender distribution of 58% females and 42% males, with males representing the lesser percentage (Figure 2). Additionally, the respondents spanned various age groups, all aged 18 and above. The most prevalent age bracket was 30 to 39 years, accounting for 33% of the total, while those aged 60 and above comprised the smallest group at just 6%. In the dominant 30 to 39 age group, 22 females were recorded.
Among the males, the highest concentration was in the 18 to 29 age bracket, with 17 individuals, whereas no males were recorded in the age groups 60 and above. It is important to note that this absence does not imply the non-existence of males over 60 in the community; instead, it reflects the survey’s coverage during data collection. From this data, we can confidently conclude that the town has a higher female population, mainly in the 30 to 39 age group.

3.1.2. Level of Education
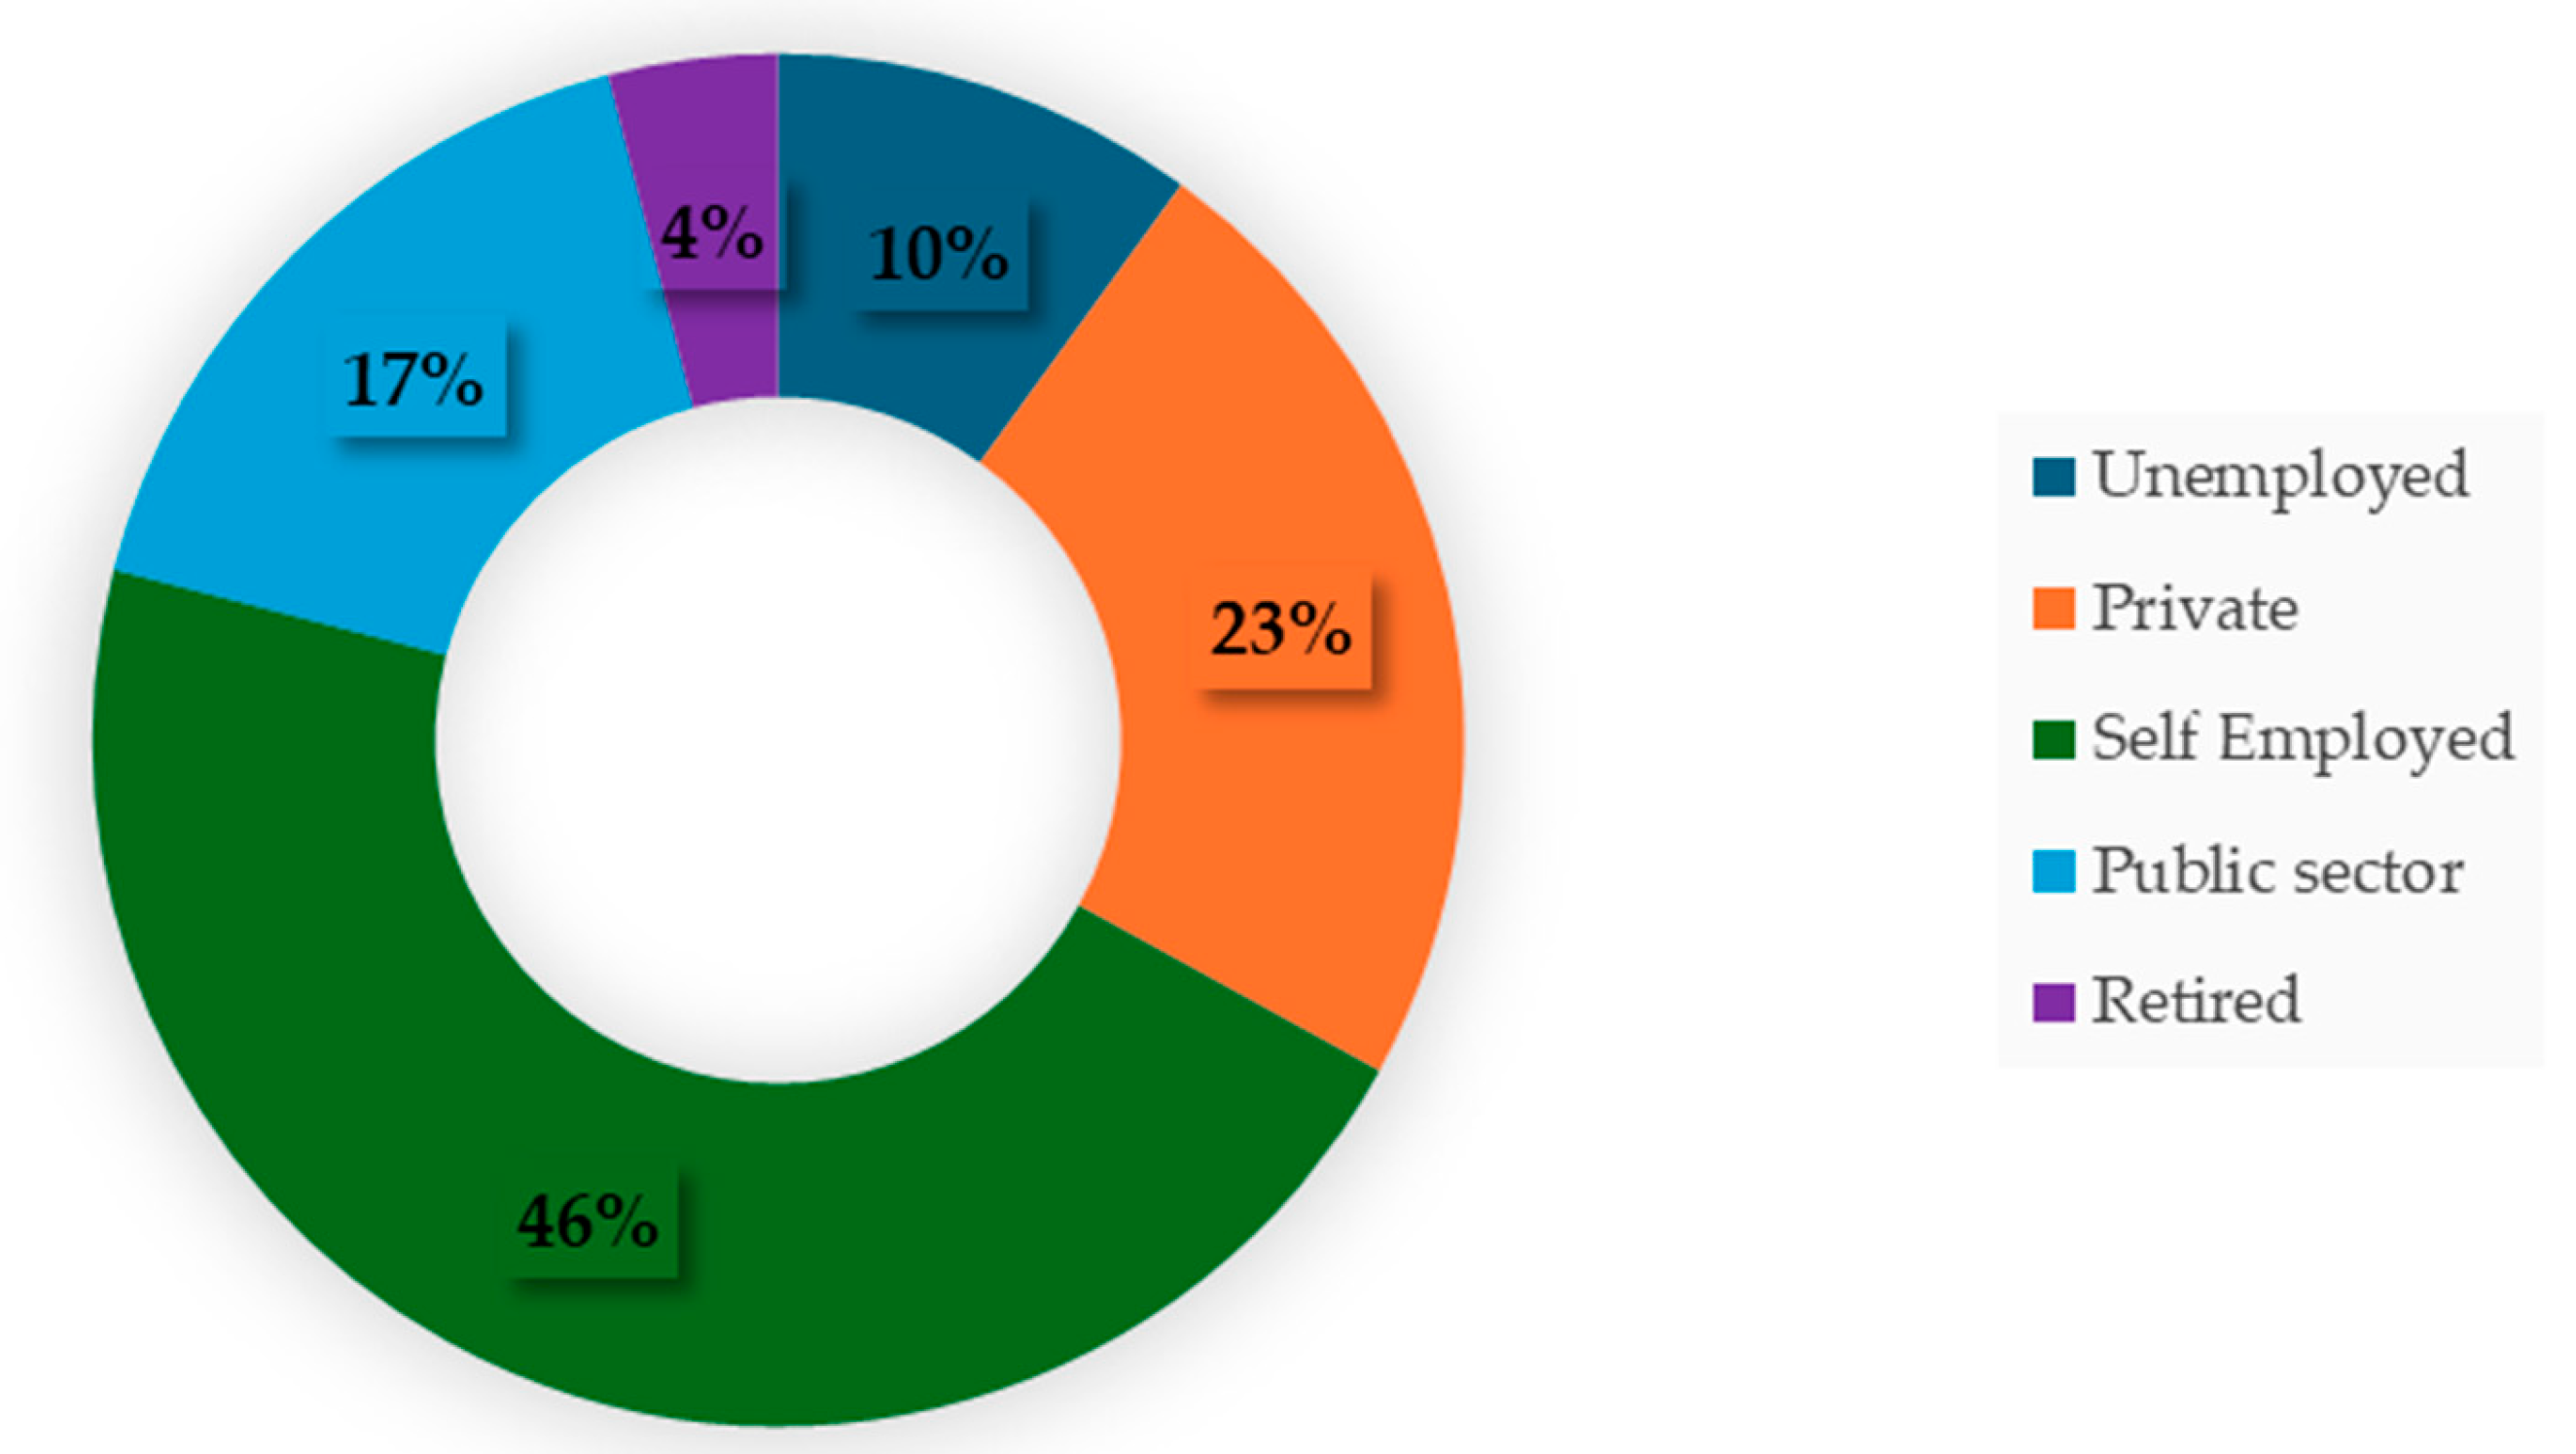
The educational status of the people of Emina-Boadi was categorized from elementary to tertiary. Overall, 37% of the people attended tertiary institutions, the highest percentage among the categories. Overall, 34% of the people attended Junior High School/Middle School, Senior High School had a percentage of 25, and the last was Primary/Elementary school with 4%.

3.1.3. Occupation

The occupation of the people in the town was categorized in the questionnaires as follows:
Self-employed—Business owned by an individual, usually a trader, farmer, etc.;
Public Sector—A person working in any government institution or organization. For example, teachers, ministers, doctors, etc.;
Private Sector—A person working in a private corporation or firm. For example, lawyer, architect, etc.;
Unemployed—A person without a paid job but who is available to work;
Retired—A person who ceases to work above the age of 60.
The data gathered showed that the highest distribution consisted of 46% self-employed followed by private workers at 23%, public sector at 17%, unemployed at 10%, and lastly retired with a percentage of 4 (Figure 3). Most people in the town were traders who owned shops, farmers, hostels, house owners, hairdressers, and barbers.
Although the tertiary group has the highest percentage, some people within that level of education are unemployed, work in either the private or public sector, retired, or self-employed. Since a degree or Higher National Diploma (HND) is a requirement to gain professional employment in Ghana, it can be noticed in Table 5 that the highest number of people contributing to a particular occupation (Self-employed) was 19 each from people of Junior High School/Middle School and Senior High School educational background, resulting in the self-employed group having the greatest percentage.

3.1.4. Household Size and Income

The questionnaire included queries about household size and income to obtain each household’s water usage and the affordability of that water relative to their income. The analysis revealed household sizes ranging from 1 to 12 members, with sizes 4 and 5 being the most prevalent, with each representing 25% of the population. The smallest group sizes—9, 11, and 12—each accounted for only 1% of the total. The average monthly income for a household was GHS 2127.00. Despite the high number of self-employed individuals, those employed in the public and private sectors who had tertiary education earned a higher average income. This resulted in a higher overall average monthly income for the town.

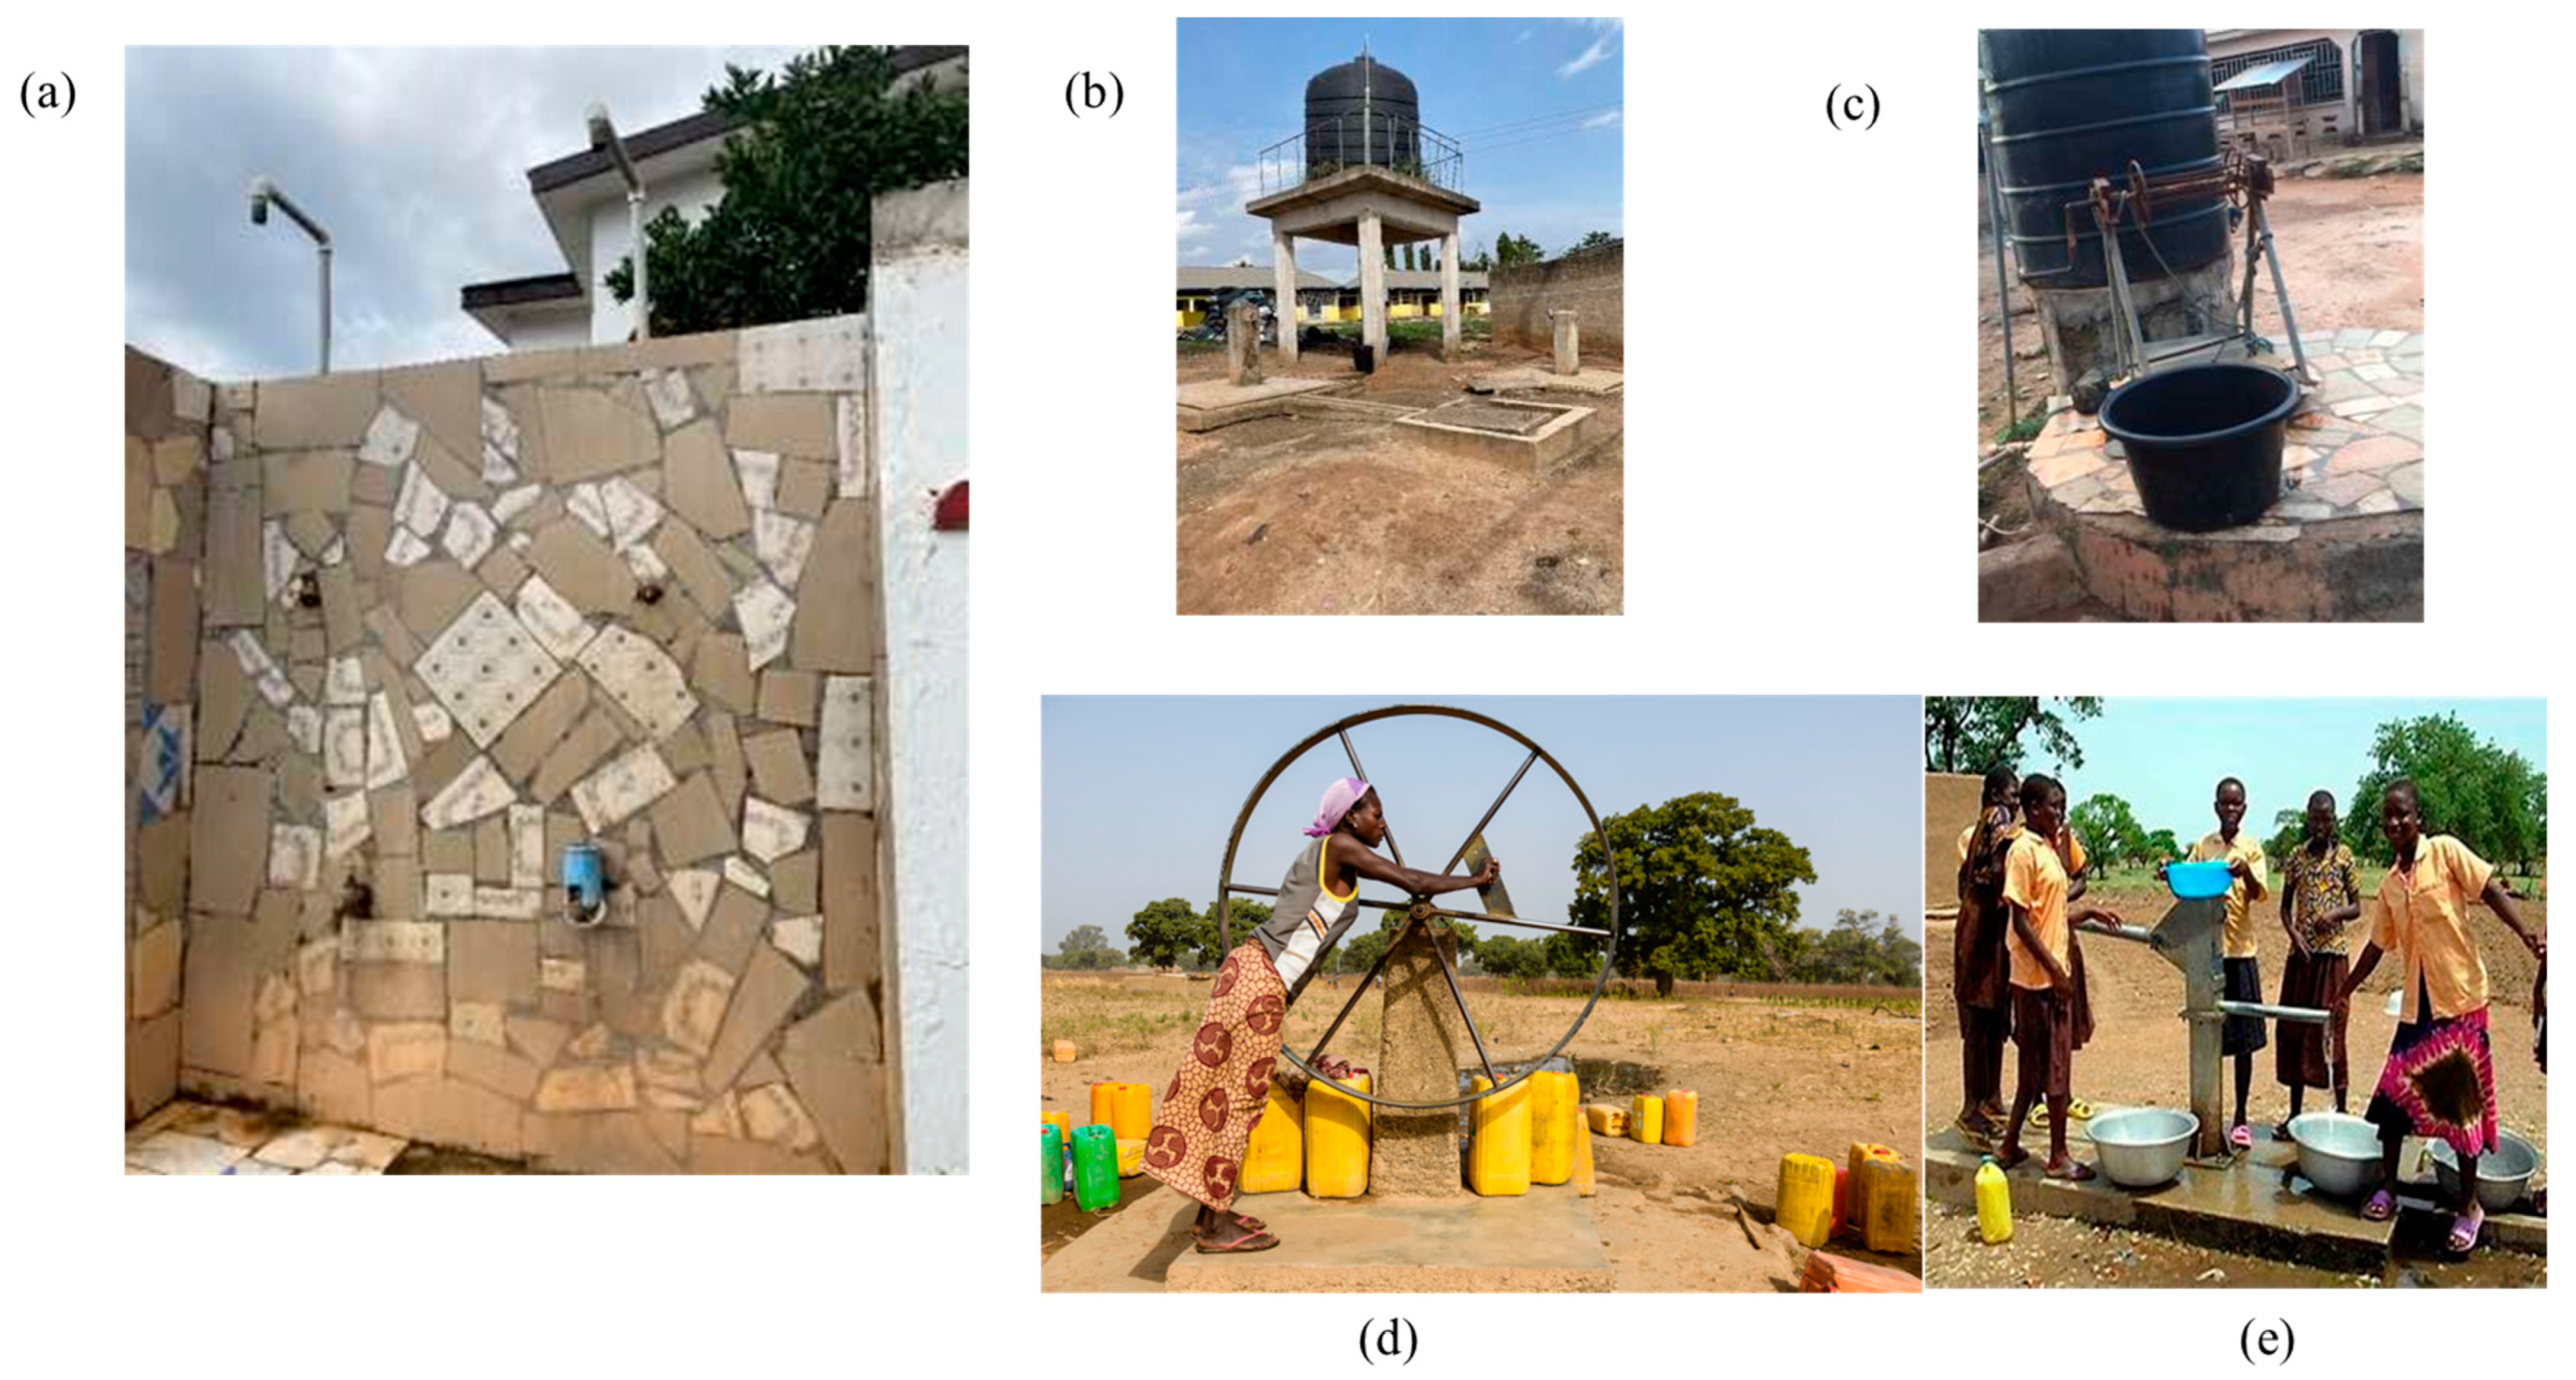
3.2. Source of Water

The survey distinguished between drinking water sources and those for other household needs, categorizing all identified sources as improved per the 2021 JMP report. These included the following (Figure 4):
Bottled/sachet water;
Borehole/hand pump;
Rainwater;
Piped water to the dwelling;
Piped water to compound/yard;
Protected dug well;
Public tap or standpipe.
For drinking, bottled or sachet water was the primary choice for 78% of participants, followed by boreholes or hand pumps (9%), public taps or standpipes (7%), piped water to dwellings (3%), piped water to yards/compounds (2%), and rainwater (1%), with the elderly favoring rainwater for its perceived purity and taste as being a divine gift. Preferences for bottled water often stem from convenience, perceived purity, and better taste, as noted in a study by Gleick, P.H. cited by Hu et al. [74]. The socio-economic status as well as the type of water systems available to the consumer affect the consumer’s decision to choose bottled water [74].
For other household uses, boreholes or hand pumps were the most common source (53%), followed by piped water to dwellings and public taps or standpipes (18% each), piped water to yards/compounds (6%), and protected dug wells (5%). Households with piped connections often installed boreholes with tanks, preferring them over the less reliable Ghana Water Company Limited (GWCL) supply.

3.3. Quality of Water

Residents in the town have expressed concerns regarding the water quality supplied by the Ghana Water Company Limited (GWCL) to public taps and standpipes. Complaints primarily focus on the taste, presence of impurities, and foul odors. In response to a survey about water quality, 8% of residents rated it as “somehow” satisfactory, leaving a majority of 92% generally satisfied. Common resident water treatment methods include allowing water to settle, straining through cloths, and boiling. The town relies mainly on three borehole/hand pump sources, serving 53% of the population, with all installations meeting Community Water and Sanitation Agency (CWSA) standards and biannual quality tests at the KNUST laboratory. Filters are installed on reservoirs to block particle entry.
Comparatively, a study in three Ghanaian districts—Bongo, Gushiegu, and Wa West—found 33% average satisfaction due to high fluoride levels, affecting taste [46,57], while a separate survey in Mali showed that 65% of households treat their domestic wells with bleach annually. Despite this, 55% of households prefer not to use nearby improved water sources even when they are free and accessible [75]. A survey conducted in Vitória, Espírito Santo, Brazil, found that 75% of respondents rated public water quality as excellent, particularly when compared to surface water. However, some individuals reported issues with the water, citing problems with taste, color, previous health concerns, and the presence of suspended materials [76]. Similar to the respondents in Emina-Boadi, those in Vitória also experienced issues with water quality regarding taste and suspended particles [76].
Further analysis in the Ghanaian districts of Akatsi, East Gonja, and Sunyani West showed a surprising 92% satisfaction with water quality [70], credited to adherence to CWSA standards and lower fluoride levels in groundwater.
Emina-Boadi, being a peri-urban area, benefits from better basic amenities provided by service providers. The area around Kumasi, including Emina-Boadi, typically exhibits lower fluoride concentrations, leading to higher acceptance of water quality and an intermediate service level on the WASHCost water service ladder [34].

3.4. Accessibility

The average time it took respondents to fetch water, including time spent waiting due to crowding, was 7 min. This duration varied among respondents depending on the proximity of their households to water sources, with times ranging from a minimum of 1 min to a maximum of 20 min. This indicates that each respondent was able to obtain water in under 30 min. It is important to note that individuals with piped water connected directly to their homes were not included in this average time calculation. In a study conducted in Wa East, 50% of respondents reported spending less than 10 min fetching water. This was in contrast to 36% in Bongo and just 14% in Gushiegu [77]. Despite these variations, the study concluded that accessibility to safe water sources remains a major issue, as some individuals still had to spend up to an hour fetching water.
To address overcrowding at water points and reduce the time it takes to collect water, service providers have implemented measures such as installing multiple taps and ensuring high water pressure. These improvements have helped decrease the time needed to fill a container, enhancing overall access to water by minimizing wait times at water points.
According to the JMP service ladder, drinking water that is piped directly to dwellings can be classified as “safely managed” because it is available on the premises. Meanwhile, water sources such as borehole/hand pipes, public taps/standpipes, and piped water to yards/compounds can be classified as “basic,” as the collection time from these sources is less than 30 min. Furthermore, when categorizing sources of water for other purposes, all can be classified as providing a “high service level” according to the WASHCost water service ladder, since fetching water from these sources takes less than 10 min per round trip.

3.5. Quantity

An adequate quantity of water is essential to prevent dehydration, with a basic requirement for drinking, cooking, bathing, and sanitation suggested by [59] as 50 L per person per day. The average quantity of water used by an individual per day in a household was found to be 60.75 L, which qualifies as a high service level in terms of quantity according to the WASHCost water service ladder. The minimum daily usage was 43 L per person in a household of size 12, while the maximum was 110 L per person in a household of size 11.
The household of size 11 consisted of 7 females and 4 males, with 4 female and 1 male children. This household practiced Islam, which partly explains the higher water usage as each member is required to pray five times a day. Additionally, it was noted that children tend to use more water, particularly during bathing. The females in the household were required to bathe twice daily and to wash clothes periodically. The respondents also mentioned that during hot weather, they consume more water to stay hydrated, even if they would prefer not to, and they tend to drink less during cooler days. According to the WASHCost water service ladder, the water quantities used by households of sizes 1, 2, 4, and 11 are categorized as high service level, while those of sizes 3, 5, 6, 7, 8, 9, 10, and 12 are categorized as intermediate service level.
Analysis of the data allows us to classify the health concerns of all household sizes. Households ranging from size 1 to 10 and size 12 fall within the medium level of health concern. In scenarios requiring enhanced hygiene, such as during an outbreak of an infectious disease, the availability of water for these households cannot be guaranteed. Conversely, a household of size 11 ensures a reliable provision of water in all situations, indicating a low level of health concern.
Data analyzed from three districts in Ghana—Akatsi, East Gonja, and Sunyani West—showed that 55% of people used at least 20 L per person per day. However, this study achieved 100% of people using at least 20 L per person per day. This discrepancy is likely because fewer water facilities were available in parts of these districts, increasing the likelihood of individuals receiving less than 20 L per day due to overcrowding at water sources. Overall, the study found that users were generally dissatisfied with the quantity of water they received [78]. Kumasi et al. conducted a study to evaluate rural water user satisfaction with the level of service provided by water systems in the northern region of Ghana, specifically in the districts of Bongo, Gushiegu, and Wa East. The study revealed that a significant number of water users did not have access to the minimum quantity of water needed. In Gushiegu, only 58% of the population had access to the minimum quantity, while in Wa East, this figure was even lower at 45% [77]. In a separate study by Peter Magara, data were collected from users to assess their satisfaction with the level of service received, focusing on factors such as quantity, reliability, and convenience/distance. The study also evaluated the performance of service providers and authorities. It was conducted across eight districts in northern and mid-western Uganda. The findings showed that the average quantity of water collected per person ranged from 10.2 to 19.2 L per person per day (lppd), and only one-third of the total sample (comprising 124 user groups) accessed the minimum quantity of 20 lppd. Despite this, the study concluded that users were generally satisfied with the quantity of water they accessed, even though it did not meet the minimum requirements. This paradox was particularly evident in areas with surface water sources, where satisfaction with water quantity was higher than actual access levels. The study also found that while 72% to 82% of users had access to safe water, many preferred to rely on surface water for activities such as laundry and other domestic uses, reserving improved sources for drinking, cooking, and other essential purposes [79]. In contrast, Emina-Boadi featured several water points with multiple taps to alleviate crowding, demonstrating that easier access to water typically results in increased usage.
Children lose water at a faster rate than adults, approximately 15% to 4% [80], due to their higher rate of water turnover, a higher surface area to body mass ratio, and a less effective sweating mechanism [80]. Additionally, lactating women require more water to compensate for losses during milk production, and pregnant women need additional water to support the expansion of extracellular space and amniotic fluid, as well as to meet fetal needs [59]. The presence of many children and lactating women in households contributes to the increased quantity of water used, resulting in 100% of people using at least 20 L per person per day.

3.6. Affordability

Water tariffs, set by both private and public water point vendors, are determined based on the volume of water supplied, following a “pay as you fetch” (PAYF) system endorsed by CWSA [81]. These tariffs vary depending on the vendor, the water source, the collection method, and the location. For instance, the PAYF tariff ranges from GHS 10–20 pesewas for a bucket holding less than 20 L to GHS 50 pesewas for a 20-L bucket. Larger quantities such as a 200-L drum cost GHS 5.00 and a 500-L drum costs GHS 8.00. The price of the sachet water varies between GHS 2.50 and GHS 4.00, depending on the brand, while a box of 500 mL Voltic bottled water, commonly used by respondents, is priced at GHS 26.00. The 20-L bucket is the most commonly used container due to its affordability, as reported by the respondents.
On average, households spend GHS 22.00 per week on water for drinking and other household uses. About 79% of respondents were either satisfied or very satisfied with the water prices, whereas 21% expressed feelings ranging from neutral to dissatisfaction (Figure 5). The dissatisfied group criticized the high prices given the poor quality of service; some mentioned that since they lacked the funds to install private facilities, they had to accept the high costs, while others felt powerless to change the situation despite finding the prices exorbitant. The majority of complaints originated from those receiving their water supply from GWCL, whether directly to their dwelling or through public taps and standpipes.

3.7. Reliability

Seventeen percent of respondents reported issues with the reliability of their water service. All users who received water from the Ghana Water Company Limited (GWCL), whether through home connections or public taps, experienced these reliability issues. The town’s water supply comes from either GWCL or drilled boreholes with pumps. A significant majority, 83% of respondents, preferred borehole services over GWCL, citing the consistent and uninterrupted water supply from boreholes. In contrast, GWCL services were viewed as unreliable due to irregular water flow and poor water quality. Additionally, some users noted high GWCL bills despite the inconsistent service, further contributing to the preference for boreholes. One borehole operated with a hand pump, which, although more labor-intensive, offered cheaper tariffs compared to those for taps with an open and closed valve. The data from the questionnaires highlight a clear preference among most residents of Emina-Boadi for borehole services over GWCL. This preference is consistent with findings from other studies. Research conducted in three rural districts in Ghana—Akatsi, East Gonja, and Sunyani West—revealed that standpipes and household connections linked to GWCL were considered unreliable, with service levels often falling below the basic standard of 20 L per capita per day [70]. The overall reliability score from this study was 83%, representing an intermediate service level according to the WASHCost water service ladder, while these districts recorded a 66% reliability rate for borehole and hand pump services, primarily due to the presence of a low water table [70].
Similarly, a survey conducted by Valadares et al. in Vitória, Espírito Santo, Brazil, found that user perceptions of service reliability varied across regions. In their study, 19 out of 30 respondents reported rarely facing issues with water shortages, and service providers announced any potential shortages in advance. However, four individuals did complain about water shortages, especially during weekends [76]. These studies collectively suggest that the reliability of water services significantly affects user satisfaction and preference. A consistent reliable water supply is highly valued, and where service providers fail to meet these expectations, users are likely to seek alternative sources that offer better reliability, even if these alternatives come with different challenges or require more effort.
Overall, 86% of the respondents reported receiving a continuous 24-h flow of water, while 8% experienced irregular water supply. About 3% of the residents noted water availability for 6–8 h each day, and the remaining 3% were unsure about the timing of water flow due to their reliance on reservoirs. The highest level of satisfaction, “very satisfied,” was reported by 78% of the respondents who had a 24-h water flow and 2% who had water for 6–8 h each day. Among those who reported satisfaction, 3% had a 24-h water flow, 2% experienced irregular flow, 1% had access to water for 6–8 h, and 3% were unsure of the water flow timings.
Respondents with a 24-h flow making up 5% and those with irregular service accounting for 4% were categorized as neutral, indicating they felt they had no control over the water flow and had no alternative water sources. A small percentage (2%) expressed dissatisfaction due to the irregularity of the water flow. From the data presented, 89% of the respondents were at least satisfied with the availability and flow of water (Figure 6).

3.8. Relationship Between Quantity, Accessibility, Affordability, Health, and Hygiene

There is a significant relationship between quantity, accessibility, affordability, health, and hygiene in water usage. The importance of these factors with respect to water has been highlighted in previous discussions.
A study conducted by [82] in two rural villages in Mozambique investigated quantity and accessibility. One village had a standpipe with an average collection time of 10 min per round trip, while the other had a collection time of 5 h due to the source being further away. The average quantity of water used per person per day was 12.30 L in the first village and only 3.24 L in the second, where additional water was used mainly for hygienic purposes [59]. Another study in Jinja, Uganda [83], found an average water usage of 155 L per person per day when water was piped directly to dwellings and 50 L when piped to the yard [59].
Ref. [59] conducted research in Uganda, Kenya, and Tanzania focusing on quantity, hygiene, and health. They found an average water usage of 7.3 L per person for bathing and 6.6 L for washing dishes and clothes in households where the water source was located outside the premises. For households with water piped directly to the dwelling, the average was 17.4 L for bathing and 16.3 L for dishwashing and laundry.
Empirical studies show that demand decreases as the price of water increases, yet several studies in industrialized countries have shown that the percentage change in water use is smaller than the corresponding percentage change in price [59]. A study in Khartoum, Sudan, by [82], found no significant decrease in water quantity purchased relative to cost. They suggested that sacrifices are made in food budgets when a higher proportion of household income is spent on water procurement in poorer communities, which contributes to undernutrition [59]. Other studies found a low correlation between income and water usage, with coefficients recorded at 0.15 in Nairobi, Kenya [84], 0.23 in Dakar, Senegal [85], and 0.22 across three cities in Sri Lanka [86].
Studies examining the effects of water accessibility and affordability on household water use concluded that cost has a minimal impact on the quantity of water used. However, the farther the source, the less water is used, leading to less hygienic practices and increased health risks. According to the research findings, although the maximum quantity of water (110 L per person per day) was used by a household of size 11 with the third highest monthly income (GHS 2000.00), the least quantity (43 L per person per day) and lowest income (GHS 500.00) were recorded in the household of size 12.
Regarding quantity and accessibility, it was noted that households with water piped directly to dwellings used significantly more water (110 L per person per day) compared to those where individuals had to fetch water (43 L per person per day), despite an average collection time of 7 min. This suggests that the correlation between affordability and quantity is quite low, with a coefficient of 0.33. Moreover, having water facilities directly piped to dwellings (increased accessibility) enhances water usage by residents, leading to more effective hygienic practices and a reduction in health risks.

3.9. Enhancing Water Distribution Systems in Emina-Boadi: Practical and Community-Focused Policy Recommendations

To improve water distribution systems in Emina-Boadi, several policy recommendations are essential to ensure that both the Ghana Water Company Limited (GWCL) and borehole services can effectively meet the community’s needs. Firstly, enhancing GWCL reliability requires substantial investment in infrastructure upgrades and proactive maintenance schedules to prevent service disruptions. A robust communication strategy should also be developed to inform residents in advance about maintenance activities, allowing them to store water adequately. For borehole services, regular testing and treatment of water sources should be mandated at least every three months to ensure quality and safety [87]. Public awareness campaigns can educate residents on water conservation and the importance of regular system maintenance. Engaging community leaders in water management decisions ensures that policies reflect residents’ needs. Additionally, guidelines to regulate borehole service pricing are necessary to ensure affordability and prevent exploitation. An integrated water management approach is crucial, encouraging the use of diversified water sources, such as rainwater harvesting and protected wells, to ensure continuous water availability. Additionally, introducing subsidies and flexible payment systems for low-income households will improve affordability and accessibility. By strengthening the regulatory framework to enforce standards for water quality, pricing, and service delivery, coupled with a robust monitoring and evaluation system, it will ensure compliance and track performance. These comprehensive policies will enhance the reliability and quality of water services, contributing to the progress of the water sector in Ghana and benefiting both urban and rural communities.

4. Future Direction

The limitations of this study include the reluctance of many residents to participate in interviews. This reluctance stemmed from a history of frequent data collection efforts in the town with little to no subsequent implementation of measures to improve their quality of life. Another limitation encountered during the administering of questionnaires is the potential for recall bias and social desirability bias among pooled respondents. Recall bias may arise as participants might not accurately remember past events or experiences, leading to incorrect or incomplete responses. This issue is particularly pertinent when the time elapsed since the event is considerable or when the event holds varying degrees of significance to different respondents. Additionally, social desirability bias is a concern, as respondents might answer questions in a manner they believe will be viewed favorably by others, resulting in over-reporting of socially desirable behaviors and under-reporting of undesirable ones. These biases can skew the data, potentially affecting the validity and reliability of the study’s findings. To mitigate potential recall and social desirability biases among respondents, this study employed several strategies. These included reducing the recall period to improve memory accuracy, using neutrally worded questions to prevent suggesting a “right” or “wrong” answer, and clearly assuring participants of the confidentiality and privacy of their responses. Efforts were also made to create a non-judgmental and trusting atmosphere during interviews and surveys. Despite these measures, future research could benefit from additional methods to further minimize these biases.
Encouraging participants to maintain daily or weekly logs or diaries could be feasible if the study location is predetermined and households are contacted in advance. Providing specific cues or prompts to aid memory recall and using indirect questioning techniques, such as the randomized response technique or list experiments, are also recommended. Cross-verifying self-reported data with external records or objective sources and incorporating validity scales or checks within the survey can further enhance the accuracy and reliability of the findings. By integrating these additional strategies into the research design, future studies can more effectively reduce the impact of recall and social desirability biases. Further research is needed to explore the socio-economic impacts of these water source shifts, including how different demographic groups within the community are affected by water service changes. Understanding these dynamics can help in developing more equitable water management strategies that ensure all residents have access to safe, affordable, and reliable water. Additionally, investigating the long-term sustainability of borehole use, especially in terms of groundwater depletion and environmental impacts, will be vital for crafting policies that balance immediate water needs with the preservation of resources for future generations.

5. Conclusions

Residents of Emina-Boadi have expressed dissatisfaction with the poor service supply received from GWCL. Based on the study’s findings, it is evident that the reliability and affordability of borehole services have led to a significant shift in water source preference in Emina-Boadi. This shift underscores the community’s proactive approach to securing reliable water despite the shortcomings of GWCL services. The results show that the community values consistent access to water, even if it requires using multiple sources, to ensure their daily needs are met without interruption. This adaptability highlights the critical need for reliable water services as a foundational element for community well-being and development. To enhance water security, it is crucial to maintain diverse water sources and ensure regular water quality monitoring, particularly for borehole services that the majority of residents depend on. Testing and treatment should be conducted at least every three months to safeguard against potential health risks, given the high reliance on these sources. This approach would not only protect public health but also build trust in the safety of local water supplies, thereby encouraging the continued use of improved water sources.
Improving GWCL’s reliability could increase overall water coverage, supporting Ghana’s broader goals for water access and contributing to sustainable development objectives. It is essential for GWCL to address its service delivery issues by investing in infrastructure upgrades, adopting more transparent communication strategies with residents, and implementing efficient maintenance practices. By doing so, GWCL can enhance its reputation and become a more reliable water source option for the community, reducing the dependency on boreholes and diversifying water access points. Finally, there should also be increased public engagement, participatory planning, and monitoring to ensure the effective implementation and sustainability of water projects such that revenue collected from users as a fee could potentially be sufficient to cover the operation and maintenance costs without waiting on funds from the government. The findings also suggest that the water sector in Ghana is making progress toward achieving its goals in both urban and rural communities.

Author Contributions

Conceptualization, E.P.M., E.A.-E. and R.S.K.; methodology, E.P.M.; validation, E.P.M., E.A.-E. and R.S.K.; investigation, E.P.M.; data curation, E.P.M.; writing—original draft preparation, E.P.M.; writing—review and editing, E.P.M., E.A.-E. and R.S.K.; visualization, E.P.M.; supervision, E.A.-E. and R.S.K.; project administration, R.S.K.; funding acquisition, R.S.K. All authors have read and agreed to the published version of the manuscript.

Funding

This research received no external funding.

Informed Consent Statement

Informed consent was obtained from all subjects involved in the study.

Data Availability Statement

The data presented in this study are available on request from the corresponding author. The data are not publicly available due to the privacy of participating respondents.

Acknowledgments

This paper was written for a course, “ABE 585X—Biosystems for Sustainable Development”, at Iowa State University.

Conflicts of Interest

The authors declare no conflicts of interest.

Appendix A

Questionnaire
1.
Age of respondent
2.
Gender of respondent   Water 16 03193 i001  Water 16 03193 i002
3.
Occupation of respondent
  • ■ Self Employed ■ Public Sector ■ Private ■ Retired ■ Unemployed
4.
Level of education
  • ■ Primary/Basic ■ JHS/JSS/Middle School ■ SHS/SSS ■ Tertiary
5.
Household size        Water 16 03193 i003
6.
Household income      Water 16 03193 i004
7.
What is the main source of drinking water for your household?
  • ■ Piped to dwelling ■ Piped to yard ■ Public tap/standpipe ■ Borehole/hand pipe
  • ■ Protected dug well ■ unprotected dug wells ■ Bottled/sachet water ■ Tanker truck
  • ■ Surface water ■ Rainfall ■ Other (Specify)
8.
What is the main source of water used by your household for other purposes such as cooking and hand washing?
  • ■ Piped to dwelling ■ Piped to yard ■ Public tap/standpipe ■ Borehole/hand pipe
  • ■ Protected dug well ■ unprotected dug wells ■ Bottled/sachet water ■ Tanker truck
  • ■ Surface water ■ Rainfall ■ Other (Specify)
9.
How long does it take to go there, get water and come back?     Water 16 03193 i005
10.
Is water always available from your main water source?      Water 16 03193 i006
11.
What is the daily availability of water on the day it flows?
  • ■ 24 h ■ 1–2 h ■ 3–5 h ■ 6–8 h ■ night hours ■ irregular
  • ■ Don’t know
12.
What is your level of satisfaction with the water supply service (Liters/cubic meters)?
  • ■ Very satisfied ■ Satisfied ■ Neutral ■ Unsatisfied ■ Very unsatisfied
13.
How much water (in liters) do you use per day?    Water 16 03193 i007
14.
How much do you spend on water every week?    Water 16 03193 i008
15.
What is your level of satisfaction with the prices of water?
  • ■ Very satisfied ■ Satisfied ■ Neutral ■ Unsatisfied ■ Very unsatisfied
16.
Is the price of water affordable?
  • ■ Yes ■ No
17.
Is the water of good quality?
  • ■ Yes ■ No ■ Somehow ■ Don’t know
18.
What is your reason (List max of 3)?
19.
Do you treat your water in any way to make it safer to drink?
  • ■ Yes ■ No ■ Please specify other
  • GPS Location of House/Household

References

  1. Bureau of Reclamation. Water Facts—Worldwide Water Supply_ARWEC_CCAO_Area Offices_California-Great Basin_Bureau of Reclamation. Available online: https://www.usbr.gov/mp/arwec/water-facts-ww-water-sup.html (accessed on 10 July 2024).
  2. Bidlack, W.R.; Wang, W.X.; Clemens, R.A. Water: The World’s Most Precious Resource. J. Food Sci. 2006, 69, 16. Available online: https://api.semanticscholar.org/CorpusID:96332385 (accessed on 11 July 2024). [CrossRef]
  3. Nations, U. The 2030 Agenda and the Sustainable Development Goals An Opportunity for Latin America and the Caribbean Goals, Targets and Global Indicators. 2030. Available online: www.issuu.com/publicacionescepal/stacks (accessed on 19 August 2024).
  4. Ortigara, A.R.C.; Kay, M.; Uhlenbrook, S. A Review of the SDG 6 Synthesis Report 2018 from an Education, Training, and Research Perspective. Water 2018, 10, 1353. Available online: https://www.mdpi.com/2073-4441/10/10/1353/htm (accessed on 10 July 2024). [CrossRef]
  5. Alhassan, S.; Hadwen, W.L. Challenges and Opportunities for Mainstreaming Climate Change Adaptation into WaSH Development Planning in Ghana. Int. J. Environ. Res. Public Health 2017, 14, 749. Available online: https://www.mdpi.com/1660-4601/14/7/749/htm (accessed on 25 July 2024). [CrossRef]
  6. Wright, J.; Dzodzomenyo, M.; Wardrop, N.A.; Johnston, R.; Hill, A.; Aryeetey, G.; Adanu, R. Effects of Sachet Water Consumption on Exposure to Microbe-Contaminated Drinking Water: Household Survey Evidence from Ghana. Int. J. Environ. Res. Public Health 2016, 13, 303. Available online: https://www.mdpi.com/1660-4601/13/3/303/htm (accessed on 25 July 2024). [CrossRef]
  7. Abu, M.; Codjoe, S.N.A. Experience and Future Perceived Risk of Floods and Diarrheal Disease in Urban Poor Communities in Accra, Ghana. Int. J. Environ. Res. Public Health 2018, 15, 2830. Available online: https://www.mdpi.com/1660-4601/15/12/2830/htm (accessed on 25 July 2024). [CrossRef] [PubMed]
  8. Lutterodt, G.; van de Vossenberg, J.; Hoiting, Y.; Kamara, A.K.; Oduro-Kwarteng, S.; Foppen, J.W.A. Microbial Groundwater Quality Status of Hand-Dug Wells and Boreholes in the Dodowa Area of Ghana. Int. J. Environ. Res. Public Health 2018, 15, 730. Available online: https://www.mdpi.com/1660-4601/15/4/730/htm (accessed on 25 July 2024). [CrossRef] [PubMed]
  9. Dekker, D.M.; Krumkamp, R.; Sarpong, N.; Frickmann, H.; Boahen, K.G.; Frimpong, M.; Asare, R.; Larbi, R.; Hagen, R.M.; Poppert, S.; et al. Drinking Water from Dug Wells in Rural Ghana—Salmonella Contamination, Environmental Factors, and Genotypes. Int. J. Environ. Res. Public Health 2015, 12, 3535–3546. Available online: https://www.mdpi.com/1660-4601/12/4/3535/htm (accessed on 25 July 2024). [CrossRef]
  10. Hensher, D.; Shore, N.; Train, K. Households’ willingness to pay for water service attributes. Environ. Resour. Econ. 2005, 32, 509–531. [Google Scholar] [CrossRef]
  11. Yeleliere, E.; Cobbina, S.J.; Duwiejuah, A.B. Review of Ghana’s water resources: The quality and management with particular focus on freshwater resources. Appl. Water Sci. 2018, 8, 93. [Google Scholar] [CrossRef]
  12. Koppelaar, R.H.E.M.; Sule, M.N.; Kis, Z.; Mensah, F.K.; Wang, X.; Triantafyllidis, C.; van Dam, K.H.; Shah, N. Framework for WASH Sector Data Improvements in Data-Poor Environments, Applied to Accra, Ghana. Water 2018, 10, 1278. Available online: https://www.mdpi.com/2073-4441/10/9/1278/htm (accessed on 3 August 2024). [CrossRef]
  13. Tang, X.; Adesina, J.A. Integrated Watershed Management Framework and Groundwater Resources in Africa—A Review of West Africa Sub-Region. Water 2022, 14, 288. Available online: https://www.mdpi.com/2073-4441/14/3/288/htm (accessed on 3 August 2024). [CrossRef]
  14. Evans, B.; Bartram, J.; Williams, A. Public Health and Social Benefits of At-house Water Supplies. Available online: https://www.researchgate.net/publication/283422043 (accessed on 11 July 2024).
  15. Ahmed, H.; Zolfo, M.; Williams, A.; Ashubwe-Jalemba, J.; Tweya, H.; Adeapena, W.; Labi, A.-K.; Adomako, L.A.B.; Addico, G.N.D.; Banu, R.A.; et al. Antibiotic-Resistant Bacteria in Drinking Water from the Greater Accra Region, Ghana: A Cross-Sectional Study, December 2021–March 2022. Int. J. Environ. Res. Public Health 2022, 19, 12300. Available online: https://www.mdpi.com/1660-4601/19/19/12300/htm (accessed on 25 July 2024). [CrossRef] [PubMed]
  16. Ge, Y.; Wang, J. The Water Resources Rebound Effect Threatening the Achievement of Sustainable Development Goal 6 (SDG 6). Sustainability 2024, 16, 4155. [Google Scholar] [CrossRef]
  17. Cobbina, S.J.; Duwiejuah, A.B.; Quansah, R.; Obiri, S.; Bakobie, N. Comparative Assessment of Heavy Metals in Drinking Water Sources in Two Small-Scale Mining Communities in Northern Ghana. Int. J. Environ. Res. Public Health 2015, 12, 10620–10634. Available online: https://www.mdpi.com/1660-4601/12/9/10620/htm (accessed on 25 July 2024). [CrossRef] [PubMed]
  18. Chew, J.F.; Corlin, L.; Ona, F.; Pinto, S.; Fenyi-Baah, E.; Osei, B.G.; Gute, D.M. Water Source Preferences and Water Quality Perceptions among Women in the Eastern Region, Ghana: A Grounded Theory Study. Int. J. Environ. Res. Public Health 2019, 16, 3835. Available online: https://www.mdpi.com/1660-4601/16/20/3835/htm (accessed on 25 July 2024). [CrossRef]
  19. Smiley, S.L. Complexities of water access in Dar es Salaam, Tanzania. Appl. Geogr. 2013, 41, 132–138. [Google Scholar] [CrossRef]
  20. Kangmennaang, J.; Bisung, E.; Elliott, S.J. ‘We Are Drinking Diseases’: Perception of Water Insecurity and Emotional Distress in Urban Slums in Accra, Ghana. Int. J. Environ. Res. Public Health 2020, 17, 890. Available online: https://www.mdpi.com/1660-4601/17/3/890/htm (accessed on 25 July 2024). [CrossRef]
  21. Kaku, D.U.; Cao, Y.; Al-Masnay, Y.A.; Nizeyimana, J.C. An integrated approach to assess the environmental impacts of large-scale gold mining: The nzema-gold mines in the ellembelle district of ghana as a case study. Int. J. Environ. Res. Public Health 2021, 18, 7044. Available online: https://www.mdpi.com/1660-4601/18/13/7044/htm (accessed on 25 July 2024). [CrossRef]
  22. Akuo-Ko, E.O.; Otoo, F.; Glover, E.T.; Amponsem, E.; Tettey-Larbi, L.; Csordás, A.; Kovács, T.; Shahrokhi, A. A Comprehensive Radiological Survey of Groundwater Resources in Artisanal Mining Communities in the Eastern Region of Ghana: Water Quality vs. Mining Activities. Water 2023, 16, 62. Available online: https://www.mdpi.com/2073-4441/16/1/62/htm (accessed on 3 August 2024). [CrossRef]
  23. Selebalo, I.M.; Scholes, M.C.; Clifford-holmes, J.K. A Systemic Analysis of the Environmental Impacts of Gold Mining within the Blyde River Catchment, a Strategic Water Area of South Africa. Water 2021, 13, 301. Available online: https://www.mdpi.com/2073-4441/13/3/301/htm (accessed on 3 August 2024). [CrossRef]
  24. Munyai, R.B.; Chikoore, H.; Musyoki, A.; Chakwizira, J.; Muofhe, T.P.; Xulu, N.G.; Manyanya, T.C. Vulnerability and Adaptation to Flood Hazards in Rural Settlements of Limpopo Province, South Africa. Water 2021, 13, 3490. Available online: https://www.mdpi.com/2073-4441/13/24/3490/htm (accessed on 3 August 2024). [CrossRef]
  25. Ntajal, J.; Höllermann, B.; Falkenberg, T.; Kistemann, T.; Evers, M. Water and Health Nexus—Land Use Dynamics, Flooding, and Water-Borne Diseases in the Odaw River Basin, Ghana. Water 2022, 14, 461. Available online: https://www.mdpi.com/2073-4441/14/3/461/htm (accessed on 3 August 2024). [CrossRef]
  26. Kankam-Yeboah, K.; Gyau-Boakye, P.; Nishigaki, M.; Komatsu, M. Water Resources and Environmental Management in Ghana; Faculty of Environmental Science and Technology, Okayama University: Okayama, Japan, 2004. [Google Scholar]
  27. Agodzo, S.K.; Bessah, E.; Nyatuame, M. A review of the water resources of Ghana in a changing climate and anthropogenic stresses. Front. Water 2023, 4, 973825. [Google Scholar] [CrossRef]
  28. WHO&UNICEF-JMP. Progress on Household Drinking Water, Sanitation and Hygiene 2000–2020: Five Years into the SDGs | JMP 2021. Available online: https://washdata.org/reports/jmp-2021-wash-households (accessed on 10 July 2024).
  29. Awuah, E.; Nyarko, K.B.; Owusu, P.A. Water and sanitation in Ghana. Desalination 2009, 248, 460–467. [Google Scholar] [CrossRef]
  30. Kumasi, T.C.; Agbemor, B.D.; Burr, P. Rural water asset management practices in Ghana: The gaps and needs. Water Environ. J. 2019, 33, 252–264. Available online: https://onlinelibrary.wiley.com/doi/full/10.1111/wej.12396 (accessed on 10 July 2024). [CrossRef]
  31. Mabhaudhi, T.; Nhamo, L.; Chibarabada, T.P.; Mabaya, G.; Mpandeli, S.; Liphadzi, S.; Senzanje, A.; Naidoo, D.; Modi, A.T.; Chivenge, P.P. Assessing Progress towards Sustainable Development Goals through Nexus Planning. Water 2021, 13, 1321. Available online: https://www.mdpi.com/2073-4441/13/9/1321/htm (accessed on 3 August 2024). [CrossRef]
  32. Nyarko, K.B.; Dwumfour-Asare, B.; Appiah-Effah, E.; Moriarty, P. Cost of delivering water services in rural areas and small towns in Ghana. In IRC Symposium 2010: Pumps, Pipes and Promises; IRC Wash: The Hague, The Netherlands, 2010; pp. 16–18. [Google Scholar]
  33. Aikowe, J.O.; Mazancová, J. Barriers to water access in rural communities: Examining the factors influencing water source choice. Water 2021, 13, 2755. Available online: https://www.mdpi.com/2073-4441/13/19/2755/htm (accessed on 3 August 2024). [CrossRef]
  34. Burr, P.; Fonseca, C. Applying the Life-Cycle Costs Approach to Sanitation Costs and Service Levels in Andhra Pradesh (India), Burkina Faso, Ghana and Mozambique. 2011. Available online: www.washcost.info (accessed on 10 July 2024).
  35. Danert, K.; Healy, A. Monitoring Groundwater Use as a Domestic Water Source by Urban Households: Analysis of Data from Lagos State, Nigeria and Sub-Saharan Africa with Implications for Policy and Practice. Water 2021, 13, 568. Available online: https://www.mdpi.com/2073-4441/13/4/568/htm (accessed on 3 August 2024). [CrossRef]
  36. Aladejana, J.A.; Kalin, R.M.; Sentenac, P.; Hassan, I. Assessing the Impact of Climate Change on Groundwater Quality of the Shallow Coastal Aquifer of Eastern Dahomey Basin, Southwestern Nigeria. Water 2020, 12, 224. Available online: https://www.mdpi.com/2073-4441/12/1/224/htm (accessed on 3 August 2024). [CrossRef]
  37. Ezeh, O.K.; Agho, K.E.; Dibley, M.J.; Hall, J.; Page, A.N. The Impact of Water and Sanitation on Childhood Mortality in Nigeria: Evidence from Demographic and Health Surveys, 2003–2013. Int. J. Environ. Res. Public Health 2014, 11, 9256–9272. Available online: https://www.mdpi.com/1660-4601/11/9/9256/htm (accessed on 26 July 2024). [CrossRef]
  38. Mutyambizi, C.; Mokhele, T.; Ndinda, C.; Hongoro, C. Access to and Satisfaction with Basic Services in Informal Settlements: Results from a Baseline Assessment Survey. Int. J. Environ. Res. Public Health 2020, 17, 4400. Available online: https://www.mdpi.com/1660-4601/17/12/4400/htm (accessed on 26 July 2024). [CrossRef] [PubMed]
  39. Adank, M.; Kumasi, T.C.; Chimbar, T.; Atengdem, J.; Agbemor, B. The State of Handpump Water Services in Ghana: Findings from Three Districts. In Proceedings of the 37th WEDC International Conference, Hanoi, Vietnam, 15–19 September 2014. [Google Scholar]
  40. Rural Water Supply Network (RWSN). Rural Water Supply Network (RWSN) Secretariat, Skat Foundation. 2010. p. 7 p.; 3 fig.; 6 refs. RWSN • Other Topics—Rural Water Supply Network. Available online: https://www.rural-water-supply.net/en/sustainable-services/myths (accessed on 10 July 2024).
  41. Oforikrom Municipal Assembly. History | Oforikrom Municipal Assembly 2024. Available online: https://www.ofkma.gov.gh/assembly/history (accessed on 23 August 2024).
  42. Oforikrom Municipal Assembly. Republic of Ghana Composite Budget for 2021–2024 Programme Based Budget Estimates for 2021 Oforikrom Municipal Assembly. Available online: www.mofep.gov.gh (accessed on 11 July 2024).
  43. Wikipedia. Oforikrom Municipal District—Wikipedia. Available online: https://en.wikipedia.org/wiki/Oforikrom_Municipal_District (accessed on 10 July 2024).
  44. LatLong.net. Where is Kumasi, Ghana on Map Lat Long Coordinates 2021. Available online: https://www.latlong.net/place/kumasi-ghana-1926.html (accessed on 10 July 2024).
  45. Nampa, I.W.; Mudita, I.W.; Riwu Kaho, N.P.L.B.; Widinugraheni, S.; Lasarus Natonis, R. The KoBoCollect for Research Data Collection and Management (An experience in Researching the Socio-Economic Impact of Blood Disease in Banana). SOCA J. Sos. Ekon. Pertan. 2020, 14, 545. [Google Scholar] [CrossRef]
  46. Oluwasanya, G.; Odjegba, E.E.; Shittu, O.B.; Oa, I.; Brion, G.M. Service Level Indicators for Water Supply Systems: Appraisal and Implications for Sustainable Management. Water Resour. Manag. 2021; under review. [Google Scholar] [CrossRef]
  47. Deal, P.; Sabatini, D. Evaluating the Level of the Household Water Service Provided by a Private Water Enterprise in Ghana. Water 2020, 12, 693. Available online: https://www.mdpi.com/2073-4441/12/3/693/htm (accessed on 3 August 2024). [CrossRef]
  48. Rakotomanana, H.; Komakech, J.J.; Walters, C.N.; Stoecker, B.J. The WHO and UNICEF Joint Monitoring Programme (JMP) Indicators for Water Supply, Sanitation and Hygiene and Their Association with Linear Growth in Children 6 to 23 Months in East Africa. Int. J. Environ. Res. Public Health 2020, 17, 6262. Available online: https://www.mdpi.com/1660-4601/17/17/6262/htm (accessed on 26 July 2024). [CrossRef]
  49. Onda, K.; LoBuglio, J.; Bartram, J. Global access to safe water: Accounting for water quality and the resulting impact on MDG progress. Int. J. Environ. Res. Public Health 2012, 9, 880. [Google Scholar] [CrossRef] [PubMed] [PubMed Central]
  50. Kayser, G.L.; Moriarty, P.; Fonseca, C.; Bartram, J. Domestic Water Service Delivery Indicators and Frameworks for Monitoring, Evaluation, Policy and Planning: A Review. Int. J. Environ. Res. Public Health 2013, 10, 4812–4835. [Google Scholar] [CrossRef] [PubMed Central]
  51. Alegre, H.; Baptista, J.M.; Cabrera, E.; Cubillo, F.; Duarte, P.; Hirner, W.; Merkel, W.; Parena, R. Performance Indicators for Water Supply Services: Third Edition. 2006. Available online: https://api.semanticscholar.org/CorpusID:111911122 (accessed on 30 September 2024).
  52. Lavy, S.; Garcia, J.A.S.; Dixit, M.K. Establishment of KPIs for facility performance measurement: Review of literature. Facilities 2010, 28, 440–464. Available online: https://api.semanticscholar.org/CorpusID:42974040 (accessed on 30 September 2024). [CrossRef]
  53. Berg, S.V. Water Utility Benchmarking: Measurement, Methodologies, and Performance Incentives. 2010. Available online: https://api.semanticscholar.org/CorpusID:107748885 (accessed on 30 September 2024).
  54. Berg, S.V. Performance Assessment Using Key Performance Indicators (KPIs) for Water Utilities: A Primer. Water Econ. Policy 2020, 6, 2050001. Available online: https://api.semanticscholar.org/CorpusID:213447162 (accessed on 30 September 2024). [CrossRef]
  55. Haider, H.; Sadiq, R.; Tesfamariam, S. Performance indicators for small- and medium-sized water supply systems: A review. Environ. Rev. 2014, 22, 1–40. Available online: https://api.semanticscholar.org/CorpusID:85750489 (accessed on 5 October 2024). [CrossRef]
  56. Fonseca, C.; Franceys, R.; Batchelor, C.; McIntyre, P.; Klutse, A.; Komives, K.; Moriarty, P.; Naafs, A.; Nyarko, K.; Pezon, C.; et al. On Enumerator’s Shirt: “Quantifying the Costs of Water and Sanitation” Costing Sustainable Services. 2011. Available online: www.ircwash.org (accessed on 10 July 2024).
  57. Moriarty, P.; Batchelor, C.; Fonseca, C.; Klutse, A.; Naafs, A.; Nyarko, K.; Pezon, C.; Potter, A.; Reddy, R.; Snehalatha, M. Ladders for Assessing and Costing Water Service Delivery. 2011. Available online: www.washcost.info (accessed on 10 July 2024).
  58. Popkin, B.M.; D’Anci, K.E.; Rosenberg, I.H. Water, Hydration, and Health. Nutr. Rev. 2010, 68, 439–458. [Google Scholar] [CrossRef]
  59. Howard, G.; Bartram, J.; Williams, A.; Overbo, A.; Fuente, D.; Geere, J.-A. Domestic Water Quantity, Service Level and Health, 2nd ed.; World Health Organization: Geneva, Switzerland, 2020. [Google Scholar]
  60. Dlamini, M.; Chirima, G.; Jovanovic, N.; Adam, E. Assessing the Effects of Land Use on Surface Water Quality in the Lower uMfolozi Floodplain System, South Africa. Int. J. Environ. Res. Public Health 2021, 18, 561. Available online: https://www.mdpi.com/1660-4601/18/2/561/htm (accessed on 26 July 2024). [CrossRef] [PubMed]
  61. Adekunle, I.M.; Adetunji, M.T.; Gbadebo, A.M.; Banjoko, O.B. Assessment of Groundwater Quality in a Typical Rural Settlement in Southwest Nigeria. Int. J. Environ. Res. Public Health 2007, 4, 307–318. Available online: https://www.mdpi.com/1660-4601/4/4/307/htm (accessed on 26 July 2024). [CrossRef] [PubMed]
  62. Potgieter, N.; Karambwe, S.; Mudau, L.S.; Barnard, T.; Traore, A. Human Enteric Pathogens in Eight Rivers Used as Rural Household Drinking Water Sources in the Northern Region of South Africa. Int. J. Environ. Res. Public Health 2020, 17, 2079. Available online: https://www.mdpi.com/1660-4601/17/6/2079/htm (accessed on 26 July 2024). [CrossRef] [PubMed]
  63. Odiyo, J.O.; Makungo, R. Chemical and Microbial Quality of Groundwater in Siloam Village, Implications to Human Health and Sources of Contamination. Int. J. Environ. Res. Public Health 2018, 15, 317. Available online: https://www.mdpi.com/1660-4601/15/2/317/htm (accessed on 26 July 2024). [CrossRef] [PubMed]
  64. Odiyo, J.O.; Mathoni, M.M.; Makungo, R. Health Risks and Potential Sources of Contamination of Groundwater Used by Public Schools in Vhuronga 1, Limpopo Province, South Africa. Int. J. Environ. Res. Public Health 2020, 17, 6912. Available online: https://www.mdpi.com/1660-4601/17/18/6912/htm (accessed on 26 July 2024). [CrossRef]
  65. Mandindi, W.Z.; Nyaba, L.; Mketo, N.; Nomngongo, P.N. Seasonal Variation of Drinking Water Quality and Human Health Risk Assessment: A Case Study in Rural Village of the Eastern Cape, South Africa. Water 2022, 14, 2013. Available online: https://www.mdpi.com/2073-4441/14/13/2013/htm (accessed on 3 August 2024). [CrossRef]
  66. Alfredo, K.A.; Lawler, D.F.; Katz, L.E. Fluoride contamination in the Bongo District of Ghana, West Africa: Geogenic contamination and cultural complexities. Water Int. 2014, 39, 486–503. [Google Scholar] [CrossRef]
  67. Arhin, E.; Affam, M. Fluoride in Groundwater and Its Implications in West Gonja District of Ghana. Ghana Min. J. 2010, 11. [Google Scholar] [CrossRef]
  68. Edokpayi, J.N.; Rogawski, E.T.; Kahler, D.M.; Hill, C.L.; Reynolds, C.; Nyathi, E.; Smith, J.A.; Odiyo, J.O.; Samie, A.; Bessong, P.; et al. Challenges to Sustainable Safe Drinking Water: A Case Study of Water Quality and Use across Seasons in Rural Communities in Limpopo Province, South Africa. Water 2018, 10, 159. Available online: https://www.mdpi.com/2073-4441/10/2/159/htm (accessed on 3 August 2024). [CrossRef]
  69. Nyarko, K.B.; Dwumfour-Asare, B.; Moriarty, P.; Appiah-Effah, E.; Obuobisa-Darko, A. Life-Cycle Costs Approach for WASH Services That Last 2012. Available online: www.washcost.info (accessed on 3 August 2024).
  70. WHO. Guidelines for Drinking-Water Quality, 4th ed.; Incorporating the 1st Addendum; World Health Organization: Geneva, Switzerland, 2017; Available online: https://www.who.int/publications/i/item/9789241549950 (accessed on 10 July 2024).
  71. Fisher, M.B.; Shields, K.F.; Chan, T.; Christenson, E.; Cronk, R.D.; Leker, H.G.; Samani, D.; Apoya, P.; Lutz, A.; Bartram, J.K. Understanding Handpump Sustainability: Determinants of Rural Water Source Functionality in the Greater Afram Plains Region of Ghana†. Water Resour. Res. 2015, 51, 8431–8449. [Google Scholar] [CrossRef]
  72. WHO. Guidelines for Drinking-Water Quality: Surveillance and Control of Community Supplies; WHO: Geneva, Switzerland, 1997; Volume 3, Available online: https://www.who.int/publications/i/item/9241545038 (accessed on 3 August 2024).
  73. WHO&UNICEF. The Measurement and Monitoring of Water Supply, Sanitation and Hygiene (WASH) Affordability the Measurement and Monitoring of Water Supply, Sanitation and Hygiene (WASH) Affordability A Missing Element of Monitoring of Sustainable Development Goal (SDG) Targets 6. 1 and 6.2 A collaboration of the WHO-UNICEF Joint Monitoring Programme (JMP), the UN-Water Global Analysis and Assessment of Sanitation and Drinking-Water (GLAAS) and an Expert Group on WASH Affordability. 2021. Available online: www.unicef.org/wash (accessed on 10 July 2024).
  74. Hu, Z.; Morton, L.W.; Mahler, R.L. Bottled Water: United States Consumers and Their Perceptions of Water Quality. Int. J. Environ. Res. Public Health 2011, 8, 565–578. [Google Scholar] [CrossRef] [PubMed] [PubMed Central]
  75. Martínez-Santos, P. Determinants for water consumption from improved sources in rural villages of southern Mali. Appl. Geogr. 2017, 85, 113–125. [Google Scholar] [CrossRef]
  76. Ramos da Silva, S.; Heller, L.; de Campos Valadares, J.; Cairncross, S.; Cruz, O. Relationship (or Its Lack) Between Population and a Water and SANITATION service: A Study of Users’ Perception In Vitó Ria (ES) Brazil. Available online: http://iwaponline.com/jwh/article-pdf/8/4/764/397506/764.pdf (accessed on 25 August 2024).
  77. Kumasi, T.C.; Agbemor, B.D. Tracking user satisfaction of rural water services in northern Ghana. J. Water Sanit. Hyg. Dev. 2018, 8, 307–318. Available online: http://iwaponline.com/washdev/article-pdf/8/2/307/224364/washdev0080307.pdf (accessed on 25 August 2024). [CrossRef]
  78. Kumasi, T.C.; Adank, M.; Abbey, E.; Dickinson, N.; Atengdem, J.; Chimbar, T.; Appiah-Effah, E. The Status of Rural Water Services in Ghana A Synthesis of Findings from 3 Districts (Akatsi, Sunyani West and East Gonja Districts); IRC Wash: The Hague, The Netherlands, 2013. [Google Scholar] [CrossRef]
  79. Magara, P. The Paradox of Rural Water User Demand and Satisfaction: Findings from Selected Districts in Northern and Mid Western Uganda; IRC Wash: The Hague, The Netherlands, 2014. [Google Scholar]
  80. Kleiner, S.M. Water: An essential but overlooked nutrient. J. Am. Diet. Assoc. 1999, 99, 200–206. [Google Scholar] [CrossRef]
  81. Foster, T.; Hope, R. Evaluating Waterpoint Sustainability and Access Implications of Revenue Collection Approaches in Rural Kenya. Water Resour. Res. 2017, 53, 1473–1490. [Google Scholar] [CrossRef]
  82. Cairncross, S.; Cuff, J.L. Water use and health in Mueda, Mozambique. Trans. R. Soc. Trop. Med. Hyg. 1987, 81, 51–54. Available online: https://pubmed.ncbi.nlm.nih.gov/3445322/ (accessed on 10 July 2024). [CrossRef]
  83. WELL, Kimberly Clarke. Water Supply and Sanitation Programmes Guidance Manual on 1998. Available online: https://practicalactionpublishing.com/book/958/guidance-manual-on-water-supply-and-sanitation-programmes (accessed on 10 July 2024).
  84. Fuente, D.; Gakii Gatua, J.; Ikiara, M.; Kabubo-Mariara, J.; Mwaura, M.; Whittington, D. Water and sanitation service delivery, pricing, and the poor: An empirical estimate of subsidy incidence in Nairobi, Kenya. Water Resour. Res. 2016, 52, 4845–4862. Available online: https://onlinelibrary.wiley.com/doi/full/10.1002/2015WR018375 (accessed on 10 July 2024). [CrossRef]
  85. Briand, A.; Nauges, C.; Strand, J.; Travers, M. The impact of tap connection on water use: The case of household water consumption in Dakar, Senegal. Environ. Dev. Econ. 2010, 15, 107–126. [Google Scholar] [CrossRef]
  86. Nauges, C.; Van Den Berg, C. Demand for piped and non-piped water supply services: Evidence from southwest Sri Lanka. Environ. Resour. Econ. 2009, 42, 535–549. Available online: https://link.springer.com/article/10.1007/s10640-008-9222-z (accessed on 10 July 2024). [CrossRef]
  87. Degabriele, J. Improving Community Based Management of Boreholes: A Case Study from Malawi. 2002. Available online: http://www.wisc.edu/ltc/basis.html (accessed on 10 July 2024).
Figure 1. Map showing study communities and district boundaries in Kumasi, Ghana. The yellow dots highlight the locations of the households where the questionnaires were administered.
Water 16 03193 g001
Figure 2. Showing the proportion of each gender as well as their distribution throughout the age group.
Water 16 03193 g002
Figure 3. A bar chart showing the occupation distribution.
Water 16 03193 g003
Figure 4. (a) A picture of a household mechanized borehole connected to a hand pipe outside the household premises for public use at a fee, (b) A Picture of a public standpipe connected to a storage tank with water supplied by GWCL, (ce) A picture showing a borehole operated manually by a hand pump; the user either pushes the hand pump up or down or spins the hand-cranked wheel, to draw water from a borehole. Source: All pictures were taken during the study except for picture (d,e) credofunding (www.credofundingwater.com).
Water 16 03193 g004
Figure 5. Chart showing the distribution of the level of satisfaction with respect to the cost of water.
Water 16 03193 g005
Figure 6. Relationship between water availability and level of satisfaction.
Water 16 03193 g006
Table 1. Data categories and corresponding information obtained from household surveys.
DataInformation Obtained
Respondent Personal Information Household location
Demographic characteristics
Income of Household Financial status
Educational status
Household Asset Financial status
Source of Household water Improved/Unimproved Sources
Level of Service
Level of Satisfaction
Cost
Table 2. SDG service ladder for drinking water.
Service LevelDefinition
Safely managed Drinking water from an improved source that is accessible on premises, available when needed and free from fecal and priority chemical contamination.
Basic Drinking water from an improved source, provided the collection time is not more than 30 min for a round trip, including queuing.
Limited Drinking water from an improved source, for which the collection time exceeds 30 min for a round trip, including queuing.
Unimproved Drinking water from an unprotected dug well or unprotected spring.
Surface water Drinking water directly from a river, dam, lake, pond, stream, canal or irrigation canal.
Note: Source: WHO and UNICEF Joint Monitoring Program (JMP) (www.washdata.org).
Table 3. Summary of adequacy and level of health concern. Source [59].
Typical Volumes of Water Used in the Home Adequacy for Health Needs Level of Health Concern
Average quantity more than
40 L/person/day
Drinking—assured
Cooking—assured
Hygiene—all food hygiene, handwashing, and face washing assured under non-
outbreak conditions; enhanced hygiene during infectious disease outbreaks not
assured; bathing and laundry at the home should also be assured.
Medium
Average quantity more than
100 L/person/day
Drinking—all needs met
Cooking—all needs should be met
Hygiene—all food hygiene, handwashing and face washing needs should be met,
including for bathing and laundry at the home, and household cleaning.
Low
Table 4. Assessment of water system functionality across selected regions and districts.
Region
(District)
No of Communities Total Point Systems Non-Functional Systems Non-Reliable Systems % Of Functionality
Ashanti (Bosomtwe) 10264585%
Northern (East Gonja) 1530111163%
Volta (Ketu South) 61971363%
Total 3175222971%
Note: Source: [69].
Table 5. Relationship between the level of education and occupation.
Distribution of Occupation
Level of Education Self-Employed Private Public Sector Unemployed Retired
Tertiary 7101361
Senior High School1951--
Junior High School/Middle
School
197323
Primary/
Elementary
12-1-
Disclaimer/Publisher’s Note: The statements, opinions and data contained in all publications are solely those of the individual author(s) and contributor(s) and not of MDPI and/or the editor(s). MDPI and/or the editor(s) disclaim responsibility for any injury to people or property resulting from any ideas, methods, instructions or products referred to in the content.

