Article

Effects of Sachet Water Consumption on Exposure to Microbe-Contaminated Drinking Water: Household Survey Evidence from Ghana

1
Geography and Environment, University of Southampton, Southampton SO17 1BJ, UK
2
Ghana School of Public Health, University of Ghana, Accra PO Box LG13, Ghana
3
Joint Monitoring Programme for Water Supply and Sanitation (JMP), Department of Public Health, Environmental and Social Determinants of Health (PHE), World Health Organization, Geneva 1211 Switzerland
4
Social Sciences, University of Southampton, Southampton SO17 1BJ, UK
*
Author to whom correspondence should be addressed.
Int. J. Environ. Res. Public Health 2016, 13(3), 303; https://doi.org/10.3390/ijerph13030303
Submission received: 4 December 2015 / Revised: 15 February 2016 / Accepted: 29 February 2016 / Published: 9 March 2016

Abstract

:
There remain few nationally representative studies of drinking water quality at the point of consumption in developing countries. This study aimed to examine factors associated with E. coli contamination in Ghana. It drew on a nationally representative household survey, the 2012−2013 Living Standards Survey 6, which incorporated a novel water quality module. E. coli contamination in 3096 point-of-consumption samples was examined using multinomial regression. Surface water use was the strongest risk factor for high E. coli contamination (relative risk ratio (RRR) = 32.3, p < 0.001), whilst packaged (sachet or bottled) water use had the greatest protective effect (RRR = 0.06, p < 0.001), compared to water piped to premises. E. coli contamination followed plausible patterns with digit preference (tendency to report values ending in zero) in bacteria counts. The analysis suggests packaged drinking water use provides some protection against point-of-consumption E. coli contamination and may therefore benefit public health. It also suggests viable water quality data can be collected alongside household surveys, but field protocols require further revision.

1. Introduction

Given continued population growth, utilities in many cities in sub-Saharan Africa struggle to provide sufficient domestic water to meet residents’ needs [1]. The gap between supply capacity and demand manifests itself through water rationing, with supply interruptions common in many urban neighbourhoods [2]. Faced with water rationing, residents not only have to find alternative sources of water when piped supplies are unavailable and store water to prepare for interruptions, but they may also be exposed to water contamination events associated with pressure drops within the supply system [3]. Furthermore, stored water may often become contaminated [4], and recent systematic review evidence suggests the extent of stored water contamination is greater among those using piped supplies [5].
A recent nationally representative household survey in Ghana, the Living Standards Survey Round 6 (GLSS6), was conducted in 2012–2013 and included an additional module on drinking water quality. Although some household surveys have previously collected water quality parameters [6], this was the first nationally representative survey published which tested for a microbiological water quality parameter. The GLSS6 [7] suggested that rates of detectable E. coli, routinely used to indicate the presence of faecal contamination, were lower in sachet water than in piped water, consistent with low microbial contamination in packaged water relative to many other sources in a recent systematic review [8]. However, more in-depth analyses of the water quality data from this survey, examining patterns of microbial contamination while controlling for important confounding factors (e.g., water storage practices), have not yet been conducted.
In many sub-Saharan African cities, packaged waters have emerged as an alternative source of drinking water, both for those with piped connections and those without. In urban Ghana, consumption of “sachet” water (water sold in 500 mL sealed plastic bags) has grown rapidly [9]. Bottled water is also available, but less commonly used as a main source of drinking water. Larger corporate sachet producers and smaller producers registered with the regulatory bodies, the Ghana Standards Authority and Food Standards Authority, typically use pre-filtration, ultra-violet and reverse osmosis treatment as part of their production processes. However, unregistered producers also exist whose production processes have not been subject to regulatory scrutiny [9], and who often produce cheaper sachets to undercut more established sachet brands. It has been suggested that those living in poorer neighbourhoods may be particularly exposed to these lower quality brands [10], with associated concerns around sachet water safety.
This study therefore draws on GLSS6 data to examine factors associated with microbial contamination of point-of-consumption drinking water. In doing so, it seeks to examine the plausibility of microbial contamination patterns from the new household survey water quality module. As a secondary objective, the study examines risk factors for packaged (sachet and bottled) water contamination, both at the point of consumption and point of sale, while controlling for confounders. It aims to assess whether poorer households are differentially exposed to microbially contaminated packaged water. It also aims to quantify the protective effect, if any, of packaged water against point-of-consumption microbial contamination.

2. Experimental Section

2.1. Data

The GLSS6 is a multi-stage cluster survey designed to generate representative estimates for Ghana’s 10 regions and ecological zones, which was conducted from October 2012 to October 2013. Within the survey, 15 households were selected in each of the 1200 enumeration areas (EAs), giving a total of 18,000 households. Three households from each cluster of 15 (3600 households in total) were randomly selected and asked to provide “a glass of water which you would give a child to drink” [7,11] and a water sample was taken from this glass. A random number generator was used to select three households per cluster, so household randomization to water testing was constrained by survey cluster. For one in three of these selected households (1200 households in total), a second sample was taken from the source of water. In the case of packaged waters, the water would thus be poured into a glass or other vessel when sampling water at the point of consumption, whilst water sampled directly from packaging acted as source water samples (i.e., without transfer to a drinking vessel). These samples were then tested for arsenic, total coliforms and E. coli only. Microbial testing took place in the field, with 100 mL of sample water being filtered through a 0.45-micron filter. This was then placed onto a Compact Dry EC media plate (Nissui, Japan) and incubated at ambient temperature for 24 h. An additional 1 mL of water from each sample was placed on a second media plate without filtering, and GLSS6 field staff counted total coliform and Escherichia coli colonies on both 1 mL and 100 mL plates. Additional quality assurance measures were undertaken for a subset of households. These measures included duplicate laboratory testing for 10% of water samples, as well as analysis of sterile “blanks” for E. coli in the field alongside 5% of samples taken. Laboratory testing was undertaken via the regional laboratory network of the main utility, the Ghana Water Company. Laboratory testing methods differed from the survey method and varied between laboratories, with most using a Most Probable Number method, two using membrane filtration methods, and one using a presence-absence method. However, some aspects of duplicate laboratory testing proved problematic. This was because field sites were often distant from laboratories and therefore sample transit times exceeded 6 h, but also when samples did reach laboratories, limited laboratory capacity sometimes meant samples could not be processed in a timely fashion. Colony-forming unit (cfu) counts greater than 100 were considered too numerous to count.

2.2. Preliminary Evaluation of E. coli Counts

Histograms of the observed cfu counts per sample were plotted to assess the distribution of 1 mL and 100 mL samples at both source and at the point of consumption. Since there was evidence of digit preference (the tendency to round values to pleasing numbers) in all four of these histograms, end-digit frequencies were also calculated and plotted. Digit preference in data such as these is often considered a marker of authenticity. However, digit preference results in unusual data distributions, with implications for the most appropriate regression approach in further analysis.

2.3. Assessing Risk Factors for Water Contamination at the Point of Consumption

To address the aims of this analysis, the relationships between source types, household socio-economic status (SES) and E. coli contamination of water were assessed because of E. coli’s advantages over total coliforms as a biological indicator for public health protection [12,13]. As bottled water represents a minor source of drinking water in Ghana (only 4 of the 3096 samples here were from bottled water), this water source was combined with sachet water to give a “packaged water” category. Systematic review evidence suggests microbiological contamination varies even within “improved” source types. Given also that there were few samples for source types not in widespread use (e.g., tankers), water sources were therefore grouped into the following categories: (a) piped to dwelling (including piped into home and piped to yard/plot); (b) standpipe, water tanker or piped to neighbour; (c) borehole; (d) protected well; (e) unprotected well or spring; (f) rainwater collection; (g) surface water collection; (h) packaged water (sachet or bottled water). Prior to grouping source types, we checked for similarity in contamination patterns. During univariate analysis, more detailed categories for borehole sources were also included (community-provided boreholes; boreholes provided by non-governmental organizations (NGOs), and boreholes managed in other ways), to allow assessment of different water providers in the contamination level of water from boreholes, given growing policy interest in the effectiveness of state versus private sector water provision [14] and in the effectiveness of community- or household-led self-supply [15]. As noted, it has been suggested that poorer households may be more likely to consume poorer quality, cheaper counterfeit packaged water brands distributed by unregistered producers [10]. To examine exposure among poor households, expenditure (regionally deflated total expenditure (GH₵) per day, per adult equivalent) was used in preference to income as a measure of SES because consumption data are less subject to short-term fluctuations than income, since households prefer to smooth consumption by holding back a portion of income as savings [16].
Access to improved sanitation (including water closet, pit latrine, Kumasi ventilated improved pit latrine (KVIP), and public toilet; shared facilities of these types were also considered as improved) and the presence of soap or detergent within the household were examined in relation to water contamination, given the plausible link between poor sanitation, handwashing behaviours and contamination of drinking cups or stored water [4]. Information on if, and how, water was stored prior to sampling was assessed (categorised as not stored (i.e., obtained directly from source, including directly from sachet), stored in a covered vessel or stored in an uncovered vessel), as numerous studies have shown water storage in the home to be associated with contamination [4,5]. The effect of urban versus rural location was included as there has been debate as to whether drinking water contamination risks are inherently greater in urban areas and whether, accordingly, different urban monitoring arrangements should be adopted [17]. Finally, groundwater sources were differentiated from other sources and categorised as being either an unsafe distance from a latrine (less than 30 m) or beyond this threshold, following standard sanitary risk inspection guidance for sources such as protected wells and springs [18]. Home water treatment was not assessed, as water treatment information was only requested from households reporting noticeable organoleptic issues with their water (e.g., odour, colour), thus resulting in a large number of missing data for this variable.
As noted above, initial examination of microbiological data suggested pronounced digit preference, making it problematic to identify an appropriate statistical distribution on which to base any subsequent analysis. Therefore, E. coli cfu data were categorised and multinomial logistic regression was used to examine risk factors for water contamination at the point of consumption, adjusting for the survey design via the svy commands in Stata 13. Household weights (the reciprocal of the probability of household selection) were used, given the focus on household level variation in contamination of drinking water. The cfu data based on 100 mL samples only were used, as these are likely to be less uncertain than results from a smaller (1 mL) water sample. Initially, univariable analysis was used to assess the relationships between hypothesised risk factors and water contamination. A p-value of 0.05 or smaller was considered to be statistically significant. Subsequently, covariate selection for multivariable regression was carried out using the results of univariable analysis, assessment of collinearity between variables and prior understanding of potential risk factors in water contamination. Water source and expenditure were included in the multivariable analysis as covariates of primary interest. The presence of effect modification was assessed by inclusion of interaction terms between expenditure and water source.
The sensitivity of the multivariable regression model results to the removal of potentially erroneous water contamination observations was tested. Because of digit preference, it proved problematic to assess the underlying bacterial density distribution in these data and thereby identify statistically significant differences between pairs of 1 mL versus 100 mL samples. Therefore, using a “rule of thumb”, observations were removed where (a) any level of contamination was detected in the 1 mL sample, with less than 10 cfu detected in the 100 mL sample; (b) more than 2 cfu was detected in the 1 mL sample and less than 30 cfu in the 100 mL sample; or (c) contamination levels were greater in the 1 mL sample than the 100 mL sample. This reduced the overall sample size from 2822 to 2552. The final multivariable model, including interaction terms, was then fitted using the smaller dataset.

2.4. Risk Factors for Purchasing of Contaminated Sachet Water

Considering water samples taken directly from source, only 26 of 132 sachet samples (bottled water was not considered in this analysis) had detectable contamination in 100 mL. Therefore, we used logistic regression to examine three potential risk factors for the purchase of sachets contaminated with E. coli in 100 mL samples, adjusting for the survey design. Regionally deflated total expenditure per adult equivalent household member was assessed as an indicator of household purchasing power, since it has been suggested that poorer households may be more likely to buy lower quality brands [10]. We also examined the impact of region and rurality on contamination rates, to assess whether there was evidence for geographic variation in sachet safety.

3. Results

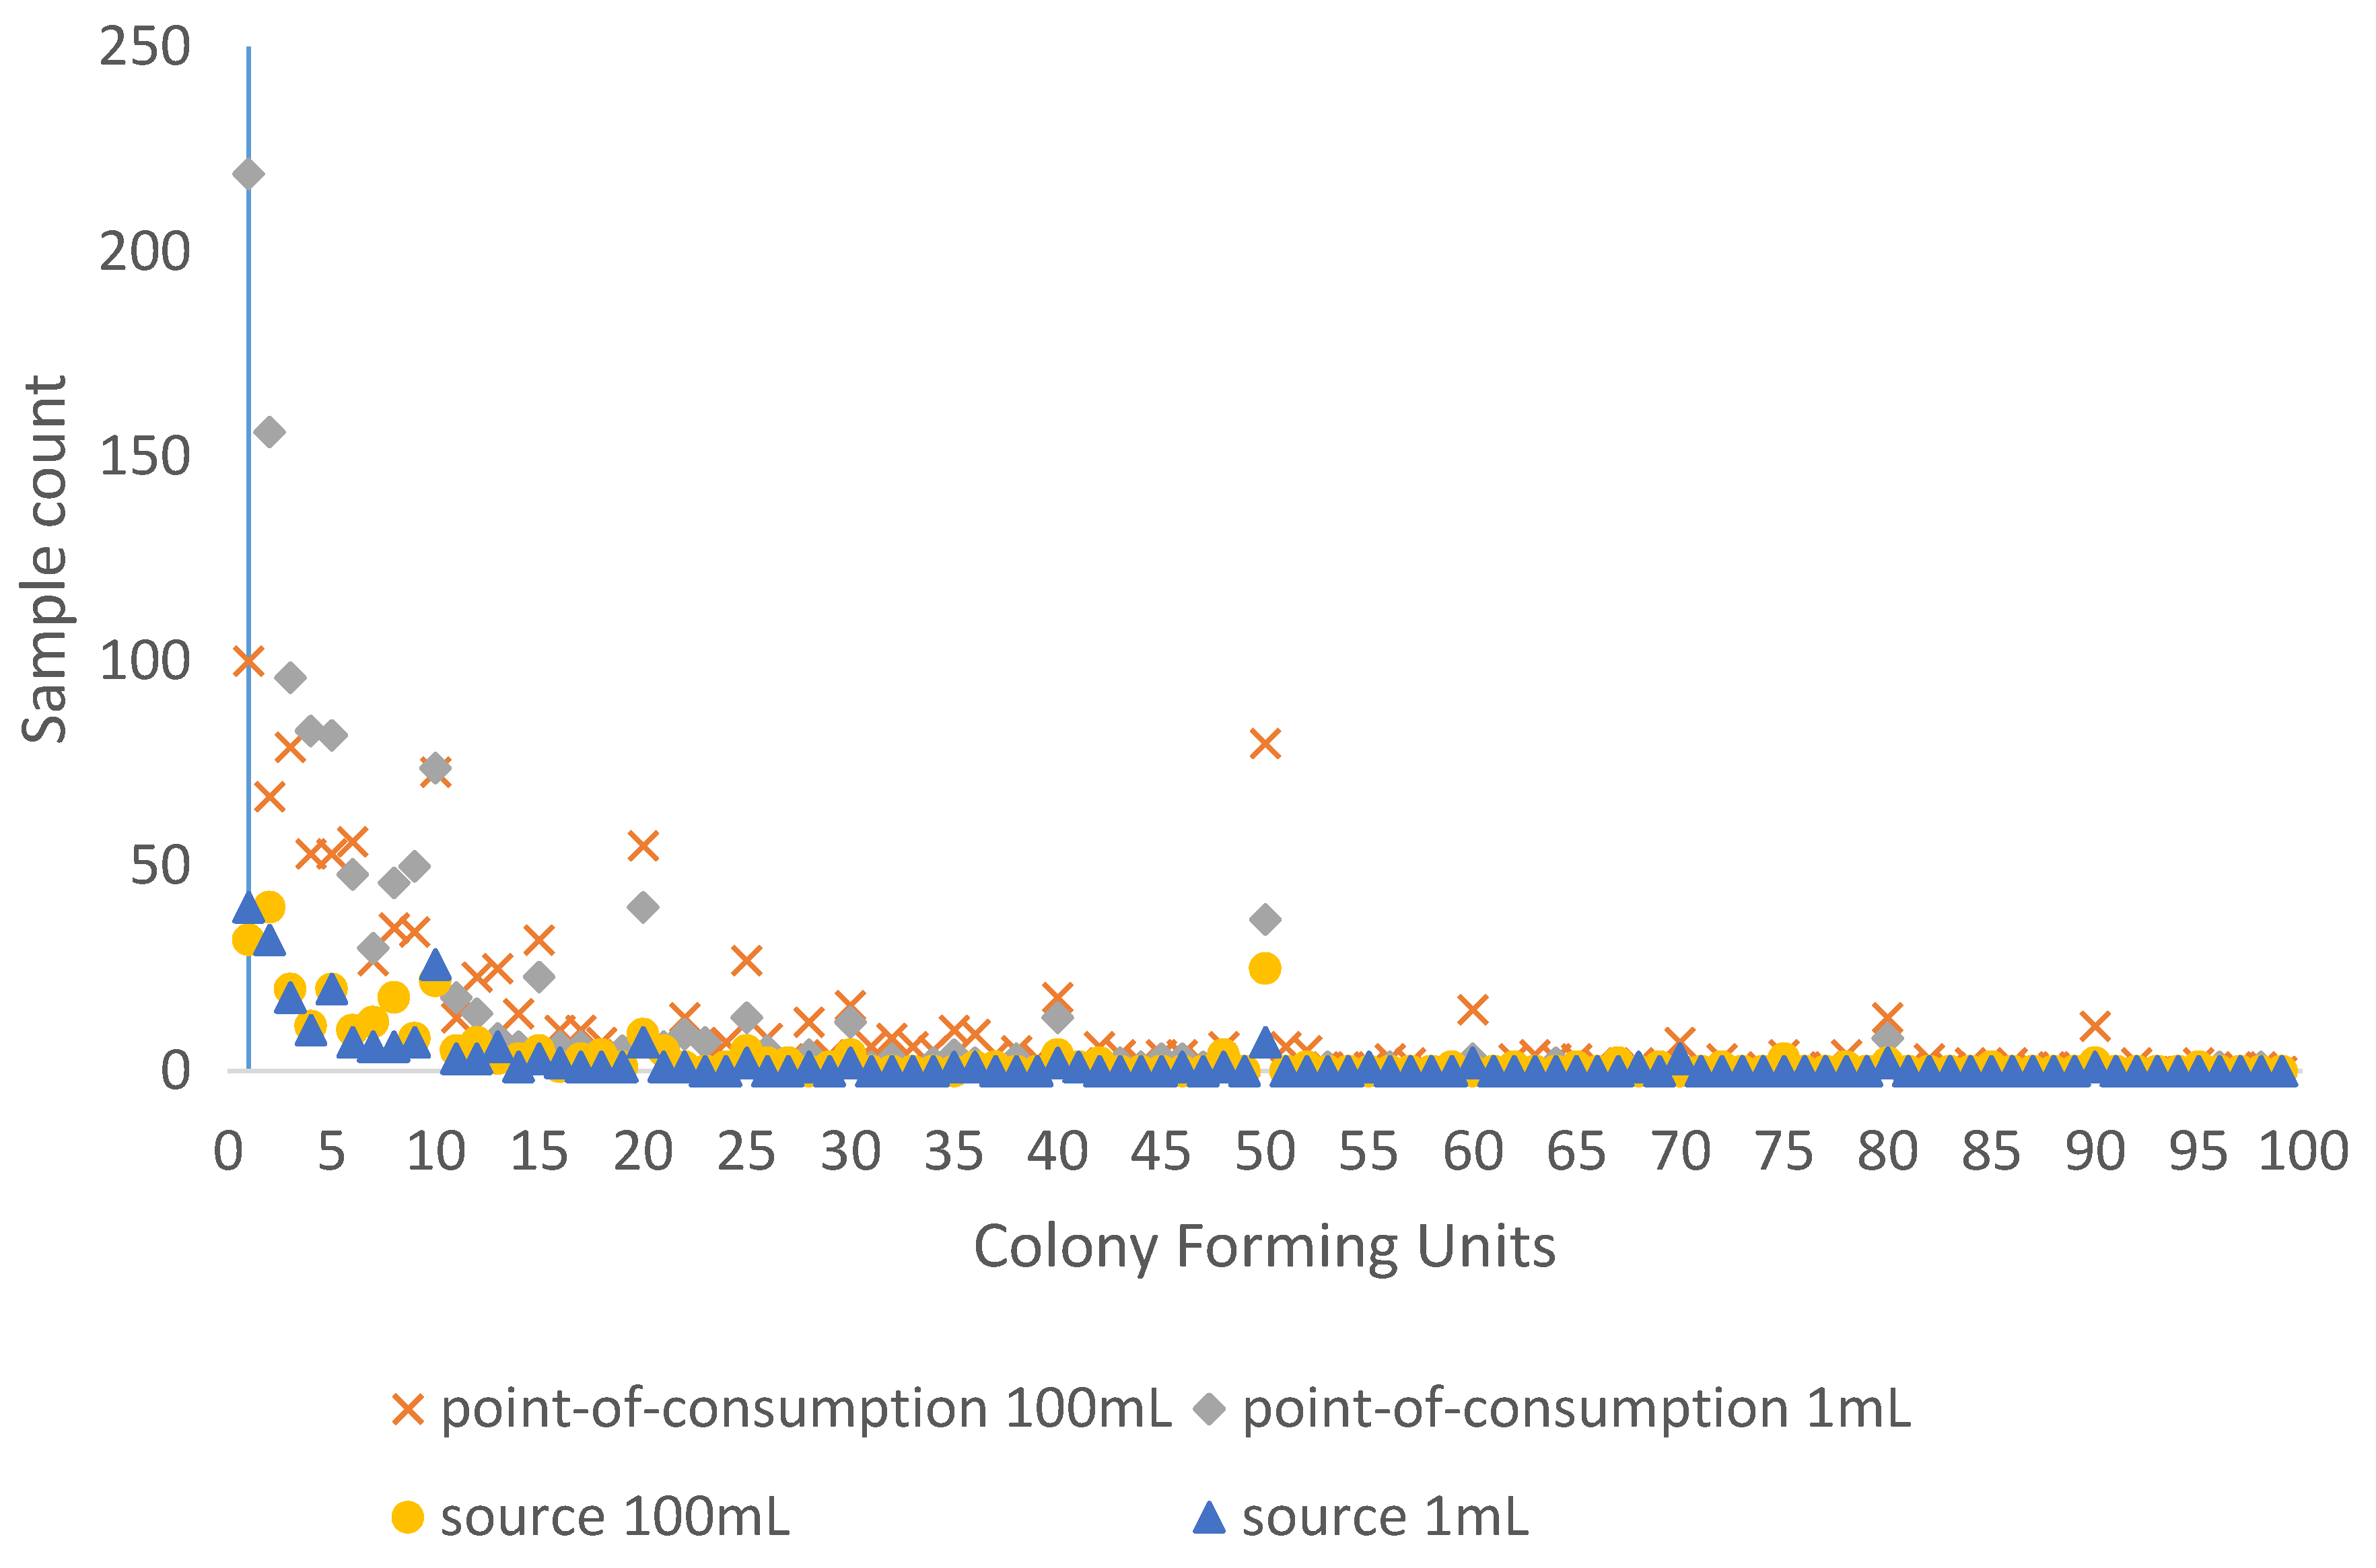
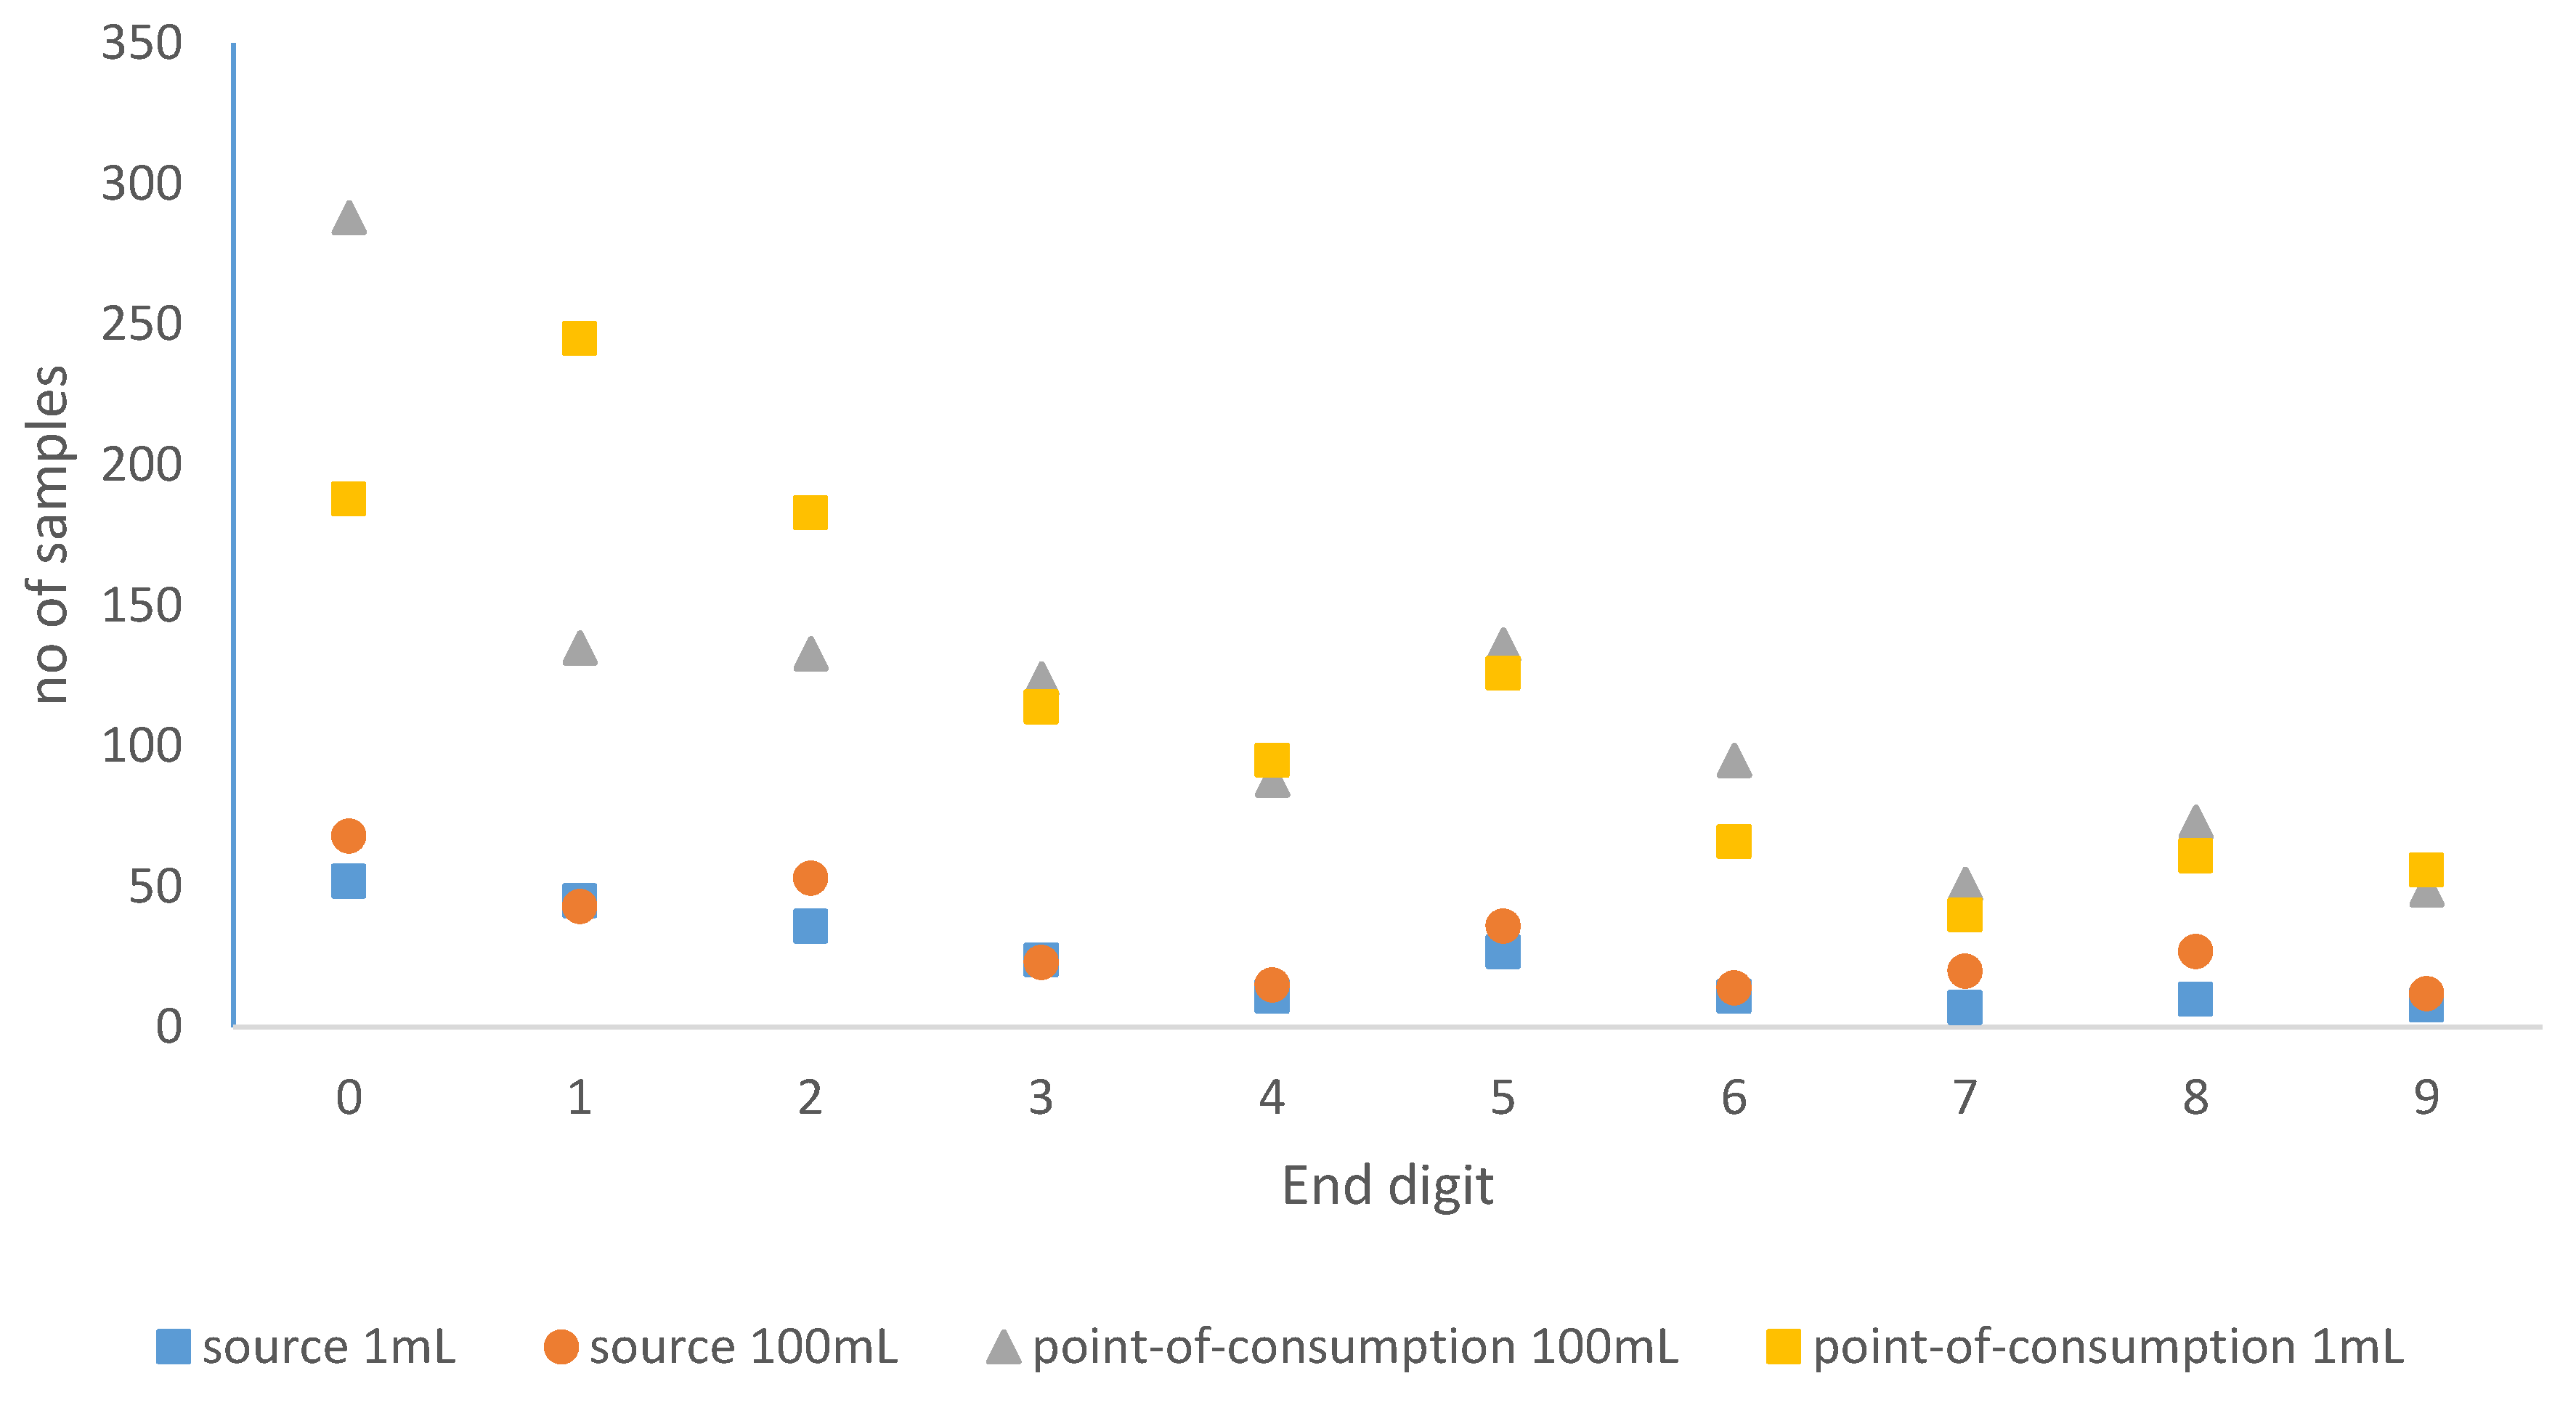
3.1. Digit Preference in Bacterial Counts

Figure 1 shows the frequency distribution of the point-of-consumption and source 1 mL and 100 mL membrane filtration cfu counts between 1 and 99. “Heaping” of samples was apparent, with many samples having cfu counts ending in a zero (e.g., 10, 20, etc.) or a five, particularly as the counts grew larger.
This pattern is confirmed by Figure 2, which shows the frequency of end digits in observed cfu counts, including only those samples with cfu counts in the range 1 to 99 (to avoid any impact of non-detects and too numerous to count (TNTC) samples). Even excluding samples with no detectable E. coli and TNTC samples, zero is by far the most popular end digit, with an apparent secondary peak in the number of samples with counts ending in five.

3.2. Risk Factors for Contaminated Water at Point of Consumption

Allowing for household non-response and other protocol deviations, water from 3096 households was tested at the point of consumption and 1066 households at source. Table 1 shows the distribution of point-of-consumption E. coli contamination (weighted percentages) in relation to a range of household characteristics, weighted by household. Given the “heaping” of sample results at 10 cfu/100 mL and 100 cfu/100 mL, we assessed risk factors for medium (1 to 72 cfu/100 mL) and high (>72 cfu/100 mL) E. coli contamination of drinking water at the point of consumption in 100 mL samples. The boundary between these classes thus avoided the “heaped” values in the cfu count distribution in Figure 1 above, and ensured roughly equal numbers of observations within each of the contamination categories. Having equal numbers reduced subsequent regression model instability arising from small cell counts in a cross-tabulation of contamination level against sample characteristics.
Relative risk ratios from univariable multinomial logistic regression analysis for each potential risk factor are shown in Table 2. Based on univariable analysis, packaged water use decreased the risk of medium or high contamination with E. coli at the point of consumption compared to water piped to the premises (relative risk ratio (RRR) = 0.30 for medium contamination and RRR = 0.06 for high contamination; p < 0.001 for both). All other water source categories were associated with increased risk (RRR > 1) of medium and high contamination at the point of consumption. Increasing expenditure (regionally deflated GH₵ per day, per adult equivalent) was associated with reduced risk of medium or high levels of contamination at the point of consumption (RRR = 0.97 for medium contamination and RRR = 0.89 for high contamination; p < 0.001 for both). RRRs for expenditure relate to a one GH₵ increase in expenditure, equivalent to approximately GB£ 0.17 or US$ 0.25. The availability of improved sanitation and soap, and residence in an urban area (compared to rural) were all associated with lower risk of contamination at the point of consumption (see Table 2). In comparison to obtaining water directly from the source, water obtained from a covered storage vessel or an uncovered storage vessel had higher risk of contamination (see Table 2).
The number of covariates included in the multivariate multinomial regression analysis had to be reduced due to collinearity between variables. Water source and expenditure were included as variables of primary interest. Improved sanitation and whether the water sample was obtained from source, or from a covered or uncovered storage vessel, were included as potential confounding factors, due to their implications for water contamination. The presence of soap was not included due to collinearity with improved sanitation; urban versus rural was not included due to collinearity with water source and other variables such as improved sanitation; water storage container was not included due to collinearity with water source; and distance between latrine and water source was not included as the main effect seen here was the protective effect of non-ground water rather than a difference in contamination depending on the distance. An interaction effect was included between expenditure and water source, to examine any SES-related differences in the relationship between sachet water use and water contamination at the point of consumption.
After controlling for confounding between measured household characteristics, use of packaged water (relative to water piped to the premises) had a protective effect against medium and high levels of E. coli contamination of point-of-consumption samples (RRR = 0.18 for medium contamination and RRR = 0.04 for high contamination; p < 0.001 for both; see Table 3). Surface water use was associated with the largest risk of high levels of E. coli contamination of samples (RRR = 42.01, p < 0.001). In addition, use of protected wells (RRR = 9.32, p = 0.004), unprotected wells or springs (RRR = 10.27, p < 0.001), boreholes (RRR = 6.36 (community operated); RRR = 6.86 (NGO operated); 8.68 (other providers); p < 0.01 for each) and standpipes, tanker water or water piped to a neighbour’s home (RRR = 8.37, p < 0.001) were significant risk factors for high levels of E. coli contamination at the point of consumption; and use of water from standpipes, tankers or water piped to a neighbour’s home (RRR = 2.37, p = 0.02) or NGO-operated boreholes (RRR = 2.85, p = 0.05) were also significant risk factors for medium levels of contamination. Increased expenditure was correlated with a decreased risk of medium or high level contamination, although after inclusion of an interaction term, the main effects were not statistically significant (RRR = 0.98, p = 0.08 for medium contamination and RRR = 0.98, p = 0.22 for high contamination). There was a significant interaction effect between expenditure and the surface water use for high contamination, suggesting that the protective effect of increasing expenditure was stronger for households using surface water sources (RRR for the interaction effect = 0.89, p = 0.009). There were no significant interaction effects detected for the other water source categories. Improved sanitation was not statistically significant in the multivariable model (RRR = 0.82, p = 0.26 for medium contamination and RRR = 0.90, p = 0.56 for high contamination). Water taken from an uncovered storage vessel (versus directly from source) was a significant risk factor for high levels of E. coli contamination at the point of consumption (RRR = 2.82, p = 0.03); while water taken from a covered storage vessel was protective of high levels of contamination (RRR = 0.60, p = 0.02).
The removal of potentially erroneous observations reduced the dataset to a sample size of 2647 (from 2972). The model parameters using the reduced dataset are shown in supplementary information Table S1. In brief, the results altered as follows: improved sanitation and water obtained from community-operated boreholes were significantly associated with the risk of medium contamination (RRR for improved sanitation = 0.69, p = 0.05; RRR for community-operated boreholes = 3.33, p = 0.002), and obtaining water from an uncovered storage vessel was not significantly correlated with high levels of contamination using the reduced dataset (RRR for water from an uncovered vessel = 1.93, p = 0.12). In addition, there was a significant interaction between expenditure and NGO-operated boreholes (RRR for the interaction effect = 0.89, p = 0.04), indicating that the protected effect of increased expenditure against medium-level contamination was stronger for water obtained from NGO-operated boreholes. The relationships between contamination levels and other covariates remained broadly unchanged, although confidence intervals were wider due to the smaller sample size. We also explored the impact of introducing an additional low contamination banding into our multivariate analysis of E. coli counts (Tables S2–S4). Results were similar to the analysis with fewer contamination bandings.

3.3. Risk Factors for Purchasing Contaminated Sachet Water

Based on the results of multivariable logistic regression analysis, the presence of detectable E. coli contamination of sachet water (where samples were taken directly from the source, the sachet itself) was not significantly associated with rural versus urban areas, geographical region or expenditure (p > 0.05; Table 4). Overall, 19.7% of “source” sachet samples contained detectable E. coli.

4. Discussion

This analysis suggests that E. coli contamination patterns in the GLSS6 are plausible and broadly consistent with evidence from elsewhere. For example, systematic review evidence suggests household stored water is often more contaminated than water taken directly from the source [4,5], and in the GLSS6, uncovered stored water was associated with higher contamination (Table 2 and Table 3). The relative extent of E. coli contamination across the different source types is also broadly consistent with recent systematic review evidence [8], in that there was some contamination even among “improved” sources such as piped supplies and boreholes.
The findings also broadly support the WHO/UNICEF Joint Monitoring Programme (JMP) “ladder,” which differentiates surface water from other unimproved sources such as unprotected wells, and piped water to the premises from other forms of improved supply. This “ladder” forms the basis for proposed post-2015 monitoring of differing levels of service access, over and above “improved” versus “unimproved” water sources [19]. In the GLSS6 data, surface water was associated with the greatest risk of high levels of E. coli contamination at the point of consumption, whilst contamination risks were higher for standpipes than for water piped to the premises (Table 3). There was no evidence of borehole contamination differences between community-managed, NGO-managed and other arrangements.
The analysis suggests that among measured behaviours, packaged water use (which is predominantly sachet water) afforded the greatest protective effect against high levels of E. coli contamination of water at the point of consumption (Table 2 and Table 3). Use of packaged water reduced risk of E. coli contamination, even relative to use of piped water onto premises. Sachet samples taken directly from packaging were less contaminated than those taken from drinking cups, supporting recent work suggesting sachet contamination increases between point of manufacture and point of sale [20]. This is consistent with some evidence that packaged water has a protective effect against child diarrhoea [2]. Furthermore, since many households stored water in sachets (Table 1), it is plausible that the sachets protected against recontamination from handling and since, unlike bottles, sachet packaging cannot be reused, this may offer further protection against recontamination. This apparent protective effect of packaged water against contamination with E. coli suggests that restricting use of sachets (for example via a ban proposed in Ghana in 2007 as reported in [9]) could potentially have consequences for public health.
However, in absolute terms, over 30% of sachet samples tested positive for E. coli, a proportion greater than that reported in any of the sachet water studies included in a recent systematic review [8].
Packaged water is often drunk directly from the packaging, although the water can also be decanted into a glass or bottle (e.g., for consumption by a child): thus, the method of sampling from a glass may not be as representative of the conditions at the point of consumption as the other water source categories which would mostly be consumed from a glass. This is unlikely to impact the overall results, although there is the potential for overestimation of point-of-consumption contamination of packaged water due to contamination of the drinking vessel used to provide the sample.
There is no evidence here that poorer households are differentially exposed to contaminated packaged water (Table 1) as hypothesised previously [10], though there is evidence that households with low expenditure using surface waters are more exposed to contaminated water at the point of consumption (Table 3). This latter finding supports the suggestion that socio-economic inequality in safe water access may be even more pronounced if water quality is taken into account in addition to water source type [6].
The membrane filtration results presented here show evidence of digit preference (Figure 1 and Figure 2), which may reflect the field-based rather than laboratory-based testing undertaken. Whilst there is a long history of examination of digit preference to assess the quality of demographic data [21] and clinical data such as blood pressure readings [22], there are few if any published studies examining digit preference in microbiological data from water samples. In the absence of other studies of digit preference in water microbiology data, we cannot ascertain whether the problem is particularly pronounced in this dataset. This apparent digit preference in cfu counts has a number of implications. Many studies (e.g., [23,24,25,26] report water quality data in risk bandings of 1–10 or 1–9 cfu/100 mL, 11−100 or 10–99 cfu/100 mL, and greater than 99 or 100 cfu/100 mL. Despite this banding, systematic reviews have found no evidence for increased risk of diarrhoeal disease as cfu/100 mL values increase above 1 cfu/100 mL [25,27], so these categories are essentially arbitrary. Where there is digit preference because those interpreting membrane filtration results round cfu counts to pleasing numbers, these arbitrarily chosen risk interval boundaries may be inappropriate. This is because the interval boundaries fall at the “heaped” values of 10 and 100 and these rounded values will all be assigned to either the higher or lower class. Choosing alternative risk band boundaries that do not end in zero would avoid this issue, as would using smoothing or related techniques [28] to redistribute “heaped” values prior to reporting. As in demography and clinical medicine, it may be that analysis of end digits could be used more widely as a quality control measure in examining membrane filtration results.
These findings are subject to several sources of uncertainty, most notably with the field-based testing for E. coli. Problems have been noted with the field implementation of the GLSS6 [11]. For example, some of the quality control measures were inconclusive because of inconsistent recording of “blank” sample results and a lack of capacity in laboratories scheduled to undertake duplicate testing. In addition, consistency checks between the 100 mL and 1 mL samples resulted in the exclusion of approximately 10% of the overall sample. This may be due to errors in the testing procedure or recording of results, although assumed inconsistencies between the two samples may also arise due to chance, particularly where the level of contamination is low. The regression results did not change substantially after removing these potentially erroneous results.
More generally, this analysis focused only on E. coli as faecal indicator bacteria, but the relationship between indicator bacteria and pathogen presence is complex [29]. One review [30] found that E. coli counts were correlated with intestinal pathogens in only 11 out of 40 studies of recreational or drinking waters. Moreover, there is evidence from tropical environments that E. coli can originate from non-faecal sources [31], and that its regrowth in such environments can be affected by parameters such as soil moisture [31]. On the other hand, E. coli may be attenuated or inactivated in the environment more rapidly than some pathogens, so the absence of E. coli does not guarantee the absence of pathogens. In part for these reasons, epidemiological evidence linking diarrhoeal disease risk to E. coli in drinking water is mixed. Despite some studies showing no apparent relationship, a meta-analysis found a pooled association between diarrhoea and E. coli presence from 14 studies [27]. Thus, whilst for logistical and budgetary reasons a household survey module necessarily has to concentrate on a very limited set of water quality parameters, E. coli remains the principle recommended water quality parameter [13]. Because of the need to conduct tests in remote locations lacking laboratory infrastructure, Compact Dry EC media were used to enumerate E. coli rather than a standard method. Although this is one of 20 products identified as suitable for E. coli enumeration in remote or resource-poor settings [32], there remain few comparative evaluations of such field methods and none of the Compact Dry EC media.
The small number of “source” samples taken directly from sachets (i.e. without transferring to a drinking vessel) limits any ability to detect differences in exposure among rich versus poor sachet users. Similarly, the small proportions of households practicing behaviours such as home water treatment also limit our ability to detect their water quality impacts. Confounding may also affect this cross-sectional survey. Sachet use is predominantly an urban phenomenon, particularly in Greater Accra, and may be associated with other unmeasured factors that protect against point-of-consumption water contamination in urban areas. Several potential predictors of contamination, such as piped supply interruptions [3], residual-free chlorine [5,8], the characteristics of the cup or glass used to serve water [33] and sachet water brands [10], were either not recorded in the GLSS6 or recorded too inconsistently to be usable. Although sachet use is less common in rural areas, univariate analysis indicated that the quality of sachet water in rural areas was comparable to, or better than, the quality of sachet water in urban areas (67% of sachet samples in urban areas and 81% of sachet samples in rural areas were uncontaminated by E. coli). There are some additional influences on water contamination not considered in this manuscript, notably rainfall patterns [34] and seasonality. There would be some potential to expand the set of risk factors for contamination considered in this analysis, though this would require spatial linkage to gridded rainfall and other datasets and the lack of detailed spatial representation in the GLSS6 somewhat restricts such analysis.
Given these issues, we propose several revisions to any future water quality module implemented alongside a household survey. Firstly, field-based quality control measures should be consistently implemented and recorded. Field teams should routinely analyse field blanks (water known to be free of E. coli contamination), with at least one blank per ten actual tests. Secondly, where non-technical staff are conducting the water quality test, they should be supported by local water quality laboratory workers. These laboratory workers should at a minimum participate in training sessions, and if possible also visit field teams during data collection to ensure that field staff are correctly and consistently following standard operating procedures. Ideally, a subset of duplicate samples should be sent on ice to laboratories for cross-checking analysis, within 24 h of collection. If this is logistically infeasible, a smaller number of samples collected from sites close to the laboratories could be cross-checked. Finally, data quality checks should be implemented alongside data collection (including comparison of 1 mL and 100 mL sample results, and examination of digit preference patterns), to identify any substantial variation between different testing teams and to take appropriate corrective measures while field work is still underway. A further challenge to be addressed is the identification of an appropriate statistical distribution for a given bacterial density dataset, where digit preference exists. This would enable the subsequent identification of statistically significant differences in replicate sample results as an additional quality control measure.

5. Conclusions

Our analysis suggests that microbial data collected through a nationally representative household survey module follow plausible patterns and provide evidence to support the current “ladder” of water source types used in international monitoring of safe water access. Some revisions to the survey module protocol are however recommended. Relative to household use of water piped to the premises, use of packaged water had a large protective effect against high levels of E. coli contamination at the point of consumption. This suggests that from a public health perspective, policy measures that seek to limit packaged water consumption, such as the outright bans that have sometimes been proposed, could potentially increase population exposure to microbial contamination. However, even among sachets, over 30% of point-of-consumption samples tested positive for E. coli, suggesting a need for greater regulatory oversight of this industry and safer sachet handling in the home. Our analysis also identifies the presence of digit preference in microbial data, which—if present in other membrane filtration datasets—has implications for the way such data are analysed and presented.

Supplementary Materials

The following are available online at www.mdpi.com/1660-4601/13/3/303/s1, Table S1: Multivariable multinomial regression results, excluding observations with potential errors; Table S2. Descriptive statistics for E. coli contamination of water at the point of consumption, n = 2972. Table S3. Relative risk ratios for low (1 to 12 cfu/100 mL), medium (13 to 72 cfu/100 mL) and high (>72 cfu/100 mL) contamination of water at the point of consumption with E. coli derived from univariable multinomial regression analysis. Table S4. Relative risk ratios for low (1 to 12 cfu/100 mL), medium (13 to 72 cfu/100 mL) and high (>72 cfu/100 mL) contamination of drinking cup water with E. coli derived from multivariable multinomial regression analysis.

Acknowledgments

This research was funded by the UK Medical Research Council and Department for International Development under the Public Health Intervention Development programme (ref: MR/M008940/1). We also wish to acknowledge the Ghana Statistical Services for the provision of the dataset.

Author Contributions

Mawuli Dzodzomenyo, Genevieve Aryeetey, Allan Hill, Richard Adanu and Jim Wright conceived and designed the experiments, and Richard Johnston designed the GLSS6 water quality module and worked with GSS to implement and analyse the module; Nicola A. Wardrop and Jim Wright analysed the data, drawing on code from Richard Johnston; Jim Wright wrote the paper. The authors alone are responsible for the views expressed in this article and they do not necessarily represent the views, decisions or policies of the institutions with which they are affiliated.

Conflicts of Interest

The steering committee for this project included representation from the National Association for Sachet and Packaged Water Products. No financial or in kind contributions were received, and other than providing comments on the analysis, the steering committee played no role in study design, data collection and analysis, decision to publish, or preparation of the manuscript. The funding sponsors had no role in the design of the study; in the collection, analyses, or interpretation of data; in the writing of the manuscript, and in the decision to publish the results.

References

  1. UN-Habitat. The State of African Cities 2014: Re-Imagining Sustainable Urban Transitions. Available online: https://issuu.com/unpublications/docs/9789210575614 (accessed on 4 December 2015).
  2. Stoler, J.; Fink, G.; Weeks, J.R.; Otoo, R.A.; Ampofo, J.A.; Hill, A.G. When urban taps run dry: Sachet water consumption and health effects in low income neighborhoods of Accra, Ghana. Health Place 2012, 18, 250–262. [Google Scholar] [CrossRef] [PubMed]
  3. Kumpel, E.; Nelson, K.L. Comparing microbial water quality in an intermittent and continuous piped water supply. Water Res. 2013, 47, 5176–5188. [Google Scholar] [CrossRef] [PubMed]
  4. Wright, J.; Gundry, S.; Conroy, R. Household drinking water in developing countries: A systematic review of microbiological contamination between source and point-of-use. Trop. Med. Int. Health 2004, 9, 106–117. [Google Scholar] [CrossRef] [PubMed]
  5. Shields, K.; Bain, R.E.S.; Cronk, R.; Wright, J.; Bartram, J. Association of supply type with fecal contamination of source water and household stored drinking water in developing countries: A systematic review and meta-analysis. Environ. Health Perspect. 2015, 123, 1222–1231. [Google Scholar] [CrossRef] [PubMed]
  6. Yang, H.; Bain, R.; Bartram, J.; Gundry, S.; Pedley, S.; Wright, J. Water safety and inequality in access to drinking-water between rich and poor households. Environ. Sci. Technol. 2013, 47, 1222–1230. [Google Scholar] [CrossRef] [PubMed]
  7. Ghana Statistical Service. Ghana Living Standards Survey Round 6 Main Report. Available online: http://www.statsghana.gov.gh/docfiles/glss6/GLSS6_Main%20Report.pdf (accessed on 4 December 2015).
  8. Bain, R.; Cronk, R.; Wright, J.; Yang, H.; Slaymaker, T.; Bartram, J. Fecal contamination of drinking-water in low- and middle-income countries: A systematic review and meta-analysis. PLoS Med. 2014, 11, e1001644. [Google Scholar] [CrossRef] [PubMed]
  9. Stoler, J.; Weeks, J.R.; Fink, G. Sachet drinking water in Ghana’s Accra-Tema metropolitan area: Past, present, and future. J. Water Sanit. Hyg Dev. 2012, 2, 223–240. [Google Scholar] [CrossRef] [PubMed]
  10. Stoler, J.; Tutu, R.A.; Ahmed, H.; Frimpong, L.A.; Bello, M. Sachet water quality and brand reputation in two low-income urban communities in Greater Accra, Ghana. Am. J. Trop. Med. Hyg. 2014, 90, 272–278. [Google Scholar] [CrossRef] [PubMed]
  11. Johnston, R.; Amoako-Mensah, S. Water Quality Module of the Ghana Living Standards Survey VI: Monitoring Household Drinking Water Quality through a Household Survey. Available online: http://whconference.unc.edu/files/2014/11/johnston-03.pdf (accessed on 2 March 2016).
  12. Edberg, S.C.; Rice, E.W.; Karlin, R.J.; Allen, M.J. Escherichia coli: The best biological drinking water indicator for public health protection. J. Appl. Microbiol. 2000, 88, 106S–116S. [Google Scholar] [CrossRef]
  13. World Health Organization. Guidelines for Drinking-Water Quality, 4th ed.; World Health Organization: Geneva, Switzerland, 2011. [Google Scholar]
  14. Kirkpatrick, C.; Parker, D.; Zhang, Y.-F. An empirical analysis of state and private-sector provision of water services in Africa. World Bank Econ. Rev. 2006, 20, 143–163. [Google Scholar] [CrossRef]
  15. Oluwasanya, G.; Smith, J.; Carter, R. Self supply systems: Urban dug wells in Abeokuta, Nigeria. Water Sci. Technol. 2011, 11, 172–178. [Google Scholar] [CrossRef]
  16. Litchfield, J.; Waddington, H. Migration and Poverty in Ghana: Evidence from the Ghana Living Standards Survey. Available online: http://repository.forcedmigration.org/show_metadata.jsp?pid=fmo:5625 (accessed on 4 December 2015).
  17. Christenson, E.; Bain, R.; Wright, J.; Aondoakaa, S.; Hossain, R.; Bartram, J. Examining the influence of urban definition when assessing relative safety of drinking-water in Nigeria. Sci. Total Environ. 2014, 490, 301–312. [Google Scholar] [CrossRef] [PubMed]
  18. World Health Organization. Guidelines for Drinking-Water Quality. Vol. 3—Surveillance and Control of Community Supplies; World Health Organization: Geneva, Switzerland, 1997. [Google Scholar]
  19. World Health Organization, UNICEF. Progress on Sanitation and Drinking-Water: 2015 Update and MDG Assessment; World Health Organization: Geneva, Switzerland, 2015. [Google Scholar]
  20. Fisher, M.B.; Williams, A.R.; Jalloh, M.F.; Saquee, G.; Bain, R.E.S.; Bartram, J.K. Microbiological and chemical quality of packaged sachet water and household stored drinking water in Freetown, Sierra Leone. PLoS ONE 2015, 10. [Google Scholar] [CrossRef]
  21. Spoorenberg, T. Quality of age reporting: Extension and application of a modified Whipple’s index. Population 2007, 62, 847–859. [Google Scholar] [CrossRef]
  22. Graves, J.W.; Bailey, K.R.; Grossardt, B.R.; Gullerud, R.E.; Meverden, R.A.; Grill, D.E.; Sheps, S.G. The impact of observer and patient factors on the occurrence of digit preference for zero in blood pressure measurement in a hypertension specialty clinic: Evidence for the need of continued observation. Am. J. Hypertens. 2006, 19, 567–572. [Google Scholar] [CrossRef] [PubMed]
  23. Jensen, P.K.; Jayasinghe, G.; van der Hoek, W.; Cairncross, S.; Dalsgaard, A. Is there an association between bacteriological drinking water quality and childhood diarrhoea in developing countries? Trop. Med. Int. Health 2004, 9, 1210–1215. [Google Scholar] [CrossRef] [PubMed]
  24. Brown, J.M.; Proum, S.; Sobsey, M.D. Escherichia coli in household drinking water and diarrheal disease risk: Evidence from Cambodia. Water Sci. Technol. 2008, 58, 757–763. [Google Scholar] [CrossRef] [PubMed]
  25. Gundry, S.; Wright, J.; Conroy, R. A systematic review of the health outcomes related to household water quality in developing countries. J. Water Health 2004, 2, 1–13. [Google Scholar] [PubMed]
  26. Gundry, S.; Wright, J.; Conroy, R.; du Preez, M.; Genthe, B.; Mutisi, C.; Ndamba, J.; Potgieter, N. Contamination of drinking water between source and point-of-use in rural households of South Africa and Zimbabwe: Implications for monitoring the Millennium Development Goal for water. Water Pract. Technol. 2006, 1. [Google Scholar] [CrossRef]
  27. Gruber, J.S.; Ercumen, A.; Colford, J.M., Jr. Coliform bacteria as indicators of diarrheal risk in household drinking water: Systematic review and meta-analysis. PLoS ONE 2014, 9. [Google Scholar] [CrossRef]
  28. Eilers, R.H.C.; Borgdorff, M.W. Modeling and correction of digit preference in tuberculin surveys. Int. J. Tuberc. Lung Dis. 2004, 8, 232–239. [Google Scholar] [PubMed]
  29. Gleeson, C.; Gray, N. The Coliform Index and Water-Borne Disease: Problems of Microbial Drinking-Water Assessment; CRC Press: London, UK, 2002; p. 208. [Google Scholar]
  30. Wu, J.; Long, S.C.; Das, D.; Dorner, S.M. Are microbial indicators and pathogens correlated? A statistical analysis of 40 years of research. J. Water Health 2011, 9, 265–278. [Google Scholar] [CrossRef] [PubMed]
  31. Savichtcheva, O.; Okabe, S. Alternative indicators of fecal pollution: Relations with pathogens and conventional indicators, current methodologies for direct pathogen monitoring and future application perspectives. Water Res. 2006, 40, 2463–2476. [Google Scholar] [CrossRef] [PubMed]
  32. Bain, R.; Bartram, J.; Elliott, M.; Matthews, R.; McMahan, L.; Tung, R.; Chuang, P.; Gundry, S. A summary catalogue of microbial drinking water tests for low and medium resource settings. Int. J. Environ. Res. Public Health 2012, 9, 1609–1625. [Google Scholar] [CrossRef] [PubMed]
  33. Oswald, W.E.; Lescano, A.G.; Bern, C.; Calderon, M.M.; Cabrera, L.; Gilman, R.H. Fecal contamination of drinking water within peri-urban households, Lima, Peru. Am. J. Trop. Med. Hyg. 2007, 77, 699–704. [Google Scholar] [PubMed]
  34. Howard, G.; Pedley, S.; Barrett, M.; Nalubega, M.; Johal, K. Risk factors contributing to microbiological contamination of shallow groundwater in Kampala, Uganda. Water Res. 2003, 37, 3421–3429. [Google Scholar] [CrossRef]
Figure 1. Distribution of E. coli colony-forming unit (cfu) counts from membrane filtration in the range 1 to 99cfu for 1 mL and 100 mL point-of-consumption and source water samples.
Ijerph 13 00303 g001
Figure 2. Distribution of end digits in E. coli colony forming unit (cfu) counts between 1 and 99 from membrane filtration of 1 mL and 100 mL source and point-of-consumption samples.
Ijerph 13 00303 g002
Table 1. Descriptive statistics for E. coli contamination of water at the point of consumption, n = 2972.
VariableCategoryContamination Level * (Rows Sum to 100%)n
Uncontaminated Medium High n
Total 28.0%37.3%34.7%2972
Source contamination risk factors
Water source Piped to premises34.5%49.2%16.4%240
Standpipe, tanker or neighbours tap13.8%42.2%44.0%500
Protected well11.8%31.1%57.2%101
Unprotected well or spring12.2%36.9%50.9%142
Rainwater7.1%51.4%41.6%57
Surface water5.1%17.1%77.8%315
Packaged water68.8%29.2%2.0%590
Community borehole10.7%44.1%45.2%565
NGO borehole13.6%41.9%44.6%207
Other borehole7.9%42.7%49.4%218
Missing9.7%64.5%25.9%37
Distance between latrine and water sourceWithin 30 m8.6%38.2%53.2%488
More than 30 m10.0%36.3%53.7%1097
Not ground water42.5%37.6%19.9%1387
UrbanNo15.5%36.0%48.6%1667
Yes38.4%38.4%23.3%1305
Recontamination risk factors
Improved sanitation No13.6%37.6%48.8%2076
Yes31.5%37.1%31.5%890
Missing6.3%73.0%20.7%6
Soap observedNo19.3%38.7%42.1%1765
Yes32.5%36.6%30.9%1207
Water obtained from source or vessel From source47.1%33.1%19.8%891
From covered vessel17.4%41.5%41.1%1667
From uncovered vessel6.5%27.6%65.9%295
Missing23.4%41.1%35.5%119
Water storage container Plastic bucket or container24.7%37.7%37.7%1963
Pot or earthenware vessel7.6%41.6%50.7%499
Metal container12.7%30.3%57.1%137
Other (including sachets)61.7%34.1%4.2%361
Missing59.8%40.2%0%12
Expenditure (GH₵)Mean13.39.06.5NA
Median9.06.74.9NA
Range (min–max)0.70−227.90.33−103.30.18–60.1NA
* Contamination levels: uncontaminated (0 cfu/100 mL); medium contamination (1 to 72 cfu/100 mL); high contamination (>72 cfu/100 mL).
Table 2. Relative risk ratios for medium (1 to 72 cfu/100 mL) and high (>72 cfu/100 mL) contamination of water at the point of consumption with E. coli derived from univariable multinomial regression analysis.
CovariatenCategoryMedium Contamination (1 to 72 CFU)High Contamination (73+ CFU)
RRR * (95% CI)p-valueRRR * (95% CI)p-value
Water source 2935Piped to premisesReference Reference
Standpipe, tanker or neighbours tap2.14 (1.26 to 3.64)0.0056.69 (3.57 to 12.55)<0.001
Protected well1.85 (0.76 to 4.50)0.1710.24 (4.30 to 24.39)<0.001
Unprotected well or spring2.11 (0.66 to 6.74)0.218.76 (2.67 to 28.76)<0.001
Rainwater5.10 (1.43 to 18.15)0.0112.38 (3.13 to 48.94)<0.001
Surface water2.36 (1.02 to 5.49)0.0532.28 (13.63 to 76.48)<0.001
Packaged water0.30 (0.18 to 0.49)<0.0010.06 (0.03 to 0.13)<0.001
Community-managed borehole2.88 (1.62 to 5.15)<0.0018.89 (4.68 to 16.88)<0.001
NGO-managed borehole2.17 (1.14 to 4.11)0.026.93 (3.14 to 15.27)<0.001
Other borehole3.77 (1.80 to 7.92)<0.00113.12 (5.86 to 29.37)<0.001
Expenditure2972(GH₵ per day) **0.97 (0.95 to 0.98)<0.0010.89 (0.87 to 0.92)<0.001
Improved sanitation2966NoReference Reference
Yes0.43 (0.31 to 0.59)<0.0010.28 (0.20 to 0.39)<0.001
Soap observed2972NoReference Reference
Yes0.56 (0.42 to 0.76)<0.0010.44 (0.33 to 0.58)<0.001
Water obtained from source or vessel2853From sourceReference Reference
From covered vessel3.40 (2.48 to 4.67)<0.0015.62 (3.99 to 7.91)<0.001
From uncovered vessel6.11 (2.56 to 14.60)<0.00124.29 (10.05 to 58.71)<0.001
Urban2972NoReference Reference
Yes0.43 (0.32 to 0.58)<0.0010.19 (0.14 to 0.26)<0.001
Water storage container2960Plastic bucket or containerReference Reference
Pot or earthenware vessel3.57 (2.23 to 5.72)<0.0014.35 (2.69 to 7.02)<0.001
Metal container1.56 (0.81 to 2.99)0.182.94 (1.60 to 5.38)0.001
Other (including sachets)0.36 (0.25 to 0.53)<0.0010.04 (0.02 to 0.09)<0.001
Distance between latrine and water source2972Within 30 mReference Reference
More than 30 m0.82 (0.48 to 1.39)0.450.87 (0.52 to 1.45)0.60
Not ground water0.20 (0.12 to 0.32)<0.0010.08 (0.05 to 0.12)<0.001
* RRR = relative risk ratio. ** RRRs for expenditure relate to a GH₵1 increase in expenditure.
Table 3. Relative risk ratios for medium (1 to 72 cfu/100 mL) and high (>72 cfu/100 mL) contamination of point-of-consumption drinking water with E. coli derived from multivariable multinomial regression analysis.
CovariateCategoryMedium Contamination (1 to 72 CFU)High Contamination (73+ CFU)
RRR * (95% CI)p-ValueRRR * (95% CI)p-Value
Constant 2.79 (1.36 to 5.74)0.0051.14 (0.45 to 2.94)0.78
Water sourcePiped to premisesReference Reference
Standpipe, tanker or neighbours tap2.37 (1.17 to 4.83)0.028.37 (3.44 to 20.34)<0.001
Protected well0.96 (0.28 to 3.33)0.959.32 (2.07 to 41.91)0.004
Unprotected well or spring2.13 (0.66 to 6.90)0.2110.27 (2.81 to 37.46)<0.001
Rainwater2.67 (0.16 to 44.15)0.4915.73 (0.90 to 276.53)0.06
Surface water2.17 (0.73 to 6.45)0.1642.01 (12.73 to 138.63)<0.001
Packaged water0.18 (0.09 to 0.37)<0.0010.04 (0.01 to 0.15)<0.001
Community-managed borehole2.02 (0.97 to 4.21)0.066.36 (2.49 to 16.26)<0.001
NGO-managed borehole2.85 (1.01 to 8.03)0.056.86 (1.78 to 26.52)0.005
Other borehole1.77 (0.40 to 7.90)0.468.68 (1.76 to 42.82)0.008
Expenditure (GH₵ per day) **0.98 (0.95 to 1.00)0.080.98 (0.94 to 1.01)0.22
Water source * expenditure interactionPiped to premisesReference Reference
Standpipe, tanker or neighbours tap0.98 (0.95 to 1.01)0.240.97 (0.92 to 1.02)0.20
Protected well1.05 (0.94 to 1.17)0.410.96 (0.84 to 1.01)0.61
Unprotected well or spring1.03 (0.91 to 1.18)0.601.01 (0.89 to 1.15)0.87
Rainwater1.04 (0.78 to 1.40)0.780.92 (0.67 to 1.25)0.59
Surface water0.97 (0.89 to 1.06)0.520.89 (0.82 to 0.97)0.009
Packaged water1.02 (1.00 to 1.05)0.101.01 (0.93 to 1.10)0.85
Community-managed borehole1.01 (0.98 to 1.04)0.431.00 (0.94 to 1.06)0.97
NGO-managed borehole0.91 (0.82 to 1.01)0.080.93 (0.82 to 1.06)0.29
Other borehole1.08 (0.90 to 1.30)0.411.02 (0.86 to 1.23)0.79
Improved sanitationNoReference Reference
Yes0.82 (0.58 to 1.15)0.260.90 (0.62 to 1.30)0.56
Water obtained from source or vesselFrom sourceReference Reference
From covered vessel0.86 (0.59 to 1.23)0.400.60 (0.39 to 0.93)0.02
From uncovered vessel1.86 (0.76 to 4.56)0.172.82 (1.14 to 6.96)0.03
* RRR = relative risk ratio. N = 2822. ** RRRs for expenditure relate to a GH₵1 increase in expenditure.
Table 4. Multivariable logistic regression results for detectable E. coli in 100 mL samples of sachet water (samples obtained directly from the source; n = 132).
VariableCategoryOdds Ratio (95% CI)p-Value
Constant 0.12 (0.02 to 0.76)0.03
UrbanNoReference
Yes2.26 (0.48 to 10.74)0.30
RegionGreater AccraReference
Central2.55 (0.58 to 11.28)0.22
Other0.49 (0.13 to 1.83)0.29
Expenditure 0.99 (0.94 to 1.05)0.85

