Abstract
Water ecology has always been key to environmental protection, and the combination of human activities and natural factors has caused eutrophication in the Yangtze estuary and adjacent waters. Among them, dissolved oxygen (DO) concentration is the key indicator to judge the quality of water. Firstly, using principal component analysis (PCA) to determine the number of parameters affecting dissolved oxygen concentration, the least squares support vector machine (LSSVM) prediction model with improved particle swarm optimization (IPSO) is proposed to be applied to the dissolved oxygen prediction in Shanghai’s Yangtze River basin through the data-driven modeling approach and the regression prediction capability of the neural network. Eight parameters of water temperature (WT), pH, potassium permanganate (KMnO4), ammonia nitrogen (NH4+-N), total phosphorus (TP), total nitrogen (TN), conductivity (Cond), and nephelometric turbidity unit (NTU) are selected as model inputs in the published public data, and the output is the dissolved oxygen concentration. The optimal combination of model parameters is found according to the IPSO algorithm, which effectively overcomes the parameter selection problem of regular support vector machines (SVM). The mean absolute error (MAE), root mean square error (RMSE), mean absolute percentage error (MAPE), and correlation coefficients of the evaluation indexes of this model (R2) are 0.1702, 0.2221, 0.0267, and 0.9751, respectively. Compared with other similar data driven models, this model has improved model accuracy and stability in predicting DO concentrations in the estuary, and thus it provides technical support for assessing and monitoring offshore water quality.
1. Introduction
Economic development has posed a huge challenge to ecological and environmental protection, especially in the Yangtze River Delta region, where the country’s economy is leading the way. The area is both the mouth of the Yangtze River into the sea and a crucial hub for communication with the production and life of the surrounding area, which can cleanse the outer sea area and act as an ecological barrier. Therefore, it is necessary to obtain and accurately predict the water quality in time. Dissolved oxygen (DO) concentration is a key assessment indicator in evaluating water quality, which determines the life state of aquatic animals. There are a multitude of factors affecting DO [1], which are prone to change when the environment (temperature, atmospheric pressure, human factors, etc.) changes. For example, DO concentration shows periodic changes over time due to the change of temperature and air pressure every day. Even in the same region, there are obvious differences in DO content between upper and lower levels. The fluctuation of DO is minor in sunny and windy weather, and the absorption capacity of water to oxygen is reduced in rainy weather. For the protection and treatment of the water environment, researchers pay more and more attention to exploring the factors affecting DO. Sun et al. [2] investigated the factors affecting DO in the coastal waters of the Yangtze River estuary and found that photosynthesis of plankton active in the season was the main factor leading to DO saturation. Wei et al. [3] pointed out that the consumption of DO mainly comes from the nitrification and denitrification of ammonia nitrogen and the decomposition process of organic matter. It can be seen that the prediction of DO should be studied regionally, and the model for predicting DO is a nonlinear system, so it is of great practical importance to establish a stable and accurate model.
The water environment is a complex system influenced by multiple factors and conditions, exhibiting seasonal periodicity and uncertainty [4]. The result is that traditional measurements using a single sensor are prone to missing, invalid, and low confidence data, and classical mathematical models have difficulty simulating the whole process. In recent years, intelligent techniques have emerged in predictive modeling. In a review of artificial intelligence modeling research results in the first two decades of the 21st century by Tung [5], it was shown that, with the development of data-driven modeling techniques, machine learning tools can better and faster solve the problem of accurate prediction of dissolved oxygen studied in this paper. It has also been verified in the studies of abounding scholars: Li [6] verified the feasibility of machine learning for aquaculture water quality prediction, and the support vector machine (SVM) exhibited optimal results. Yang et al. [7] used machine learning methods to build a Shenzhen Bay DO model and used Pearson correlation analysis to find the optimal input conditions for the model. However, single models suffer from poor generalization ability and insufficient accuracy, and are prone to getting stuck in local optima. When experimenting with small samples with poor data, the results generally struggle to meet the needs of practical applications, which can be avoided to some extent by using a joint model approach. Determining the number of parameters is usually carried out using principal component analysis (PCA), and the results obtained are more in line with objective reality [8]. Liu’s team [9] used a modified cultural artificial fish swarm algorithm to optimize a combination of least squares support vector machine (LSSVM) hyperparameters to achieve better prediction results in river crab pond culture. In terms of model parameter selection, Shi et al. [10] proposed to optimize the support vector regression machine using a particle swarm optimization (PSO) algorithm to effectively solve the problem of redundancy among dissolved oxygen variables. Similarly, Tang [11] verified the function optimization role of PSO, and the results showed that the combined algorithm improved the performance of SVM modeling.
In summary, this paper proposes a joint prediction model with the improved PSO algorithm combined with LSSVM, which is applied to the prediction of dissolved oxygen of water quality in Shanghai with real watershed water quality test data. It can provide a reference basis for forecasting the water environment prediction in the Yangtze River estuary basin and provide technical support for monitoring eutrophication in offshore waters.
2. Materials and Methods
2.1. LSSVM Theory
LSSVM, based on statistical theory [12], is a supervised learning algorithm that was originally established to solve the linear partitioning problem in two dimensions, in order to make the similarity between samples of the same type as large as possible and thus improve the generalization ability of the model [13]. In solving the nonlinear problem of predicting DO, the optimal decision function is constructed by mapping the original data to a linear problem via a mapping function that maps the original data to a high-dimensional space:
where is the weight vector; is the offset; and is a nonlinear mapping function from low to high dimensions. LSSVM improves on the constraints of the standard SVM, retaining all its advantages [14]. The problem is transformed into the solution of a set of equations for better sample prediction. The optimization equation for LSSVM is formulated as follows:
where is a relaxation variable for flexible segmentation and is a regularization parameter that controls the degree of penalty for error, both of which are used to improve model flexibility; constraints and are the input and output vectors of the model, respectively. In order to solve the optimization of the constraints in Equation (2), the Lagrange multiplier is introduced and written as the corresponding Lagrangian function:
By introducing a kernel function, the nonlinear problem is transformed into a linearly differentiable mathematical model, which solves the practical problem in the small sample case. Different kernel functions have some influence on the performance of the model. Therefore, this experiment uses the radial basis function (RBF), which is widely used in practice and cleverly avoids the complications of vector mapping, with the following equation:
where is the kernel width, which determines the complexity of the mapping. Finally, Equation (1) is transformed into Equation (5), and the following LSSVM regression model is constructed:
The LSSVM regression prediction model is similar to the artificial neural network, and the structure is shown in Figure 1.
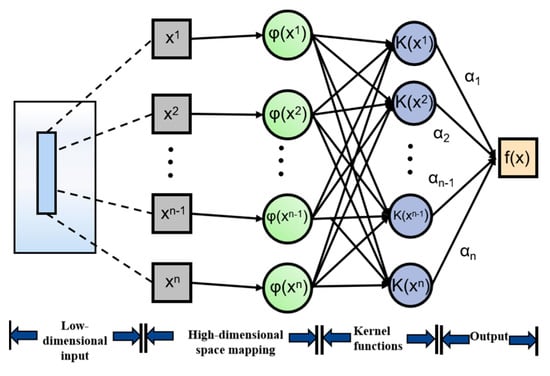
Figure 1.
LSSVM model structure.
In addition, the performance of LSSVM depends considerably on the choice of parameters, and it was found during the experiments that improper parameter regularization makes it difficult to achieve the desired results. Grid search method [15], K-fold cross-validation method, simulated annealing algorithm, PSO algorithm, and genetic algorithm are commonly used to search the parameters. In contrast, PSO is a global search algorithm that requires fewer parameters to be tuned and has positive optimization performance. Thus, in this study, the modified PSO algorithm is used for parameter optimization of LSSVM.
2.2. Function Optimization Based on PSO Algorithm
The principle of PSO is based on the intelligent optimization of population iteration, which can be used for parameter meritocracy to achieve the effect of optimizing the model. The “particle” is the basic unit of the algorithm population, represented by a point in the dimensional space, representing the potential solution for each optimization, and the fitness function Equation (6) is used to evaluate the merit of the current point position:
The migration process of each particle is represented by two variables and , where is the -dimensional position vector of the th particle, is the flight velocity of particle , and is the optimal position searched for by particle at this moment. The process of particle swarm migration is updated according to the fitness value with a certain orientation. In each iteration, the velocity and position are updated according to Equations (7) and (8):
where denotes the th dimension of the particle; the quantity is the number of iterations; is the optimal position to search for the entire particle population; and are learning factors, where regulates the steps of particle motion towards its own best position and regulates the steps of particle motion towards the global best position, which can be properly tuned to avoid the model from falling into local minima and increase the convergence rate; and and are random numbers of [0, 1], which are used to maintain the diversity of the population.
Applying the PSO algorithm to function optimization has the advantage of smaller parameter settings and faster convergence. However, function optimization is a highly complex problem, and PSO still suffers from some limitations during the optimization process and is prone to get trapped in local optima with loss of population diversity at late iterations. Therefore, various improved PSO algorithms [16,17] or fusion with other intelligent algorithms [18,19] have been generated. To overcome the limitations of the PSO algorithm without losing its advantages, a PSO algorithm with a convergence factor is provided [20] (IPSO). At this point, Equation (7) is improved as follows:
where is the convergence factor and . Experiments show that the PSO algorithm with the increased convergence factor performs better than the PSO algorithm with the modified weights. The flowchart of the IPSO algorithm is shown in Figure 2.
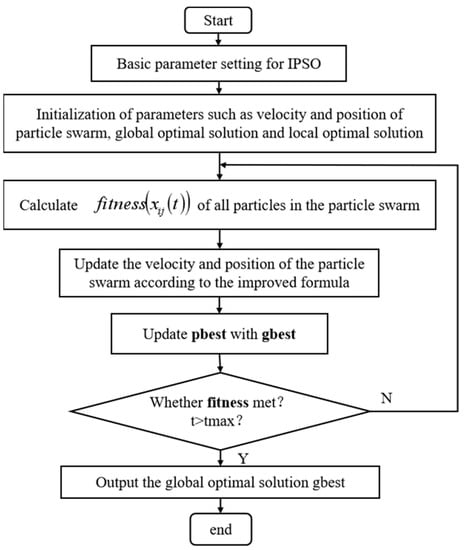
Figure 2.
IPSO function optimization flow chart.
3. Case Study
3.1. Data Source and Pre-Processing
Shanghai is located on the Yangtze Delta Plain, at the mouth of the Yangtze River, and has a subtropical monsoon climate. Located in the first economic zone of China, with the elevated intensity of human intervention and an increasingly fragile ecological environment, an accelerating trend, it has become a new ecological and environmental fragility zone in China [21]. In particular, a nationwide drought that will occur in the summer of 2022 has already caused a back-up of seawater at the mouth of the Yangtze River, which will affect the water problems of the population to some extent.
The experimental data were obtained from the China General Environmental Monitoring Station (http://www.cnemc.cn/). A total of 21 sections in Shanghai were provided with detailed data, as shown in Figure 3. These include the Yangtze River Basin and Taihu Lake Basin, shown in blue and orange, respectively.
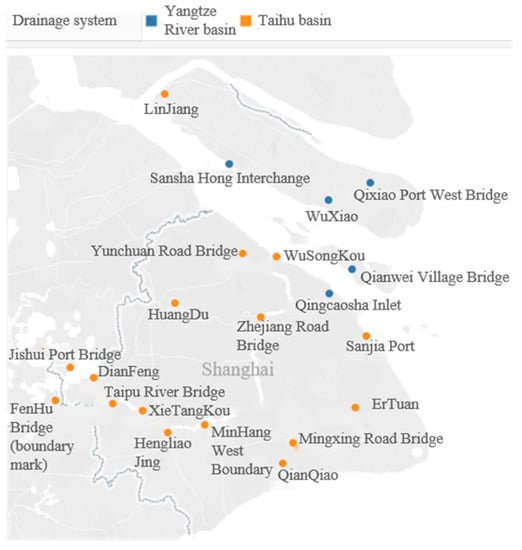
Figure 3.
Map of geographical location of study area and detection section points.
Since the research object of this experiment is the Yangtze River estuary basin, water quality records of 432 samples from 16 September 2022 to 7 October 2022 were selected from four sections (Qingcaosha Reservoir data missing): Qianwei Village Bridge, WuXiao, Sansha Hong Interchange, and Qixiao Port West Bridge. The reason why we chose the data in this period as the experimental sample is that, firstly, the data itself has strong integrity and continuity. Secondly, DO, turbidity, ammonia nitrogen, and other parameters have significant seasonal differences. By comparing the results of each year, it can be found that the water quality in September and October is relatively poor and fluctuating obviously [22]. It shows that the difference between the data of the samples is obvious, and the data are more representative, which is conducive to the learning of the model. Thirdly, the size of the data samples was selected in line with the advantage that the LSSVM model is more suitable for small samples.
Owning to the fact that DO in water is easily affected by various ecological environmental factors and changes in a large range every day [23], real-time data released by monitoring sites every 4 h were used, including the nine parameters of water temperature (WT), pH, potassium permanganate (KMnO4), ammonia and nitrite (NH4+-N), total phosphorus (TP), total nitrogen (TN), electrical conductivity (Cond), nephelometric turbidity unit (NTU), dissolved oxygen (DO). Due to the wide range of water quality factors, they were generally not used directly, and the data were first normalized by Equation (10) before the start of the experiment:
where is the raw data, is the normalized data, and and are the maximum and minimum values in the data set, respectively. Since the trend of water quality changes slowly and mostly changes in cycles of days, if there are samples in the data set that deviate significantly from the before and after values, the data set needs to be pre-processed in a scientific way so as to ensure the validity of the model test [24]. The data were normalized and reflected, as shown in Figure 4a, and it can be seen that there were anomalous data in the range of 1.5 IQR for KMnO4, NH4+-N, TP, and Cond. The data sets with abnormal values were processed by multiple interpolation using IBM SPSS Statistics 26 software, and the results are shown in Figure 4b.
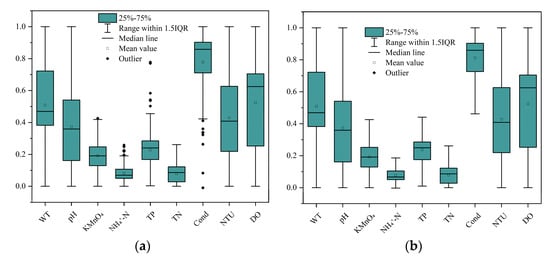
Figure 4.
Data set box diagram: (a) Original data; (b) Data after multiple interpolation method.
3.2. Determining the Environmental Factors Affecting DO
Since the water quality assessment includes multiple parameters, the number of environmental factors affecting the DO should be determined first before making predictions. According to the pre-processed data in 3.1, it was imported into SPSS by constructing a matrix with nine columns (nine kinds of indicators) × 432 (432 items) according to the time series. The Pearson correlation coefficient was used to obtain the correlation coefficient between each parameter, as shown in Table 1. In the table of phase correlation, it can be seen that DO has a significant negative correlation with WT, TP, KMnO4, and NTU, and has a significant positive correlation with pH, Cond, NH4+-N, and TN, as well as passing the 0.01 significance level test. This was validated with the eight feature factors selected as prediction model inputs in the literature [10]. Therefore, there is a good linear relationship between the original data, which is suitable for PCA for information conclusion.

Table 1.
Pearson’s correlation coefficient of each factor.
PCA was used to calculate the cumulative variance contribution rate, and the results are shown in Table 2. It can be seen that the cumulative variance contribution rate of the first three principal components (PC) is more than 75%, and the characteristic roots are all greater than 1, which meets the extraction requirements. Thus, the above eight parameters are selected as the input of the DO prediction model.
Table 2.
PCA feature extraction.
3.3. PSO-LSSVM Predictive DO Combination Model
The DO content is influenced by a number of factors and exhibits a complex nonlinear relationship. In this experiment, the PCA method is used to determine the number of feature variables, while the improved IPSO algorithm is proposed to optimize the model parameters and construct the IPSO-LSSVM prediction model. The overall procedure is shown in Figure 5, and the implementation steps are as follows:
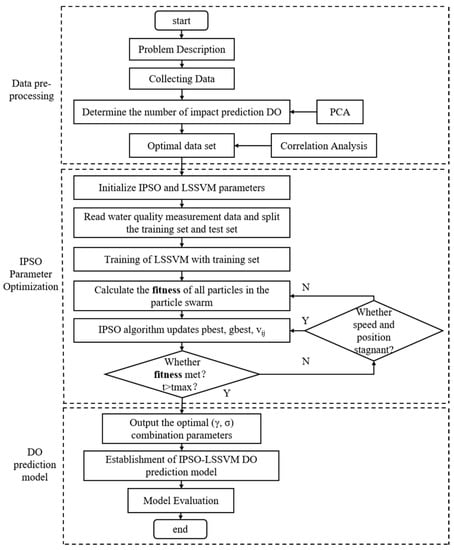
Figure 5.
This is a figure. Schemes follow the same formatting.
- 1.
- Using the 432 data samples after processing and selection, the readings were divided 7:3 into the training set (302) and test set (130);
- 2.
- IPSO with LSSVM model parameters were initialized. The number of particle populations was set to 10, the number of iterations was 50, and the learning factors and , respectively. The regularization parameters and kernel width were limited to [10, 1000], and the kernel function was RBF;
- 3.
- The fitness values of all particles in the particle swarm, IPSO algorithm updates pbest and gbest, as well as position and velocity were calculated;
- 4.
- The optimal value obtained by the IPSO algorithm was substituted into the LSSVM model to establish the IPSO-LSSVM dissolved oxygen prediction model. The model was validated using a test set to obtain prediction results and its performance was evaluated using the model evaluation metric.
4. Results
4.1. Model Prediction Results
In this study, PCA is applied to select the number of parameters that affect the DO, Pearson’s correlation coefficient is calculated to determine the correlation between the input parameters and the predicted target, and the IPSO-LSSVM model is used to predict the DO. Monitoring data from 16 September to 7 October 2022 were selected, with the first 70% used to train the model and the second 30% used for prediction. Simulation experiments in a development environment with the programming language MATLAB show fluctuations in the results due to the random selection of samples in the training and test sets to ensure the validity of the training results. The predictions of the models presented in this paper are roughly consistent with the true values, and the overall trends are in excellent agreement with the actual values. The visualization results of the predicted and true value fitting curves for the model test set are shown in Figure 6. To more visually represent the relationship between the predicted and true values, the two are subjected to a linear regression analysis, as shown in Figure 7. The blue point is the total sample point, and the red line is the fitting curve of the blue point, which can reflect the deviation degree and change trend of the predicted value compared with the real value. It can be clearly seen from the fitting equation that the two are very close to each other. The fitness curves of the models that can be obtained based on the fitness function are shown in Figure 8. As the number of iterations increases, the fitness of the model continuously decreases, decreases rapidly, and then remains stable.
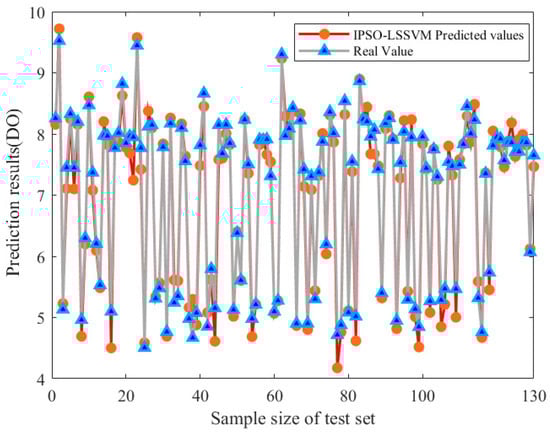
Figure 6.
Results of IPSO-LSSVM prediction DO.
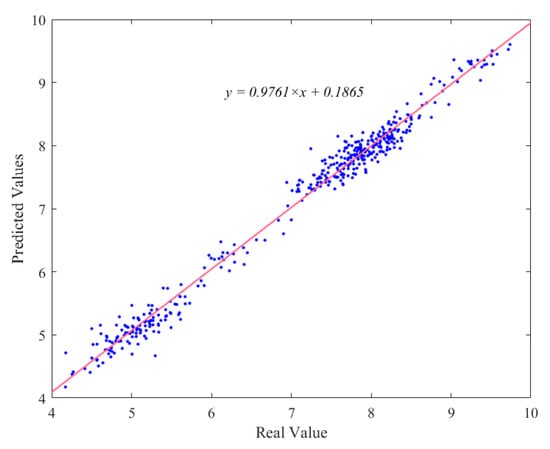
Figure 7.
Prediction fitting diagram.
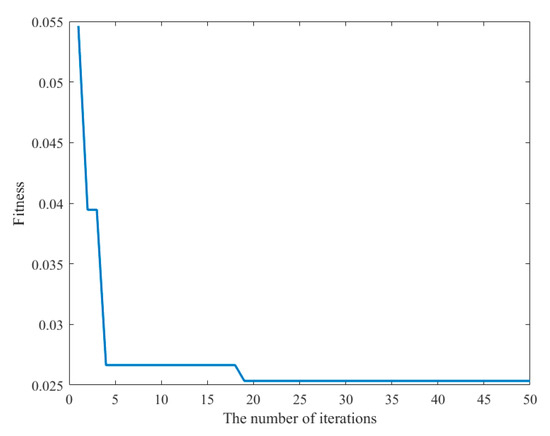
Figure 8.
The fitness curve of IPSO-LSSVM.
4.2. Model Comparison
To further validate the advantages and disadvantages of the IPSO-LSSVM model, Bp neural network, SVM, LSSVM, PSO-LSSVM, and IPSO-LSSVM models are constructed to predict DO using the same data samples, respectively. Figure 9 shows the experimental results for the different models. The blue triangle represents the actual true value, and the orange circle represents the corresponding model predicted value. The approximate effect of the prediction method can be seen from the closeness of the two, and the closer the two are, the smaller the error of the model is and the higher the accuracy is. For example, in Figure 9a–c, compared with Figure 9d,e, the accuracy can be seen to be significantly different. Since the final result is still not intuitively reflected in the dot plot, the evaluation index of specific values will be more obvious in the following analysis.
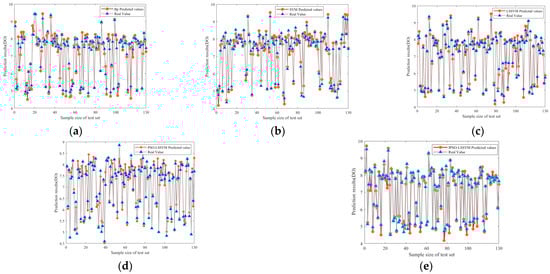
Figure 9.
Comparison of experimental results: (a) Bp neural network; (b) SVM; (c) LSSVM; (d) PSO-LSSVM; (e) IPAO-LSSVM.
4.3. Model Evaluation
The experimental results are evaluated using four indicators: mean absolute error (MAE), root mean square error (RMSE), mean absolute percentage error (MAPE), and correlation coefficient (R2), and the expressions are as follows:
where is the number of data samples, is the modeled predicted value of the model, is the true value of the data, and is the mean value of the data. The smaller the MAE, RMSE, and MAPE, the higher the model accuracy. The closer the R2 index is to one, the more stable the model is. The test set prediction results are recorded without feature selection and with the PCA method, respectively, and the specific performance metrics are shown in Table 3.
Table 3.
Performance evaluation of different models.
As can be seen from the table, there are some differences in the results of different combinations of methods for optimizing the parameters under the same conditions. The model accuracy keeps improving during the step-by-step optimization process, and the PCA-IPSO-LSSVM model proposed in this study reflects the best prediction results. Meanwhile, Figure 10 shows the prediction errors corresponding to these five different models for the same test set. The error results using the optimization algorithm fluctuate relatively less and have absolute errors closer to zero. Compared with the alternative models, the proposed IPSO-LSSVM has the lowest volatility and the smallest error margin. Therefore, the superiority of the IPSO-LSSVM dissolved oxygen prediction model performance is further validated from both data analysis and image embodiment.
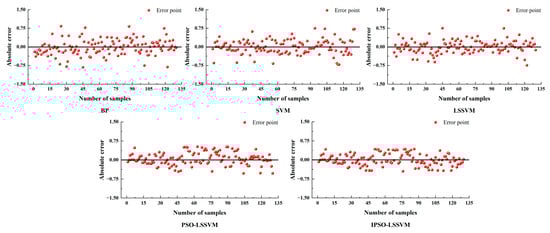
Figure 10.
Error analysis of different models.
5. Discussions
The results of the training and testing phases of the model show that artificial neural networks can be successfully used for DO prediction in water environments. Compared with the DO model of Shenzhen Bay established in the literature [7], this experiment established the DO prediction model of the Yangtze estuary basin, located in Shanghai, by analogy, and, on the basis of a single model, tried to combine the advantages of different models to improve the prediction effect of the model. During the experiment, the method of predicting Chl concentration in the Yangtze estuary in Article [15] was transferred to the prediction of DO in this experiment. In the model selection, the feasibility of applying it to DO prediction was first analyzed at the theoretical level, then step-by-step improvements were made by combining cases and apparent flaws in the model itself, and finally the IPSO-LSSVM model applicable to this experiment was designed and determined. Compared with the PCA-SVR model used in article [8], it can be clearly seen from the results in Table 3 that the experimental results of this model reflect the advantages of faster and better performance. The processed sample data set is fed into the model for experiments, and it is shown that the nonlinearity and high data dimensionality of the DO model can be accurately addressed. The sample regression plot in Figure 7 corresponds to the prediction results in Figure 6, and the slope of the fitted curve can reflect the accuracy of the prediction, demonstrating that the proposed model can achieve the desired results.
Different methods yield different results, and the results vary from one experimental sample to another. Reference [22] confirms that the feature recognition of water quality evolution can be successfully achieved using PCA. Due to the complexity of factors affecting DO, it is also confirmed in Table 3 that all models with PCA feature selection perform better than those without. Moreover, for the comparison of SVM and Bp neural networks, SVM performs significantly better than Bp in terms of error and time duration, which further validates that SVM is suitable for small samples. In contrast, the PCA-IPSO-LSSVM model proposed in this study, although relatively costly in terms of time consumption, reduces MAE, RMSE, and MAPE by 15.49%, 10.15%, and 14.15%, respectively, compared with the standard PCA-SVM model, indicating that the improved model is an effective method for predicting DO in water quality.
Similarly, in the visual comparison plot of model errors, it is evident that Bp, SVM, and LSSVM all show multiple cases of significant mutation, with the Bp neural network having the worst fit of the predicted cases to the true values. In terms of error size, the proposed model in this paper has a clear advantage in that the error distribution is concentrated around zero. The reliability of this combined model is finally verified.
6. Conclusions
This study was carried out in response to the need to understand the DO concentrations in water quality and the shortcomings of traditional prediction methods, such as low accuracy, time consuming, and prone to fall into local minima. Combining PCA with LSSVM and introducing IPSO to build a DO regression prediction model using IPSO-optimized SVM leads to the following conclusions:
- A reliable dataset is a prerequisite for accurate predictions. The water environment is a dynamic, multi-factor interaction, with nonlinear changes in the complex system, and is prone to deviations between experimental data and real data. Pre-processing of the data is required to reduce factors affecting the accuracy of the model by selecting input parameters using PCA analysis with Pearson correlation coefficients;
- The predictions of the model used in this experiment have smaller errors and higher correlation coefficients, which are closer to the true values and reflect higher reliability and stability. It is able to obtain the changes in regional water quality in a short period of time in advance and adjust accordingly in a timely manner;
- The integration of the IPSO algorithm with LSSVM, while improving the accuracy of the DO prediction, has a non-negligible increase in running time due to the increased number of particle swarm iterations. In future work, the accuracy of the model needs to be further improved and the predictive efficiency of the model needs to be further analyzed and discussed.
Author Contributions
Conceptualization, Y.L. and X.L.; methodology, X.L.; software, X.L. and C.X.; validation, X.L.; formal analysis, X.T. and X.L.; investigation, X.L.; resources, Y.L.; data curation, X.L.; writing—original draft preparation, X.L.; writing—review and editing, Y.L. and X.L.; visualization, X.L. and C.X. All authors have read and agreed to the published version of the manuscript.
Funding
This research was funded by the National Natural Science Foundation of China (No. 51876114), and Shanghai Science and Technology Commission Funding Project, “Shanghai Marine Renewable Energy Engineering Technology Research Center” (19DZ2254800).
Data Availability Statement
The data are obtained from the real-time public data of the General Environmental Monitoring Station of China (http://www.cnemc.cn/).
Conflicts of Interest
The authors declare no conflict of interest.
References
- Wang, J.; Wu, Q.; Luo, H. Study on the Spatial-temporal Distribution and Influencing Factors of Dissolved Oxygen in the North Main Stream of Dongjiang River. J. Yangtze River Sci. Res. Inst. 2023; 1–8, accepted. Available online: http://kns.cnki.net/kcms/detail/42.1171.TV.20230317.1506.016.html (accessed on 31 March 2023).
- Sun, Y.; Lv, F.; Chen, Z. Spatial-temporal distribution and dynamics of dissolved oxygen in an adjacent area of the Changjiang estuary. Mar. Sci. 2021, 45, 86–96. [Google Scholar]
- Wei, P.; Huang, L.; Feng, J. Distribution characteristics of COD and DO and its influencing factors in the Guangzhou sea zone of the Pearl River Estuary. Ecol. Environ. Sci. 2009, 18, 1631–1637. [Google Scholar]
- Zhou, Z.; Zou, G.; Wang, L. Time-series Prediction Model of Wate Quality Based on ARIMA/RBF-NN. Bull. Sci. Technol. 2017, 33, 236–240. [Google Scholar]
- Tung, T.M.; Yaseen, Z.M. A survey on river water quality modelling using artificial intelligence models:2000~2020. J. Hydrol. 2020, 585, 124670. [Google Scholar]
- Li, T.; Lu, J.; Wu, J.; Zhang, Z.; Chen, L. Predicting Aquaculture Water Quality Using Machine Learning Approaches. Water 2022, 14, 2836. [Google Scholar] [CrossRef]
- Yang, M.; Mao, X. Dissolved Oxygen Prediction Model Based on Variable Importance Measure and Random Foreat: A Case Study of Shenzhen Bay. China Environ. Sci. 2022, 42, 3876–3881. [Google Scholar]
- Wu, H.; Yang, R.; Zhang, Y. Forecasting Model for DO of Pond Water Quality Based on PCA-SVR. J. Anhui Univ. Nat. Sci. 2016, 40, 31. [Google Scholar]
- Liu, S.; Xu, L.; Li, Z. Forecasting Model for pH Value of Aquaculture Water Quality Based on PCA-MCAFA-LSSVM. Trans. Chin. Soc. Agric. Mach. 2014, 45, 239–246. [Google Scholar]
- Shi, C.; Liu, Y.; Chen, X. Water Quality Prediction Model Based on Particle Swarm Optimization Support Vector Regression. Inf. Control 2021, 51, 1–14. [Google Scholar]
- Tang, X.; Huang, M. Simulation of Chlorophyll a Concentration in Donghu Lake Assisted by Environmental Factors Based on Optimized SVM and Data Assimilation. Water 2022, 14, 2353. [Google Scholar] [CrossRef]
- Xu, G.; Gao, G.; Hu, M. Detecting spammer on micro-blogs base on fuzzy multi-class SVM. In Proceedings of the 2018 International Conference on Cyber-Enabled Distributed Computing and Knowledge Discovery (CyberC), Zhengzhou, China, 18–20 October 2018; IEEE: Piscataway, NJ, USA, 2018; pp. 24–247. [Google Scholar]
- Zeng, Q.; Qin, L.; Bao, L. Critical nutrient thresholds needed to control eutrophication and synergistic interactions between phosphorus and different nitrogen sources. Environ. Sci. Pollut. Res. Int. 2016, 23, 21008–21019. [Google Scholar] [CrossRef] [PubMed]
- Zhu, C. Study of Water Quality Parameters Detection and Prediction Methods for Aquaculture Based on Machine Learning; Jiangsu University: Zhenjiang, China, 2019. [Google Scholar]
- Li, X.; Su, R.; Zhang, C. A Chl a prediction model based on support vector machine in Yangtze River estuaries and its Adjacent sea areas. Period. Ocean Univ. China 2019, 49, 69–76. [Google Scholar]
- Yu, M.; Liu, B.; Tang, E. Remote Sensing Image Classification Based on Improved PSO Support Vector Machine. Spacecr. Recovery Remote Sens. 2018, 39, 133–140. [Google Scholar]
- Sheng, L. Location selection of logistics distribution center based on quantum particle swarm optimization algorithm. Sci. Technol. Eng. 2019, 19, 183–187. [Google Scholar]
- Zeng, N.; Hong, Z.; Liu, W. A Switching Delayed PSO Optimized Extreme Learning Machine for Shortern Load Forecasting. Neurocomputing 2017, 240, 175–182. [Google Scholar] [CrossRef]
- Li, D.; Li, L.; Zhang, R. Water Quality pH Value Determination for Visible-Near Infrared Spectroscopy Based on SPA and PSO-LSSVM. Laser Optoelectron. Prog. 2023, 60, 390–395. [Google Scholar]
- Eherhart, R.C.; Shi, Y. Comparing inertia weights and constriction factors in particle swarm optimization. In Proceedings of the IEEE Conference on Evolutionary Computation, La Jolla, CA, USA, 16–19 July 2008. [Google Scholar]
- Chen, Z.; Ye, X.; Huang, P. Estimating Carbon Dioxide (CO2) Emissions from Reservoirs Using Artificial Neural Networks. Water 2018, 10, 26. [Google Scholar] [CrossRef]
- Han, L.; Xu, H.; Zhou, Y. Identification of the Evolution Characteristics of Water Quality of Gucheng Lake in Nanjing Based on Principal Component Analysis. Water Resour. Dev. Manag. 2023, 1–6. [Google Scholar]
- Huang, S.; Zang, C.; Du, S. Study on the relationships among pH, dissolved oxygen and chlorophyll a Ⅰ: Aquaculture water. Chin. J. Environ. Eng. 2011, 5, 1201–1208. [Google Scholar]
- Zheng, B.; Wu, L.; Li, F. Data fusion algorithm based on abnormal data-preprocessing and adaptive estimation in WSN. Appl. Res. Comput. 2019, 36, 2750–2754. [Google Scholar]
Disclaimer/Publisher’s Note: The statements, opinions and data contained in all publications are solely those of the individual author(s) and contributor(s) and not of MDPI and/or the editor(s). MDPI and/or the editor(s) disclaim responsibility for any injury to people or property resulting from any ideas, methods, instructions or products referred to in the content. |
© 2023 by the authors. Licensee MDPI, Basel, Switzerland. This article is an open access article distributed under the terms and conditions of the Creative Commons Attribution (CC BY) license (https://creativecommons.org/licenses/by/4.0/).