Indian Summer Monsoon and El Niño Southern Oscillation in CMIP5 Models: A Few Areas of Agreement and Disagreement


Abstract
:
1. Introduction
2. Methodology and Data
3. Results
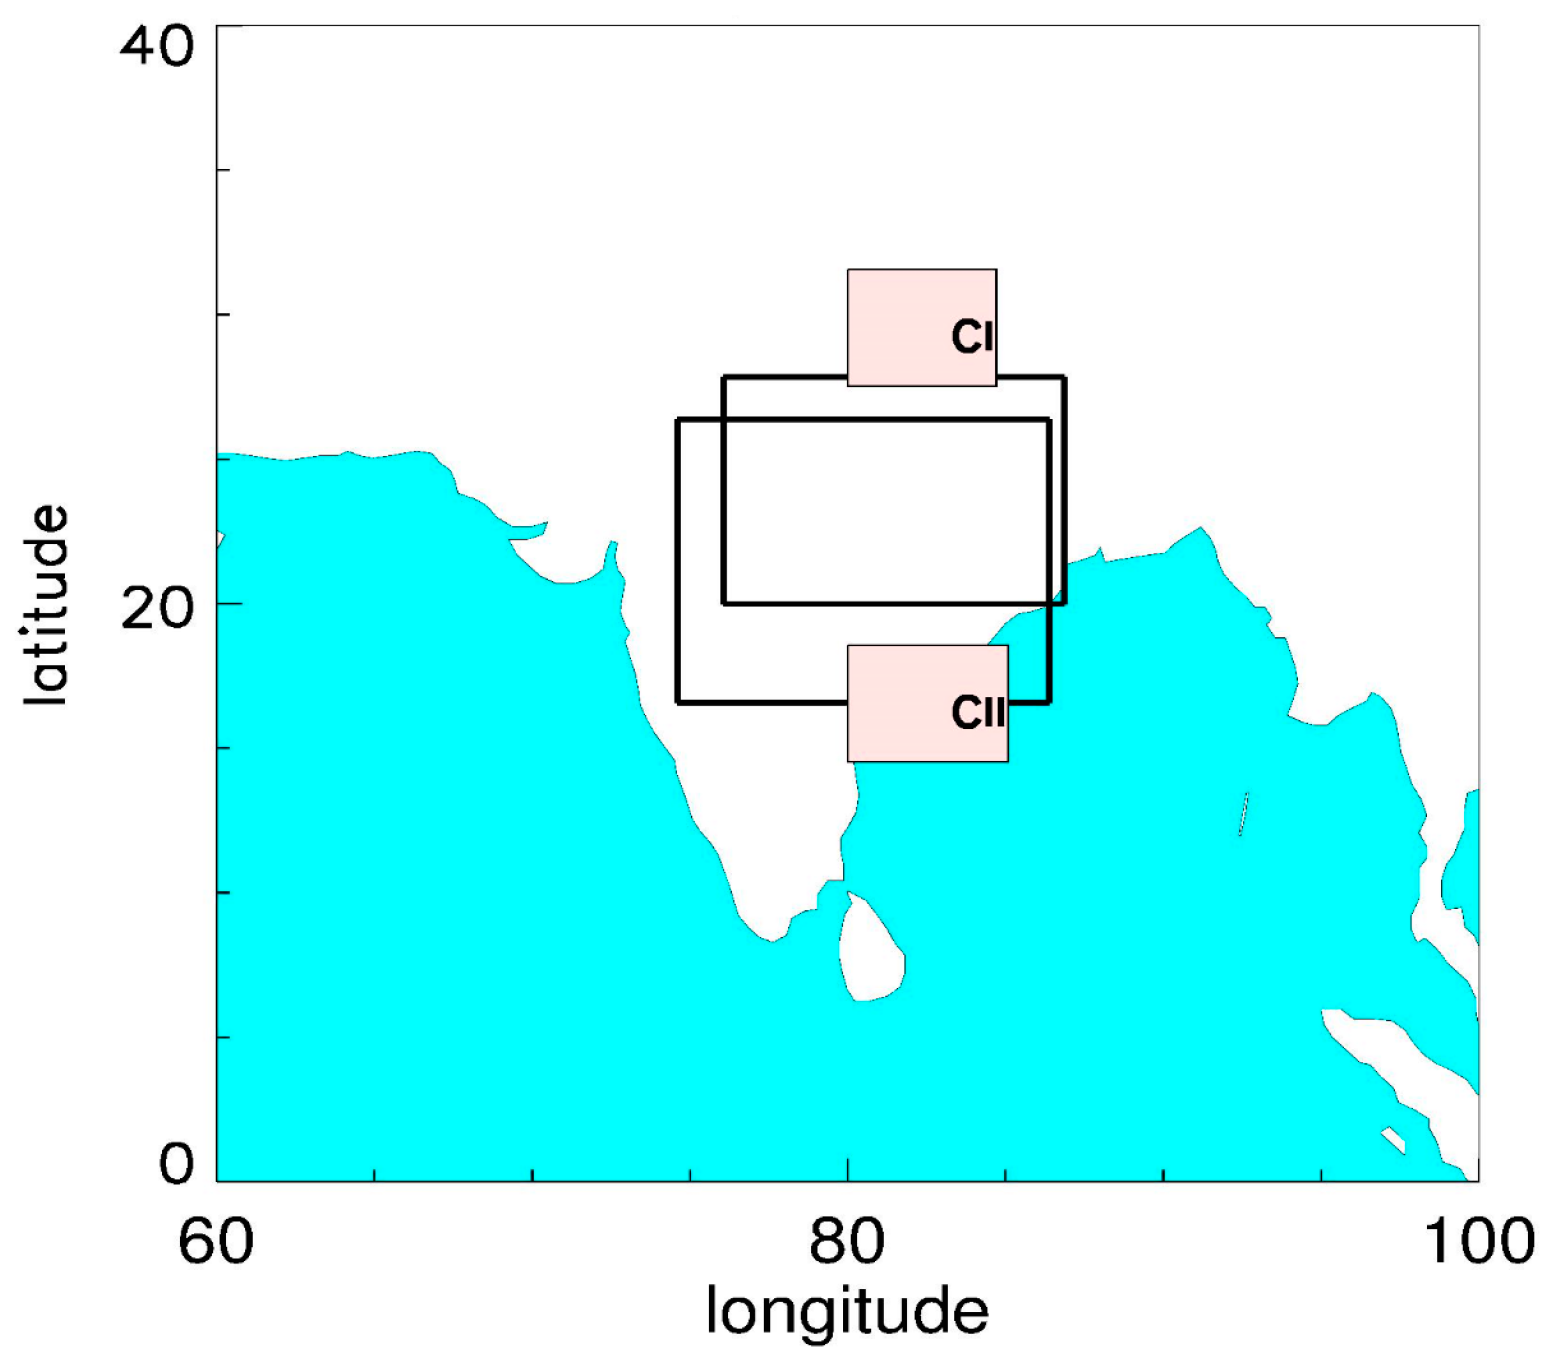
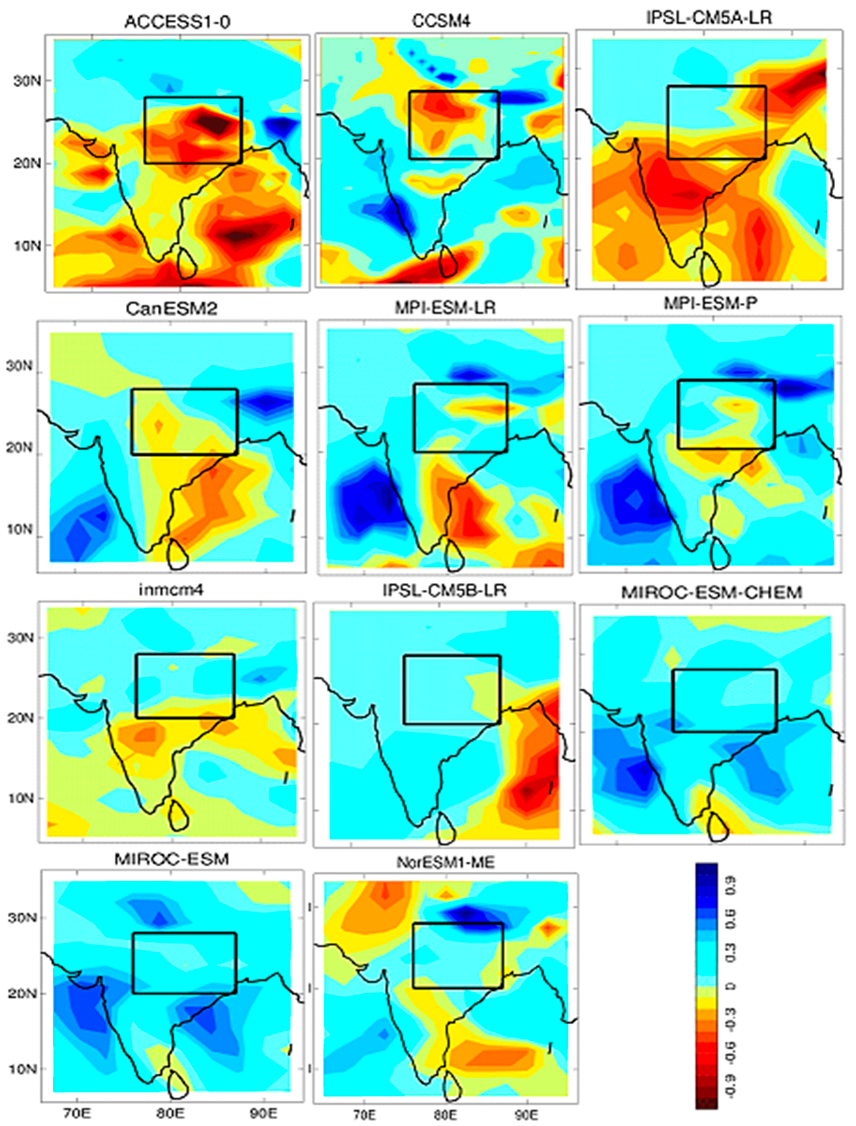
3.1. Spatial and Temporal Pattern of ISM Rainfall in the CNE Region
3.1.1. Spatial Patterns in the CI Region
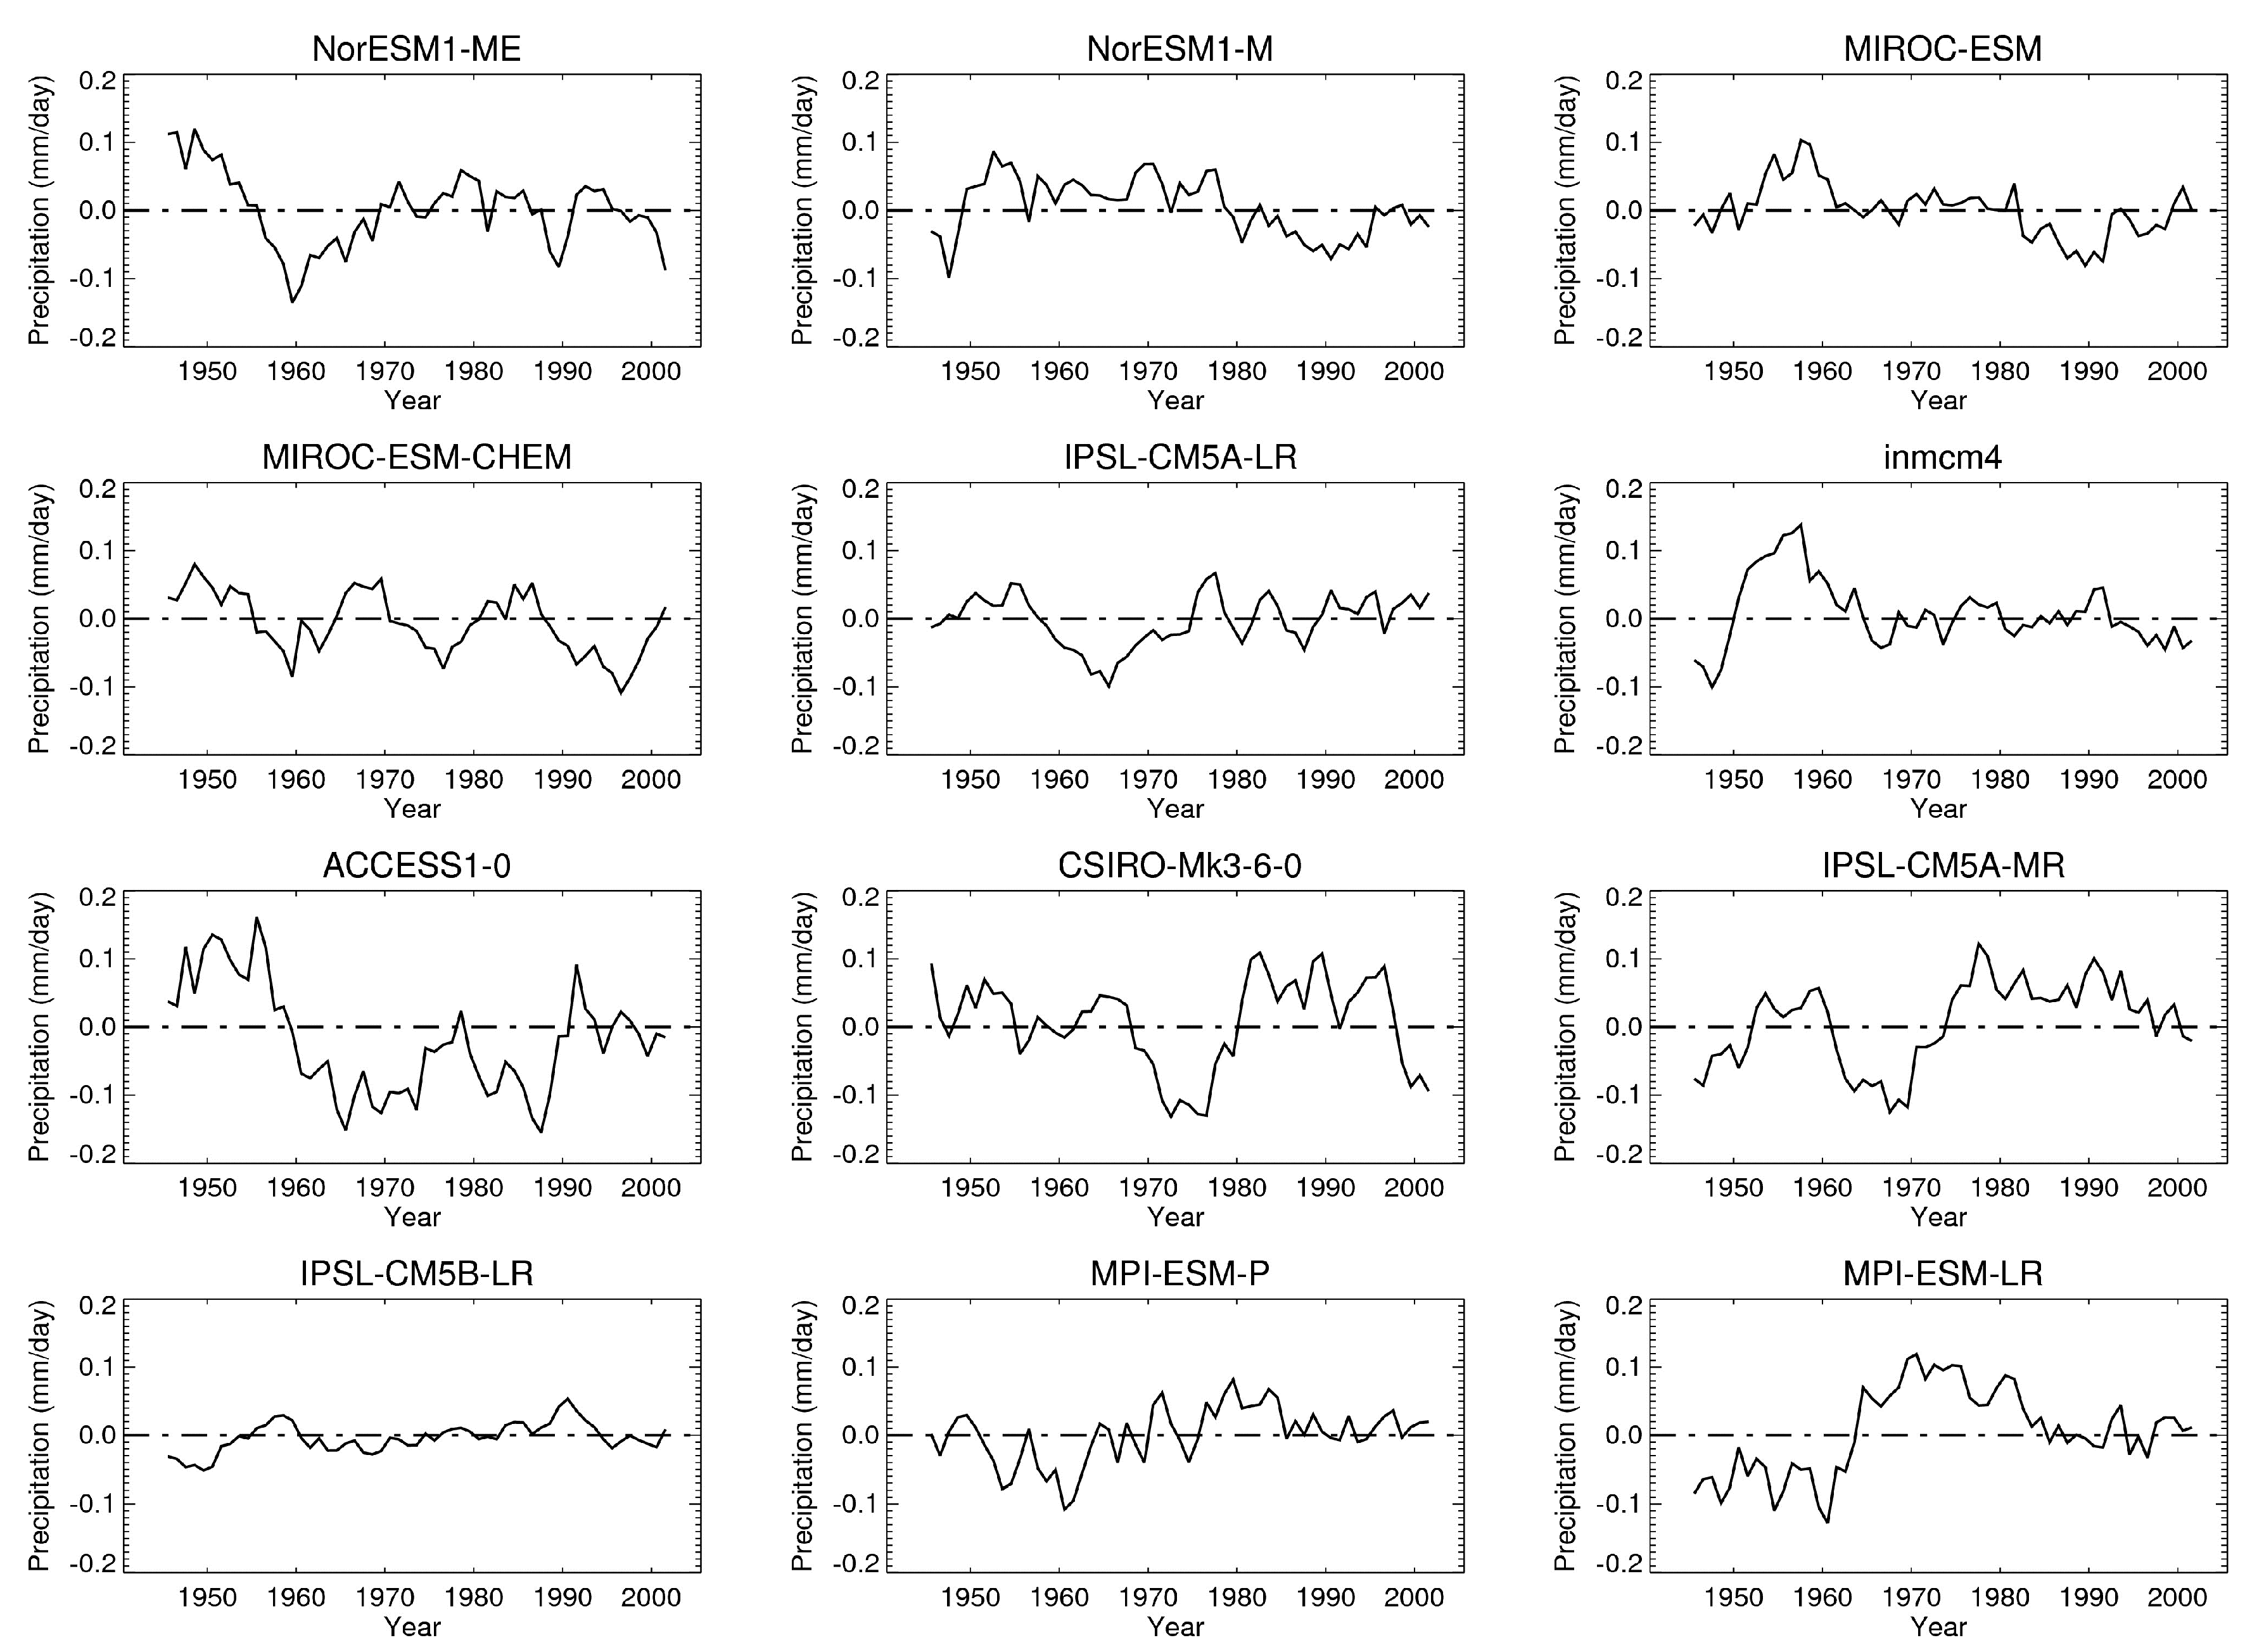
3.1.2. Temporal Patterns in the CI Region
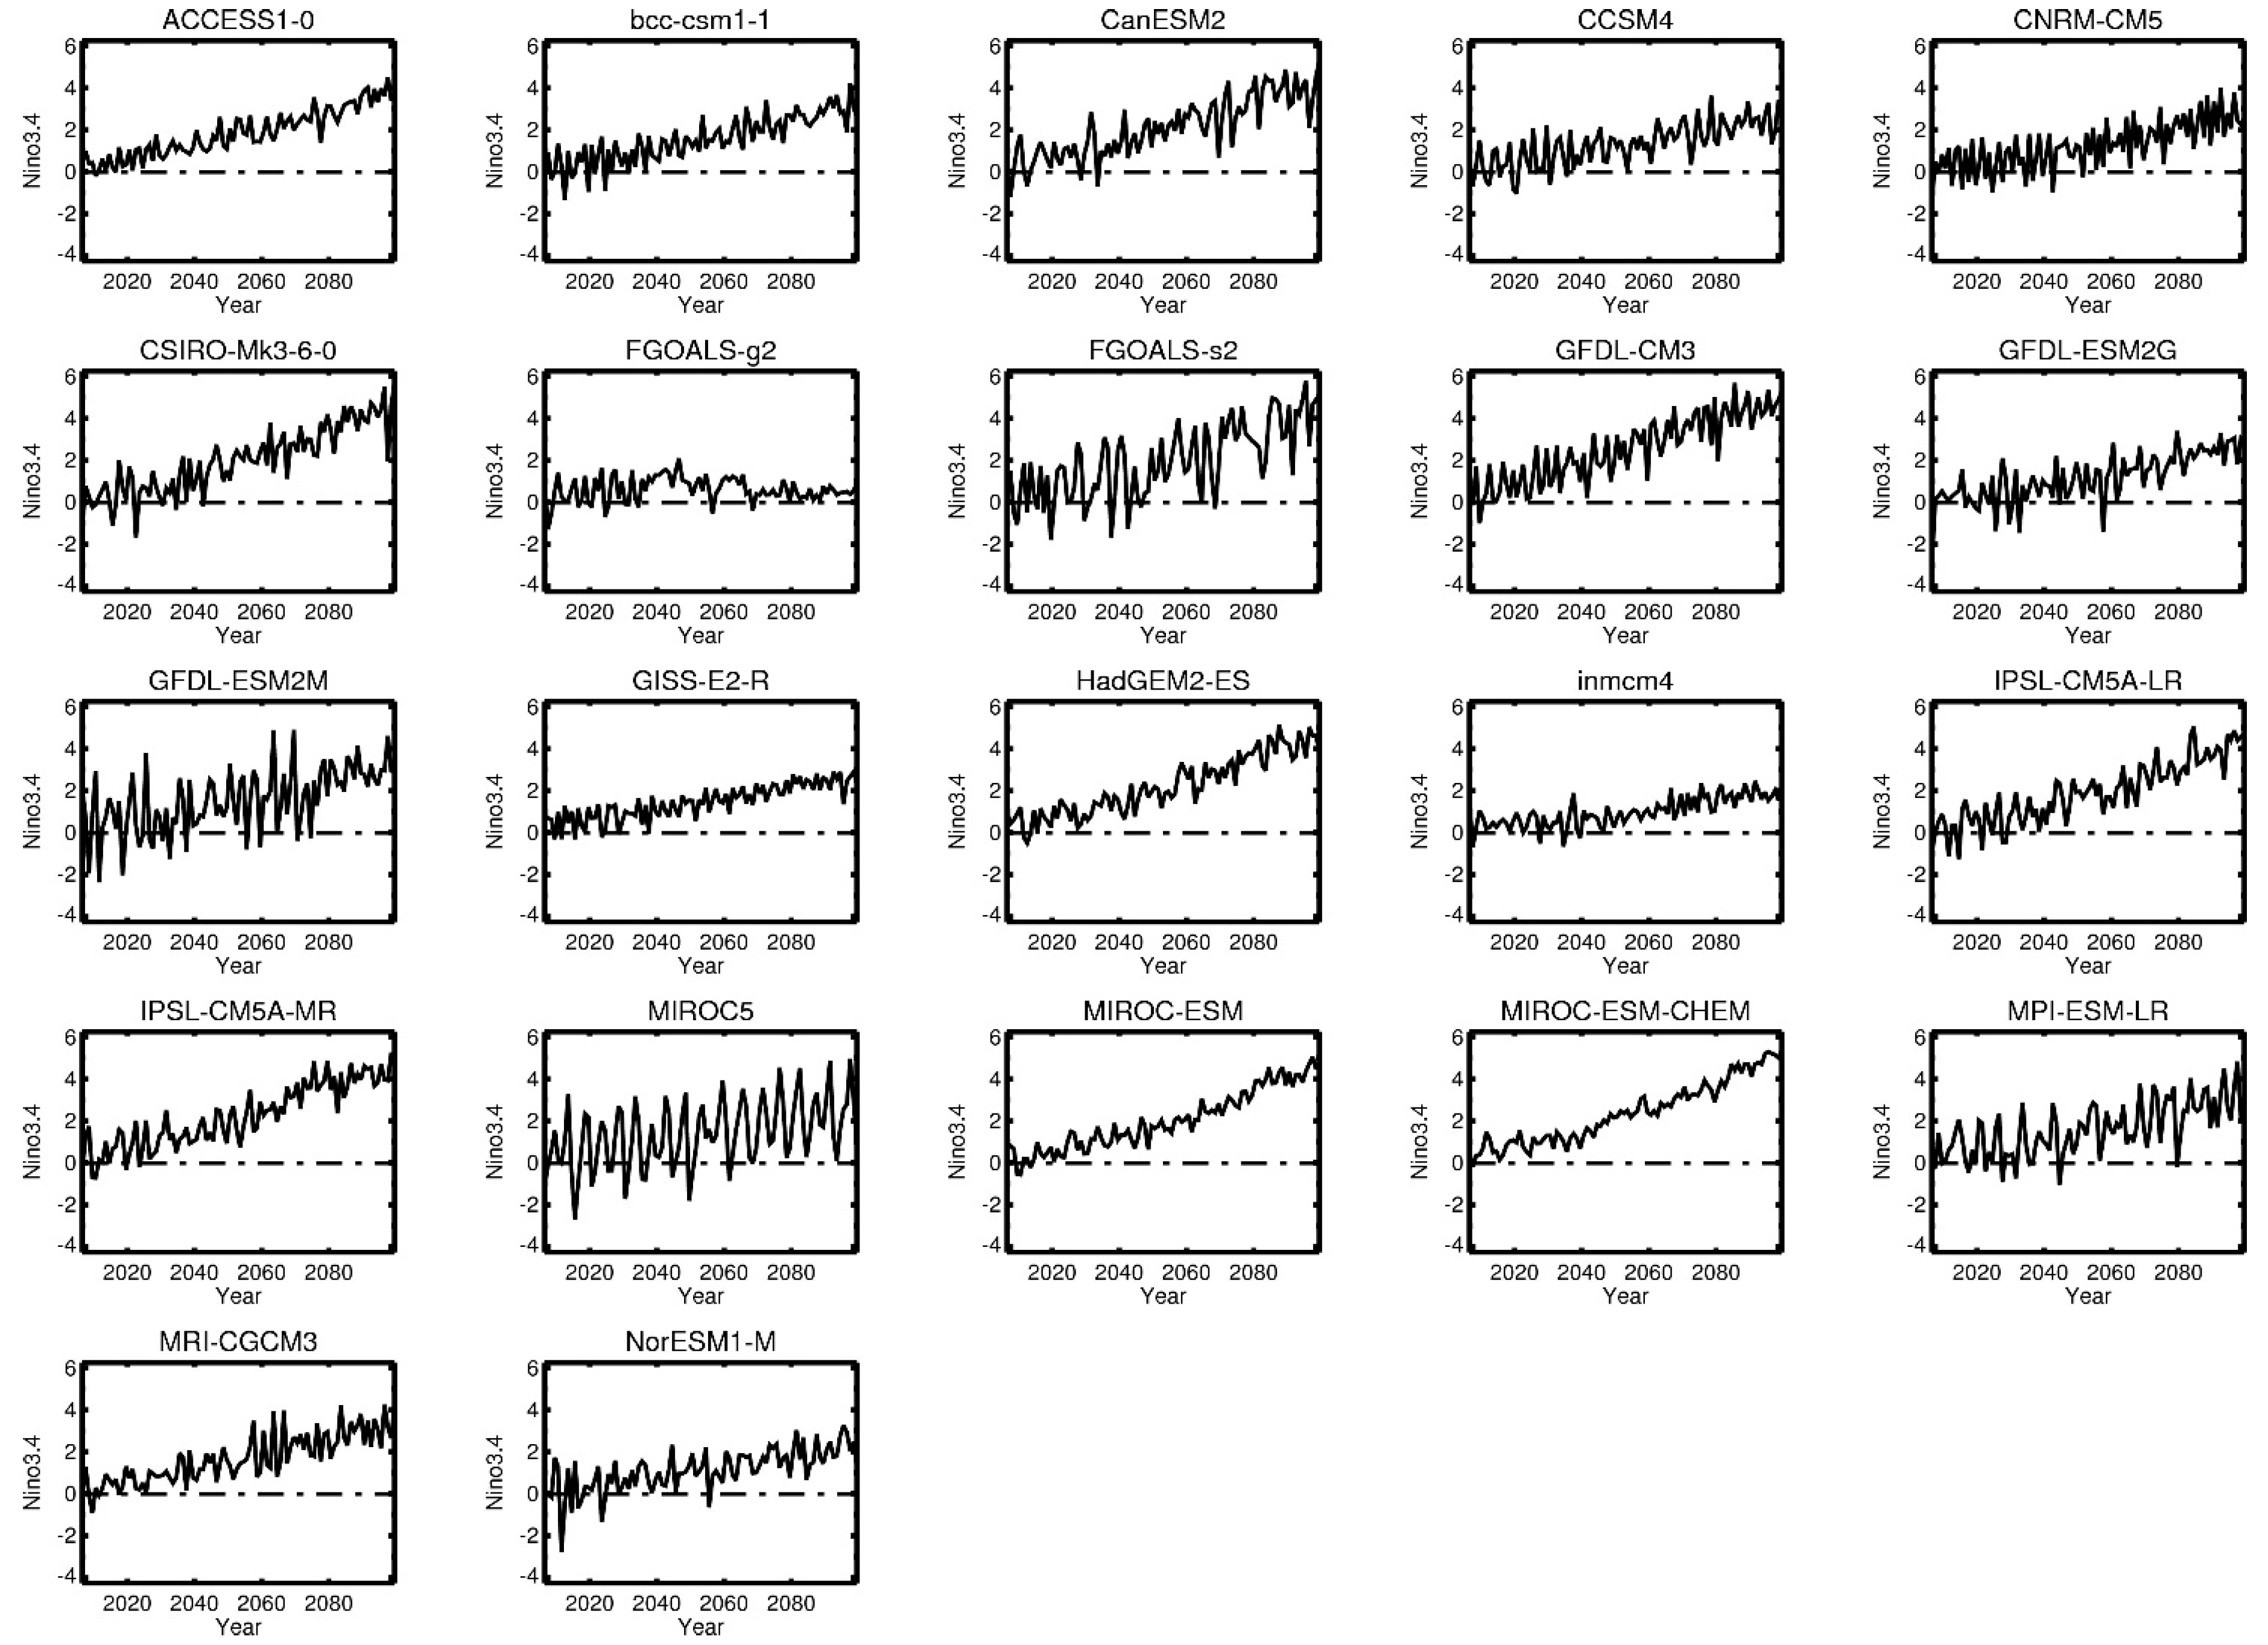
3.2. Niño 3.4 in the RCP Scenario
3.3. Correlation between ISM and Niño 3.4 in the Historical and RCP Scenario
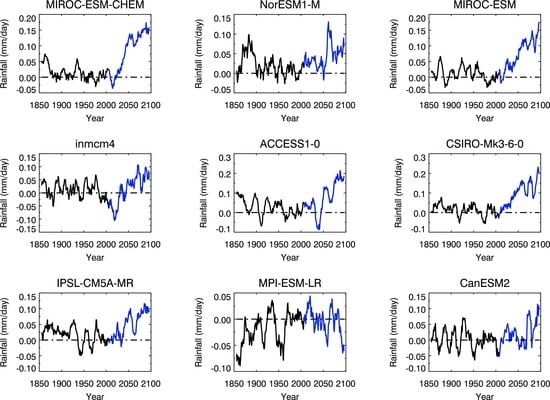
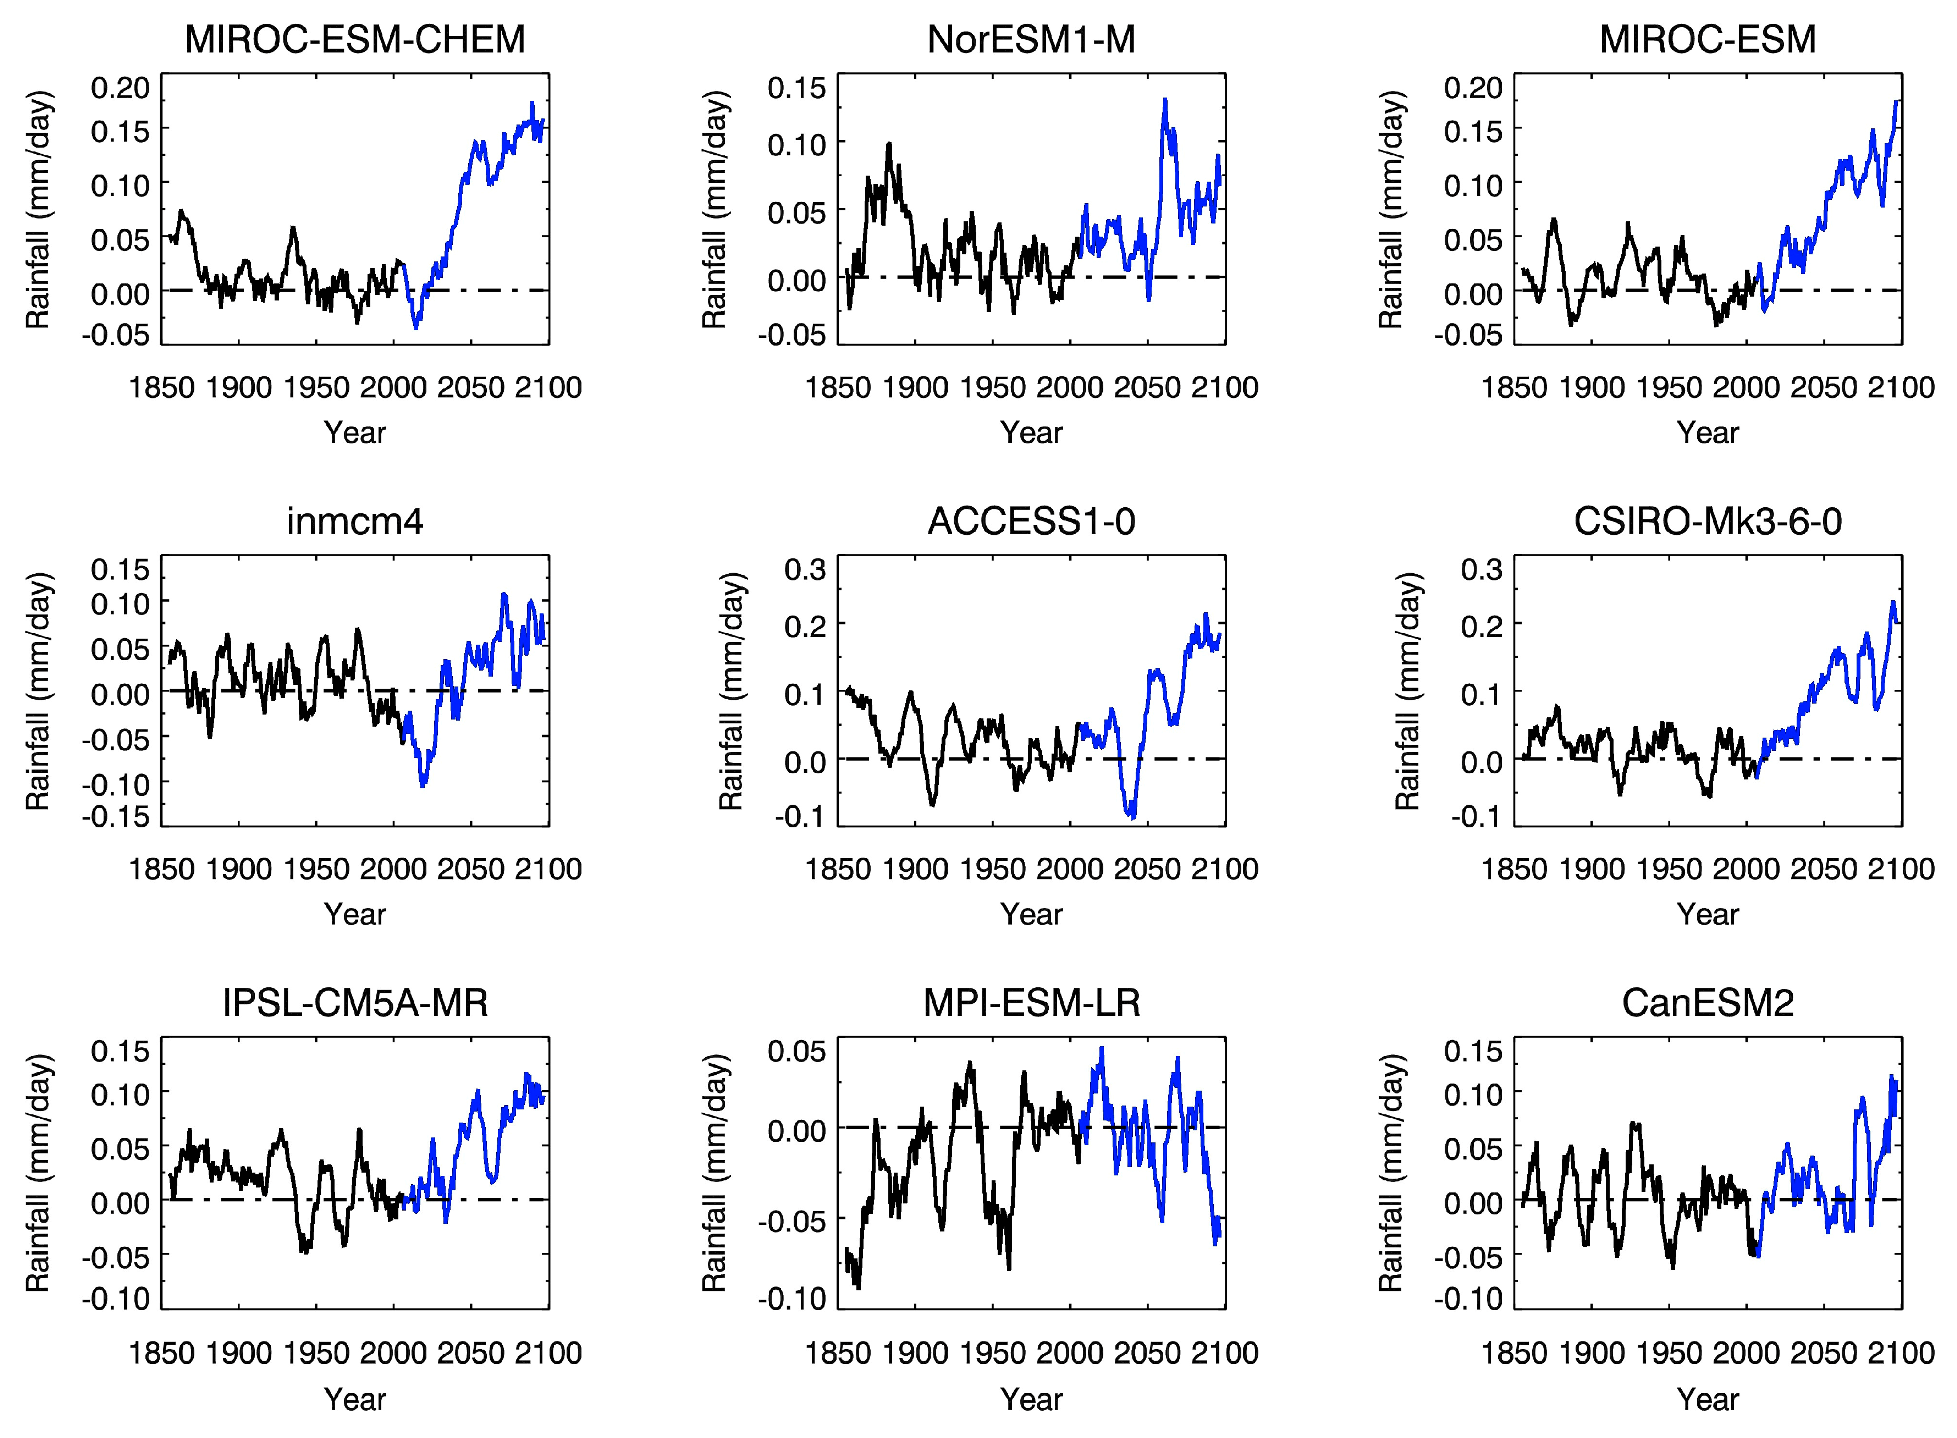
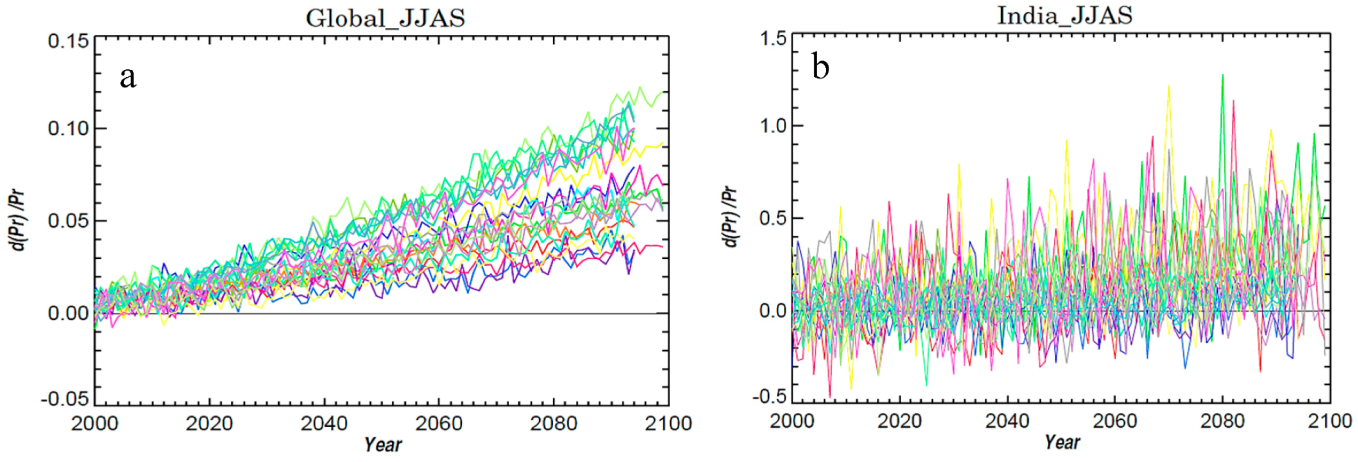
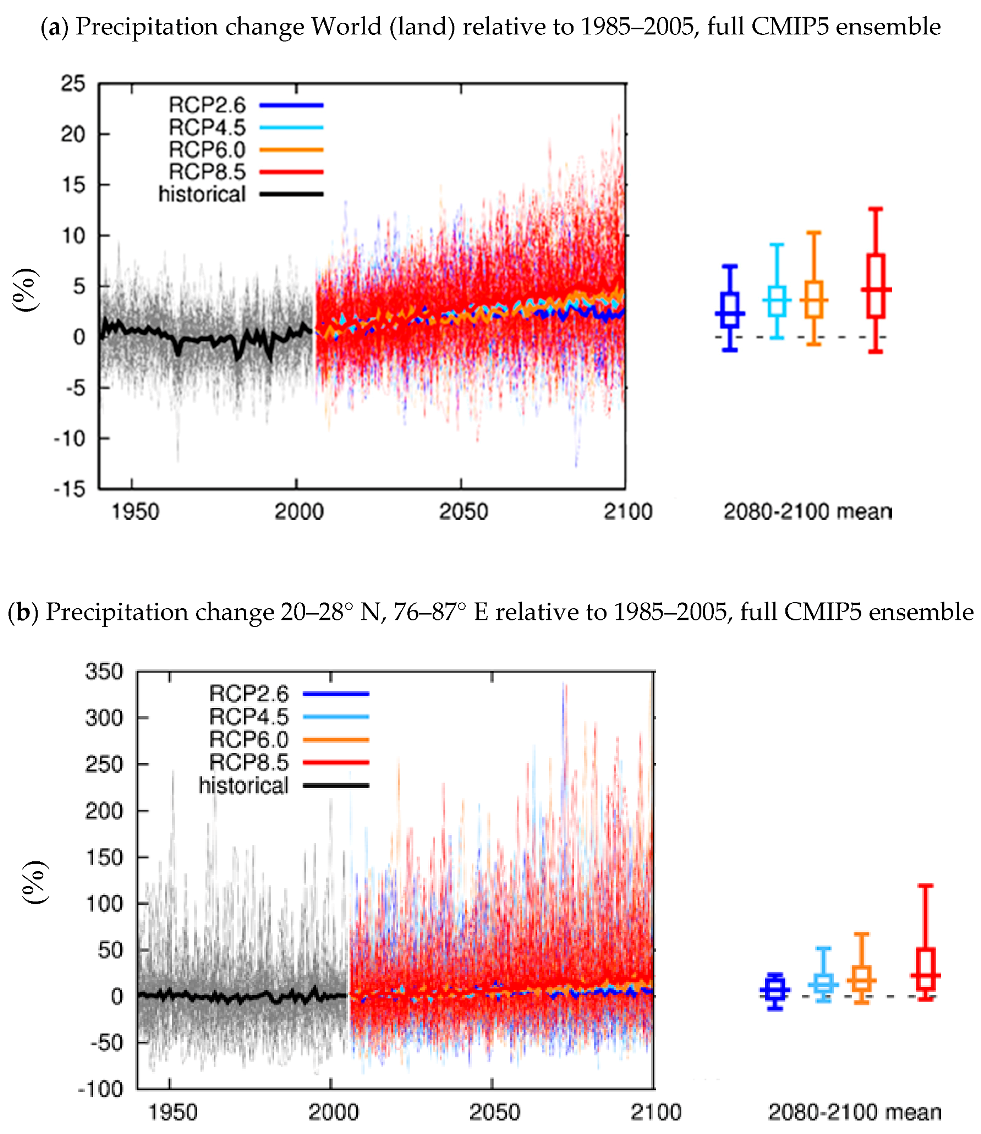
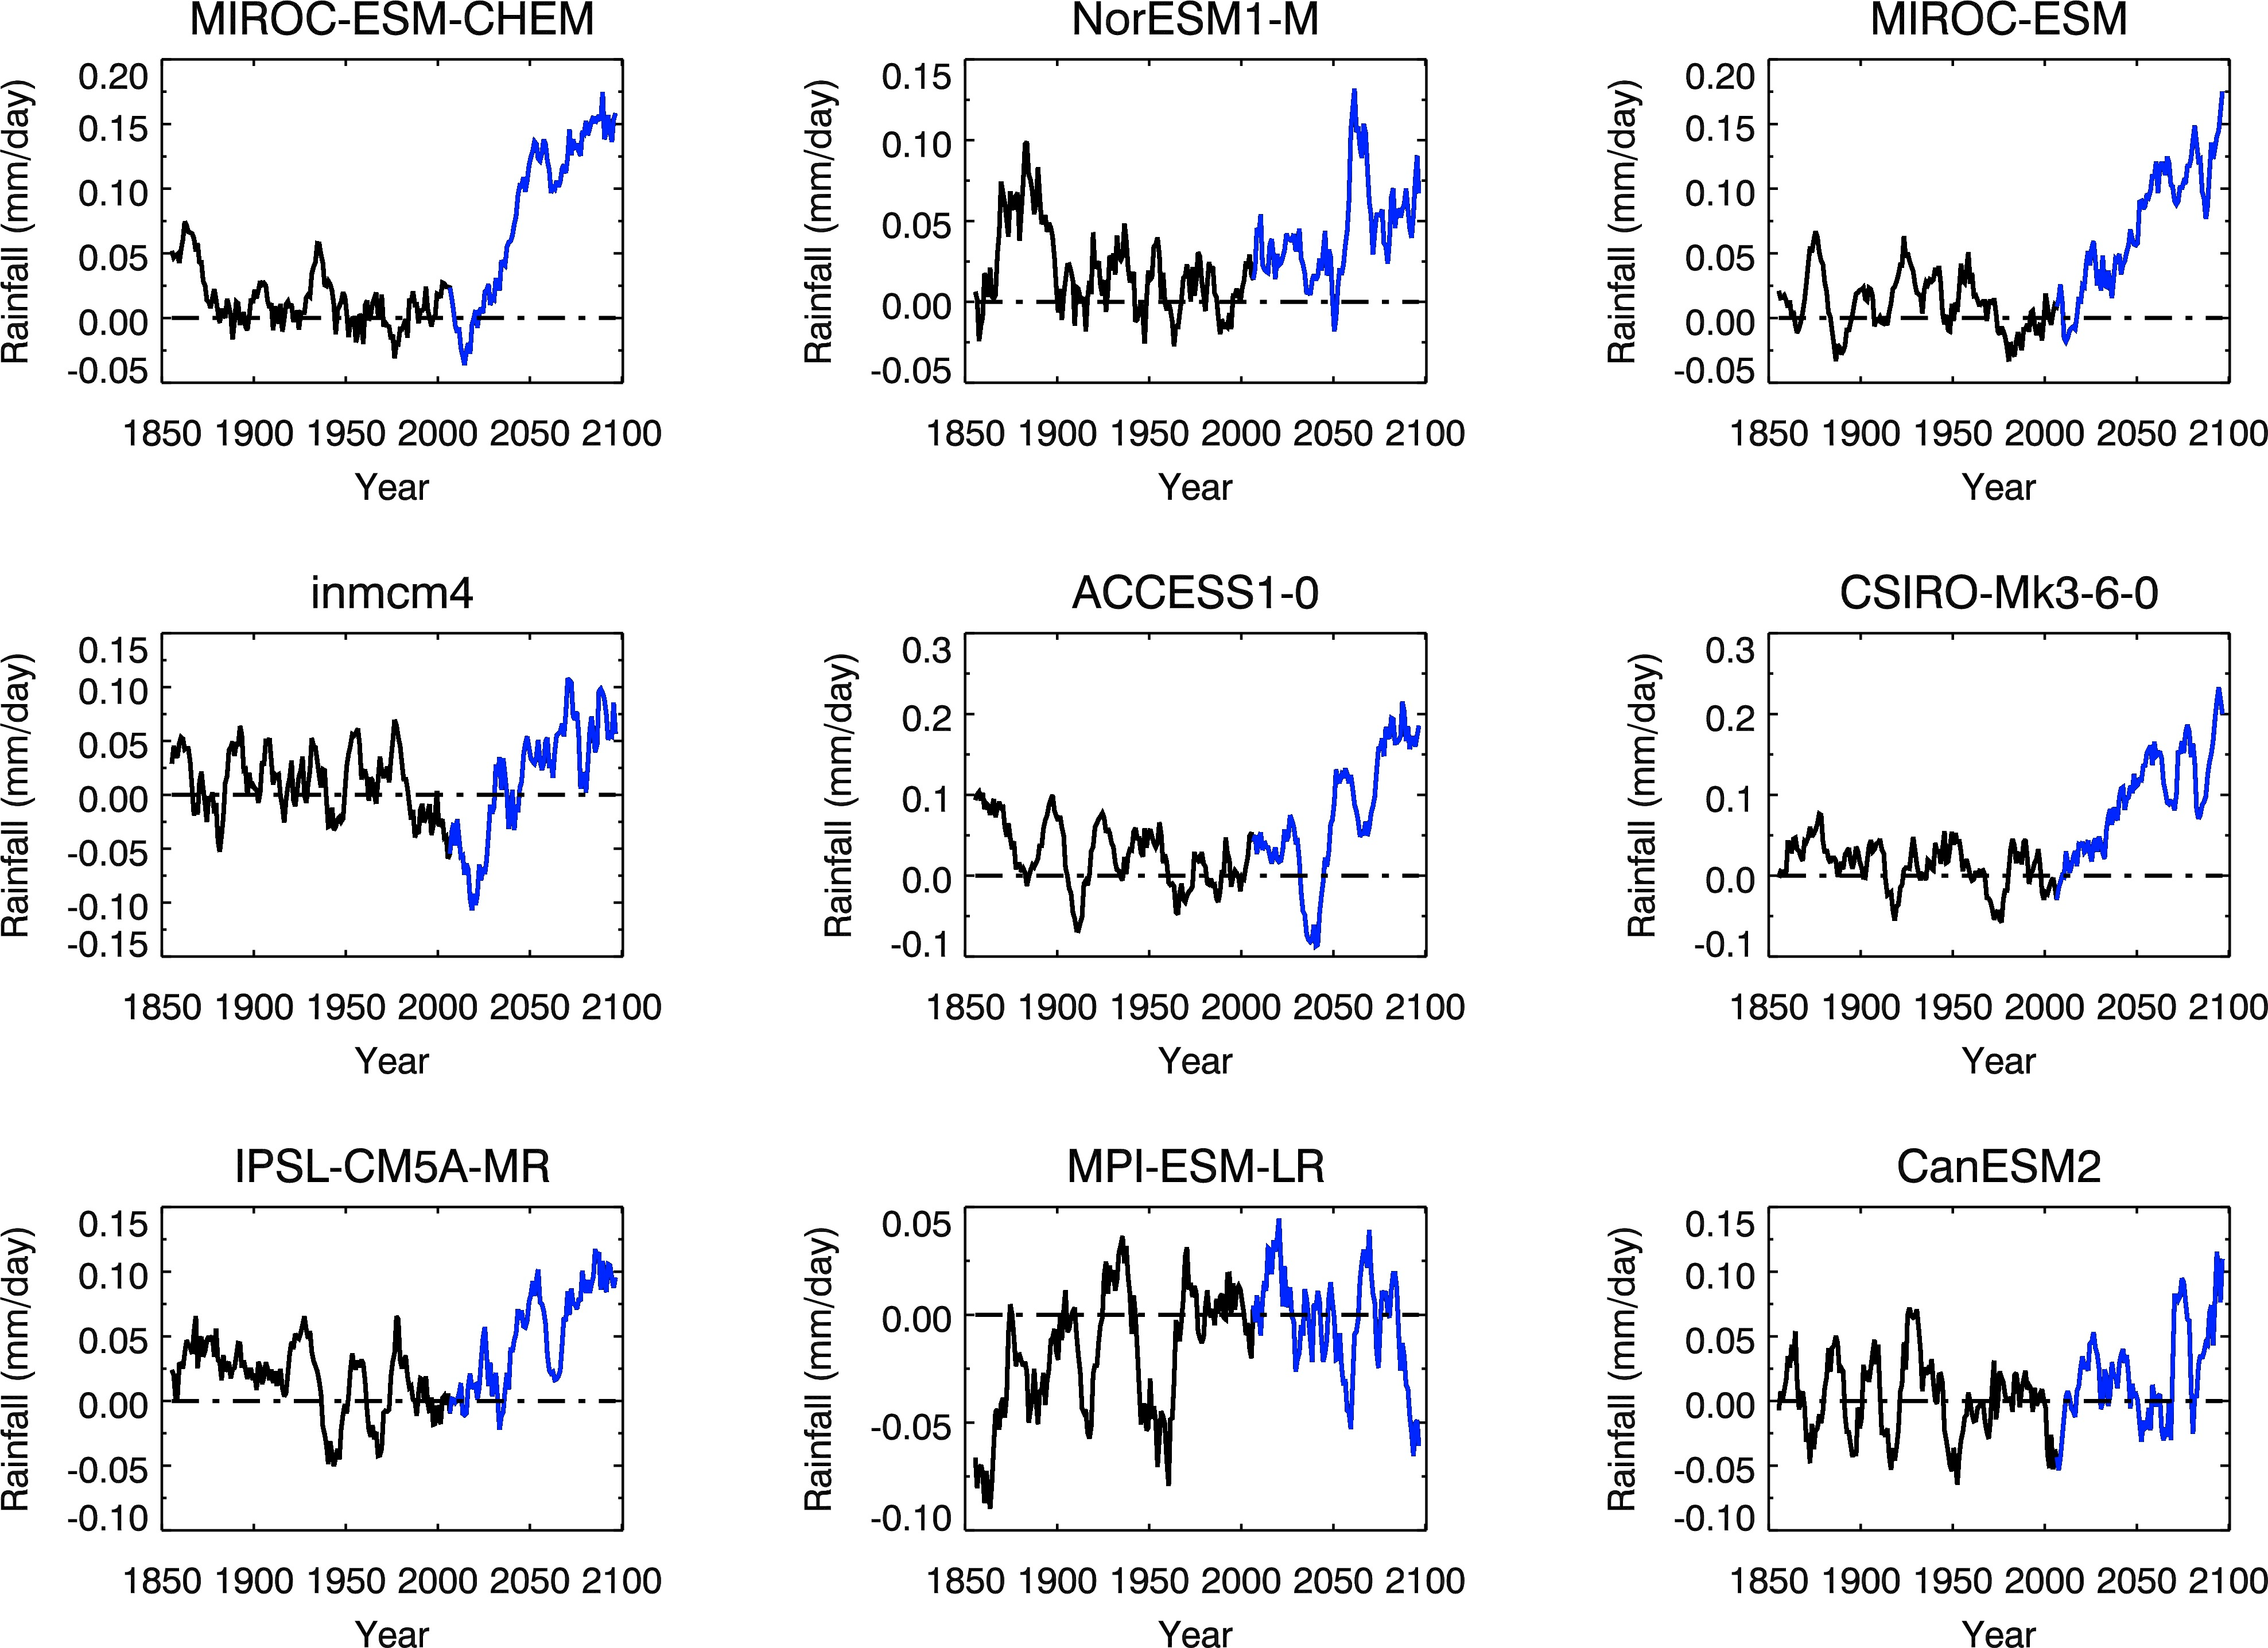
3.4. Precipitation in RCP Scenarios
4. Conclusions
Conflicts of Interest
References
- Trenberth, K.E.; Hurrell, J.W.; Stepaniak, D.P. The Asian Monsoon; Wang, B., Ed.; Springer: Berlin/Heidelberg, Germany; New York, NY, USA, 2006; pp. 417–457. [Google Scholar]
- Gill, A.E. Some simple solutions for heat-induced tropical circulation. Q. J. R. Meteorol. Soc. 1980, 106, 447–462. [Google Scholar] [CrossRef]
- Ramanathan, V.; Chung, C.; Kim, D.; Bettge, T.; Buja, L.; Kiehl, J.T.; Wild, M. Atmospheric brown clouds: Impacts on South Asian climate and hydrological cycle. Proc. Natl. Acad. Sci. USA 2005, 102, 5326–5333. [Google Scholar] [CrossRef] [PubMed]
- Chung, C.E.; Ramanathan, V. Weakening of the North Indian SST gradients and the monsoon rainfall in India and the Sahel. J. Clim. 2006, 19, 2036–2045. [Google Scholar] [CrossRef]
- Bollasina, M.A.; Ming, Y.; Ramaswamy, V. Anthropogenic Aerosols and the Weakening of the South Asian Summer Monsoon. Science 2011, 334, 502–505. [Google Scholar] [CrossRef] [PubMed]
- Lau, K.M.; Kim, K.M. Fingerprinting the impacts of aerosols on longterm trends of the Indian summer monsoon regional rainfall. Geophys. Res. Lett. 2010, 37, L16705. [Google Scholar] [CrossRef]
- Zhang, L.; Zhou, T. An assessment of monsoon precipitation changes during 1901–2001. Clim. Dyn. 2011, 37, 279–296. [Google Scholar] [CrossRef]
- Goswami, B.N.; Venugopal, V.; Sengupta, D.; Madhusoodanan, M.S.; Xavier, P.K. Increasing Trend of Extreme Rain Events Over India in a Warming Environment. Science 2006, 314, 1442–1445. [Google Scholar] [CrossRef] [PubMed]
- Deng, Y.Y.; Gao, T.; Gao, H.W.; Yao, X.H.; Xie, L. Regional precipitation variability in East Asia related to climate and environmental factors during 1979–2012. Sci. Rep. 2014, 4, 5693. [Google Scholar] [CrossRef] [PubMed]
- Chou, C.; Neelin, J.; Chen, C.; Tu, J. Evaluating the “rich-get-richer” mechanism in tropical precipitation change under global warming. J. Clim. 2009, 22, 1982–2005. [Google Scholar] [CrossRef]
- Held, I.M.; Soden, B.J. Robust responses of the hydrological cycle to global warming. J. Clim. 2006, 19, 5686. [Google Scholar] [CrossRef]
- John, O.; Allan, R.P.; Soden, J. How robust are observed and simulated precipitation responses to tropical ocean warming? Geophys. Res. Lett. 2009, 36, L14702. [Google Scholar] [CrossRef]
- Xie, S.P.; Deser, C.; Vecchi, G.A.; Ma, J.; Teng, H.; Wittenberg, A.T. Global Warming Pattern Formation: Sea Surface Temperature and Rainfall. J. Clim. 2010, 23, 966–986. [Google Scholar] [CrossRef]
- Huang, P.; Xie, S.P.; Hu, K.; Huang, G.; Huang, R. Patterns of the seasonal response of tropical rainfall to global warming. Nat. Geosci. 2013, 6, 357–361. [Google Scholar] [CrossRef]
- Folland, C.K.; Karl, T.R.; Christy, J.R.; Clarke, R.A.; Gruza, G.V.; Jouzel, J.; Mann, M.E.; Oerlemans, J.; Salinger, M.J.; Wang, S.W. Climate Change 2001: The Scientific Basis: Contribution Of Working Group I to the IPCC Third Assessment Report; Cambridge University Press: Cambridge, UK, 2001; pp. 99–181. [Google Scholar]
- Ramanathan, V.; Crutzen, P.J.; Kiehl, J.T.; Rosenfeld, D. Aerosols, climate and the hydrological cycle. Science 2001, 294, 2119–2124. [Google Scholar] [CrossRef] [PubMed]
- Zhang, X.; Zwiers, F.W.; Hegerl, G.C.; Lambert, F.H.; Gillett, N.P.; Solomon, S.; Stott, P.A.; Nozawa, T. Detection of human influence on twentieth-century precipitation trends. Nature 2007, 448, 461–465. [Google Scholar] [CrossRef] [PubMed]
- Maity, R.; Kumar, D.N. Bayesian dynamic modelling for monthly Indian summer monsoon rainfall using El Niño–Southern Oscillation (ENSO) and Equatorial Indian Ocean Oscillation (EQUINOO). J. Geophys. Res. 2006, 111, D07104. [Google Scholar] [CrossRef]
- Roy, I.; Collins, M. On identifying the role of Sun and the El Niño Southern Oscillation on Indian Summer Monsoon Rainfall. Atmos. Sci. Lett. 2015, 16, 162–169. [Google Scholar] [CrossRef] [Green Version]
- Xavier, P.K.; Marzin, C.; Goswami, B.N. An objective definition of the Indian summer monsoon season and a new perspective on the ENSO-monsoon relationship. Q. J. R. Meteorol. Soc. 2007, 133, 749–764. [Google Scholar] [CrossRef]
- Sen Roy, S. Identification of periodicity in the relationship between PDO, El Niño and peak monsoon rainfall in India using S-transform analysis. Int. J. Climatol. 2011, 31, 1507–1517. [Google Scholar] [CrossRef]
- Chang, C.P.; Harr, P.; Ju, J.H. Possible roles of Atlantic circulations on the weakening Indian monsoon rainfall–ENSO relationship. J. Clim. 2001, 14, 2376–2380. [Google Scholar] [CrossRef]
- Torrence, C.; Webster, P.J. Interdecadal changes in the ENSO–monsoon system. J. Clim. 1999, 12, 2679–2690. [Google Scholar] [CrossRef]
- Latif, M.; Sperber, K.; Arblaster, J.; Braconnot, P.; Chen, D.; Colman, A.; Fairhead, L. ENSIP: The El Niño simulation Intercomparison project. Clim. Dyn. 2001, 18, 255–272. [Google Scholar] [CrossRef]
- Van Oldenborgh, G.J.; Philip, S.Y.; Collins, M. El Niño in a changing climate: A multi-model study. Ocean Sci. 2005, 1, 81–95. [Google Scholar] [CrossRef]
- Jin, E.K.; Kinter, J.L., III. Characteristics of tropical Pacific SST predictability in coupled GCM forecasts using the NCEP CFS. Clim. Dyn. 2009, 32, 675–691. [Google Scholar] [CrossRef]
- Wang, B.; Lee, J.Y.; Kang, I.S.; Shukla, J.; Park, C.K.; Kumar, A.; Zhou, T. Advance and prospectus of seasonal prediction: assessment of the APCC/CliPAS 14-model ensemble retrospective seasonal prediction (1980–2004). Clim. Dyn. 2009, 33, 93–117. [Google Scholar] [CrossRef]
- Taylor, K.E.; Stouffer, R.J.; Meehl, G.A. An Overview of CMIP5 and the Experiment Design. Bull. Am. Meteorol. Soc. 2012, 93, 485–498. [Google Scholar] [CrossRef]
- Bellenger, H.; Guilyardi, E.; Leloup, J.; Lengaigne, M.; Vialard, J. ENSO representation in climate models: From CMIP3 to CMIP5. Clim. Dyn. 2014, 42, 1999–2018. [Google Scholar] [CrossRef]
- Cane, M.A. The evolution of El Niño, past and future. Earth Planet. Sci. Lett. 2005, 230, 227–240. [Google Scholar] [CrossRef]
- Guilyardi, E.; Bellenger, H.; Collins, M.; Ferrett, S.; Cai, W.; Wittenberg, A. A first look at ENSO in CMIP5. CLIVAR Exch. 2012, 17, 29–32. [Google Scholar]
- Stevenson, S.; Fox-Kemper, B.; Jochum, M.; Neale, R.; Deser, C.; Meehl, G. Will There Be a Significant Change to El Niño in the Twenty-First Century? J. Clim. 2012, 25, 2129–2145. [Google Scholar] [CrossRef]
- Turner, A.G.; Annamalai, H. Climate change and the South Asian summer monsoon. Nat. Clim. Chang. 2012, 2, 587–595. [Google Scholar] [CrossRef]
- Roxy, M.K.; Ritika, K.; Terray, P.; Murtugudde, R.; Ashok, K.; Goswami, B.N. Drying of Indian subcontinent by rapid Indian Ocean warming and a weakening land-sea thermal gradient. Nat. Commun. 2015, 6. [Google Scholar] [CrossRef] [PubMed] [Green Version]
- Annamalai, H.; Hafner, J.; Sooraj, K.P.; Pillai, P. Global Warming Shifts the Monsoon Circulation, Drying South Asia. J Clim. 2012. [Google Scholar] [CrossRef]
- Cash, B.A.; Barimalala, R.; Kinter, J.L.; Altshuler, E.L.; Fennessy, M.J.; Manganello, J.V.; Molteni, F.; Towers, P.; Vitart, F. Sampling variability and the changing ENSO–monsoon relationship. Clim. Dyn. 2017, 48, 4071–4079. [Google Scholar] [CrossRef]
- Jourdain, N.C.; Gupta, A.S.; Taschetto, A.S.; Ummenhofer, C.C.; Moise, A.F.; Ashok, K. The Indo-Australian monsoon and its relationship to ENSO and IOD in reanalysis data and the CMIP3/CMIP5 simulations. Clim. Dyn. 2013, 41, 3073–3102. [Google Scholar] [CrossRef]
- Roy, I.; Tedeschi, R.G. Influence of ENSO on regional ISM precipitation-local atmospheric Influences or remote influence from Pacific. Atmosphere 2016, 7, 25. [Google Scholar] [CrossRef]
- Roy, I.; Tedeschi, R.G.; Collins, M. Asymmetry in different types of ENSO and related teleconnection with the Indian Summer Monsoon. Int. J. Climatol. 2017, 37, 1794–1813. [Google Scholar] [CrossRef]
- Annamalai, H.; Hamilton, K.; Sperber, K.R. The South Asian summer monsoon and its relationship with ENSO in the IPCC AR4 simulations. J. Clim. 2007, 20, 1071–1092. [Google Scholar] [CrossRef]


| Model Centre | Model Type | Model ID (Chosen) | High Top (H)/Low Top (L) | |
|---|---|---|---|---|
| CMIP5 | AMIP5 | |||
| CSIRO-BOM, Australia | ACCESS1.0 | ACCESS1.0 | A | L |
| ACCESS1.3 | ACCESS1.3 | B | L | |
| BCC, China | BCC-CSM1.1 | BCC-CSM1.1 | C | L |
| BCC-CSM1.1(m) | BCC-CSM1.1(m) | D | L | |
| GCESS, China | BNU-ESM | BNU-ESM | E | L |
| CCCMA, Canada | CanESM2 | CanAM4 | F | L |
| NCAR, USA | CCSM4 | CCSM4 | G | L |
| CMCC, Italy | CMCC-CM | CMCC-CM | H | L |
| CNRM-CERFACS, France | CNRM-CM5 | CNRM-CM5 | I | L |
| CSIRO-QCCCE, Australia | CSIRO-Mk3.6.0 | CSIRO-Mk3.6.0 | J | L |
| LASG-CESS, China | FGOALS-g2 | FGOALS-g2 | K | L |
| LASG-IAP, China | FGOALS-s2 | FGOALS-s2 | L | L |
| INM, Russia | INM-CM4 | INM-CM4 | M | L |
| MIROC, Japan | MIROC5 | MIROC5 | N | L |
| NCC, Norway | NorESM1-M | NorESM1-M | O | L |
| NOAA-GFDL, USA | GFDL-CM3 | GFDL-CM3 | P | H |
| MOHC, England | HadGEM2-CC | HadGEM2-A | Q | H |
| NASA-GISS, USA | GISS-E2-R | GISS-E2-R | R | H |
| IPSL, France | IPSL-CM5A-LR | IPSL-CM5A-LR | S | H |
| IPSL-CM5A-MR | IPSL-CM5A-MR | T | H | |
| MPI-M, Germany | MPI-ESM-LR | MPI-ESM-LR | U | H |
| MPI-ESM-MR | MPI-ESM-MR | V | H | |
| MRI, Japan | MRI-CGM3 | MRI-CGCM3 | W | H |
| Model ID | CMIP5 Model Name | Correlation: Rainfall vs. Niño 3.4 | |||||
|---|---|---|---|---|---|---|---|
| Whole India | Region (CI) | Region (CII) | |||||
| Historical | RCP | Historical | RCP | Historical | RCP | ||
| A | ACCESS1.0 | −0.33 | −0.19 | −0.13 | −0.14 | −0.14 | −0.20 |
| B | ACCESS1.3 | −0.42 | −0.24 | −0.29 | −0.13 | −0.28 | −0.07 |
| C | BCC-CSM1.1 | −0.14 | −0.15 | −0.14 | −0.14 | −0.14 | −0.14 |
| D | BCC-CSM1.1(m) | −0.42 | −0.03 | −0.34 | −0.17 | −0.43 | −0.22 |
| E | BNU-ESM | −0.51 | −0.64 | −0.33 | −0.18 | −0.29 | −0.04 |
| F | CanESM2 | −0.52 | −0.64 | −0.33 | −0.34 | −0.33 | −0.35 |
| G | CCSM4 | −0.71 | −0.57 | −0.42 | −0.14 | −0.47 | −0.36 |
| H | CMCC-CM | −0.18 | −0.29 | −0.33 | −0.51 | −0.35 | −0.55 |
| I | CNRM-CM5 | −0.40 | −0.36 | −0.37 | −0.37 | −0.40 | −0.33 |
| J | CSIRO-Mk3.6.0 | −0.24 | −0.31 | −0.28 | −0.40 | −0.28 | −0.37 |
| K | FGOALS-g2 | −0.31 | −0.51 | −0.30 | −0.48 | −0.26 | −0.48 |
| L | FGOALS-s2 | −0.37 | −0.51 | −0.29 | −0.44 | −0.18 | −0.33 |
| M | INM-CM4 | −0.45 | −0.40 | −0.38 | −0.28 | −0.33 | −0.22 |
| N | MIROC5 | −0.64 | −0.74 | −0.35 | −0.39 | −0.30 | −0.48 |
| O | NorESM1-M | −0.79 | −0.70 | −0.51 | −0.47 | −0.59 | −0.52 |
| P | GFDL-CM3 | −0.49 | −0.27 | −0.25 | −0.22 | −0.26 | −0.20 |
| Q | HadGEM2-CC | −0.27 | −0.26 | −0.38 | −0.32 | −0.36 | −0.35 |
| R | GISS-E2-R | −0.26 | −0.56 | −0.07 | −0.26 | −0.06 | −0.25 |
| S | IPSL-CM5A-LR | −0.61 | −0.61 | −0.54 | −0.57 | −0.62 | −0.61 |
| T | IPSL-CM5A-MR | −0.69 | −0.56 | −0.64 | −0.53 | −0.67 | −0.54 |
| U | MPI-ESM-LR | −0.36 | −0.47 | −0.37 | −0.51 | −0.23 | −0.52 |
| V | MPI-ESM-MR | −0.17 | −0.36 | −0.27 | −0.49 | −0.15 | −0.37 |
| W | MRI-CGM3 | −0.10 | 0.11 | −0.51 | −0.47 | −0.24 | −0.22 |
© 2017 by the author. Licensee MDPI, Basel, Switzerland. This article is an open access article distributed under the terms and conditions of the Creative Commons Attribution (CC BY) license (http://creativecommons.org/licenses/by/4.0/).
Share and Cite
Roy, I. Indian Summer Monsoon and El Niño Southern Oscillation in CMIP5 Models: A Few Areas of Agreement and Disagreement. Atmosphere 2017, 8, 154. https://doi.org/10.3390/atmos8080154
Roy I. Indian Summer Monsoon and El Niño Southern Oscillation in CMIP5 Models: A Few Areas of Agreement and Disagreement. Atmosphere. 2017; 8(8):154. https://doi.org/10.3390/atmos8080154
Chicago/Turabian StyleRoy, Indrani. 2017. "Indian Summer Monsoon and El Niño Southern Oscillation in CMIP5 Models: A Few Areas of Agreement and Disagreement" Atmosphere 8, no. 8: 154. https://doi.org/10.3390/atmos8080154
APA StyleRoy, I. (2017). Indian Summer Monsoon and El Niño Southern Oscillation in CMIP5 Models: A Few Areas of Agreement and Disagreement. Atmosphere, 8(8), 154. https://doi.org/10.3390/atmos8080154