Abstract
Using an automated data processing algorithm, we examined electric field records of 5498 negative cloud-to-ground flashes reported by the U.S. National Lightning Detection Network (NLDN) within 50 to 500 km of the Lightning Observatory in Gainesville (LOG), Florida. Out of the 5498 flashes, 3496 (64%) had detectable preliminary breakdown (PB) pulse trains. Only 3077 flashes with a single PB pulse train and NLDN-reported first-return-stroke (RS) peak current ≥50 kA were selected for detailed analysis. The arithmetic mean values of PB pulse train duration, PB-RS interval, and PB/RS pulse peak ratio were 2.7 ms, 8.8 ms, and 0.15, respectively. The PB-RS interval was found to decrease with increasing RS peak current (Spearman correlation coefficient was statistically significant and equal to −0.80). The range-normalized PB pulse peak exhibited statistically significant positive correlation with the RS peak current, with Spearman correlation coefficient being 0.48. Thus, it appears that the high-intensity (≥50 kA) negative lightning is characterized by shorter (and, by inference, faster) stepped leaders and more pronounced PB pulse trains.
1. Introduction
Preliminary breakdown (PB), also referred to as initial breakdown (particularly in cloud flashes), is one of the most mysterious lightning processes. Clarence and Malan [1] suggested that PB in negative cloud-to-ground flashes is a vertical discharge between the main negative charge region and the lower positive charge region in the cloud. However, Krehbiel et al. [2], from eight-station electric field measurements, found that breakdown events before the stepped leader involved considerable horizontal extent. Rakov and Uman [3] stated that the PB process can be viewed as a sequence of channels extending in seemingly random directions from the cloud charge source with one of them evolving into the stepped leader propagating to ground. More recent studies of preliminary breakdown by Stolzenburg et al. [4,5], who used high-speed video and electric field records, indicated that the PB luminosity bursts were correlated with the PB pulses in the corresponding electric field records and suggested that each PB pulse was caused by a substantial current surge traversing a channel segment of the order of hundreds of meters in length. Nag and Rakov [6], via modeling, estimated the PB pulse peak currents to be of the order of tens of kiloamperes, comparable to or even exceeding the corresponding return-stroke peak current.
Preliminary breakdown in negative cloud-to-ground lightning flashes at relatively large distances produces a sequence of bipolar electric and magnetic field pulses, typically occurring a few tens of milliseconds before the first return stroke pulse. The typical PB pulse-train duration is 2–3 ms [7,8], and typical PB pulse width is 20–40 µs [9]. The peaks of the largest PB pulses can be comparable to or even exceed that of the following return stroke (RS) pulse [7,8,10]. Using the electric field records obtained in 2006 at the Lightning Observatory in Gainesville (LOG), Florida, Nag and Rakov [11] found that only 18% of negative cloud-to-ground flashes had detectable PB pulse trains. However, Baharudin et al. [8] and Marshall et al. [12] found that each of the flashes recorded by them in Florida had a PB pulse train. The peaks of PB pulses were found [12,13,14] to be significantly higher in higher-latitude (temperate) regions than their counterparts in lower-latitude (tropical or subtropical) regions. Gomes et al. [13] and Nag and Rakov [14] attributed this difference to the existence of a more significant lower positive charge region (LPCR) in higher-latitude locations.
Brook [10] found that PB pulses produced in winter storms were more intense than in summer storms. Also, he found the time interval between the peaks of the first PB pulse and the first-return-stroke pulse (PB-RS interval) in winter storms to be a factor of four shorter than in summer storms. The shortest PB-RS interval in his study was 2.5 ms, observed in winter. He attributed the disparity to the difference in precipitation mixes in summer and winter thunderclouds. However, many researchers observed [15,16,17,18,19] PB-RS intervals as short as a few milliseconds in summer storms. For the short PB-RS interval events, Heavner et al. [15] and Zhu et al. [17] inferred leader speeds of the order of 106 m/s, which is an order of magnitude greater than typical speeds of negative stepped leaders. Nag and Rakov [14] and Kolmasova et al. [16] suggested that such unusually fast stepped leaders are produced by unusually strong negative charge sources. According to Nag and Rakov [14], only 5% of stepped leaders in Florida have durations shorter than 5 ms. The events with short PB-RS intervals were recently found by Kotovsky et al. [18] to be associated with long-lasting disturbances in the upper mesosphere and lower ionosphere.
In this paper, distant (50 to 500 km) electric field waveforms of PB pulses in negative cloud-to-ground lightning flashes characterized by relatively high (≥50 kA) first-RS peak currents are analyzed by using an automated data processing algorithm. The following parameters are examined: PB-RS interval, the ratio of peaks of the largest PB pulse and the corresponding first-return-stroke pulse (PB/RS pulse peak ratio), range-normalized peak of the largest PB pulse, and PB pulse train duration. The sample size in this study is an order of magnitude greater than those in previous studies.
2. Experimental Setup
All the electric field records in this study were acquired at the Lightning Observatory in Gainesville (LOG), Florida, in 2014. The electric field measuring system included an elevated circular plate antenna followed by an integrator/amplifier with a decay time constant of 10 ms. The frequency bandwidth was 16 Hz to 10 MHz. Signals from the antenna were relayed to an oscilloscope via a fiber optical link. The vertical resolution of the oscilloscope was 8 bits and the sampling rate was 50 Msamples/s (sampling interval was 20 ns). The record length for each flash was 2 s with 700 ms pretrigger. The system was triggered when the electric field change produced by lightning exceeded a fixed threshold. This triggering scheme resulted in some bias toward a larger fraction of higher-intensity events in the records from larger distances. Unfortunately, this bias did not allow us to meaningfully compare, for the same azimuth, the stroke intensity over land and over salt water, since the over-salt-water events were farther away from the LOG than the over-land events. The electric field measuring system at LOG was mostly triggered by first strokes in cloud-to-ground (CG) flashes, although triggering by other lightning processes occasionally occurred. Data from the U.S. National Lightning Detection Network (NLDN) were used to provide the location and first RS peak current for each flash. The median values of NLDN location error and absolute peak current estimation error were found [20] to be 334 m and 14%, based on a comparison of NLDN responses to rocket-triggered lightning with ground-truth data.
3. Data and Methodology
In order to process LOG electric field data more efficiently, an automated procedure was developed to match NLDN data and LOG electric field records (all GPS-time-stamped), process the electric field data, detect the PB pulse trains and corresponding first RS pulses, and measure parameters of those trains, as well as the PB-RS time interval. The automated procedure is described below and illustrated in Figure 1.

Figure 1.
Flowchart of the automated data processing algorithm. LOG, Lightning Observatory in Gainesville, Florida; NLDN, U.S. National Lightning Detection Network; PB, preliminary breakdown; RS, return stroke.
Step 1. Find LOG records containing NLDN-reported negative first strokes
For each LOG electric field record, we define a 3-ms time window centered at the GPS time stamp of the record. Then we search the NLDN negative flash dataset containing information only on the first stroke in each flash (subsequent strokes in multiple-stroke flashes are not included in this dataset) in the 50 to 500 km range of distances from the LOG to see if the NLDN detected a first stroke in that 3-ms window. If no NLDN-reported first stroke is found, the electric field record is discarded. If the NLDN reported a first stroke within the 3-ms time window (within ±1.5 ms of the LOG trigger) and within 50 to 500 km of LOG, we go to step 2. During step 1, LOG records triggered by subsequent strokes, cloud discharges, and close (<50 km) lightning events (which may contain significant non-radiation field components that make the automated detection of pulses difficult), as determined by the NLDN, are excluded from this study.
Step 2. Exclude LOG records that are saturated or contain other strokes prior to the first stroke of interest
If an NLDN-reported first stroke is found in step 1, we further check, in a 60-ms window (within −50 ms to +10 ms relative to the record GPS time stamp) if (1) the field record is saturated or (2) one or more strokes are found up to 50 ms prior to the first return stroke. This is accomplished by using another NLDN dataset which includes information on both first and subsequent strokes in each flash. The 50-ms pre-return-stroke interval was selected because 95% of PB-RS intervals in Florida negative CGs are less than 50 ms [8,17]. Occurrence of other return strokes (e.g., from a different flash) less than 50 ms prior to the first return stroke would not allow us to adequately examine the PB-RS time interval. If the record is saturated or there are other return strokes within 50 ms prior to the first return stroke of interest, the record is discarded. Otherwise, we go to step 3.
Step 3. Reduce noise
At this point, ideally, we have a 60-ms (−50 ms to +10 ms) electric field records with the first return stroke at t = 0 and possibly cloud pulses before and after the first return stroke. Additionally, we allowed the occurrence of subsequent strokes (using the NLDN temporal and spatial criteria to group strokes into flashes) between 0 and +10 ms, which would not interfere with our analysis. The 60-ms records were passed through the moving-average and power-line-noise-removal filters to remove 60-Hz power-line noise and to improve the signal/noise ratio. The power-line-noise-removal filter generates a 60-Hz sinusoidal waveform, based on the phase and amplitude of the power-line signal found from the 60-ms record, and subtracts that sinusoidal waveform from the original record. The moving-average window was 0.6 µs (31 points). After reducing noise we go to step 4.
Step 4. Identify and characterize individual pulses
From the beginning of the 60-ms record to 1.4 ms prior to the first return stroke (from −60 ms to −1.4 ms), we search each record to identify all unipolar pulses wider than 2.5 µs and all bipolar pulses wider than 5 µs with amplitudes greater than three times the residual noise level. Bipolar pulses were defined as composites of two consecutive monopolar pulses of opposite polarity separated by a time interval shorter than one-tenth of the width of the first pulse. The criteria used at this step were optimized by the trial-and-error method to achieve the best discrimination of lightning-generated pulses from residual noise. The −1.4 ms upper limit for the pulse search window was needed to exclude pulses generated by the stepped leader near ground; also, no PB-RS intervals shorter than 1.4 ms were reported for Florida lightning in [17,21]. At the end of this step, we have amplitudes and widths of all pulses in the search window. Then we go to step 5.
Step 5. Identify PB pulse trains (if any) and measure parameters of the train
We consider as a pulse train a sequence of at least three detected bipolar pulses. Pulses that are separated from the last pulse of the train by more than 2 ms are considered not belonging to that train, which is the same criterion as that used in [11,17]. If no PB pulse train is identified, the flash is labeled as having no detectable PB pulses and not included in further analysis. If one or more PB pulse trains are identified, the flash is considered as a flash with detectable PB pulses. In the following, we consider only pulses that belong to PB pulse trains. If a record contains one or more detected PB pulse trains, the automated data processing code will output a plot showing the 60-ms filtered electric field record, including the first-return-stroke pulse and all detected PB pulses, each marked by a box, along with all the pertinent information (given in a table above the plot) about this event, including the filename, date, location, NLDN-reported peak current, and all the PB pulse train parameters (including the PB-RS interval). An example of the output plot is shown in Figure 2.

Figure 2.
(a) An example of the output figure produced by the automated data processing algorithm, which includes a table containing pertinent information about the flash; (b) Expansion of the initial part of the PB pulse train shown in (a) with the detected PB pulses marked by boxes. The d.u. stands for digitizer units.
From August to October 2014, during 31 storms, thousands of electric field records were obtained and processed using the automated algorithm described above. For a total of 5498 flashes with NLDN-reported first return strokes, 3496 (64%) had detectable PB pulse trains. The NLDN-reported locations of all the 5498 first strokes are shown in Figure 3. Since (1) the algorithm excluded all flashes that occurred within 50 km of LOG and (2) the average distance to LOG for the 5498 accepted flashes was 235 km, our dataset is biased toward flashes with higher peak currents. Specifically, the arithmetic mean (AM) and geometric mean (GM) of NLDN-reported peak currents are 119 kA and 104 kA, respectively, for all the 5498 events, and 124 kA and 109 kA, respectively, for 3496 events with detectable PB pulse trains, which are considerably higher than the GM value of 30 kA for first strokes in negative lightning [3]. A histogram of NLDN-reported peak currents for the 3496 events with detectable PB pulse trains is shown in Figure 4. In this study, we excluded 133 events with multiple PB pulse trains and considered only high-intensity events with the NLDN-reported first-stroke peak currents ≥50 kA, for which the sample size was 3077 and the GM peak current was 122 kA.

Figure 3.
NLDN-reported locations of the 5498 negative first strokes within 50 to 500 km of LOG.

Figure 4.
Histogram of NLDN-reported peak currents for the 3496 negative first strokes in flashes with detectable PB pulse trains. The arithmetic mean (AM) and geometric mean (GM) distances to LOG for the 3496 flashes are 229 and 201 km, respectively.
4. Characteristics of PB Pulse Trains
We found that 133 (3.8%) of 3496 flashes with detectable PB pulses had multiple PB pulse trains. In order to avoid ambiguity, these 133 events were excluded from the analysis presented in this section. Further, to limit our analysis to high-intensity events, we also excluded 286 (8.2%) events with NLDN-reported peak current <50 kA, so that the sample size here is reduced to 3077 with the total number of bipolar pulses being 43,010. Statistics for the PB-RS interval, PB/RS pulse peak ratio, PB pulse train duration, and bipolar pulse width, as well as for the NLDN-reported current and distance are given in Table 1.

Table 1.
Characterization of PB pulses in 3077 negative flashes each containing a single PB pulse train.
The AM PB/RS pulse peak ratio of 0.15 in Table 1 is comparable to the AM values of 0.20 to 0.29 reported in [8,12,17]. The AM PB-RS interval of 8.8 ms in Table 1 is more than a factor of two smaller than previously reported, this disparity being likely due to the very high AM peak current of 134 kA (GM = 122 kA) in our dataset. The AM and GM values of PB pulse train duration in Table 1 are somewhat longer than their counterparts, 2.2 and 1.7 ms, respectively, given in [17]. The AM and GM bipolar pulse widths in Table 1 are 25 µs and 21µs, respectively, which are consistent with typical widths of 20–40 µs reported by Rakov et al. [9]. Histograms of the parameters of PB pulses summarized in Table 1 are shown in Figure 5, Figure 6, Figure 7 and Figure 8.

Figure 5.
Histogram of PB/RS pulse peak ratio for the 3077 flashes.

Figure 6.
Histogram of PB-RS interval for the 3077 flashes.

Figure 7.
Histogram of PB pulse train duration for the 3077 flashes.

Figure 8.
Histogram of bipolar pulse width in the 3077 flashes.
Figure 9a shows a scatter plot of PB-RS interval vs. NLDN-reported RS peak current. Clearly, the PB-RS interval tends to decrease with increasing peak current. The best fit curve, y = 1560 × x−1.12 − 0.694, obtained by using the power law function in Matlab is also shown. The Spearman correlation coefficient between the PB-RS interval and the NLDN-reported peak current was determined to be −0.80 with the p-value less than 0.001; this indicates a strong negative correlation which is statistically significant at the 99.9% confidence level. Note that Spearman correlation coefficient is a non-parametric measure of rank correlation [22], which is used to assess monotonic relationships (not necessarily linear).


Figure 9.
(a) Scatterplot of PB-RS interval versus NLDN-reported RS peak current for 3077 negative first strokes within 50 to 500 km of LOG. The best-fit curve, y = 1560 × x−1.12 − 0.694, is shown by solid line. R is the Spearman correlation coefficient; (b) AM values of PB-RS interval for individual 50-kA bins versus NLDN-reported RS peak current. The standard errors in mean values are shown by vertical bars and the corresponding sample sizes are given above them.
Zhu et al. [23] reported nine negative flashes with short PB-RS intervals, all of which exhibited high (AM = 131 kA) NLDN-reported peak currents. For five of the nine events, the corresponding Lightning Mapping Array (LMA) data were available and showed that the first LMA source heights ranged from 4.8 to 6 km. Based on these observed flash initiation heights and corresponding PB-RS intervals (stepped leader durations), Zhu et al. [23] estimated the average 1D stepped-leader speed to be 1.2 × 10⁶ m/s, which (although an underestimate) is almost an order of magnitude higher than 2 × 10⁵ m/s thought (e.g., [3], Chapter 4) to be typical for negative stepped leaders. Thus, the strong correlation seen in Figure 9 suggests that negative flashes with faster stepped leaders tend to have higher first RS peak currents. Jordan et al. [24] found that the subsequent (dart or dart-stepped) leader speed and return-stroke peak current are positively correlated for both natural and rocket-triggered lightning. It is likely that this trend also holds for first strokes initiated by stepped leaders. Note that the sample size in Zhu et al. [23] is small and further observations are needed to estimate more reliably the correlation between the first-stroke peak current and the speed of the corresponding stepped leader.
Scatterplot of the peak of the largest PB pulse normalized to 100 km versus NLDN-reported peak current is shown in Figure 10a. Normalization was performed assuming that the electric field peak in the 50 to 500 km distance range varies as the inverse inclined distance from the elevated PB source to the LOG. The inclined distance was roughly estimated using the NLDN reported horizontal distance and the assumed source height of 6 km. One can see that the maximum normalized PB pulse peak tends to increase with increasing RS peak current. The Spearman correlation coefficient between the maximum normalized PB pulse peak and NLDN-reported peak current is 0.48 and it is statistically significant at the 99.9% confidence level. It is difficult to discern any trend in Figure 10a where the individual data points are shown. However, there is a clear trend (see Figure 10b) for the AM normalized PB pulse peak corresponding to individual 50-kA bins to increase with increasing RS peak current.

Figure 10.
(a) Scatterplot of the peak of the largest PB pulse normalized to 100 km (in digitizer units) versus NLDN-reported RS peak current for the 3077 negative first strokes within 50 to 500 km of LOG. R is the Spearman correlation coefficient; (b) AM values of normalized PB pulse peak for individual 50-kA bins versus NLDN-reported RS peak current. The standard errors in mean values are shown by vertical bars and the corresponding sample sizes are given above them.
Scatterplot of the normalized PB pulse peak vs. PB-RS interval is shown in Figure 11a. The normalized PB pulse peak tends to decrease with increasing PB-RS interval and the corresponding Spearman coefficient is −0.55. It is statistically significant at the 99.9% confidence level. Similar trends were previously observed in Florida [12], Japan [25], and China [26].
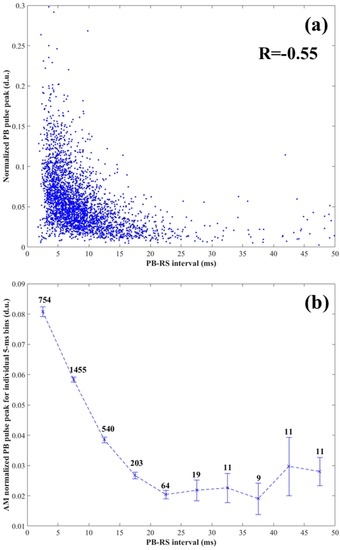
Figure 11.
(a) Scatterplot of the peak of the largest PB pulse normalized to 100 km (in digitizer units) versus PB-RS interval for the 3077 negative first strokes within 50 to 500 km of LOG. R is the Spearman correlation coefficient; (b) AM values of normalized PB pulse peak for individual 5-ms bins versus PB-RS interval. The standard errors in mean values are shown by vertical bars and the corresponding sample sizes are given above them.
5. Summary
Using an automated data processing algorithm, we have examined the characteristics of PB pulse trains and the following first return strokes (RSs) in negative cloud-to-ground lightning flashes in Florida. Out of 5498 flashes within 50 to 500 km of LOG, 3496 (64%) had PB pulse trains that were detected by the automated algorithm. For the 3077 flashes with one detectable PB pulse train and relatively high (≥50 kA) first-stroke peak current, the arithmetic (geometric) mean values of peak current, PB pulse train duration, PB-RS interval, PB/RS pulse peak ratio, and bipolar pulse width were 134 (122) kA, 2.7 (2.2) ms, 8.8 (7.5) ms, 0.15 (0.13), and 25 (21) µs, respectively. The PB-RS interval was found to decrease with increasing NLDN-reported first-stroke peak current, with the corresponding Spearman correlation coefficient being −0.80 (statistically significant at the 99.9% confidence level). Since shorter PB-RS intervals were found to correspond to faster leaders [23], the latter result suggests that negative flashes with faster stepped leaders tend to have higher first-stroke peak currents. The largest range-normalized PB pulse peak exhibited positive correlation with the RS peak current, with Spearman correlation coefficient of 0.48 (statistically significant at the 99.9% confidence level). Thus, it appears that the high-intensity (≥50 kA) negative lightning is characterized by shorter (and, by inference, faster) stepped leaders and more pronounced PB pulse trains. The range-normalized PB pulse peak tended to decrease with increasing the PB-RS interval (Spearman correlation coefficient = −0.55; statistically significant at the 99.9% confidence level).
Acknowledgments
This effort was supported in part by NSF grant AGS-1521747, GRF grant 14.B25.31.0023, and DARPA/STO under AFRL/RYWN’s Spatial, Temporal and Orientation Information in Contested Environments (STOIC) contract FA8650-15-C-7535. The authors would like to thank Ron Holle and William Brooks of Vaisala Inc. for providing the NLDN data.
Author Contributions
Yanan Zhu developed the automated data processing algorithm, collected and analyzed the data, and drafted the manuscript. Vladimir A. Rakov provided the facilities, advised on all aspects of the project, and participated in data analysis and interpretation. Manh D. Tran operated and maintained the instruments at LOG. All authors contributed to discussion of the results and the preparation of the manuscript.
Conflicts of Interest
The authors declare no conflict of interest.
References
- Clarence, N.D.; Malan, D.J. Preliminary discharge processes in lightning flashes to ground. Q. J. R. Meteorol. Soc. 1957, 83, 161–172. [Google Scholar] [CrossRef]
- Krehbiel, P.R.; Brook, M.; McCrory, R.A. An analysis of the charge structure of lightning discharges to ground. J. Geophys. Res. 1979, 84, 2432–2456. [Google Scholar] [CrossRef]
- Rakov, V.A.; Uman, M.A. Lightning: Physics and Effects; Cambridge University Press: New York, NY, USA, 2003. [Google Scholar]
- Stolzenburg, M.; Marshall, T.C.; Karunarathne, S.; Karunarathna, N.; Vickers, L.E.; Warner, T.A.; Orville, R.E.; Betz, H.-D. Luminosity of initial breakdown in lightning. J. Geophys. Res. Atmos. 2013, 118, 2918–2937. [Google Scholar] [CrossRef]
- Stolzenburg, M.; Marshall, T.C.; Karunarathne, S.; Karunarathna, N.; Orville, R.E. Leader observations during the initial breakdown stage of a lightning flash. J. Geophys. Res. Atmos. 2014, 119, 12,198–12,221. [Google Scholar] [CrossRef]
- Nag, A.; Rakov, V.A. A unified engineering model of the first stroke in downward negative lightning. J. Geophys. Res. Atmos. 2016, 121, 2188–2204. [Google Scholar] [CrossRef]
- Nag, A.; Rakov, V.A. Electric field pulse trains occurring prior to the first stroke in negative cloud-to-ground lightning. IEEE Trans. Electromagn. Compat. 2009, 51, 147–150. [Google Scholar] [CrossRef]
- Baharudin, Z.A.; Ahmad, N.A.; Fernando, M.; Cooray, V.; Mäkelä, J.S. Comparative study on preliminary breakdown pulse trains observed in Johor, Malaysia and Florida, USA. Atmos. Res. 2012, 117, 111–121. [Google Scholar] [CrossRef]
- Rakov, V.A.; Uman, M.A.; Hoffman, G.R.; Masters, M.W.; Brook, M. Bursts of pulses in lightning electromagnetic radiation: Observations and implications for lightning test standards. IEEE Trans. Electromagn. Compat. 1996, 38, 156–164. [Google Scholar] [CrossRef]
- Brook, M. Breakdown electric fields in winter storms. Res. Lett. Atmos. Electr. 1992, 12, 47–52. [Google Scholar]
- Nag, A.; Rakov, V.A. Pulse trains that are characteristic of preliminary breakdown in cloud-to-ground lightning but are not followed by return stroke pulses. J. Geophys. Res. 2008, 113, D01102. [Google Scholar] [CrossRef]
- Marshall, T.; Schulz, W.; Karunarathna, N.; Karunarathne, S.; Stolzenburg, M.; Vergeiner, C.; Warner, T. On the percentage of lightning flashes that begin with initial breakdown pulses. J. Geophys. Res. Atmos. 2014, 119, 445–460. [Google Scholar] [CrossRef]
- Gomes, C.; Cooray, V.; Jayaratne, C. Comparison of preliminary breakdown pulses observed in Sweden and in Sri Lanka. J. Atmos. Sol. Terr. Phys. 1998, 60, 975–979. [Google Scholar] [CrossRef]
- Nag, A.; Rakov, V.A. Some inferences on the role of lower positive charge region in facilitating different types of lightning. Geophys. Res. Lett. 2009, 36, L05815. [Google Scholar] [CrossRef]
- Heavner, M.J.; Smith, D.A.; Jacobson, A.R.; Sheldon, R.J. LF/VLF and VHF lightning fast-stepped leader observations. J. Geophys. Res. 2002, 107, 4791–4800. [Google Scholar] [CrossRef]
- Kolmašová, I.; Santolík, O.; Farges, T.; Rison, W.; Lán, R.; Uhlíř, L. Properties of the unusually short pulse sequences occurring prior to the first strokes of negative cloud-to-ground lightning flashes. Geophys. Res. Lett. 2014, 41, 5316–5324. [Google Scholar] [CrossRef]
- Zhu, Y.; Rakov, V.A.; Mallick, S.; Tran, M.D. Characterization of negative cloud-to-ground lightning in Florida. J. Atmos. Sol. Terr. Phys. 2015, 136, 8–15. [Google Scholar] [CrossRef]
- Kotovsky, D.A.; Moore, R.C.; Zhu, Y.; Tran, M.D.; Rakov, V.A.; Pilkey, J.T.; Caicedo, J.A.; Hare, B.; Jordan, D.M.; Uman, M.A. Initial breakdown and fast leaders in lightning discharges producing long-lasting disturbances of the lower ionosphere. J. Geophys. Res. Space Phys. 2016, 121, 5794–5804. [Google Scholar] [CrossRef]
- Frey, H.U.; Mende, S.B.; Cummer, S.A.; Chen, A.B.; Hsu, R.R.; Su, H.T.; Chang, Y.S.; Adachi, T.; Fukunishi, H.; Takahashi, Y. Beta-type stepped leader of elve-producing lightning. Geophys. Res. Lett. 2005, 32, L13824. [Google Scholar] [CrossRef]
- Mallick, S.; Rakov, V.A.; Hill, J.D.; Ngin, T.; Gamerota, W.R.; Pilkey, J.T.; Biagi, C.J.; Jordan, D.M.; Uman, M.A.; Cramer, J.A.; et al. Performance characteristics of the NLDN for return strokes and pulses superimposed on steady currents, based on rocket-triggered lightning data acquired in Florida in 2004–2012. J. Geophys. Res. Atmos. 2014, 119, 3825–3856. [Google Scholar] [CrossRef]
- Baharudin, Z.A.; Fernando, M.; Ahmad, N.A.; Mäkelä, J.S.; Rahman, M.; Cooray, V. Electric field changes generated by the preliminary breakdown for the negative cloud-to-ground lightning flashes in Malaysia and Sweden. J. Atmos. Sol. Terr. Phys. 2012, 84–85, 15–24. [Google Scholar] [CrossRef]
- MacDonald, J.H. Handbook of Biological Statistics; Sparky House Publishing: Baltimore, MD, USA, 2008. [Google Scholar]
- Zhu, Y.; Rakov, V.A.; Mallick, S.; Tran, M.D.; Pilkey, J.; Uman, M.A. Preliminary breakdown pulse trains in electric field records of negative cloud-to-ground lightning. In Proceedings of the XV International Conference on Atmospheric Electricity, Norman, OK, USA, 15–20 June 2014.
- Jordan, D.M.; Idone, V.P.; Rakov, V.A.; Uman, M.A.; Beasley, W.H.; Jurenka, H. Observed dart leader speed in natural and triggered lightning. J. Geophys. Res. Atmos. 1992, 97, 9951–9957. [Google Scholar] [CrossRef]
- Wu, T.; Takayanagi, Y.; Funaki, T.; Yoshida, S.; Ushio, T.; Kawasaki, Z.-I.; Morimoto, T.; Shimizu, M. Preliminary breakdown pulses of cloud-to-ground lightning in winter thunderstorms in Japan. J. Atmos. Sol. Terr. Phys. 2013, 102, 91–98. [Google Scholar] [CrossRef]
- Wang, Y.; Qie, X.; Wang, D.; Liu, M.; Su, D.; Wang, Z.; Liu, D.; Wu, Z.; Sun, Z.; Tian, Y. Beijing Lightning Network (BLNET) and the observation on preliminary breakdown processes. Atmos. Res. 2016, 171, 121–132. [Google Scholar] [CrossRef]
© 2016 by the authors; licensee MDPI, Basel, Switzerland. This article is an open access article distributed under the terms and conditions of the Creative Commons Attribution (CC-BY) license (http://creativecommons.org/licenses/by/4.0/).