Article

Unraveling the Drivers of Seasonal Runoff Dynamics in a Data-Scarce West African Basin: Separate and Combined Impacts of Land Use and Climate Change

1
School of Civil Engineering and Transportation, State Key Laboratory of Subtropical Building Science, South China University of Technology, Guangzhou 510641, China
2
Pazhou Lab, Guangzhou 510335, China
*
Author to whom correspondence should be addressed.
Atmosphere 2026, 17(6), 543; https://doi.org/10.3390/atmos17060543
Submission received: 8 April 2026 / Revised: 20 May 2026 / Accepted: 22 May 2026 / Published: 24 May 2026

Abstract

Environmental changes driven by land use and climate variability profoundly affect basin water balance, yet their separate and combined effects remain poorly understood in data-scarce regions. This study investigates the individual and combined impacts of land use/land cover (LULC) and climate change on seasonal runoff in the Rokel-Seli River Basin (RSRB), Sierra Leone, over two periods (1965–1990 and 1991–2016). Using LULC maps derived from 1988 and 2013 Landsat imagery and the Soil and Water Assessment Tool (SWAT), we simulated hydrological responses under four scenario frameworks. The results reveal a marked expansion of urban, bare, and agricultural land at the expense of forest cover. The SWAT model satisfactorily captured streamflow dynamics during calibration and validation. Land use change alone increased wet-season runoff by 6.55% and decreased dry-season runoff by −13.15%, whereas climate change contributed changes of +24.87% and −31.43%, respectively. A double mass curve analysis and Budyko framework further revealed a regime shift toward higher runoff efficiency (runoff coefficient increased from 0.67 to 0.69), indicating a loss of basin retention capacity. Notably, land use change partially masked the full hydrological deficit induced by climate change, acting as a counter-buffering mechanism. This study provides critical evidence for water resource authorities and local stakeholders to develop adaptive land use and water conservation strategies in data-scarce tropical basins, emphasizing the need to consider both climatic and anthropogenic drivers in seasonal water availability assessments.

1. Introduction

Water resources sustainability and resilient land use practices are indispensable to ecological stability and socioeconomic development. The hydrological cycle and ecosystems are influenced by the synergistic relationship between the changes in land use and land cover (LULC) and climate [1]. Climatic variability driven by rising precipitation and temperature trends directly alters land use dynamics, thereby affecting soil moisture, plant health, and energy balance. These variations are intensified by rapid population growth and socioeconomic factors, such as industrialization, urbanization and agricultural development [2,3,4], a major challenge in many West African basins. Additionally, the connection between sustainable water and population demand is a critical concern in Africa. The surge in anthropogenic pressures leads to the transformation of forests and wetlands into urban and cultivated lands, which could seriously disrupt the water balance in basins as a whole by increasing surface runoff and decreasing groundwater recharge. These alterations are expected to increase due to the rapid water demand and land use alterations, which will exacerbate warmer climatic impacts. Such changes are critical and could compromise water availability due to several unknown anthropogenic activities [5,6], especially in data-sparse regions. Investigating these changes [7,8] historically [9,10] and in the present-day is crucial for instituting suitable adaptation strategies [11,12], ensuring regional long-term water sustainability. Therefore, a comprehensible hydrological impact assessment that quantifies the intricate relationship between climate and LULC change in a basin is judicious.
Most climate change studies were conducted using climatic datasets (temperature, precipitation, wind speed and relative humidity) derived from regional climate models (RCMs) or general circulation models (GCMs). These datasets are used in the investigation of climatic variability in a changing ecology. In China, the climatic impact was investigated on runoff time, magnitude and water resources vulnerability by employing a monthly semi-distributed hydrological model [13]. In other climatic variability studies, hydrological models were constructed to investigate the watershed response, which resulted in soil moisture loss and streamflow changes [10,14,15]. The climatic effects on the regional spatiotemporal redistribution of annual temperature increase have also been studied by [16], revealing that climate change is extremely susceptible to climate change, tending to alter the hydrological cycle [10,14,15].
The changes in LULC have impacted the dynamics of the ecosystem significantly due to anthropogenic activities [17,18]. The LULC changes for agricultural and urbanization purposes [19,20] are affecting the hydrological cycle [5] and altering rainfall, Evapotranspiration (ET) and streamflow [21] in catchments. Especially, its projected temperature increase could eventually affect water accessibility, leading to a reduction in agricultural production and increasing food crises [22]. The transformation of lands to various land use types has a major effect on the environment globally [23], with the increase in human demands [24,25]. In a related study, the LULC from 1996 to 2018 was explored using geographic information systems and remote sensing methods to identify priority areas for sustainable land management practices for the enhancement of agricultural activities [26].
The separate and the combined changes in LULC and climate have a significant impact on water cycle alterations globally, as suggested by many authors. For instance, under multiple scenarios, the combined impacts of LULC and climate change on hydrological parameters in the Dongjiang River basin in China were investigated [27]. Other researchers have also investigated the land use and climate changes in the Potohar Plateau of the Indus basin in Pakistan [28], in Ethiopia [18], and the Pra River in Ghana [29]. In another study, water yield and runoff increased due to infrastructural development and agricultural activities [30], causing an increase in Evapotranspiration (ET) and runoff in the Athi basin [31].
Employing hydrological models is essential in exploring climatic regime change and quantifying the hydrological behaviour in watersheds. In addition, utilizing hydrological models and understanding the hydrological subtleties in basins will significantly help water resources planners with appropriate hydrological designs and water management strategies [32,33,34,35]. The climatic and LULC impacts on the Miami River Basin were investigated using the Hydrological Simulation Program Fortran. Results showed that in the dry season, the basin’s variations are amplified by both impacts, and that land use change (urbanization) could help in the restoration of water availability [36]. However, the SWAT model has stood out as the most successful hydrological model employed in basins to simulate and examine the possible implications of LULC changes to the hydrological parameters. For instance, the Rokel-Seli River Basin was investigated with an increase in runoff at the expense of forest land from 2002 to 2016, due to dam construction [37]. A significant amount of the literature, including the Upper Blue Nile River Basin in Ethiopia [38], the Potohar Plateau in Pakistan [28], Talar River, in Iran [39], the USA [40] and the Dongjiang River, in China [27] has suggested the SWAT model to simulate and evaluate water cycle parameters in basins.
The Rokel-Seli River population growth (due to civil war migration), and infrastructural development have increased water demand, affecting the natural environment and the water cycle. In addition, the civil war has caused limitations in obtaining observed data and spurred rapid mining, timber logging and agricultural activities to satisfy human needs, making the research an arduous task to accomplish. These unaccounted activities in the basin have the potential to alter the hydrological cycle and land use. These effects, coupled with global challenges, will be intensified if appropriate measures are not taken, especially with the increasing water demand. Therefore, the need to investigate the RSRB implications of LULC changes on the hydrological cycle is obvious. Various researchers have attempted to explore these challenges in the RSRB. For instance, the Bumbuna dam expansion and rehabilitation resulted in flooding events affecting farmlands, communities and stream buffer zones due to dam overflow [41,42]. A related study in the RSRB by [43] suggested that streamflow alteration is higher than agricultural demand for irrigation purposes. These anthropogenic changes could cause serious variations in the hydrological cycle, potentially threatening water availability in the basin. The Rokel-Seli River Basin has not only been increasing in deforestation, agricultural and infrastructural development, but also water contamination due to mining activities [44]. Evaluating LULC changes in conjunction with climate variability enables the identification of the dominant variable governing surface runoff and other hydrological parameters [13].
The severity of these activities poses a threat to change the land use and climate, and their responses to the hydrological components are critical, requiring an in-depth investigation. There have been limited explorations comparing the past and present environmental alterations in the basin, which is crucial for water sustainability and proper land use. Elucidating these alterations will foster a deeper understanding of their effects on the basin subjected to rapid agricultural and mining activities (due to population growth). This research resolves these critical gaps by leveraging downscaled temperature and precipitation datasets with observed streamflow data to construct a high-performance hydrological model, datasets that have been utilised by [45]. The scientific merit of this study lies in the synergistic integration of its methodological framework and analytical techniques. Consistent with established literature, in the lack of observed meteorological records, reanalysis datasets offer a viable alternative for forcing hydrological models in data-scarce catchments, effectively curtail the critical bottlenecks associated with gauge networks [46]. To analyse the basin’s heterogeneous hydrological response and to ensure physical consistency, which quantifies water-energy portioning, this study couples the Double Mass Curve (DMC) with Budyko Framework.
This study examines the separate and combined impacts of LULC and climate change on runoff in the Rokel-Seli River Basin from 1965 to 2016. The SWAT model will be constructed using downscaled weather data and their corresponding LULC maps, using the scenario simulation technique. This study’s main objectives involve (a) estimating the LULC transformations (b) using the SWAT model to simulate and evaluate the seasonal changes of runoff and (c) estimating the basin’s hydrological regime variations in a changing environment. The results of this study could enhance stakeholders’ and decision-makers’ understanding of incorporating climate adaptation and land management strategies pertinent to water sustainability.

2. Materials and Methods

2.1. Study Area

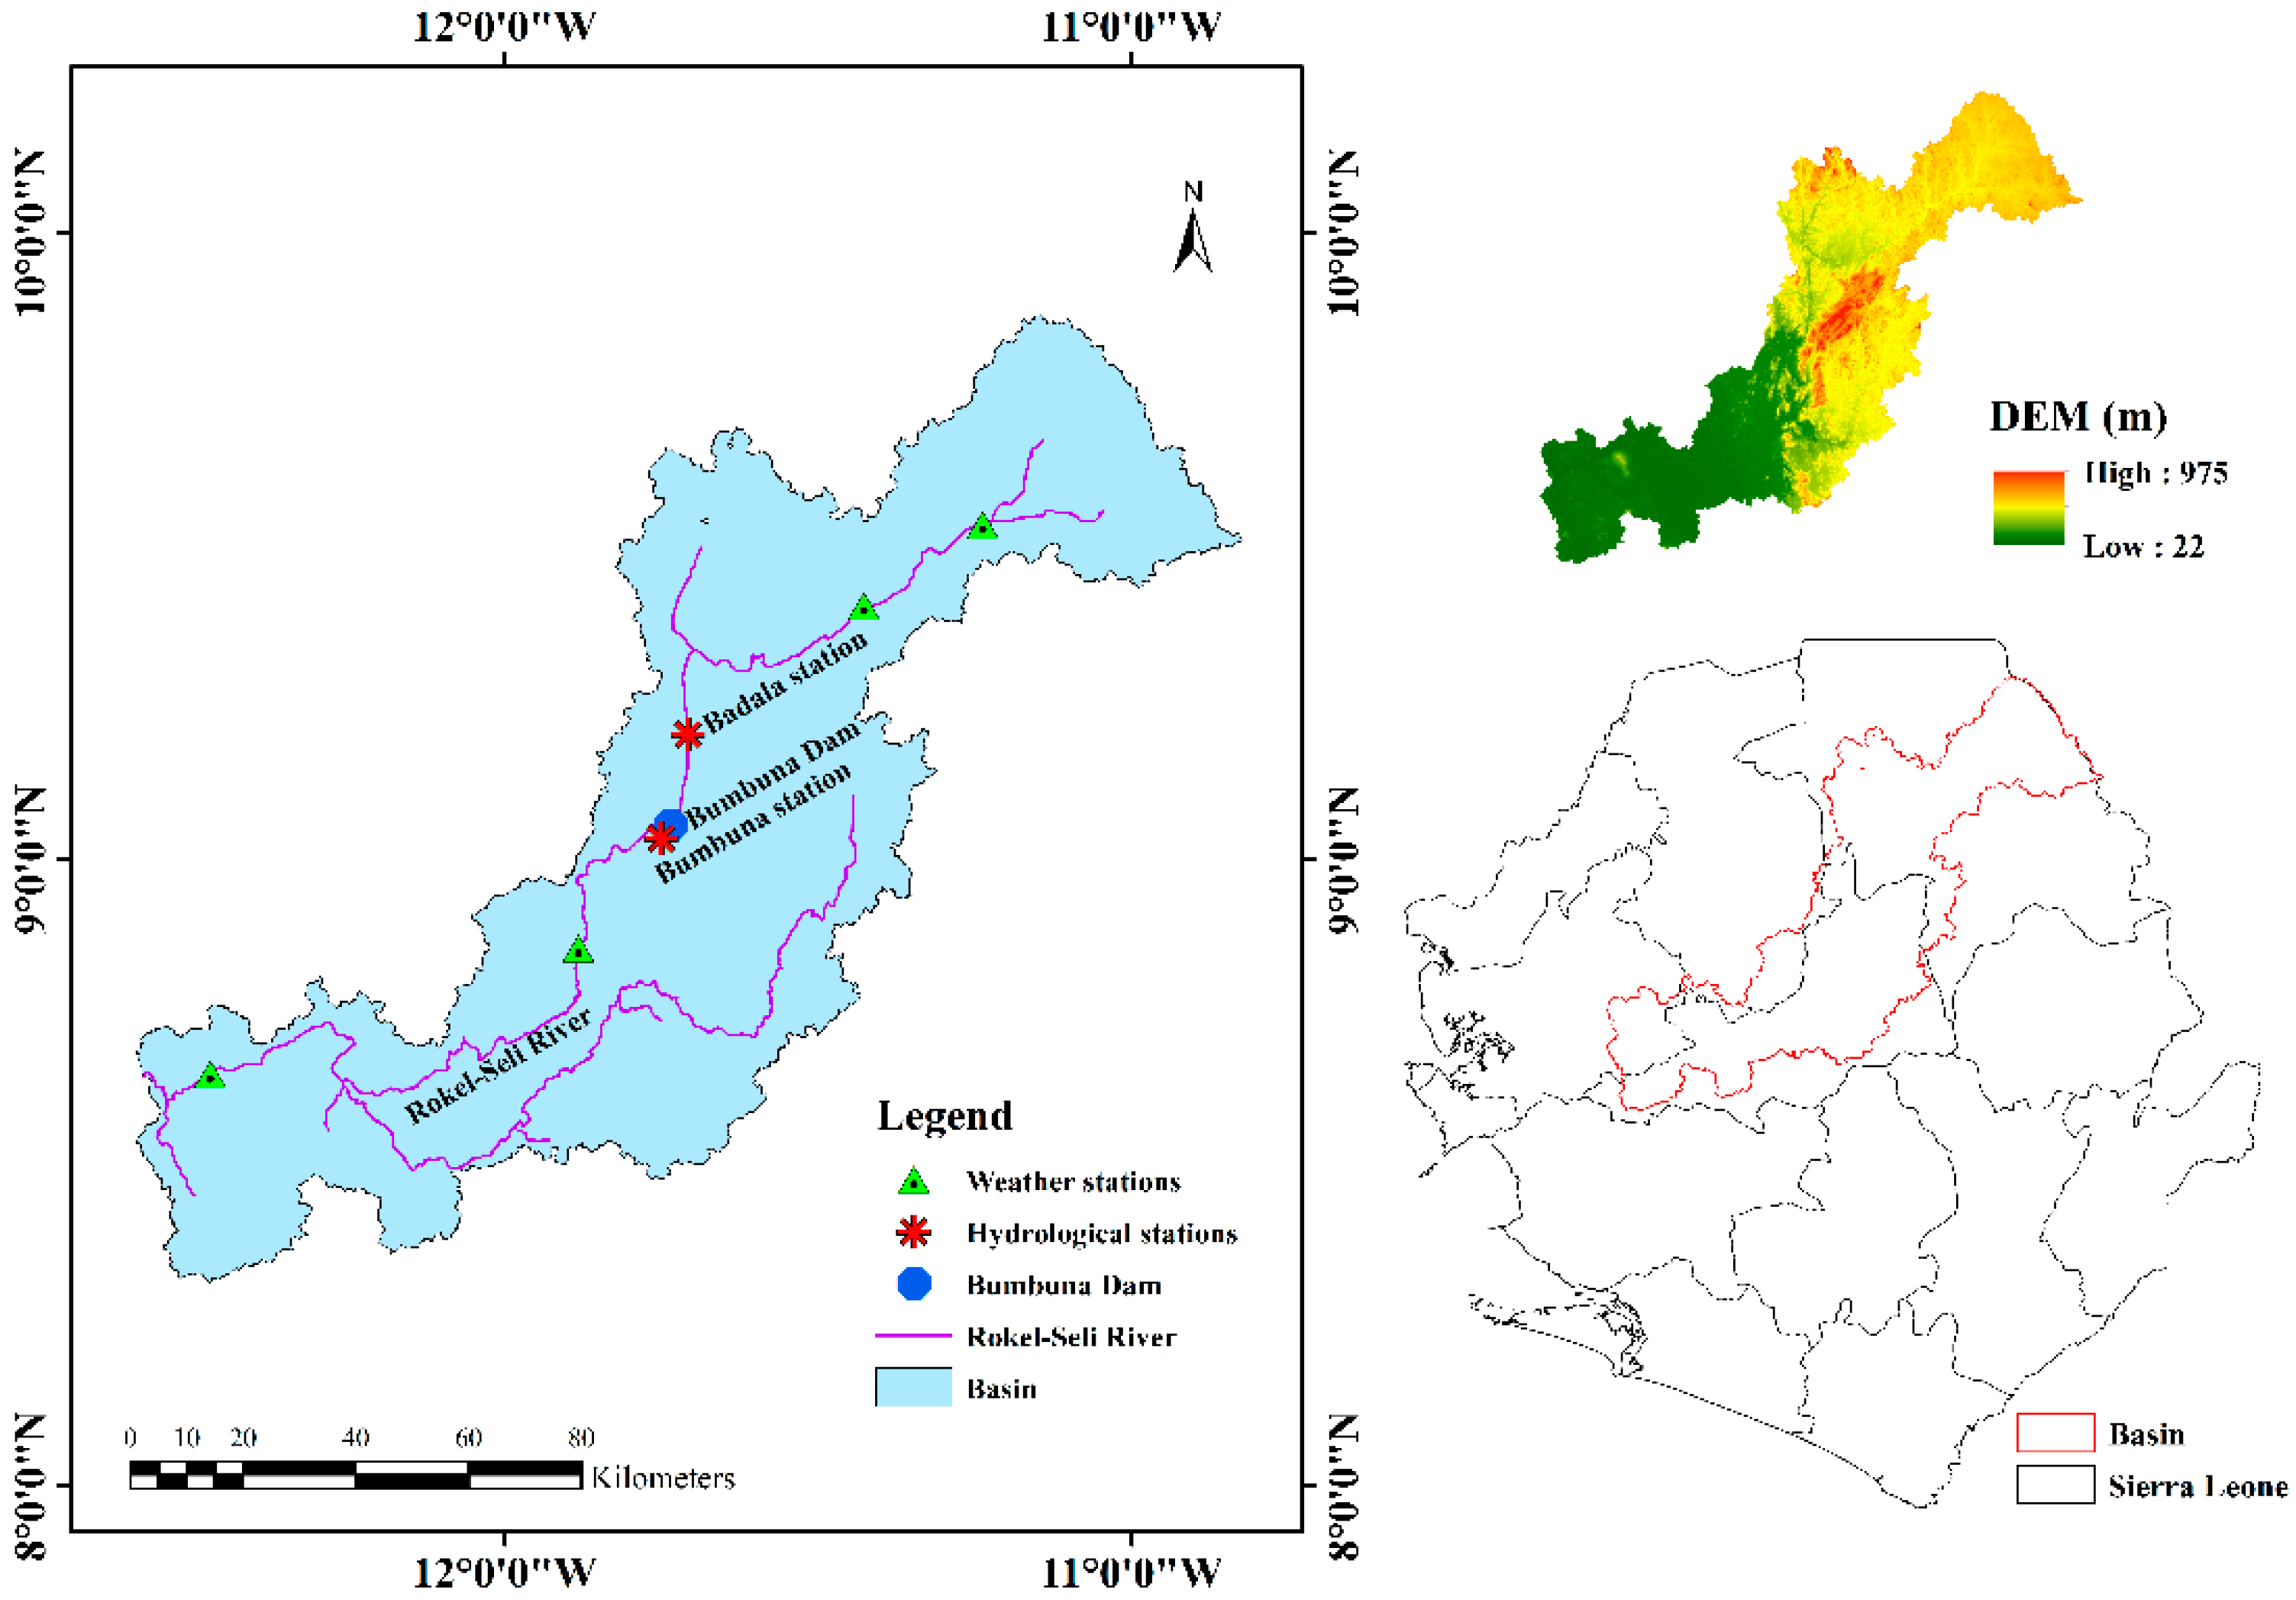
The Rokel-Seli River Basin is one of the largest and most essential rivers located in northern Sierra Leone. The basin starts from the northeast part (Koinadugu district) and empties into the Western area (Atlantic Ocean). It has an approximate area of 10,250 km2 and spans across the country (Figure 1). The Rokel-Seli River Basin is the country’s largest and most economically and socially beneficial river basin, primarily due to the Bumbuna hydroelectric power supply station. It’s a major source of water supply for mining operations, agricultural activities and domestic purposes in many parts of the country, including the capital city (Freetown). The basin comprises the rainy and dry seasons. The wet season is linked with the dominant nature of the tropical monsoon, which encompasses humid air that circulates from the Atlantic Ocean to the west coast of Africa. The dry season is dominated by the Harmattan scorching wind, which blows across the Sub-Saharan belt from northeast to southwest. The country has a temperature ranging between 18–38 °C. The catchment human activities include mining, fishing, farming and cattle rearing [41]. The basin is also used as a recreational river for festivals (in Magburaka town). The basin is currently subjected to human pressure with a growing population of around 730,696 in 2015 (Statistics Sierra Leone, 2016) [47]. The rapid increase in agriculture, deforestation, uncontrolled mining activities, electricity demand, urbanization and industrialization can significantly affect the basin. Therefore, if effective and efficient measures are not taken, it may result in ecological degradation and an unsustainable water supply [41].

2.2. Datasets

2.2.1. Input Data

To successfully build a SWAT model, meteorological, spatial and hydrological data are required. The soil, land use map and digital elevation data (DEM) are the spatial data needed. The Digital Elevation Model was downloaded from USGS Earth Explorer (https://earthexplorer.usgs.gov), under the 30 m Shutter Rader Topography Mission (SRTM) [48] of various tiles covering the study area, which were mosaicked to a single map, and projected to WGS 1984 UTM Zone 29N to ensure area accuracy for runoff computation. The DEM was used for watershed delineation, to estimate flow direction, and to allocate the RSRB into 19 subbasins, also used in [45]. The Harmonized World Soil Database (HWSD) used was extracted from the Food and Agriculture Organization (FAO) with a spatial resolution of 1 × 1 km [27,45], shown in Figure S2a. The historical and current LULC maps for the years 1988 and 2013 were derived from the Landsat 4–5 and Landsat 8 OLI, respectively, with a resolution of 30 m with <10% cloud cover, retrieved from USGS Earth Explorer. The daily climatic data, such as temperature and precipitation, are usually retrieved from GCMs and RCMs datasets [49]. This research used daily downscaled climatic data (temperature and precipitation) from a recent future assessment of the RSRB [45,50] between 1965 and 2016, based on six climatic stations. Given that the study area is data-scarce, only Bumbuna station has available observed weather data (precipitation and temperature), and the remaining five stations were remote sensing data. Further details of the downscaled climatic data are in [45] and other datasets are in Table S1.
The monthly observed discharge data from 1970 to 1979 were retrieved from the Global Runoff Data Centre (GRDC) and the Sierra Leone Meteorological website [51]. The available observed streamflow (1970–1979) datasets’ reliability for the RSRB has been established by [45], where the data yielded a good performance. The available streamflow data used in this study were from Badala station (1970–1977) and Bumbuna station (1970–1979).

2.2.2. Impact Assessment Framework

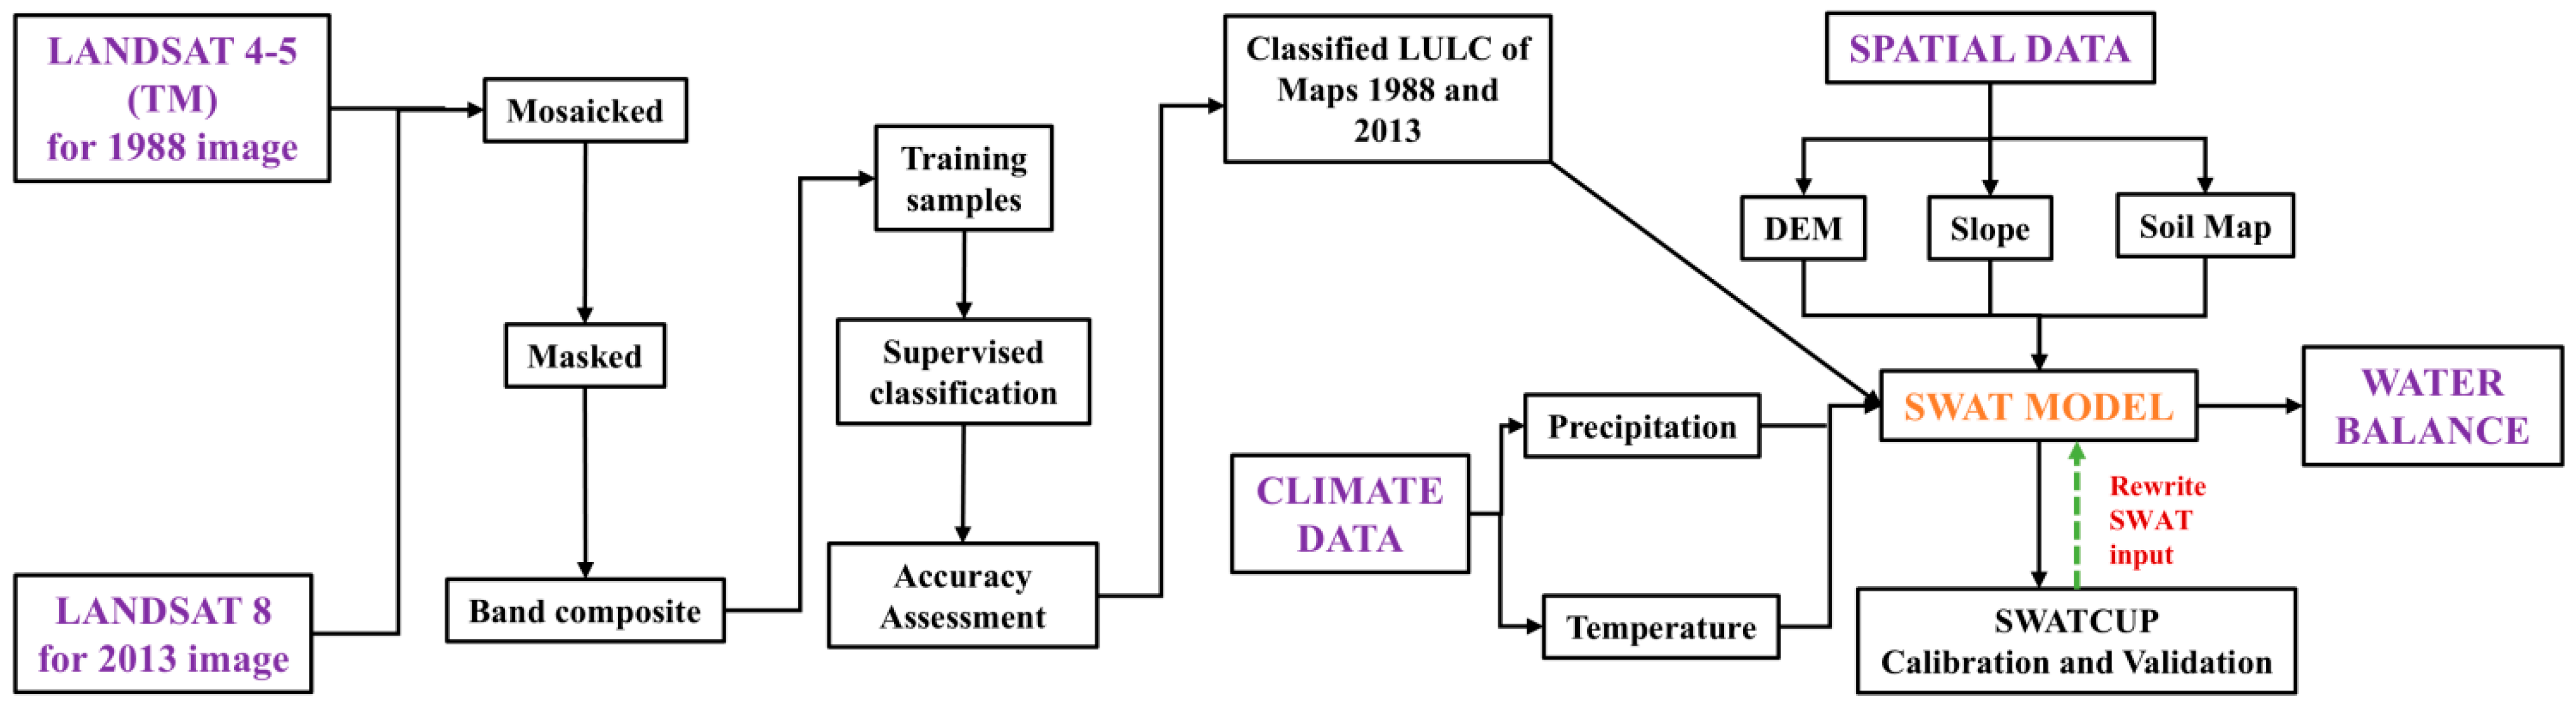
This study’s primary focus is to investigate the impact of climate and LULC change on the RSRB hydrological cycle using the scenario simulation technique with the SWAT model. Establishing a baseline scenario alongside other scenarios will help to adequately unfold the hydrological changes, as shown in Table 1. The differences in the three groups were compared with the baseline scenario. To examine climate change only, alter the climate data and keep other data fixed (S2 − S1). For LULC changes, maintain the climate data and change the LULC data (S3 − S1). And by simultaneously changing LULC and climate data for the combined changes in LULC and climate (S4 − S1). This grouping was mainly done to examine the RSRB hydrological response to runoff, due to climate and LULC changes. The soil and DEM data remained unchanged during the SWAT simulation process. The methodology of this study is organised into LULC map preparation, assessment of LULC maps and examination of the hydrological performance of runoff using the SWAT model under an evolving ecology, shown in Figure 2.

2.3. LULC Classification and Preprocessing Approaches

Land use land cover image classification assessment was accomplished using the Environment for Visualization Images Software (ENVI 5.3). The downloaded tiles of rows 053 and 054 and paths 210 and 202 were mosaicked with a cloud cover of <10%, further reprojected in ArcGIS 10.3 [52,53], and are used to produce the various LULC maps. The downloaded tiles for each land use map were reprojected to WGS 1984 UTM Zone 29N [52,53]. To improve the quality of the raw data, the two tiles were mosaicked, the subset is based on the region of interest (ROI), and radiometric adjustments (atmospheric correction and image sharpening) were performed as part of the preprocessing steps, before classifying the satellite images into various LULC categories [45]. The polygon icon was used to select the region of interest during subsetting. The Maximum Likelihood Classification (MLC) algorithm was used in our study to categorize the images into five LULC classes under the supervised classification technique. The maximum likelihood classification algorithm computes each LULC class exactness and assumes they are evenly distributed. The Rokel basin’s predominant LULC classes produced were forest, agricultural, barren, urban land, and water bodies. The LULC maps produced were from 1988 and 2013. The classified maps were clipped in ENVI 5.3 and used in ArcGIS 10.6 for subsequent analysis. Figure 2 shows the detailed methodology of this study.

2.4. LULC Accuracy Assessment

In LULC changes, accuracy assessment is typically conducted to evaluate the accuracy of each pixel in its corresponding land cover classification [54] and to identify and resolve errors that may have occurred during the classification process [55]. Each map’s accuracy was achieved by comparing the reference map from either Google Earth Pro (v7.3.6.9796, 64-bit), Google Maps, or original Landsat images with the classified map [54,56], by considering various statistical indicators. In our study, after the LULC classification, we compared the classified maps in Google Earth Pro (v7.3.6.9796, 64-bit). The statistical indicators used include the kappa coefficient, overall, user and producer accuracy, which helped examine the classified image reliability [57,58]. The kappa coefficient assesses how well the classified results compare with random expectation values. If the kappa coefficient value is 0, it denotes no agreement between the reference image and the categorized image and a value of 1 shows an accurate classification [59]. These accuracy assessment procedures were followed to confirm the accuracy of the classified 1988 and 2013 LULC maps. The classified images were verified as having poor, medium, or strong agreement with the actual LULC maps [60]. An image with a Kappa coefficient <0.4, 0.4–0.75 and >0.75 implies poor, medium and good agreement, respectively [61]. However, the classified images of 1988 and 2013 were deemed satisfactory and can be used for subsequent analysis. These statistical indicators were computed using Equations (1)–(4).
O v e r a l l   a c c u r a c y = N u m b e r   o f   c o r r c t l y   classified   p i x e l s   ( d i a g o n a l ) T o t a l   n u m b e r   o f   reference   p i x e l s   i n   a   specific   c l a s s × 100 %
U s e r   a c c u r a c y   ( U A ) = N u m b e r   o f   e a c h   c l a s s   c o r r c t l y   classified   p i x e l s   T o t a l   n u m b e r   o f   p i x e l s   i n   a   specific   c l a s s   ( r o w ) × 100 %
P r o d u c e r   a c c u r a c y   ( P A ) = N u m b e r   o f   e a c h   c l a s s   c o r r c t l y   classified   p i x e l s T o t a l   n u m b e r   o f   p i x e l s   i n   a   speciffic   c l a s s   c o l u m n × 100 %
K a p p a   coefficient   ( k ) = ( T S × T C S ) i = 1 n   O a × O b T S 2 i = 1 n   O a × O b × 100 %
where: TS = Total sample, TCS = Total corrected sample, and i = 1 n O a × O b is chance accuracy.

2.5. The SWAT Model Setup, Calibration and Validation Process

Hydrological models are primarily used in the classification and allocation of catchments based on water distribution, climatic changes, water quality and quantity, pollution control, and land use changes [62]. The SWAT 2012 was used in this research, commonly described as a semi-distributed, continuous-time hydrological model [63], and so was the SWAT theoretical documentation [64], designed to study the impact of land management on water, sediment, and pesticide yields in basins [65,66]. The SWAT model has been extensively used to evaluate the climatic response to hydrological structures [67,68], by utilizing daily and monthly data. Additionally, numerous studies have used the SWAT model to examine the past, present and future behaviour of watersheds [27,29,69]. A recent study used the SWAT model to explore the future land use and climate change impacts in a data-scarce region in the RSRB [45]. However, this study intends to use classified land use data between 1988 and 2013, available streamflow dataset (1970–1979), and the SWAT model to investigate the regime shift of the RSRB due to the rapid human and infrastructural development, by using the scenario simulation method. From the 1970s to 2016, the RSRB has undergone anthropogenic modifications, making it imperative to explore these variations.
The model divides the basin into various subbasins linked by a streamflow network. By overlapping land use, soil and slope maps, it signifies the spatial conglomeration of the simulation process [70]. The amalgamation of soil maps, land use, topographical features, and management practices defines HRU [71]. Respectively, within each subbasin, thresholds used were 10, 10 and 5% for soil type, slope class and land use [72]. By considering the baseline scenario as the SWAT input, the RSRB was divided into 19 subbasins and 513 HRUs when constructing the model. The land properties were defined by the hydrological response units (HRU), designating land use, slope and soil type. During the modelling process, LULC and climate input were altered when required. A warm-up period of three years (1965–1967) was used. Then the other datasets were input into the calibrated SWAT model to estimate the hydrological impacts of runoff in a changing environment.
The SWAT Calibration Uncertainty Procedure (SWAT-CUP), which utilizes the Sequential Uncertainty Fitting Version 2 (SUFI-2) algorithm (Abbaspour et al. 2015) [73], was used to calibrate and validate the model. For the Bumbuna station, observed streamflow data from 1970–1977 and 1977–1979 were used for the calibration and validation, respectively, and Badala station, 1970–1974 and 1975–1977. That is, 70 and 30% data from each station. In evaluating the model performance, we used various statistical indicators: Nash–Sutcliffe Efficiency (NSE) [74], Coefficient of determination (R2), Kling–Gupta efficiency (KGE) and Percent of bias (PBIAS). With NSE, R2 and KGE > 0.5 and PBIAS ± 0.25 deemed to be satisfactory [72,75], and determined by the SWAT model equations used by [27,39].

2.6. The Basin Climatic Extremes and Physical Characteristics

The Rokel-Seli River Basin’s geographical location leads to increasing climatic extremes, primarily driven by the increase in thermal trends and spatiotemporal precipitation variations. Pluvial events and droughts are amongst the most significant threats affecting lives and properties. The land use could be transformed by intense rainfall events, which cause flash floods and soil erosion in basins. Conversely, lengthy dry seasons affect the baseflow reliability, disturbing potential hydropower dam operations and the availability of agricultural water.
Temperature and precipitation variations can decrease surface and groundwater flows. Temperature changes can alter evaporation and transpiration processes in basins, affecting the natural ecology and agricultural activities [76]. These climate extremes could hamper water accessibility, affecting power supply, mining activities, and domestic uses in the basin. A condition encountered in the basin, specifically affecting the electricity sector and the fishery ministry, occurs during the dry season. This can be attributed to population growth, resulting in an increase in food demand, expanding other land use for agricultural and infrastructural development. As the basin faced major water abstractors in the middle and downstream areas, such as the Magbess sugar cane farming, Addax irrigation project, Marampa Mines, and artisanal gold mining around the Tonkolili District, these may pollute the Rokel stream. Resolving these challenges requires a comprehensive mechanism that includes land use management and climate adaptation policies.
The Rokel-Seli River Basin should prioritize the exploration of both climate extremes and land use changes for a sustainable ecology, especially with the rising effects of these events. Preserving the buffer zones could prevent sediment deposition and protect stream banks. The investigation of land use in basins creates an awareness of protecting buffer zones, and suggests an in-depth understanding for stakeholders and authorities in implementing best management practices on land and water resources [77].

2.7. Pedological and Land Characteristics

The land characteristics between 1988 and 2013 epochs of the RSRB were defined by mosaicking various land use types, giving a significant transformation of forest land to cultivated, bare and urban land. These shifts have fundamentally altered the hydrological cycle in the basin. The pedological condition of the basin is mostly weathered soils, playing a significant role in the water balance, specifically, the saturated hydraulic conductivity and the soil groups, which influence the operations of surface runoff and infiltration. The main drivers of the pedological and land use conditions in the basin are Runoff Curve Number (CN2) and Baseflow alpha factor (ALPHA_BF) [45].

3. Results

3.1. Accuracy Assessment of LULC Maps

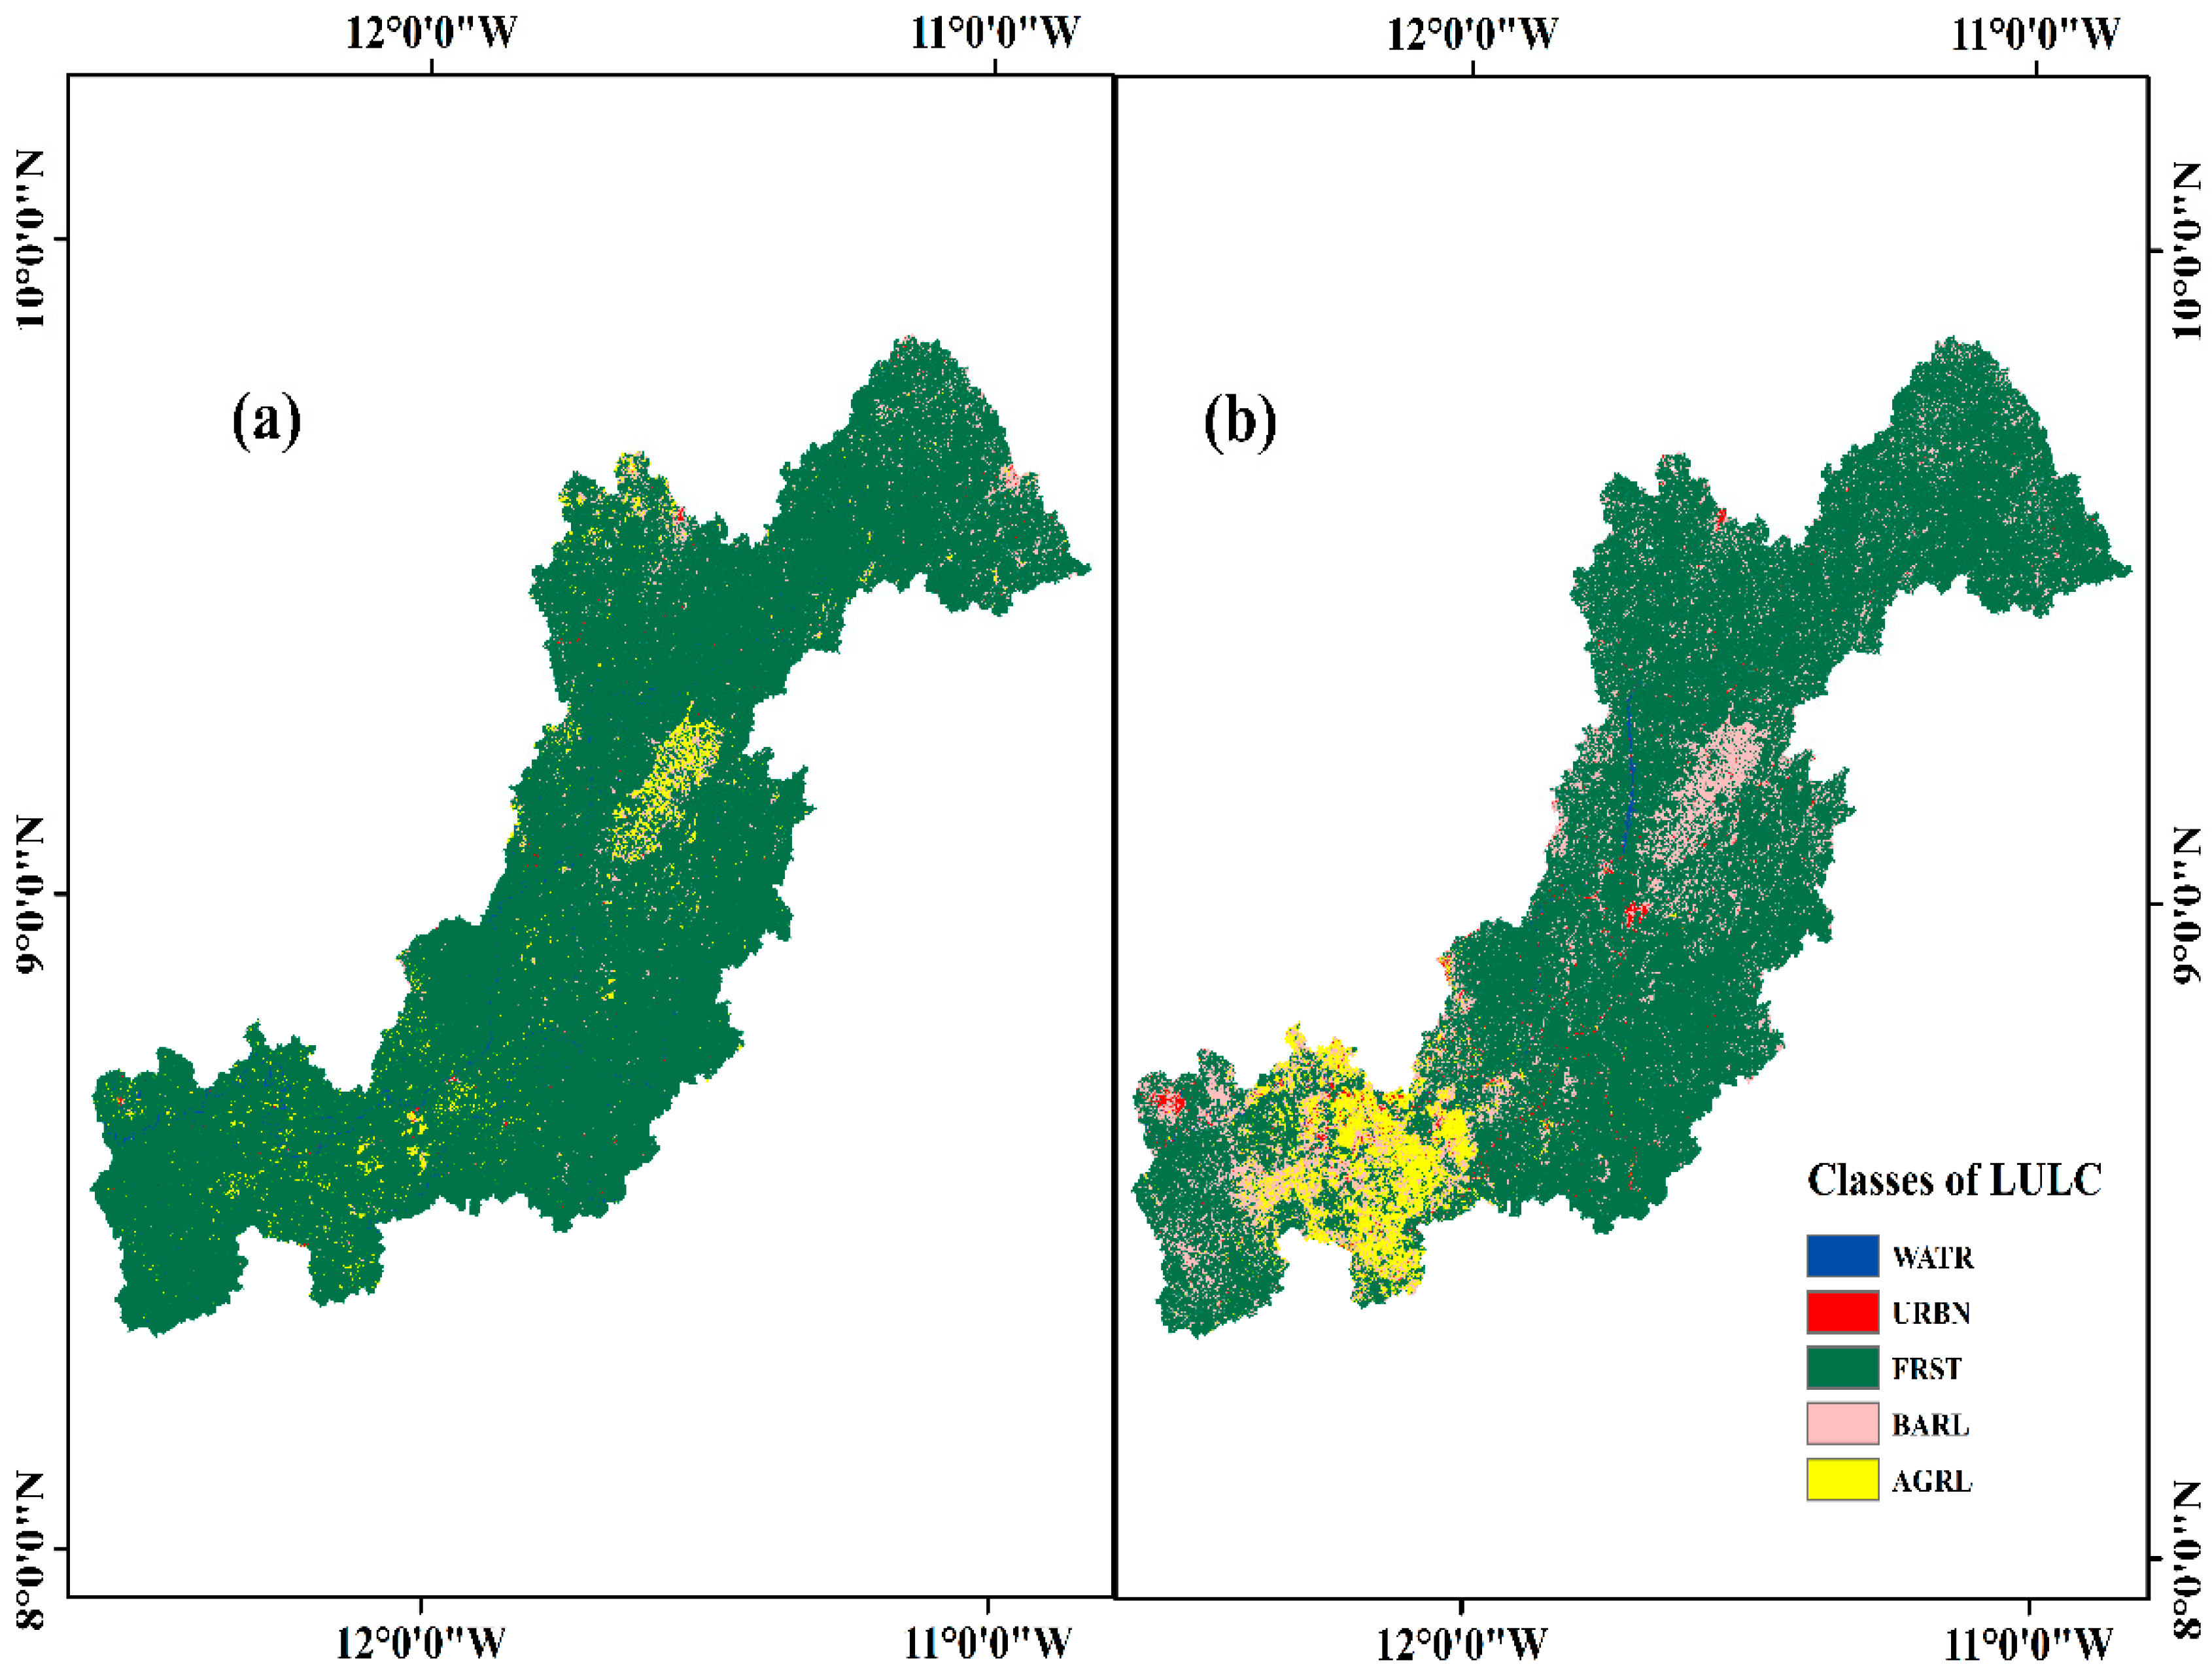
Accuracy assessments of the 1988 and 2013 LULC maps are shown in Table 2. The kappa coefficient ranged from 89 to 93% and the overall accuracy was above 90%, demonstrating a satisfactory performance [78]. According to [61], a classified image with a kappa coefficient > 0.8 is an acceptable image. Since this study’s assessment results indicated a strong agreement between the classified and ground-truth images, this signifies a satisfactory performance [60]. Historical verification points for each class are shown in Tables S3 and S4. The dominant land uses identified were water bodies, agricultural, bare, forest and urban land, as shown in Figure 3.
The accuracy of the 1988 and 2013 LULC maps demonstrated an exceptional SCS runoff curve number (p = 0.000) in both stations’ classification (Tables S3 and S4), which mitigated the proliferation of spatial input errors into the SWAT hydrological structure. The confusion matrices captured the distribution of the 1988 and 2013 LULC classification processes, with high precision. The reliability of the LULC maps classification directly bolstered the robustness of the SWAT parameterization sensitivity results (Table 3).

3.2. Land Use Changes

The LULC classes for the years 1988 and 2013 are shown in Table 4. From 1988 to 2013, the proportion of bare, agricultural and urban land increased from 248.76 to 549.31 km2, 287.13 to 1370.69 km2, and 13.37 to 57.78 km2, respectively, while forest land decreased from 9652.68 to 8229.38 km2. The increase in agricultural and urban land could be a result of the expansion of agricultural activities (Addax irrigation project and Magbess sugarcane farm), infrastructural development (Bumbuna Dam expansion) and mining operations spreading to water bodies and forest land. The agricultural increase can be related to [79,80]. A study by [81] also revealed an increase in urban and agricultural land with a decrease in water bodies, forest and grazing land in the upper Wabe-Shebele river basin.

3.3. Precipitation and Temperature Data Analysis

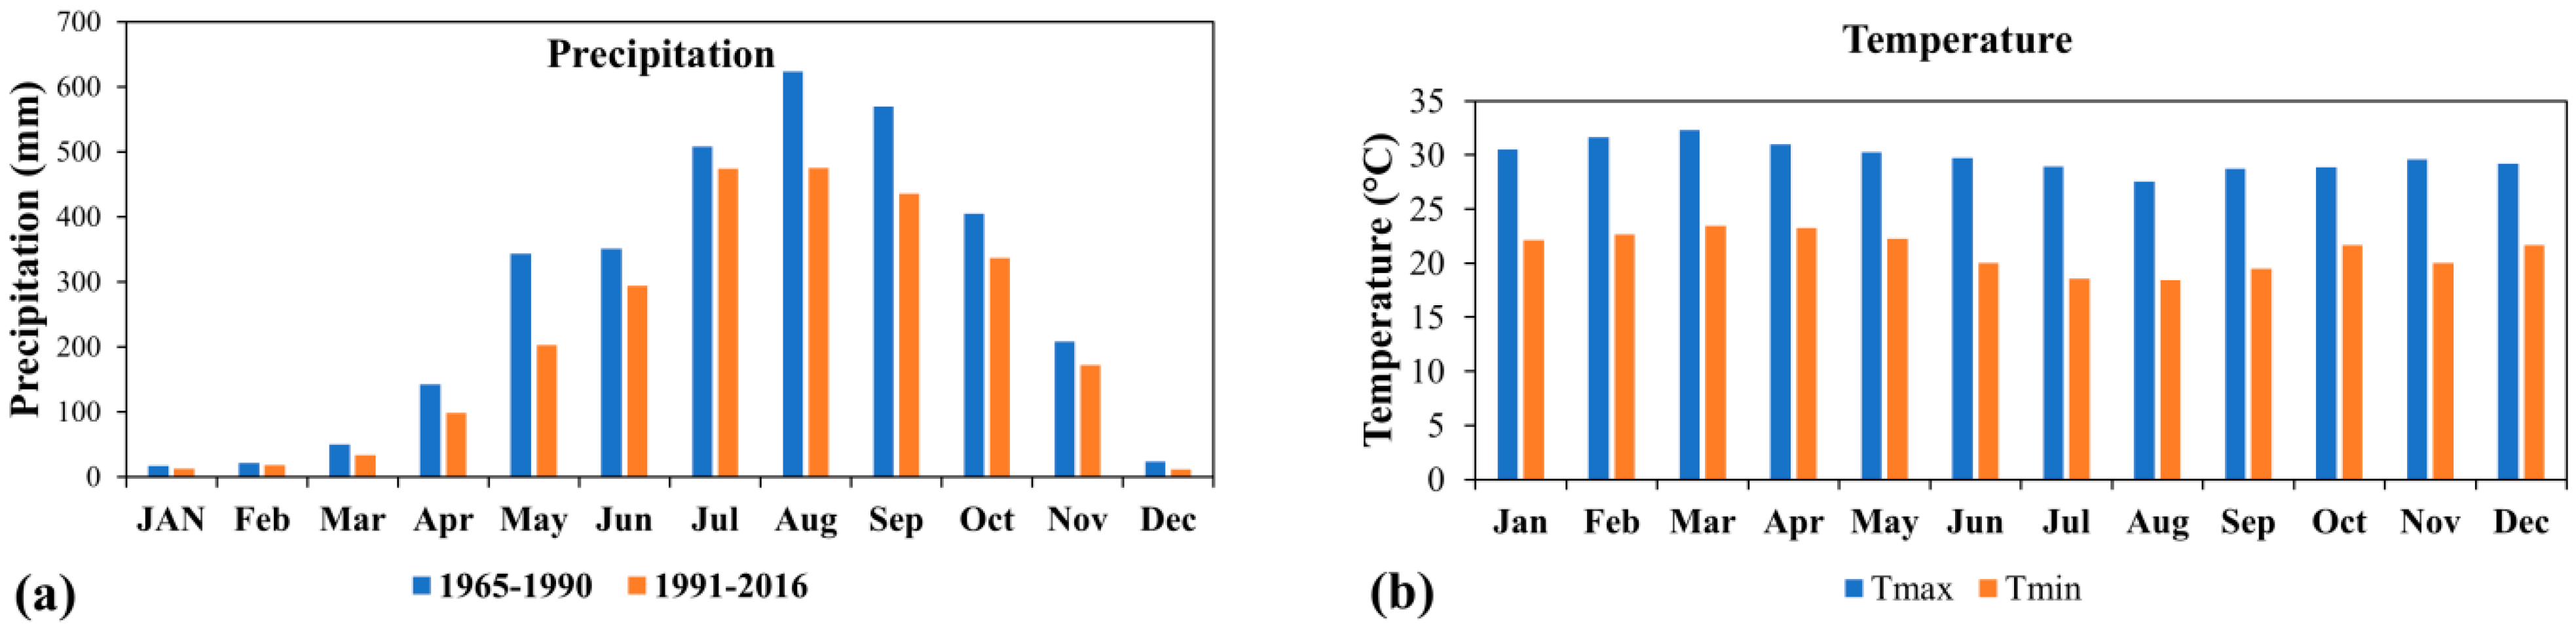
The annual precipitation and temperature data used from 1965 to 2016 have been downscaled by [45]. The average monthly precipitation and temperature data from 1965 to 2016 are shown in Figure 4a,b. The monthly precipitation reached its highest peaks between July and September (the rainy season), with intense rainfall in August (651.81 mm). From 1991 to 2016, the mean monthly precipitation decreased. The mean monthly air temperature spreads evenly during the dry season. The maximum air temperature (23 to 32.30 °C) was seen in March, which is mainly the peak of the dry season.

3.4. The SWAT Model Performance and Sensitivity Analysis

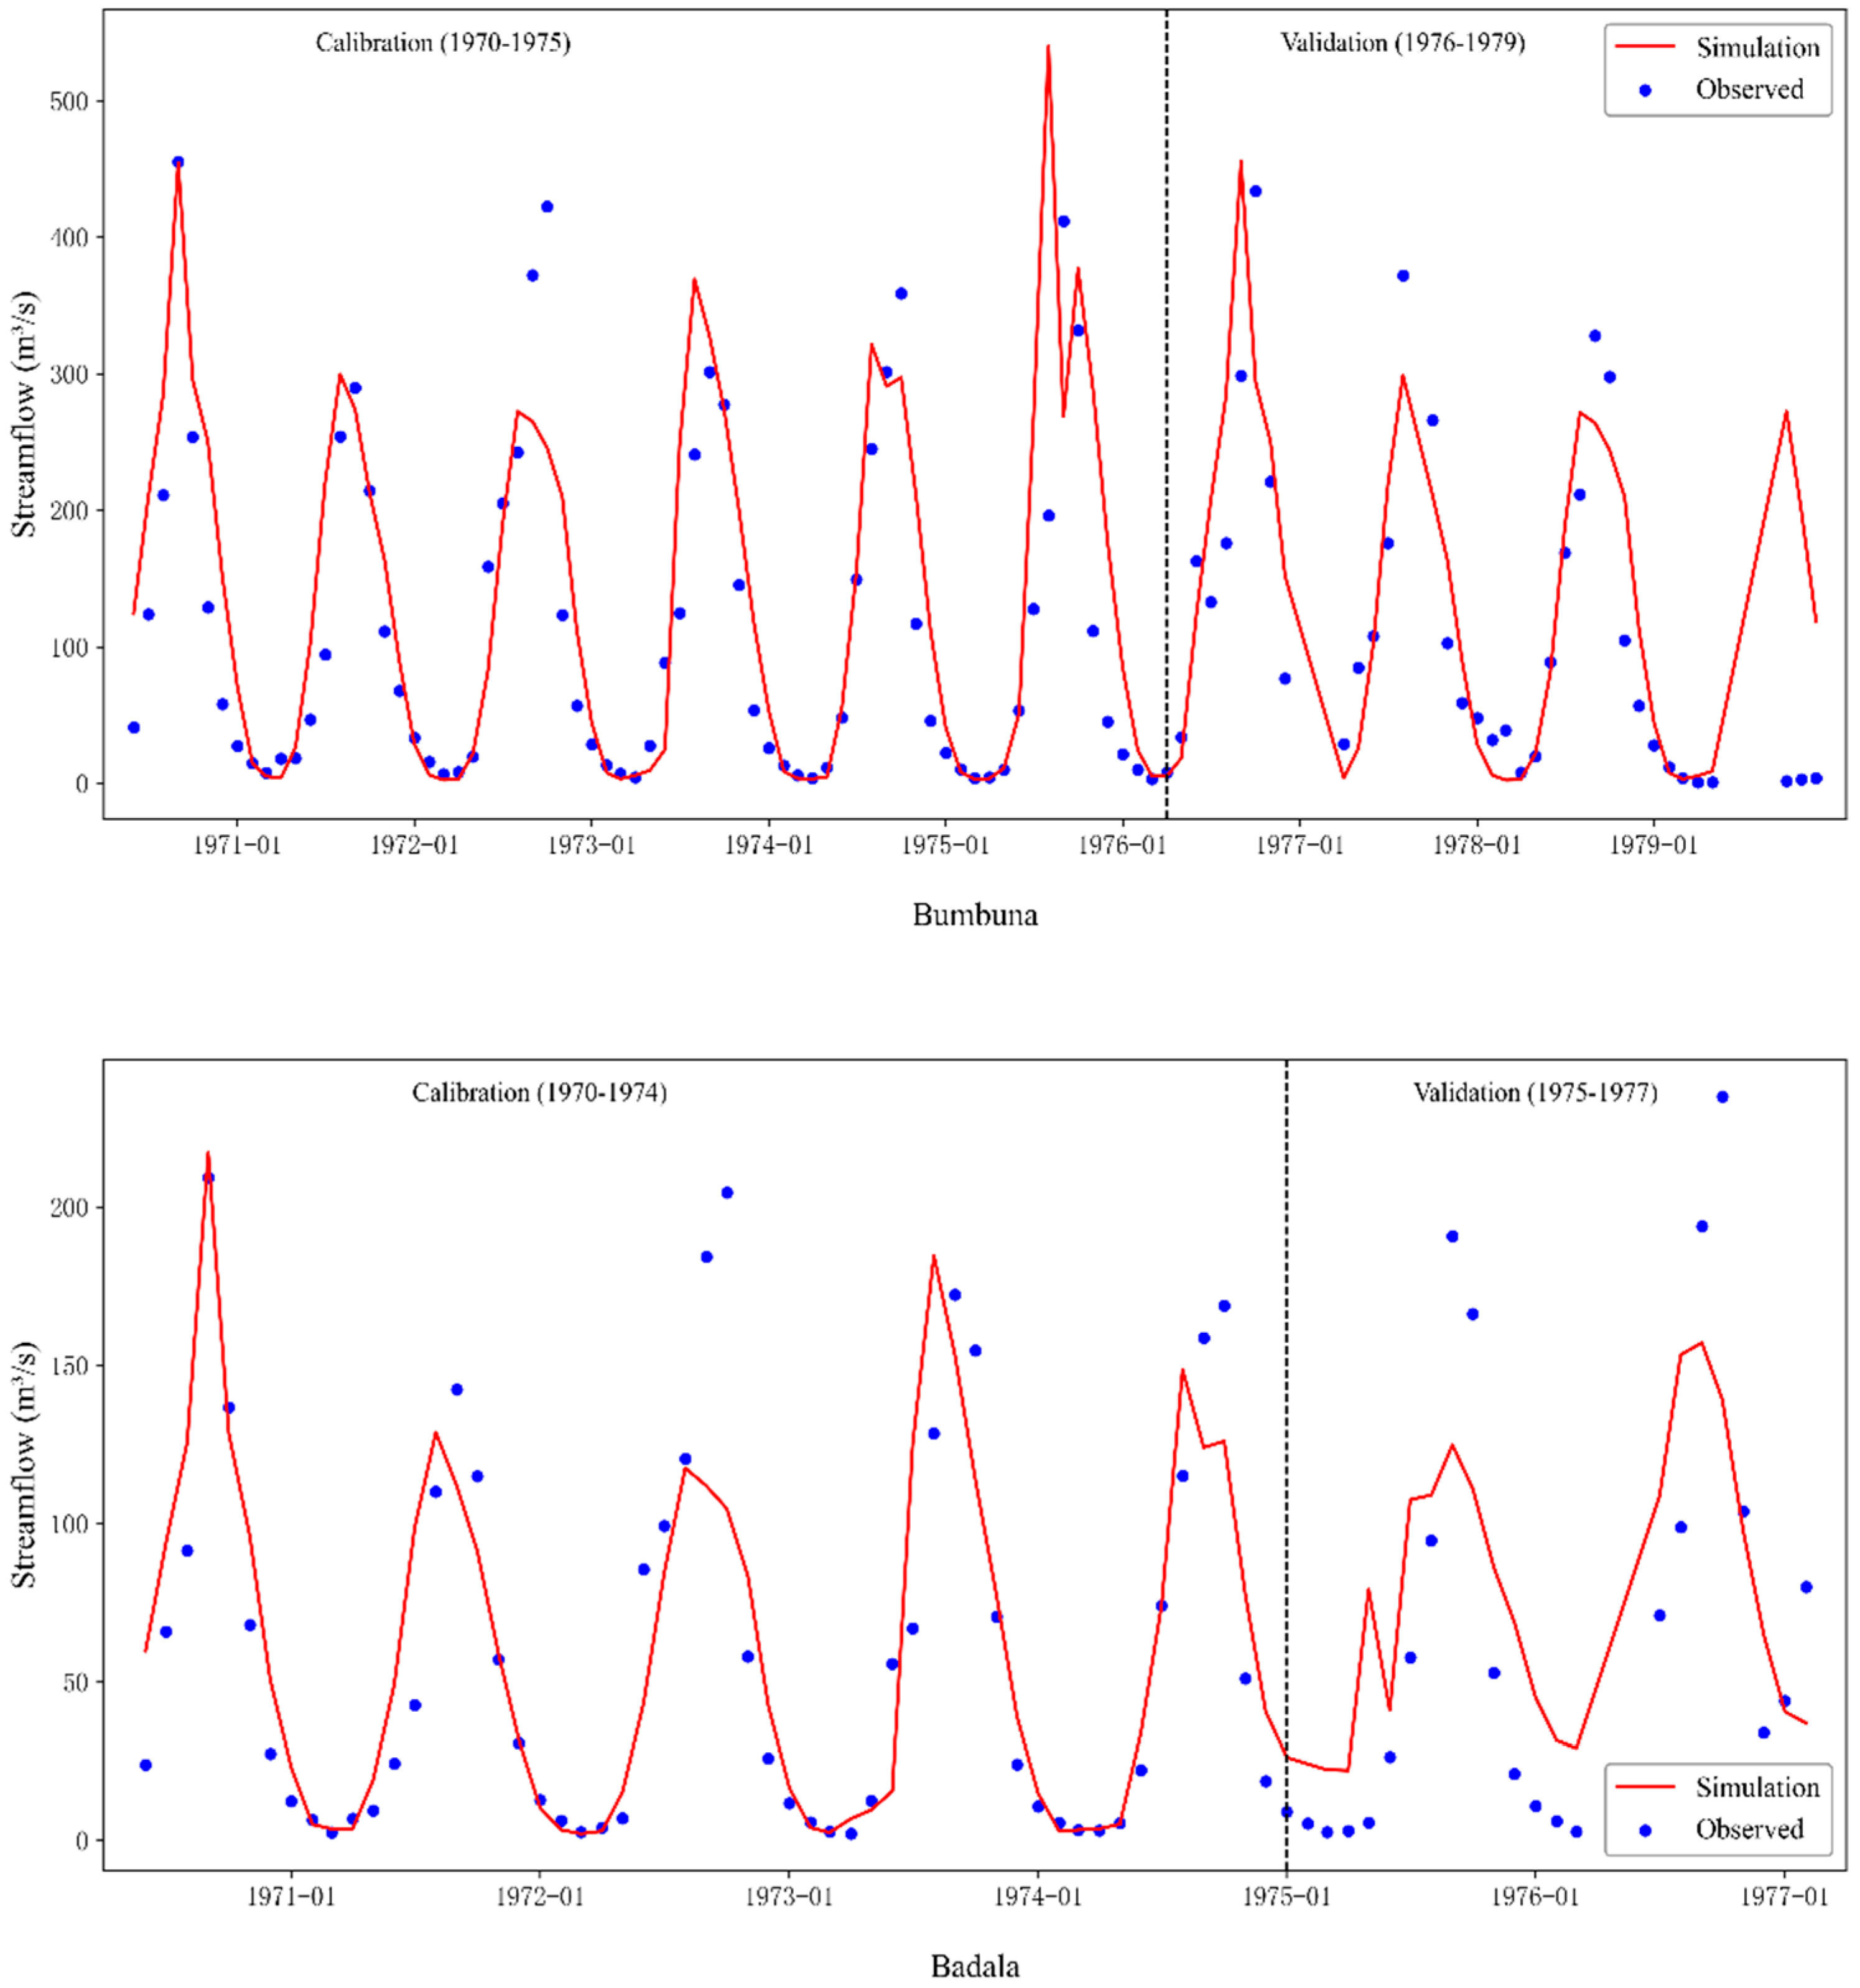
These processes are accomplished in the SWATCUP by comparing monthly observed and simulated streamflow data from 1970 to 1979. The SWATCUP contains the SUFI-II algorithm to evaluate the uncertainty of parameters, the theoretical model and measured data [39], and uses the sensitivity analysis for parameterization [62]. In the calibration and validation process, we considered evapotranspiration, groundwater, runoff, management and morphological parameters. The selection of parameters is critical for sensitivity analysis, which helps improve the reliability of a hydrological model. The SWAT-CUP provides two sensitivity methods: (a) one-at-a-time analysis (computes each parameter’s impact) and (b) global sensitivity analysis (based on t-stat and p-value factors). The parameter selection and range could be based on either the SWATCUP manual [71], previous literature, or the modeler’s experience about the condition of the basin. Normally, 3–5 iterations with 500–1000 runs are enough to yield an acceptable or satisfactory outcome, after the selection of parameters.
However, after a particular iteration, the suggested parameter ranges will be given by the SWAT-CUP, subject to the statistical indicator values of R-factor and P-factor. It is the modeler’s discretion to proceed with the iteration process or not. The R-factor defines the ratio of the measured variable standard deviation to the 95% Prediction Uncertainty (95 PPU), which means the band’s width is preferably <1.5 and the P-factor denotes a fraction of the data within the 95 PPU band or a measure of the uncertainty strength (acceptable value > 0.5). In our research, we considered the Nash–Sutcliffe Efficiency (NSE), Percent Bias (Pbias), Coefficient of Determination (R2) and Kling–Gupta Efficiency (KGE) statistical indicators. This study used the global sensitivity analysis with monthly observed streamflow data from 1970 to 1979 for the Bumbuna station and Badala stations (1970 to 1977). Around 700 simulations were made. The 14 parameters used for calibration and validation were based on a recent study in the RSRB [45] and the SWATCUP parameters selection manual [71] to attain a satisfactory performance (Table S2). The sensitivity analysis identifies the most influential parameters on the basin’s streamflow. From the fourteen parameters selected, five parameters were the most sensitive: Baseflow alpha factor (ALPHA_BF), SCS runoff curve number (CN2), saturated hydraulic conductivity (SOL_K), soil evaporation compensation factor (ESCO) and Manning’s “n” value for overland flow (OV_N), as shown in (Table 5). A parameter is characterised as being sensitive when it has a higher t-stat and lower p-value. The calibrated parameter values were employed in the SWAT database to compute the various scenario impacts on the hydrological cycle. The Nash–Sutcliffe Efficiency (NSE) measures how well the model predicts the observed data compared with the simulated data. Coefficient of Determination (R2) determines the strength of the linear relationship between the actual discharge and simulated flow. Percent Bias (PBias) estimates whether the model tends to under-simulate or over-simulate the RSRB total volume of water. Kling–Gupta Efficiency (KGE) further assesses the model’s ability to simulate a hydrological cycle by evaluating the precise NSE that equates the variability, bias, and correlation. The calibrated and validated R2 and NSE values are > 0.50, KGE > 70% and PBIAS ± 25 (Table 3), representing a good performance model [82], further illustrated in Figure 5. Overall, the good performance obtained from the calibration and validation processes revealed that the model has the potential to estimate the water cycle behaviour due to the changes in climate and land use [83,84].

3.5. The Basin Hydrological Changes

3.5.1. Baseline Spatial and Temporal Changes

The computations of the mean runoff for the baseline from the calibrated SWAT output in the RSRB at the subbasin levels are shown in Figure S1. The wet runoff ranged from 100 to 2800 mm and the dry season ranged from 36 to 1490 mm. From Figure S2b, the subbasins 1, 2, 3 and 4 were taken as the northern region (upstream); subbasins 5, 6, 9 and 10, as the western region; subbasins 7, 8, 15 and 17 were taken as the eastern; and subbasins 12, 14, 16, 19 and 13 (downstream) were taken as the southern region. The Middle-stream subbasins include 6, 5, 6, 9, 10, 15 and 17. The runoff in the south is higher than that in the north. The south and central parts practice more irrigation and mining activities. The mean baseline runoff results were compared with the other scenarios in Table 1.

3.5.2. The Relative Contribution to the Hydrological Region

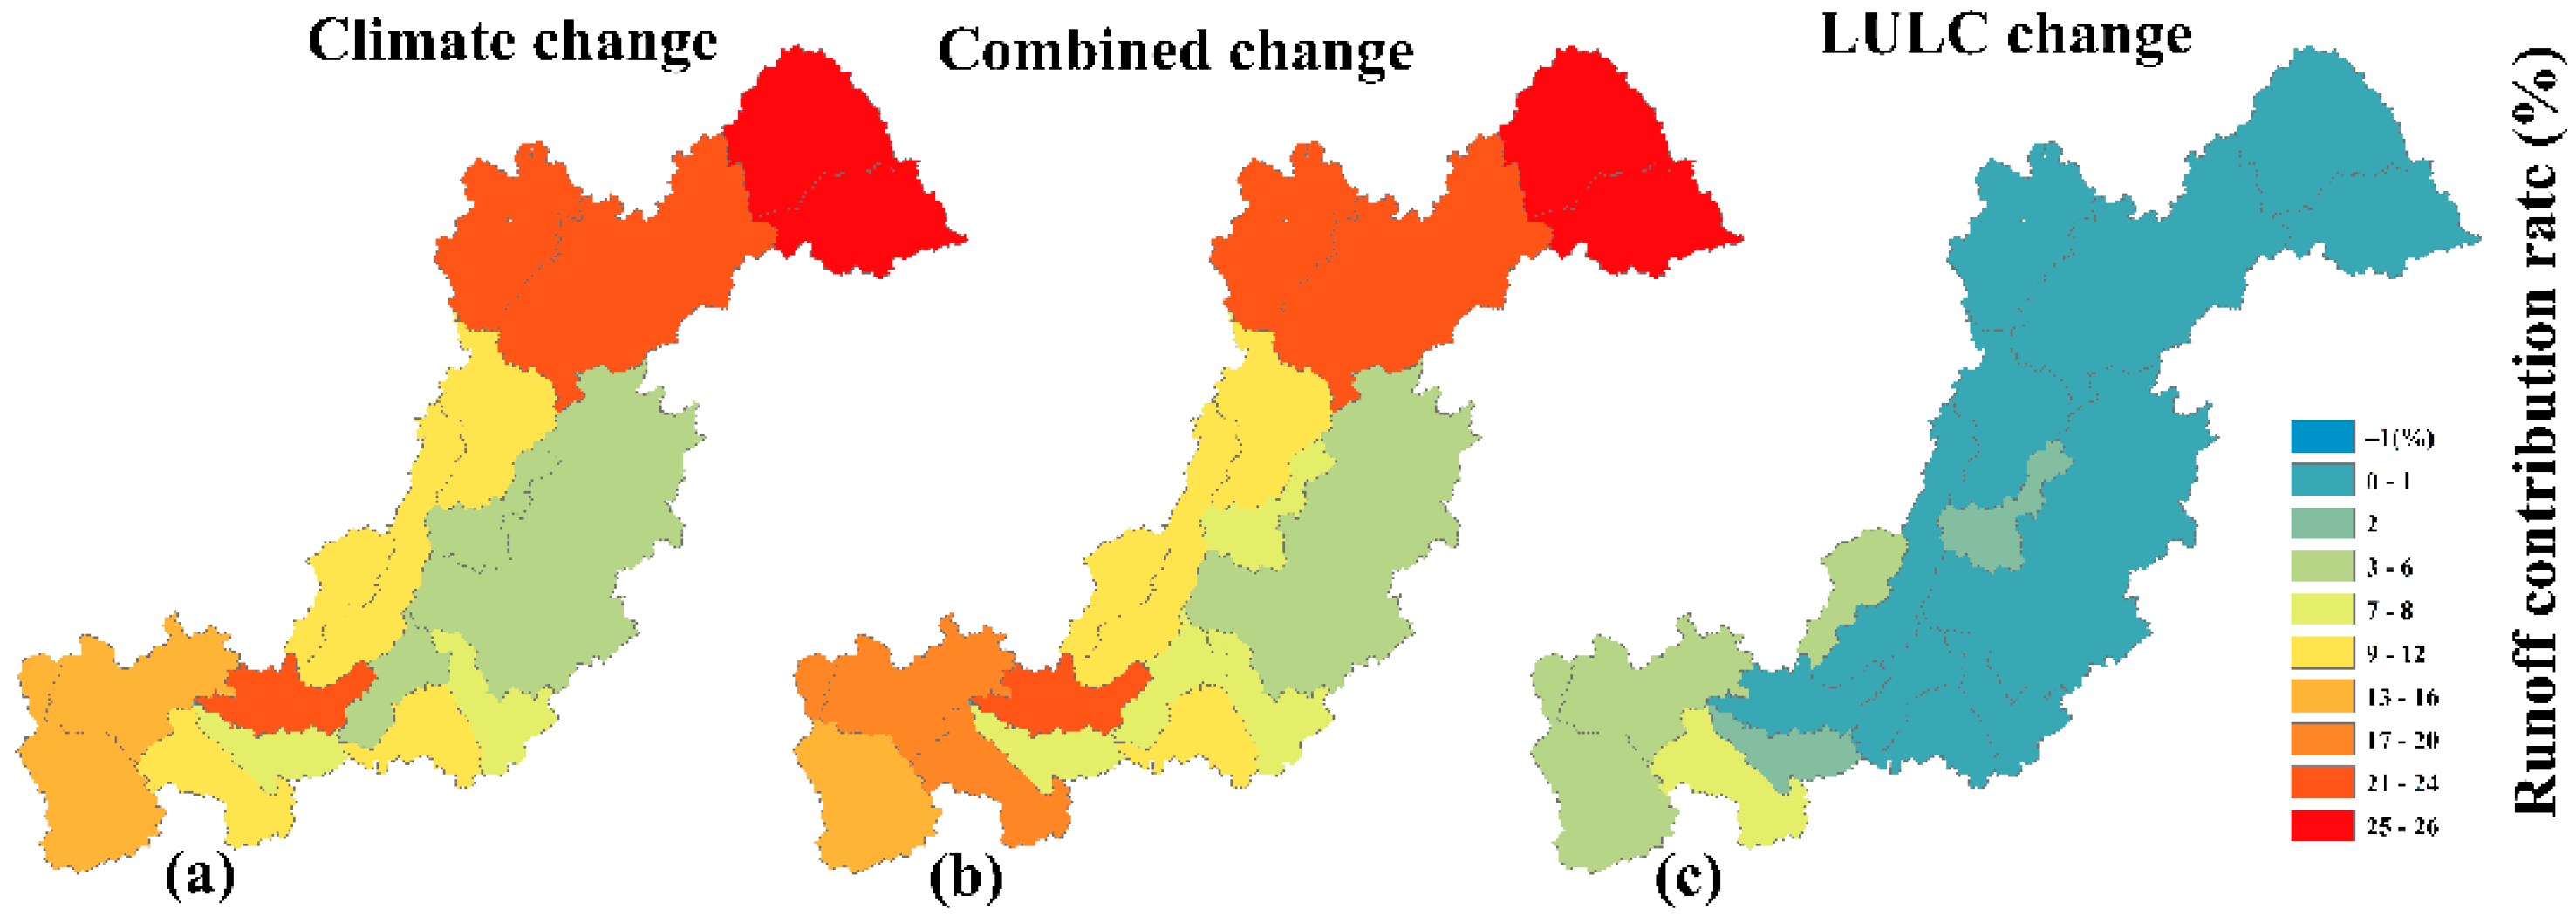
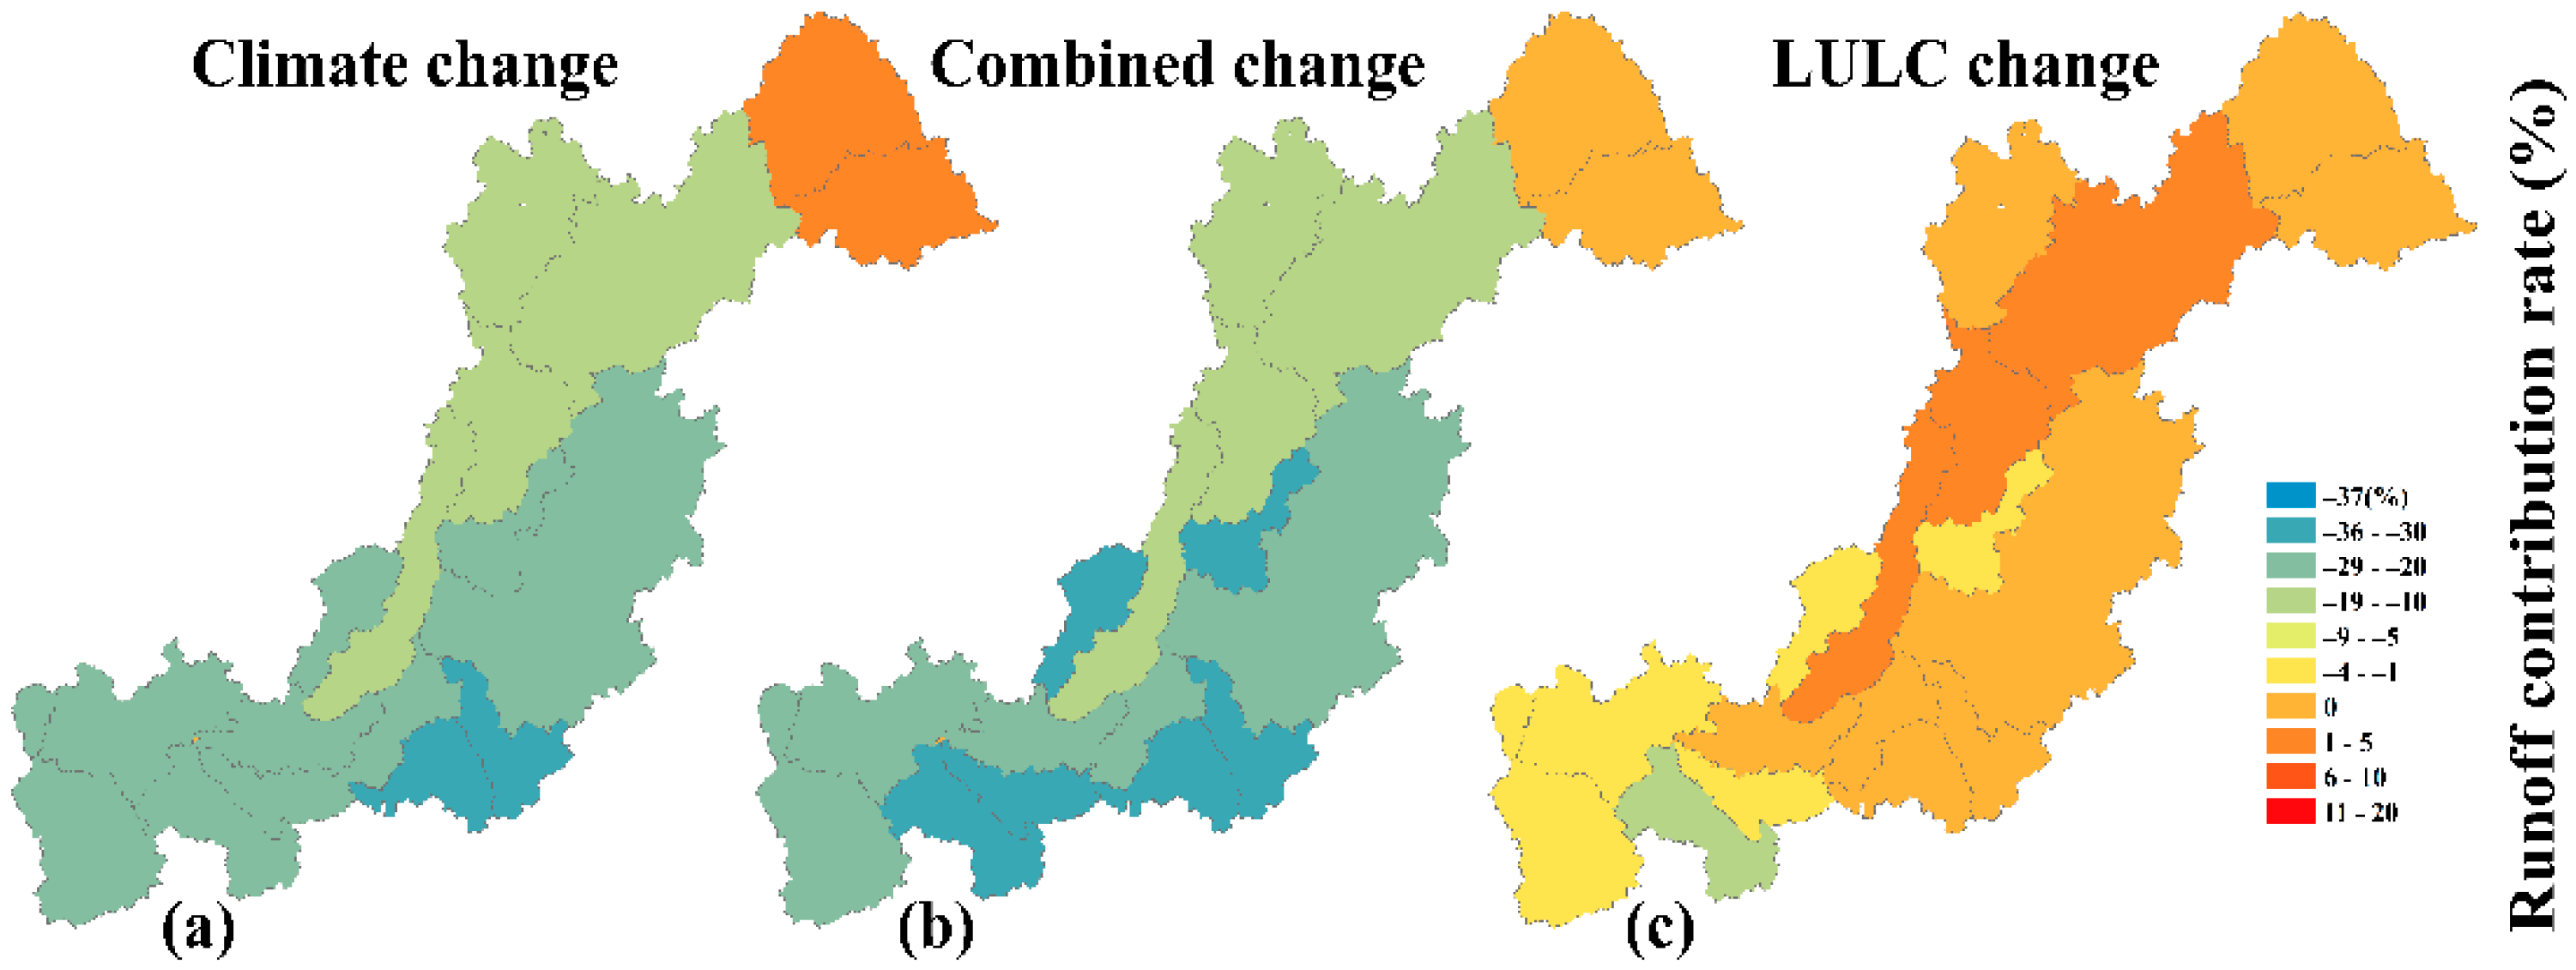
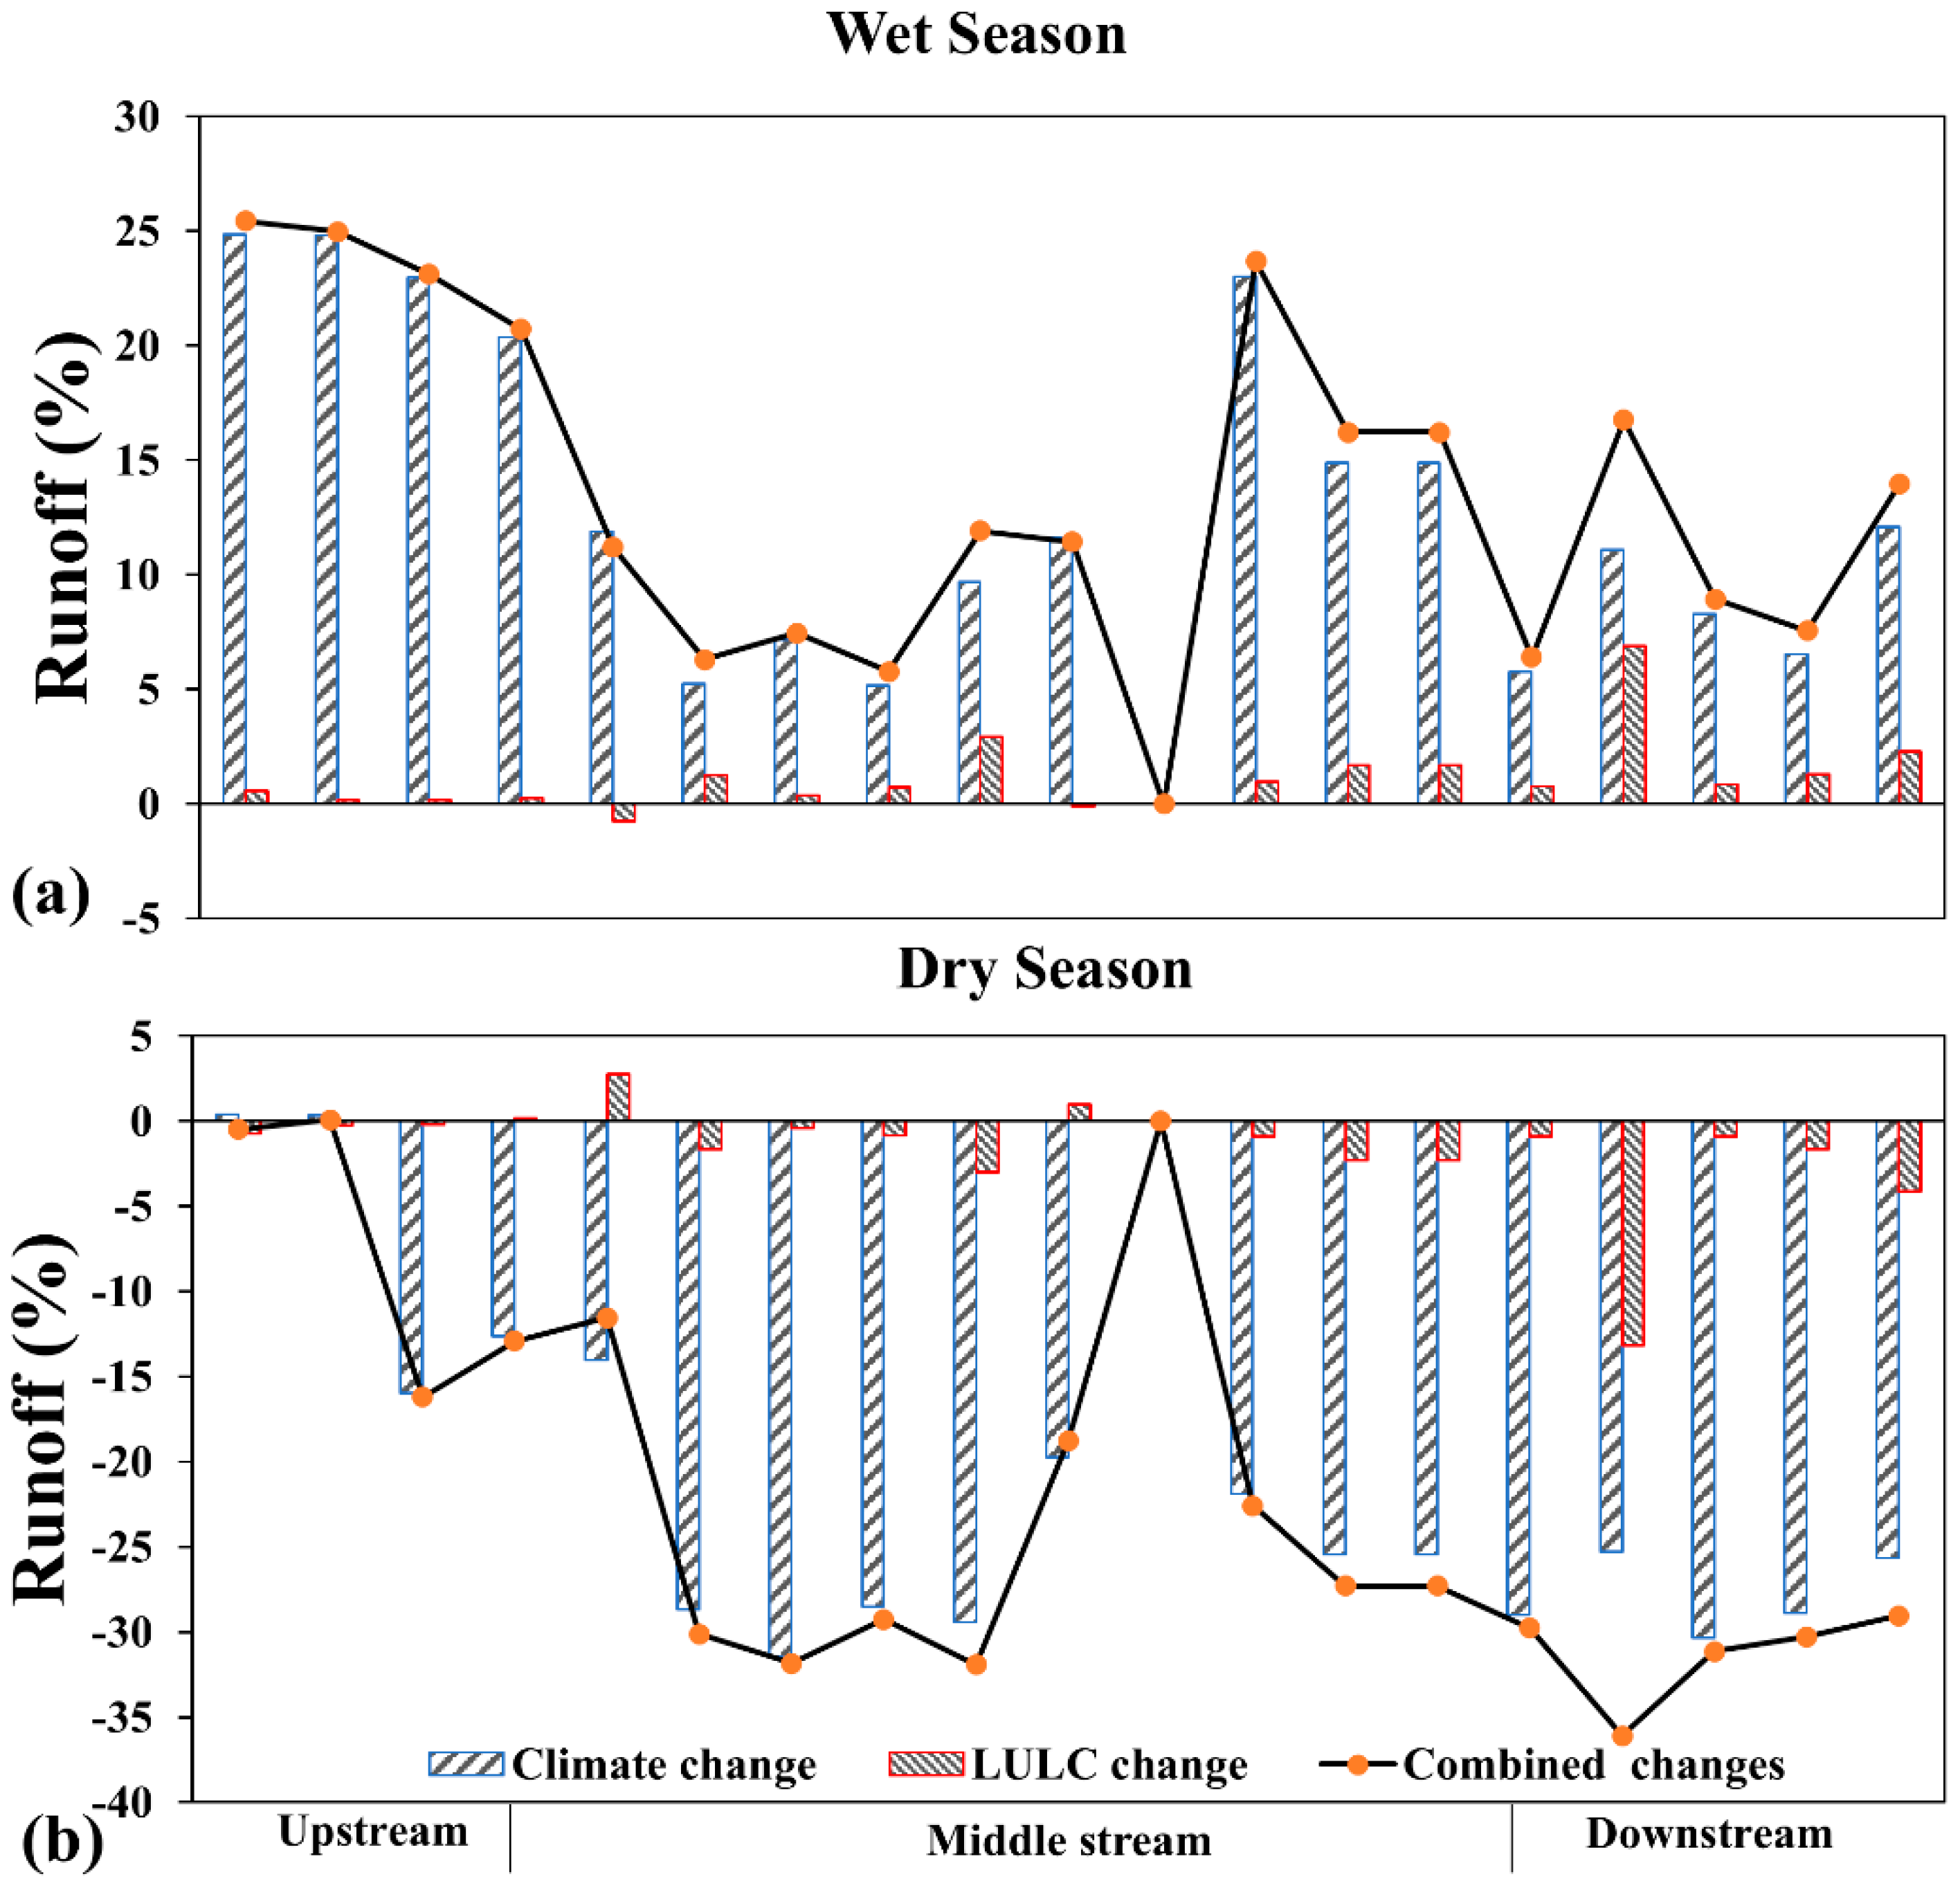
The contribution rate was calculated by subtracting the baseline runoff scenario from the runoff scenarios under land use and climate change, by averaging [27,45]. The seasonal contribution rate on runoff under both LULC change, climate change and the integrated land use and climate increased in the wet season and decreased in the dry season, as shown in Figure 6 and Figure 7. In the wet season under the climate change scenario, the upper stream runoff increased by 24.87%. A study in the Rokel-Seli River also revealed an increase in runoff upstream of the basin [37]. The seasonal runoff decreased to −31.45%, concentrated in the southeast and southwest of the basin, during the dry season (Figure 7). The integrated land use and climate change impacts also revealed similar outcomes to climate change, which indicated climate change dominance over runoff changes in the basin. For the land use change scenario, it showed runoff changes that ranged from −13.15 to 6.88% within both seasons. The land use changes from 1988 to 2013 explained the deviations seen in the RSRB since the 1970s. The seasonal runoff increased and decreased can be linked with the rapid urbanization, mining and agricultural activities in the basin, as shown in the 2013 LULC map. The expansion of urban and cultivated land from 1988 to 2013 increased runoff in the wet season, indicating that a large portion of precipitation on the earth’s surface might have been flowing directly into the river instead of infiltrating (saturation-excess runoff). The infrastructural development at the expense of forest land (which acts as a sponge) may have led to an increase in streamflow during the wet season, with a rapid decline in the dry season. A study in the basin revealed similar streamflow variations in the RSRB [37]. A related study revealed that land use alterations have triggered an increase in streamflow in some Sahel Rivers [85].

3.5.3. Coefficient of Variation of Hydrological Parameters

The runoff coefficient of variation (Cv) was determined to further compute the land use and climate changes in the RSRB [27]. The runoff Cv values in the dry season (Nov to Apr.) were greater than those in the wet season, as shown in Table 6. Under climate change, the upstream Cv values ranged from 0.9 to 1.44, higher than those of the middle-stream and downstream subbasins. This indicated that during the dry season, the runoff upstream has been significantly affected, which in turn impacts downstream activities. The combined change Cv pattern was similar to climate change, which also justified climate change dominance to runoff changes in the RSRB. The land use change also had a major impact on runoff variations.

3.6. Variability and Hydro-Climatic Trend Analysis in the Rokel-Seli River Basin

The water yield (WYLD) is basically the net amount of water leaving a subbasin and entering the stream, which is the sum of surface runoff, baseflow and lateral flow, with the transmission losses then deducted. It accounts for what the land use produces (land use-based). While the FLOW_OUT (reach outflow) measured the total amount of water existing in a specific reach or river segment. It’s mainly the sum of upstream inflow, precipitation and subbasin runoff, minus the seepage and evaporation. Therefore, the water yield (WYLD) variable is included in subsequent analysis to reflect further hydrological implications and mutations.

3.6.1. Integrity of Hydrological Data, Consistency and Runoff Efficiency Dynamics in the Basin

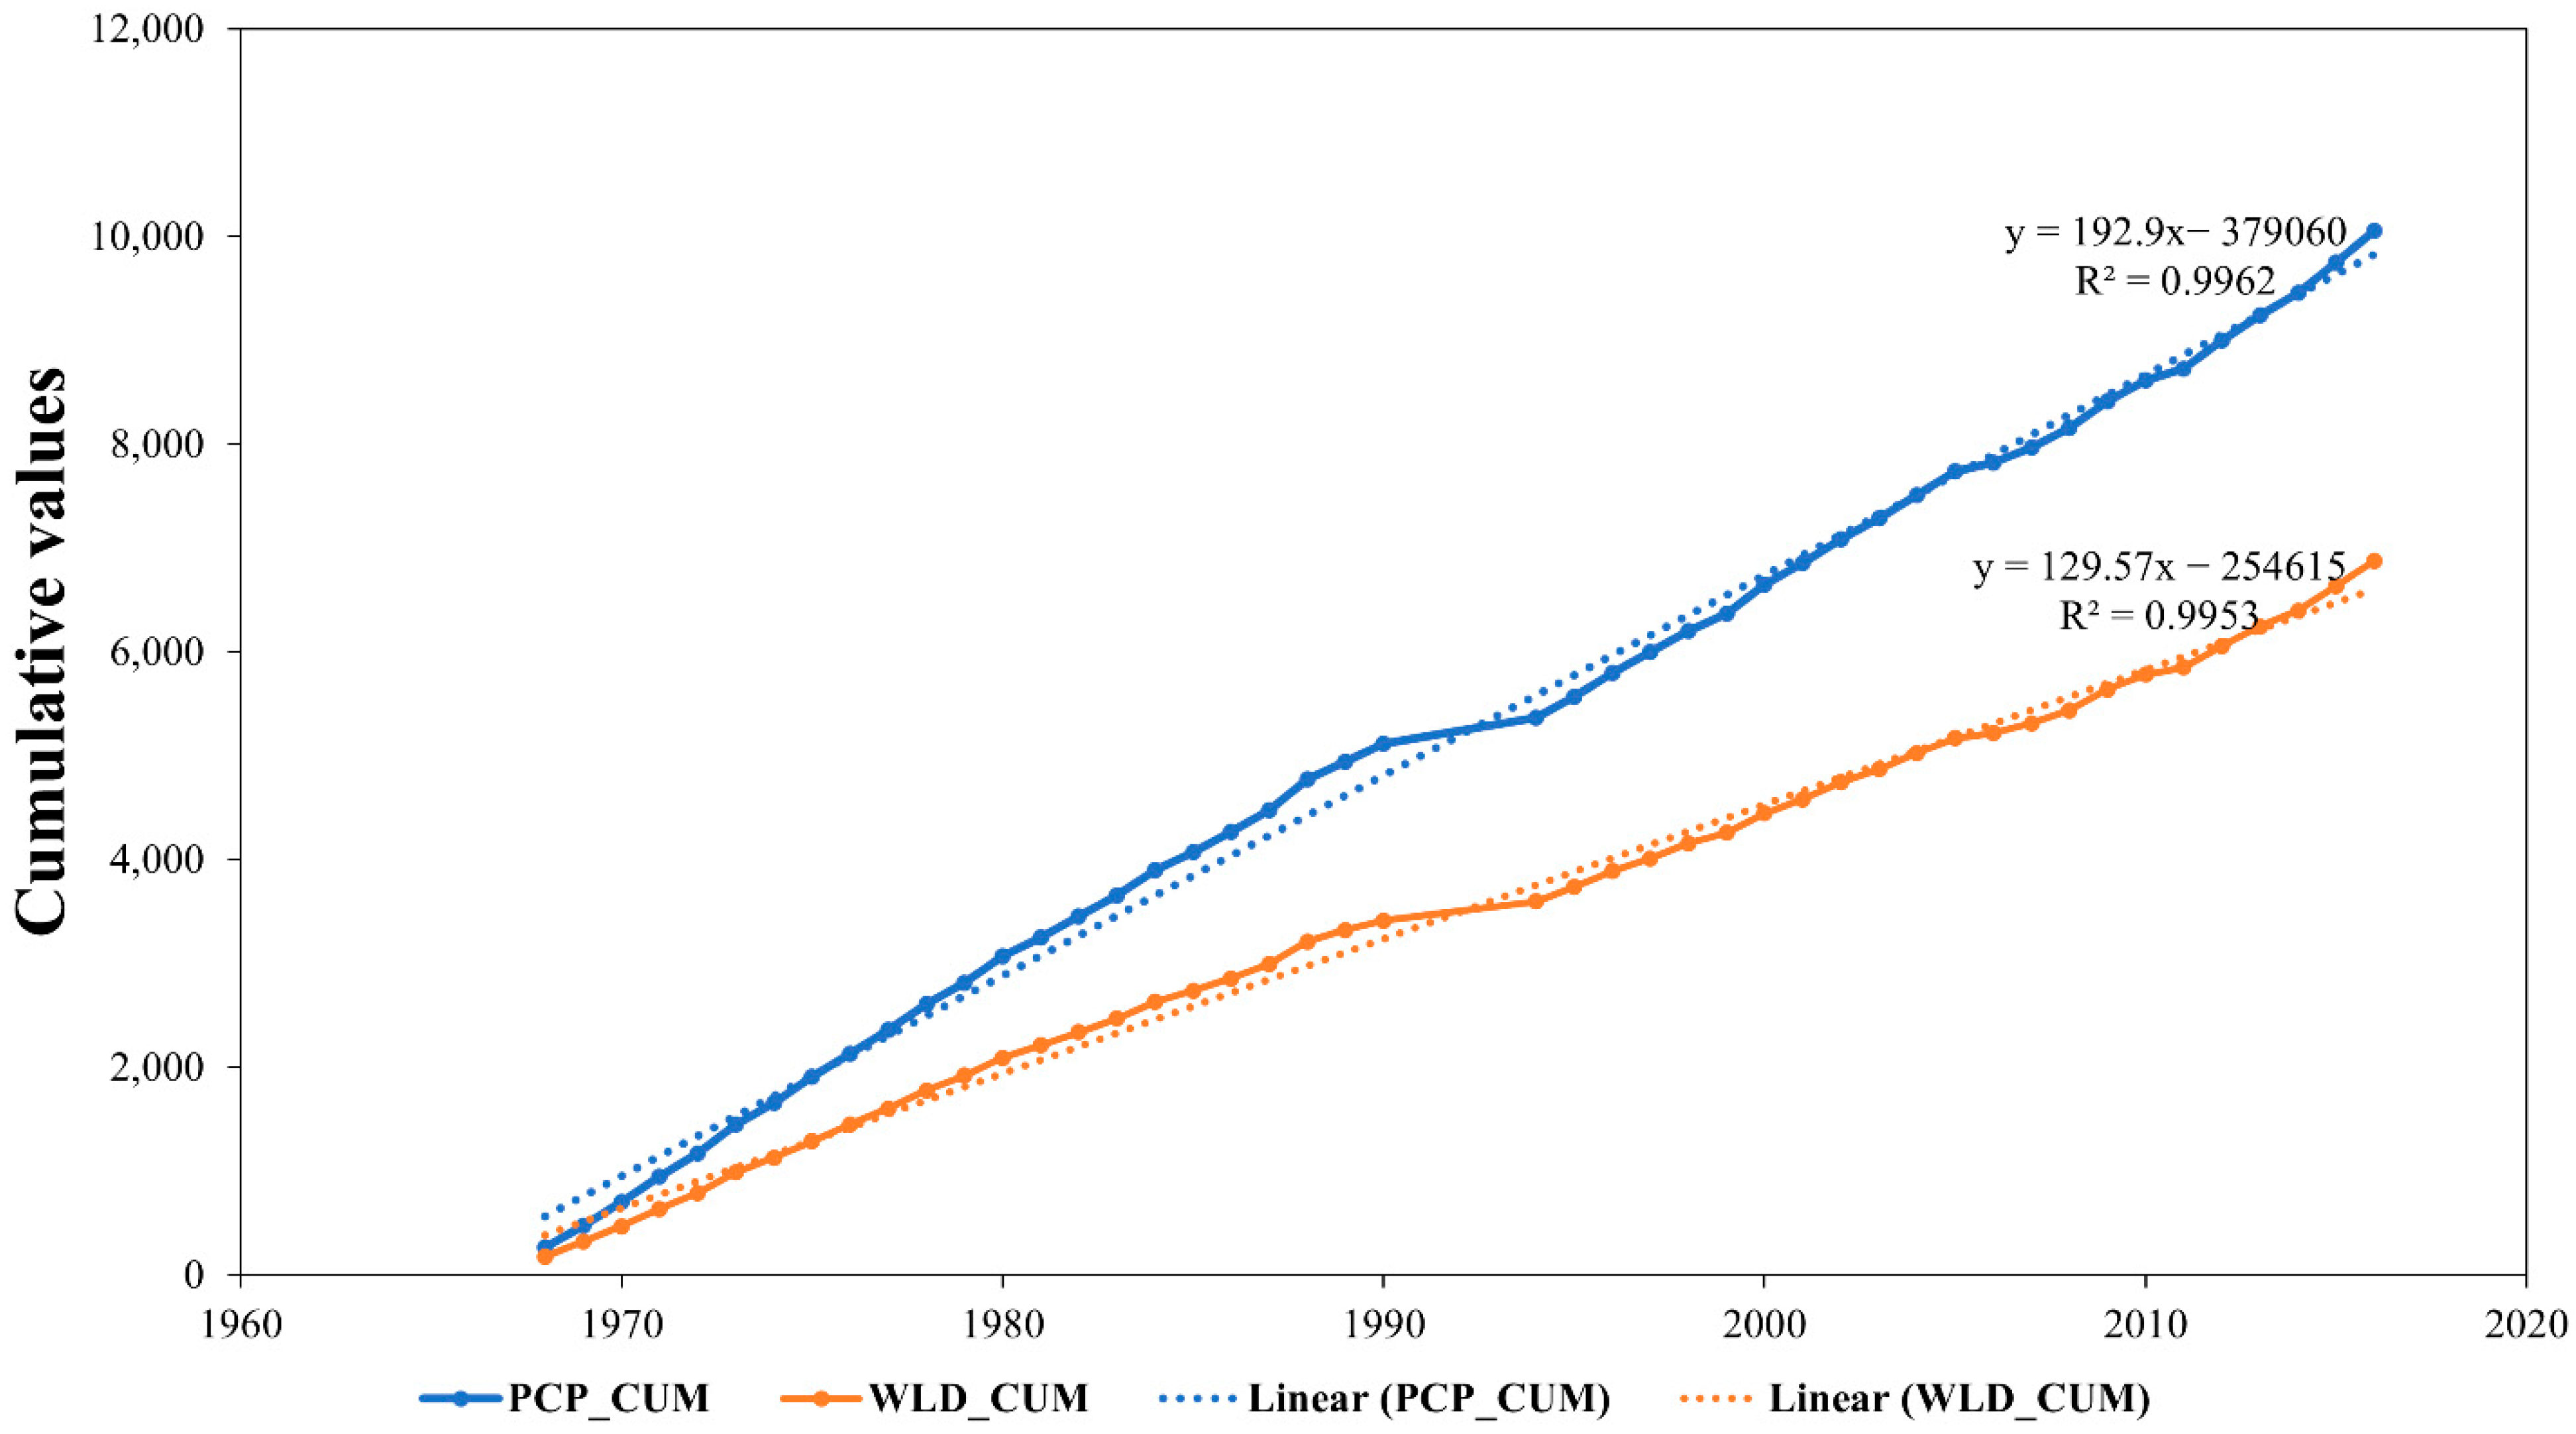
Double mass consistency (DMC) is an indispensable mathematical principle stating that the ratio of two related independent variables remains constant, unless influenced by an external factor. In this study, the independent variables are precipitation and water yield (Figure 8). The DMC is a plot of the cumulative value of runoff against the cumulative value of precipitation. Between 1965 and 2016, the curve revealed a distinct inflection point around 1991. The increase in the runoff coefficient could be related to the DMC slope (K) tilting upwards after 1990. In the dry season, there is likely less water to be used to recharge the aquifers because water is leaving the basin as runoff. This non-stationarity was revealed in our study period, showing changes at a specific point in time. For instance, before 1990, the lines were relatively straight, meaning that the relationship between runoff and precipitation was stable. A non-stationarity was detected after 1991 and 2000, which revealed a major regime shift as shown in Figure 8. And the choice to split the study into two epochs, historical (1965–1990) and current (1991–2016), is obvious. Additionally, the coefficient of determination (R2) > 0.95 showed how perfectly the data fit the straight lines, and yielded R2 values of 0.996 and 0.995 for both precipitation and WYLD, respectively, indicating that during that specific study period, the relationship between precipitation and water yield is highly consistent. Our study showed a runoff efficiency change of 2.8%, which demonstrated a classic deforestation and urbanization impact; the basin is becoming more efficient at producing runoff.
Furthermore, a linear regression analysis was performed to quantify the precipitation–runoff relationship of the Double Mass Curve (DMC) for the historical and current periods, shown in Table 7. A straight line denoted a constant relationship, while a change in slope indicated that water yield is affected by factors other than precipitation. Additionally, in the cumulative relationship between precipitation and water yield, the model yielded an adjusted R2 value of 0.9997 (an acceptable linear correlation). The model showed a lower p-value (3.70 × 10−40), confirming a highly significant regression model (p-value < 0.001) for both periods. The historical period yielded a runoff coefficient (K) of 0.67, with a 95% confidence interval of 0.665 to 0.674. A highly statistically significant p-value of 1.24 × 10⁻³² was obtained, which is below the 0.05 threshold, with a runoff coefficient (K) of 0.6886 and a 95% confidence interval of 0.678 to 0.699.
A surge in runoff efficiency indicated that the river is becoming more efficient at shedding water in a large basin like the Rokel-Seli River. This showed that precipitated water that reaches the earth’s surface immediately rushes into river channels rather than infiltrating. Based on the results obtained, this can be associated with the land use changes. For instance, soil degradation due to human activities (mining, urbanization, agriculture, and deforestation) could lead to a decline in canopy interception because of the decrease in forest land. This could lead to the loss of soil surface roughness, which causes less agricultural production due to the decline in infiltration and triggers an increase in runoff. The Rokel-Seli River Basin showed a significant loss of its natural buffering capacity as the runoff coefficient transformed from 0.66 to 0.69 from the historical to the current period, respectively, as shown in Table 7. During the historical period, forest land dominated the basin, which enhanced subsurface flow and infiltration, while the current degraded state of the basin offers a surge in surface runoff. The findings suggest that LULC transformation (degradation) has subjected the basin to a more responsive system, wherein rainfall is most often converted to discharge. This compromised the dry season baseflow sustainability and decreased the ecological water residence time. The increase in flood risks during the wet season is explained by the paradoxical observation of a higher runoff coefficient, despite the decline in the yearly precipitation. The flood event in the RSRB basin is a reflection of its inability to preserve surplus water in the wet season to sustain the dry season [41].
The Linear regression analysis for each period was computed using slope function in Microsoft Excel. The historical period (1965 to 1990) linear regression slope is K1, and the current period (1991 to 2013) slope is K2. Using the slope conditions: (a) if K2 > K1, the basin is becoming more efficient in producing runoff, and (b) if k2 < K1, then it is less efficient (meaning water is lost to ET). The percentage change in efficiency is determined in Equation (5):
E f f i c i e n c y   c h a n g e   % = k 2 k 1 k 1 × 100

3.6.2. The Dynamics of Runoff Efficiency in the Rokel-Seli River Basin

From Table 8, the surface runoff coefficient (SR) increased from 0.357 to 0.468 between the historical and the recent epoch in the wet season, which can be related to the initial runoff coefficient, increasing from 0.66 (1965–1990) to 0.69 (1991–2016), respectively, which justified the changes, indicating that the overall rise in the runoff coefficient is almost entirely triggered by the increase in surface water movement, which also justified that the basin is losing its retention ability, and revealed the empirical evidence of the masking effect. For instance, during the climate change effect, keeping the 1988 LULC constant, the surface runoff moved from 0.36 to 0.42. Overall, while the land use variation is pushing runoff up, the climate impact is pulling water yield down. In the dry season, this mechanism is identified by the staggered effects of Cv and Cr to uphold its water level in the recent epoch compared with the historical period. The reason is that the surface runoff coefficient (SR) occupied a greater portion of the water, and limited water resources for Cv and Cr. In the dry season, the change (sluggishness) of the runoff coefficient in the current period is the cause for drying up of the river. The Cv, SR and Cr were calculated using Equations (6), (7) and (8), respectively.
C o e f f i c i e n t   o f   v a r i a t i o n   ( C v ) = S t a n d a r d   d e v i a t i o n   ( σ ) M e a n   ( μ )
S u r f a c e   R u n o f f   C o e f f i c i e n t   ( S R ) = S u r f a c e   r u n o f f   ( S U R Q ) W a t e r   y i e l d   ( W Y L D )
R u n o f f   c o e f f i c i e n t   ( C r ) = W a t e r   y i e l d   ( W Y L D ) P r e c i p i t a t i o n   ( P R E C I P )

3.6.3. Driver Attribution Analysis

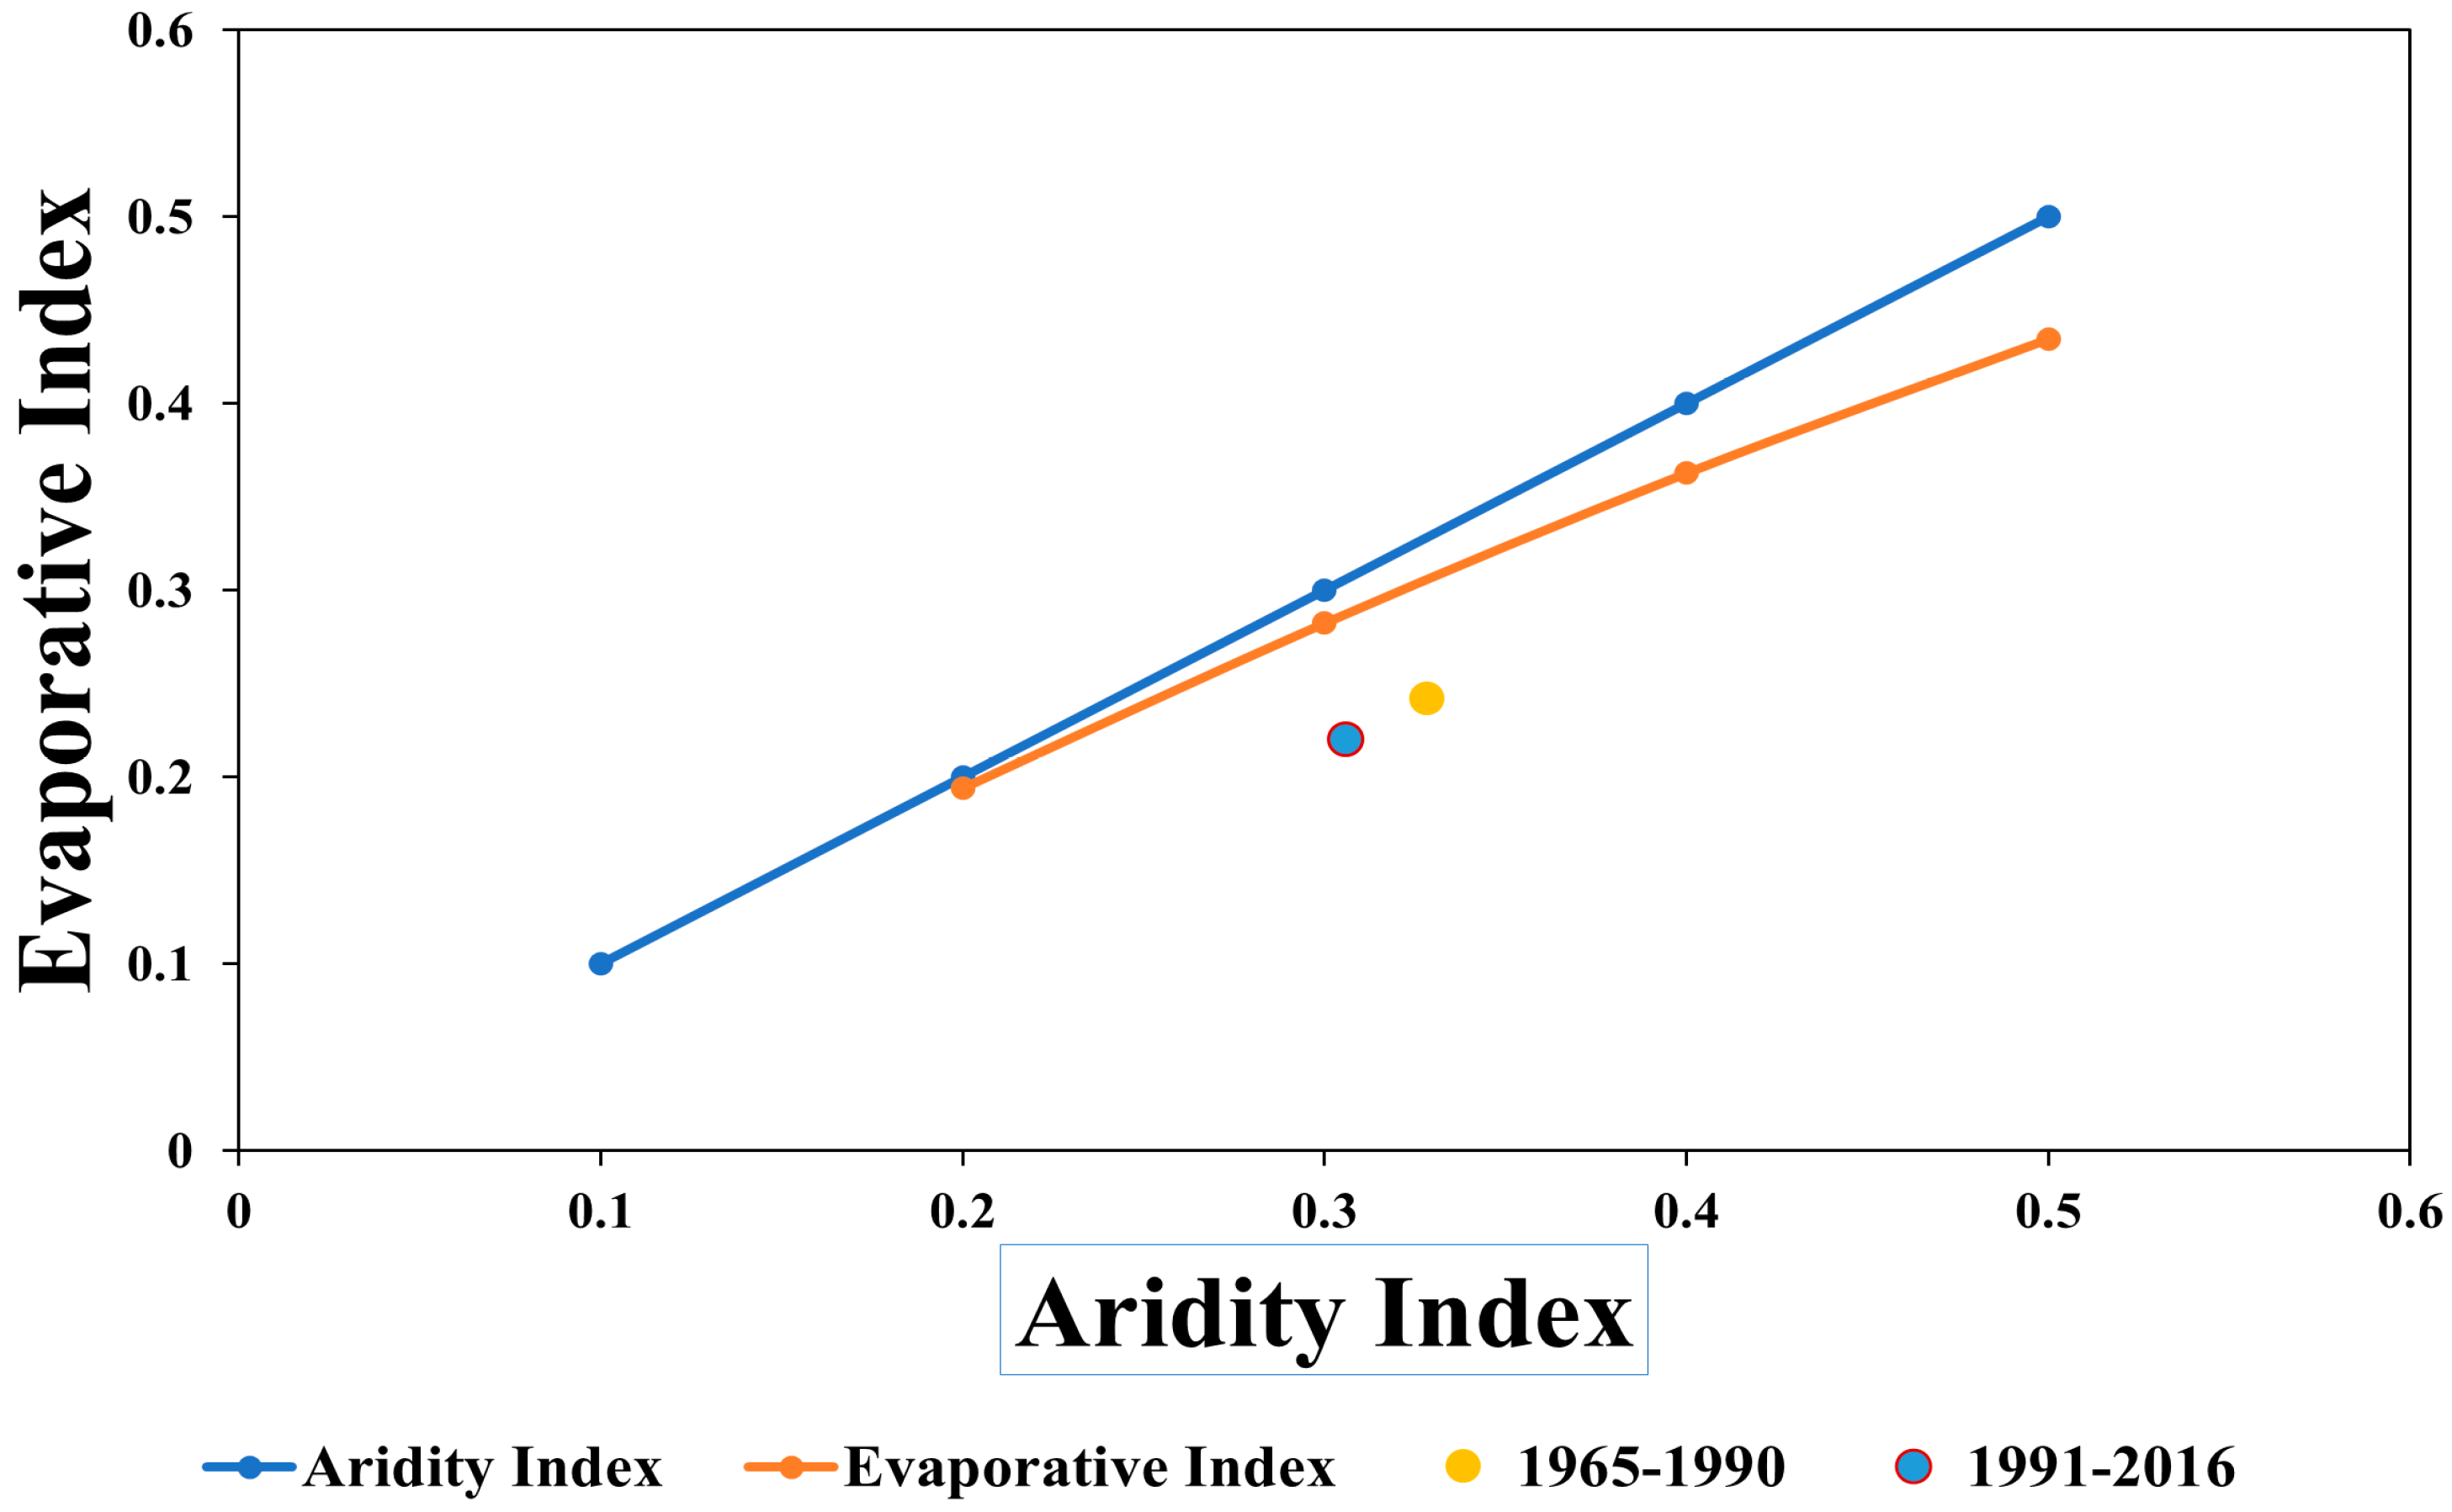
The Aridity Index (AI) and Evapotranspiration Index (EI) are computed by considering potential evapotranspiration (PET), evapotranspiration (ET) and precipitation (P). This study used the Budyko Framework to assess the hydro-climatic state of the RSRB from 1965–1990 and 1991–2016, as shown in Figure 9. Both periods were below the aridity threshold of ϕ = 1, indicating that the basin is an energy-limited system, in which water availability is outweighed by evapotranspiration. The water energy balance’s horizontal shift from 0.328 to 0.306 showed a minimal trend towards more moist climatic conditions, and the vertical positioning indicated a proof of non-stationarity in the RSRB. The present period (1991–2016) supported the masking effect by the downward vertical shift, which showed that human activities have transformed the basin’s efficiency, causing a large amount of precipitation to be converted into surface runoff.
From Figure 9, both points fell below 0.5 Aridity Index (AI), indicating an energy-limited basin and that evaporation is driven by available energy rather than water availability. The climatic shift decreased from 0.33 to 0.31 on the horizontal movement from the historical dot (yellow) to the current dot (red), suggesting that the basin experienced a wetter climatic trend. And the vertical downward shifts indicated a decrease in evaporative efficiency, meaning that a significant amount of precipitation is converted into runoff rather than evaporated (lost to the atmosphere). The Evaporative Index (EI) and the Aridity Index (AI) were computed using Equations (9) and (10). The standard Budyko curve mathematical formulation by [86,87], derived from the water-energy balance equations, is shown in Equation (11). Then, for each basin epoch, the coordinate AI against EI is plotted.
  A I = P E T P
E I = E T P
E T P = 1 + P E T P n 1 / n
where n represents a catchment characteristic parameter around 1.8 to 2.5, but for a mixed tropical or savanna catchment like the Rokel-Seli River Basin, n = 1.8 or 2 is ideal. Our study used n = 1.8.

3.6.4. Spatiotemporal Assessment of Water Yield in the Rokel-Seli River Basin

The seasonal water yield changes between the historical and the present periods of the RSRB are shown in Table 9. In the wet season, it revealed a decrease of −28.15 mm in the same LULC (1988) from historical to present and −27.44 mm by using the 2013 LULC. Under the climate change signal, runoff declined in both land use scenarios, between 11 and 12%.
Runoff increased from each given period, from the historical land use to the current land use in 2013. For instance, by changing the baseline period from 1988 to 2013, runoff surged from 234.63 to 239.38 mm. Precipitation decreased due to climatic factors, leading to a 12% decrease in runoff under constant 1988 LULC conditions. Transitioning to 2013-LULC offered a counter-hydrological buffer system. The results showed that at any given temporal epoch, the basin yielded much higher runoff values. For instance, the current period seasonal runoff values are higher than the historical period, increased from 206.48 mm to 212.37 mm in the 1991–2016 time series. This indicated that the loss of forest land could be partially associated with an increase in evapotranspiration, offsetting the climate-induced discrepancy. Therefore, the Rokel-Seli River Basin hydrological mutation is characterised by an antagonistic relationship wherein the anthropogenic effects that transformed the land use tend to significantly influence the basin, leading to a decrease in precipitation, while upholding higher river discharge, shifting from a normal environmental condition.
A new empirical reference point was observed; specifically, the water yield disproportional sensitivity to climate change during the dry season exhibited a decline of 26% compared with the wet season reduction. This could result in an untimely transformation process from a baseflow-sustained system to a higher variation of a climate-dependent regime, enhancing the regional ecological findings in the region. By taking a close look at the dry season, the table revealed a threat of water scarcity, with a decrease of 26.5% of water yield.

4. Discussion

This study used satellite Landsat images from the USGS website for LULC classification. The impact of LULC changes in the Rokel-Seli River Basin was explored. The ENVI 5.3 software was used with the supervised classification technique for the 1988 and 2013 LULC images. The statistical indicator values showed strong agreement between the reference and the classified LULC images, with a kappa coefficient above 88%. According to Pandey et al. (2023) [61], a kappa coefficient above 0.75 implies a good classification outcome.
The Rokel-Seli River Basin seasonal behaviour is characterised by a complex relationship between land use and climate change. This can be attributed to (a) a water-limited regime intensified by thermal stress in the dry season (b) an energy-limited regime and saturation-excess runoff, where runoff rises because water is no longer a restraining factor in the wet season. Temperature and precipitation variations have a rational effect on the environment. Precipitation increases significantly in May and June, before the runoff peaks, indicating the soil’s storage capacity was captured by the model. Precipitation reaches its maximum in August (basin saturation state), causing excess runoff, in the West African Monsoon. The increase in runoff in the wet season is primarily due to the basin saturation state, which decreases the infiltration rate of the high monsoonal rainfall. Conversely, the decrease in runoff during the dry season can be a result of thermal stress. This triggers a competition for water, leading to a notable decrease in discharge, due to the interception of baseflow (which sustains streamflow).
The variations in temperature and precipitation have a significant effect on the ecology. For instance, precipitation decrease may affect agricultural practices, industrial activities and the Bunbuna Dam operations, especially during the dry season, with its temperature rise. Higher temperatures affect the ecosystem, which may result in a surge in the population of the blue-green algae, including its consequences [88]. The expansion of the Bumbuna dam and reconstruction processes led to a heavy flood effect in the basin [41] affecting agricultural farm lands and altering the general ecology. Water resources authorities have implemented flood control measures to prevent flood events by establishing a 100 m buffer zone from the riverbeds [42]. However, constructing well-engineered infrastructures (e.g., a mini-reservoir) will prevent its recurrence and harvest rainwater during the rainy season, and mitigate water pollution. Considering drought events is imperative during the dry season, given the basin’s reliance on mining activities and cultivation. Research has shown that climate change adaptation methods that offer a sustainable water supply and increase cultivation in Ghana [89] can also be replicated in the RSRB.
To further explore the implications of the individual and combined climate and LULC changes, seasonal runoff dynamics demonstrate that the RSRB is prone to a severe risk of water budget deficit and regime uncertainty, which will increase if these atmospheric fluctuations become significant. Results from this finding show an increase and a decrease in seasonal runoff in the RSRB under the individual and combined impact of climate and LULC changes. The Rokel-Seli River Basin seasonal runoff variations from 1965 to 2016 may have a profound impact on the nation’s economy and environment. Considering adequate planning for these variations is imperative.
The runoff variations under climate change show a maximum increase upstream in the wet season, which corresponds with [37] findings in the RSRB. Runoff increase tends to carry sediment, nitrate and phosphorus deposits downstream of basins [40]. Preventing the increase in runoff outcomes due to climate change suggests the construction of a reservoir that can adequately harvest the surface runoff as a water conservation method. A study in the basin also revealed a decrease in flow due to human development [37]. The decline in streamflow decreases the reliability of water for cultivation (e.g., irrigation) [90], hydroelectric power supply and fishing (reducing protein sources), disturbing the river’s biodiversity. To ensure a sustainable basin, active planning and management, ecological integrity and efficacy of water consumption would enhance sustainable hydrological structure and mitigate the negative impact of the decrease in water availability.
The land use changes analysis also shows a similar increasing and decreasing runoff trend in the wet and dry seasons, respectively. Unlike climate change, land use changes on runoff are minimal, increasing by about 7% and decreasing by −13.16% in the wet and dry seasons, respectively. This increase and decrease in runoff could be associated with the development of agricultural and urban areas at the expense of forest land, shown in Figure 3b. Expanding cultivation can lead to a decline in soil water content, surface coarseness [91], and increases the basin’s tendency to high runoffs [92]. A similar result was shown with an incline in runoff in the Rokel-Seli River due to mining, dam expansion, and agricultural activities at the expense of forest land [37]. The LULC changes revealed a decrease in forest land and an increase in other land use types, due to the expansion and rehabilitation of the major reservoir for the Bumbuna hydroelectric supply dam and human activities. Intensive cultivation can reduce the tendency of canopy cover and interrupt precipitation [92]. They affect the land use and the general ecosystem in various aspects. While our findings focus on the period from 1965 to 2016, maintaining consistent data overlaps between the response of land use and climate datasets, the 2013 LULC map tends to be a more suitable match. We do recognize that likely greater human pressure might have been exhibited between 2017 and 2026. Therefore, this research would serve as a foundational attribution analysis required in the data-limited RSRB. In the study, allowing a balance in the 25-year comparison of the baseline (1988 LULC), we chose the 2013 LULC as the recent epoch. However, the study is a controlled experiment; changing one data point breaks the whole grid from S1 through S4. A study by [93] showed a decrease in forest land and water bodies and an increase in urban and agricultural activities, which is related to our study. Therefore, if adequate measures are not taken by the Government of Sierra Leone, youths and stakeholders, these communities might lead to more environmental hazards in the future. Providing infiltration basins that preserve surface runoff water, which can boost baseflow by slowly seeping into the RSRB during the dry season, is recommended.
The combined land use and climate changes greatly influence seasonal runoff variations in the RSRB (Figure 10). It reveals a similar runoff outcome to that of climate change, with an increasing and a decreasing pattern in the wet and dry seasons, respectively. The decrease is mainly concentrated in the middle and downstream of the basin. Runoff ranges from −36 to 0.8% in the dry season and in the wet season from 5 to 25%. Increasing runoff tends to intensify the deposition of sediment, nitrate and phosphorus downstream of basins [40], negatively affecting these areas. Despite this, its increase can be beneficial for fishing practices and aquatic environments [40]. To adapt to runoff alterations in the RSRB, the use of water management and planning mechanisms should be practiced. The implementation of sediment traps in mining sites helps reduce runoff in mining areas. The RSRB seasonal streamflow variations suggest a vulnerable water balance, which may significantly fluctuate water availability. The findings offer a reference framework for water resources authorities and stakeholders to develop water conservation and land management policies. This study establishes an essential datum for future water resource management systems that will tend to incorporate current observed data with infrastructural practices. Such a study can also be beneficial for monitoring and modeling ecological changes in other regions, thereby enhancing decision-makers’ knowledge in allocating strategic plans for the natural ecosystem and water sustainability [94].
Our study highlights limitations to be considered in future studies. Future studies in the basin could consider socioeconomic and spatial variables such as gross domestic product (GDP), economic and technological advancement, political economy and climatic variables, and explore LULC and climate changes, using various scenarios. Coupling the CA-ANN model to simulate and predict future LULC maps and examine the hydrological regime is essential. This study’s SWAT modelling simulation primarily characterised the naturalized flow conditions of the Rokel-Seli River Basin. Because of unavailable operational datasets and to maintain focus on the drivers of change on climate and land use variability, the Bumbuna Dam operations were not modeled. However, this study provides a rudimentary assessment framework for regional policy makers, despite the limitations of using historical datasets and the omission of Bumbuna Dam operations. This study technique aligns with future regional modeling and land use change assessment by [45]. Future studies should consider the most recent meteorological, streamflow and water quality data and employed in the SWAT + model when they become available for in-depth climate and LULC changes assessment. Our study only used GFDL-ESM2M data from the ISIMIP dataset of CMIP 5; future studies should incorporate various datasets, such as the MIROC5, NorESM1-M, HadGEM2-ES, and the CORDEX Africa and the CMIP 6 datasets. While a high-quality historical baseline was provided by the 1970s data, we know that the subsequent land use variations over the years might have affected the stationarity of these conditions; thus, the ability of the model to capture the RSRB response remains statistically significant. Despite these limitations, this study’s concise results and conclusions were based on the efficacy of a scenario simulation with a calibrated SWAT model.

5. Conclusions

This study examined the individual and the combined changes in climate and LULC on runoff in the RSRB hydrology using scenario simulation with the SWAT model from 1965 to 2016. The LULC maps of 1988 and 2013 were produced using the ENVI 5.3 software, corresponding to GCM’s data from 1965 to 1990 and 1991 to 2016, respectively. Four scenarios were considered to evaluate the variations. Between 1988 and 2013, respectively, urban, bare and agricultural land increased at the expense of forest land (14.75%). Overall, the LULC changes revealed a decrease in forest land from 1988 to 2013 in the RSRB.
The simulated runoff by the SWAT model compared with observed streamflow data by the SWAT-CUP calibration and validation process. The SWAT model’s outcomes indicated statistical indicators of R2 (0.6–0.78), NSE (0.5–0.78), PBias (±25%) and KGE (55–85%), revealing its ability to simulate the RSRB hydrological cycle under a changing environment. Overall, a satisfactory agreement was shown between the simulated and observed data in the calibrated results.
Forest land decrease led to a seasonal increase and decrease in runoff, with a range of −31 to 25% under climate change and −14 to 7% for LULC change. The research’s major finding is that climate change runoff triggered the RSRB runoff variations significantly compared with LULC changes. This research methodology could serve as a datum, which can be replicated in other data-sparse regions globally.
Based on the comparative analysis performed for both the historical and present periods, a substantial shift in the hydrological regime was observed. An increase in the runoff coefficient (K) of 0.67 to 0.69 was revealed, which represents an increase in runoff generation efficiency of 2.78%. The slope of the DMC increasing trend offers strong evidence of the intensification of land use effects statistically. Overall, the results suggest that the basin’s retention ability has been compromised by the land use anthropogenic effects, resulting in a flashier hydrological impact, wherein priority is given to the wet season runoff at the detriment of the sustainability of the dry season baseflow.
Additionally, a new insight from the attribution analysis shows that transitioning from 1988 to 2013 conditions increases runoff efficiency in the basin due to the anthropogenic land changes. This effectively serves as a hydrological buffer that conceals the complete adversity of the water deficit caused by climate change. The runoff coefficient of variation (Cv) increases by 1.12, indicating a higher possibility of flash flood, which could cause hydrological instability in the basin.
In conclusion, the evidence of the hydrological regime shifts suggests that the establishment of strategic policies focusing on sustainable urbanization and forest conservation, aiming to limit the potential threats of water scarcity in the RSRB, is indispensable. Future studies should attempt to predict sediment deposits and lateral flow in the basin. Since the retention ability of the basin has been compromised, subsequent human activities must abide by regulations that prioritize reforestation and green infrastructure. By quantifying the separate and the combined impact of land use and climate change, this study’s quantitative insight is crucial for water planners in designing climate-resilient infrastructures in the RSRB, specifically to resist the dual human and environmental pressures. Establishing and implementing riparian buffers and no-go areas for mining areas are essential hydrological requirements that help curtail the accelerating volatility of the RSRB water cycle.


Supplementary Materials

The following supporting information can be downloaded at: https://www.mdpi.com/article/10.3390/atmos17060543/s1. Table S1. SWAT model data acquisition. Table S2. SWAT-CUP calibration and validation parameters with best-fitted values. Table S3. 1988-LULC accuracy assessment point for each class. Table S4. 2013-LULC accuracy assessment point for each class. Figure S1. Avg. historical runoff in the wet season (a), dry season (b), wet season. Figure S2. Soil Map and Subbasin in the Rokel-Seli River Basin. References [45,50] are cited in the Supplementary Materials.

Author Contributions

S.M.C.: conceptualization, writing—original draft, review and editing, programme running. J.P.: conceptualization, editing, supervision. J.J.: data curation, methodology, software, writing—review and editing, supervision. C.L.: resources, project administration. X.W.: data curation and validation. Z.W.: conceptualization, editing, supervision. All authors have read and agreed to the published version of the manuscript.

Funding

This research is supported by the National Natural Science Foundation of China (52379010; 52539005), the Natural Science Foundation of Guangdong Province (2023B1515020087; 2022A1515240071), and the China Scholarship Council and Major Science and Technology Project of China (SKS-2025037).

Institutional Review Board Statement

Not applicable.

Informed Consent Statement

Not applicable.

Data Availability Statement

Data will be made available on request.

Conflicts of Interest

The authors declare that we have no known competing interests or personal relationships that could have appeared to influence the work reported in this research.

References

  1. Gosling, S.N.; Arnell, N.W. A Global Assessment of the Impact of Climate Change on Water Scarcity. Clim. Change 2016, 134, 371–385. [Google Scholar] [CrossRef]
  2. Dile, Y.T.; Berndtsson, R.; Setegn, S.G. Hydrological Response to Climate Change for Gilgel Abay River, in the Lake Tana Basin-Upper Blue Nile Basin of Ethiopia. PLoS ONE 2013, 8, e79296. [Google Scholar] [CrossRef] [PubMed]
  3. Bailey, R.T.; Wible, T.C.; Arabi, M.; Records, R.M.; Ditty, J. Assessing Regional-scale Spatio-temporal Patterns of Groundwater–Surface Water Interactions Using a Coupled SWAT-MODFLOW Model. Hydrol. Process. 2016, 30, 4420–4433. [Google Scholar] [CrossRef]
  4. Cosgrove, W.J.; Loucks, D.P. Water Management: Current and Future Challenges and Research Directions. Water Resour. Res. 2015, 51, 4823–4839. [Google Scholar] [CrossRef]
  5. Zhang, L.; Nan, Z.; Yu, W.; Ge, Y. Hydrological Responses to Land-Use Change Scenarios under Constant and Changed Climatic Conditions. Environ. Manag. 2016, 57, 412–431. [Google Scholar] [CrossRef]
  6. Zhao, A.; Zhu, X.; Liu, X.; Pan, Y.; Zuo, D. Impacts of Land Use Change and Climate Variability on Green and Blue Water Resources in the Weihe River Basin of Northwest China. Catena 2016, 137, 318–327. [Google Scholar] [CrossRef]
  7. Memarian, H.; Balasundram, S.K.; Abbaspour, K.C.; Talib, J.B.; Boon Sung, C.T.; Sood, A.M. SWAT-Based Hydrological Modelling of Tropical Land-Use Scenarios. Hydrol. Sci. J. 2014, 59, 1808–1829. [Google Scholar] [CrossRef]
  8. Singh, H.; Sinha, T.; Sankarasubramanian, A. Impacts of Near-Term Climate Change and Population Growth on within-Year Reservoir Systems. J. Water Resour. Plan. Manag. 2015, 141, 04014078. [Google Scholar] [CrossRef]
  9. Chakilu, G.G.; Sándor, S.; Zoltán, T.; Phinzi, K. Climate Change and the Response of Streamflow of Watersheds under the High Emission Scenario in Lake Tana Sub-Basin, Upper Blue Nile Basin, Ethiopia. J. Hydrol. Reg. Stud. 2022, 42, 101175. [Google Scholar] [CrossRef]
  10. Woldesenbet, T.A.; Elagib, N.A.; Ribbe, L.; Heinrich, J. Catchment Response to Climate and Land Use Changes in the Upper Blue Nile Sub-Basins, Ethiopia. Sci. Total Environ. 2018, 644, 193–206. [Google Scholar] [CrossRef]
  11. Blanco, G. The Lima Declaration on Biodiversity and Climate Change: Contributions from Science to Policy for Sustainable Development. In Proceedings of the Consideration of the IPCC 5th Report on Mitigation, Milan, Italy, 14 April 2017; p. 17. [Google Scholar]
  12. Surendran, U.; Sushanth, C.; Mammen, G.; Joseph, E. FAO-CROPWAT Model-Based Estimation of Crop Water Need and Appraisal of Water Resources for Sustainable Water Resource Management: Pilot Study for Kollam District–Humid Tropical Region of Kerala, India. Curr. Sci. 2017, 122, 76–86. [Google Scholar] [CrossRef]
  13. Bunn, S.E.; Arthington, A.H. Basic Principles and Ecological Consequences of Altered Flow Regimes for Aquatic Biodiversity. Environ. Manag. 2002, 30, 492–507. [Google Scholar] [CrossRef]
  14. Schewe, J.; Heinke, J.; Gerten, D.; Haddeland, I.; Arnell, N.W.; Clark, D.B.; Dankers, R.; Eisner, S.; Fekete, B.M.; Colón-González, F.J.; et al. Multimodel Assessment of Water Scarcity under Climate Change. Proc. Natl. Acad. Sci. USA 2014, 111, 3245–3250. [Google Scholar] [CrossRef]
  15. Talib, A.; Randhir, T.O. Climate Change and Land Use Impacts on Hydrologic Processes of Watershed Systems. J. Water Clim. Change 2017, 8, 363–374. [Google Scholar] [CrossRef]
  16. Mimikou, M.; Kouvopoulos, Y.; Cavadias, G.; Vayianos, N. Regional Hydrological Effects of Climate Change. J. Hydrol. 1991, 123, 119–146. [Google Scholar] [CrossRef]
  17. Estifanos, T.H.; Gebremariam, B. Modeling-Impact of Land Use/Cover Change on Sediment Yield (Case Study on Omo-Gibe Basin, Gilgel Gibe III Watershed, Ethiopia). Am. J. Mod. Energy 2020, 5, 84–93. [Google Scholar] [CrossRef]
  18. Getachew, B.; Manjunatha, B.; Bhat, H.G. Modeling Projected Impacts of Climate and Land Use/Land Cover Changes on Hydrological Responses in the Lake Tana Basin, Upper Blue Nile River Basin, Ethiopia. J. Hydrol. 2021, 595, 125974. [Google Scholar] [CrossRef]
  19. Chauluka, F.; Singh, S.; Kumar, R. Rainfall and Streamflow Trends of Thuchila River, Southern Malawi. Mater. Today Proc. 2021, 34, 846–855. [Google Scholar] [CrossRef]
  20. Orke, Y.A.; Li, M.-H. Hydroclimatic Variability in the Bilate Watershed, Ethiopia. Climate 2021, 9, 98. [Google Scholar] [CrossRef]
  21. Barbosa, A.E.; Fernandes, J.N.; David, L.M. Key Issues for Sustainable Urban Stormwater Management. Water Res. 2012, 46, 6787–6798. [Google Scholar] [CrossRef]
  22. Gebrechorkos, S.H.; Bernhofer, C.; Hülsmann, S. Climate Change Impact Assessment on the Hydrology of a Large River Basin in Ethiopia Using a Local-Scale Climate Modelling Approach. Sci. Total Environ. 2020, 742, 140504. [Google Scholar] [CrossRef]
  23. Markos Mathewos Godebo, M.M.G.; Mihret Dananto Ulsido, M.D.U.; Teklu Erkossa Jijo, T.E.J.; Getachew Mulugeta Geleto, G.M.G. Influence of Land Use and Land Cover Changes on Ecosystem Services in the Bilate Alaba Sub-Watershed, Southern Ethiopia. J. Ecol. Nat. Environ. 2018, 10, 228–238. [Google Scholar] [CrossRef]
  24. Berihun, M.L.; Tsunekawa, A.; Haregeweyn, N.; Meshesha, D.T.; Adgo, E.; Tsubo, M.; Masunaga, T.; Fenta, A.A.; Sultan, D.; Yibeltal, M. Exploring Land Use/Land Cover Changes, Drivers and Their Implications in Contrasting Agro-Ecological Environments of Ethiopia. Land Use Policy 2019, 87, 104052. [Google Scholar] [CrossRef]
  25. Liverman, D.M.; Cuesta, R.M.R. Human Interactions with the Earth System: People and Pixels Revisited. Earth Surf. Process. Landf. J. Br. Geomorphol. Res. Group 2008, 33, 1458–1471. [Google Scholar] [CrossRef]
  26. Valjarević, A.; Morar, C.; Brasanac-Bosanac, L.; Cirkovic-Mitrovic, T.; Djekic, T.; Mihajlović, M.; Milevski, I.; Culafic, G.; Luković, M.; Niemets, L.; et al. Sustainable Land Use in Moldova: GIS & Remote Sensing of Forests and Crops. Land Use Policy 2025, 152, 107515. [Google Scholar] [CrossRef]
  27. Jiang, J.; Wang, Z.; Lai, C.; Wu, X.; Chen, X. Climate and Landuse Change Enhance Spatio-Temporal Variability of Dongjiang River Flow and Ammonia Nitrogen. Sci. Total Environ. 2023, 867, 161483. [Google Scholar] [CrossRef] [PubMed]
  28. Idrees, M.; Ahmad, S.; Khan, M.W.; Dahri, Z.H.; Ahmad, K.; Azmat, M.; Rana, I.A. Estimation of Water Balance for Anticipated Land Use in the Potohar Plateau of the Indus Basin Using SWAT. Remote Sens. 2022, 14, 5421. [Google Scholar] [CrossRef]
  29. Awotwi, A.; Annor, T.; Anornu, G.K.; Quaye-Ballard, J.A.; Agyekum, J.; Ampadu, B.; Nti, I.K.; Gyampo, M.A.; Boakye, E. Climate Change Impact on Streamflow in a Tropical Basin of Ghana, West Africa. J. Hydrol. Reg. Stud. 2021, 34, 100805. [Google Scholar] [CrossRef]
  30. Gashaw, T.; Tulu, T.; Argaw, M.; Worqlul, A.W. Modeling the Hydrological Impacts of Land Use/Land Cover Changes in the Andassa Watershed, Blue Nile Basin, Ethiopia. Sci. Total Environ. 2018, 619–620, 1394–1408. [Google Scholar] [CrossRef]
  31. Kiprotich, P.; Wei, X.; Zhang, Z.; Ngigi, T.; Qiu, F.; Wang, L. Assessing the Impact of Land Use and Climate Change on Surface Runoff Response Using Gridded Observations and Swat+. Hydrology 2021, 8, 48. [Google Scholar] [CrossRef]
  32. Alemu, M.M.; Bawoke, G.T. Analysis of Spatial Variability and Temporal Trends of Rainfall in Amhara Region, Ethiopia. J. Water Clim. Change 2020, 11, 1505–1520. [Google Scholar] [CrossRef]
  33. Arrieta-Castro, M.; Donado-Rodríguez, A.; Acuña, G.J.; Canales, F.A.; Teegavarapu, R.S.; Kaźmierczak, B. Analysis of Streamflow Variability and Trends in the Meta River, Colombia. Water 2020, 12, 1451. [Google Scholar] [CrossRef]
  34. Fentaw, F.; Hailu, D.; Nigussie, A. Trend and Variability Analysis of Rainfall & Stream Flow Series at Tekeze River Basin, Ethiopia. Int. J. Sci. Eng. Res. 2017, 8, 665–680. [Google Scholar]
  35. Tadese, M.T.; Kumar, L.; Koech, R.; Zemadim, B. Hydro-Climatic Variability: A Characterisation and Trend Study of the Awash River Basin, Ethiopia. Hydrology 2019, 6, 35. [Google Scholar] [CrossRef]
  36. Tong, S.T.; Sun, Y.; Ranatunga, T.; He, J.; Yang, Y.J. Predicting Plausible Impacts of Sets of Climate and Land Use Change Scenarios on Water Resources. Appl. Geogr. 2012, 32, 477–489. [Google Scholar] [CrossRef]
  37. Wilson, C.; Liang, B.; Wilson, S.; Akiwumi, F. Land Use, Microclimate, and Surface Runoff Linkages: Space-Time Modeling from Rokel-Seli River Basin, Sierra Leone. Int. Arch. Photogramm. Remote Sens. Spat. Inf. Sci. 2018, 42, 225–230. [Google Scholar] [CrossRef]
  38. Mengistu, D.; Bewket, W.; Dosio, A.; Panitz, H.-J. Climate Change Impacts on Water Resources in the Upper Blue Nile (Abay) River Basin, Ethiopia. J. Hydrol. 2021, 592, 125614. [Google Scholar] [CrossRef]
  39. Ruigar, H.; Gharechelou, S.; Emamgholizadeh, S.; Golian, S. Impact Assessment of Future Land Use and Climate Change on Talar River Streamflow—Mazandaran, Iran. Theor. Appl. Climatol. 2025, 156, 202. [Google Scholar] [CrossRef]
  40. Ahiablame, L.; Sinha, T.; Paul, M.; Ji, J.-H.; Rajib, A. Streamflow Response to Potential Land Use and Climate Changes in the James River Watershed, Upper Midwest United States. J. Hydrol. Reg. Stud. 2017, 14, 150–166. [Google Scholar] [CrossRef]
  41. Mansaray, A.; Barrie, A. Utilization of Landsat Data for Quantifying and Predicting Land Cover Change in the Bumbuna Watershed in Sierra Leone. Nat. Resour. 2016, 7, 495–504. [Google Scholar] [CrossRef]
  42. Koroma, E.B. The Bumbuna Watershed Management Authority and the Bumbuna Conservation Area Act; Government Printing Department, Freetown: Freetown, Sierra Leone, 2008. [Google Scholar]
  43. Masafu, C.K.; Trigg, M.A.; Carter, R.; Howden, N.J. Water Availability and Agricultural Demand: An Assessment Framework Using Global Datasets in a Data Scarce Catchment, Rokel-Seli River, Sierra Leone. J. Hydrol. Reg. Stud. 2016, 8, 222–234. [Google Scholar] [CrossRef]
  44. Fayiah, M. Mining and Environmental Degradation: A Gift Brings Grief Scenario for Mining Communities in Sierra Leone. J. Min. Environ. 2020, 11, 347–361. [Google Scholar]
  45. Conteh, S.M.; Pan, J.; Wang, Z.; Feng, X.; Lai, C.; Wu, X.; Zeng, Z.; Jiang, J. Future Impact of Climate and Land Use Change on Streamflow in the Rokel-Seli River Basin, Sierra Leone. JAWRA J. Am. Water Resour. Assoc. 2025, 61, e70044. [Google Scholar] [CrossRef]
  46. Wagner, S.; Kunstmann, H.; Bárdossy, A.; Conrad, C.; Colditz, R. Water Balance Estimation of a Poorly Gauged Catchment in West Africa Using Dynamically Downscaled Meteorological Fields and Remote Sensing Information. Phys. Chem. Earth Parts A/B/C 2009, 34, 225–235. [Google Scholar] [CrossRef]
  47. Statistics Sierra Leone (SSL). 2015 Population and Housing Census: Final Results; Statistics Sierra Leone: Freetown, Sierra Leone.
  48. Muthee, S.W.; Kuria, B.T.; Mundia, C.N.; Sichangi, A.W.; Kuria, D.N.; Goebel, M.; Rienow, A. Using SWAT to Model the Response of Evapotranspiration and Runoff to Varying Land Uses and Climatic Conditions in the Muringato Basin, Kenya. Model. Earth Syst. Environ. 2023, 9, 1531–1543. [Google Scholar] [CrossRef]
  49. Yeboah, K.A.; Akpoti, K.; Kabo-bah, A.T.; Ofosu, E.A.; Siabi, E.K.; Mortey, E.M.; Okyereh, S.A. Assessing Climate Change Projections in the Volta Basin Using the CORDEX-Africa Climate Simulations and Statistical Bias-Correction. Environ. Chall. 2022, 6, 100439. [Google Scholar] [CrossRef]
  50. Darman, L.P.; Januhariadi, J.; Yudha, M.P.; Aslan, A. Assessment of NASA POWER Reanalysis Products as Data Resources Alternative for Weather Monitoring in West Sumbawa, Indonesia; EDP Sciences: Les Ulis, France, 2024; Volume 485, p. 06006. [Google Scholar]
  51. Ministry of Water Resources (MWR). Sierra Leone Water Security Project Hydro-Meteorological Database; National Water Resources Management Agency (NWRMA): Freetown, Sierra Leone, 2016. Available online: https://nwrma.gov.sl/publications/ (accessed on 24 May 2022).
  52. Aljenaid, S.S.; Kadhem, G.R.; AlKhuzaei, M.F.; Alam, J.B. Detecting and Assessing the Spatio-Temporal Land Use Land Cover Changes of Bahrain Island during 1986–2020 Using Remote Sensing and GIS. Earth Syst. Environ. 2022, 6, 787–802. [Google Scholar] [CrossRef]
  53. Kuniansky, E.L. Custom Map Projections for Regional Groundwater Models. Groundwater 2017, 55, 255–260. [Google Scholar] [CrossRef]
  54. Rwanga, S.S.; Ndambuki, J.M. Accuracy Assessment of Land Use/Land Cover Classification Using Remote Sensing and GIS. Int. J. Geosci. 2017, 8, 611. [Google Scholar] [CrossRef]
  55. Abebe, G.; Getachew, D.; Ewunetu, A. Analysing Land Use/Land Cover Changes and Its Dynamics Using Remote Sensing and GIS in Gubalafito District, Northeastern Ethiopia. SN Appl. Sci. 2022, 4, 30. [Google Scholar] [CrossRef]
  56. Feizizadeh, B. A Novel Approach of Fuzzy Dempster–Shafer Theory for Spatial Uncertainty Analysis and Accuracy Assessment of Object-Based Image Classification. IEEE Geosci. Remote Sens. Lett. 2017, 15, 18–22. [Google Scholar] [CrossRef]
  57. Belay, T.; Melese, T.; Senamaw, A. Impacts of Land Use and Land Cover Change on Ecosystem Service Values in the Afroalpine Area of Guna Mountain, Northwest Ethiopia. Heliyon 2022, 8, e12246. [Google Scholar] [CrossRef]
  58. Kuma, H.G.; Feyessa, F.F.; Demissie, T.A. Land-Use/Land-Cover Changes and Implications in Southern Ethiopia: Evidence from Remote Sensing and Informants. Heliyon 2022, 8, e09071. [Google Scholar] [CrossRef]
  59. Hundu, W.; Anule, P.; Kwanga, G.; Dam, D. Assessment of Land Use and Land Cover Change Using GIS and Remote Sensing Techniques in Katsina-Ala Local Government Area of Benue State, Nigeria. J. Res. For. Wildl. Environ. 2021, 13, 195–204. [Google Scholar]
  60. Liping, C.; Yujun, S.; Saeed, S. Monitoring and Predicting Land Use and Land Cover Changes Using Remote Sensing and GIS Techniques—A Case Study of a Hilly Area, Jiangle, China. PLoS ONE 2018, 13, e0200493. [Google Scholar] [CrossRef] [PubMed]
  61. Pandey, S.; Kumari, N.; Al Nawajish, S. Land Use Land Cover (LULC) and Surface Water Quality Assessment in and around Selected Dams of Jharkhand Using Water Quality Index (WQI) and Geographic Information System (GIS). J. Geol. Soc. India 2023, 99, 205–218. [Google Scholar] [CrossRef]
  62. Abbaspour, K.C.; Yang, J.; Maximov, I.; Siber, R.; Bogner, K.; Mieleitner, J.; Zobrist, J.; Srinivasan, R. Modelling Hydrology and Water Quality in the Pre-Alpine/Alpine Thur Watershed Using SWAT. J. Hydrol. 2007, 333, 413–430. [Google Scholar] [CrossRef]
  63. Arnold, J.G.; Moriasi, D.N.; Gassman, P.W.; Abbaspour, K.C.; White, M.J.; Srinivasan, R.; Santhi, C.; Harmel, R.; Van Griensven, A.; Van Liew, M.W.; et al. SWAT: Model Use, Calibration, and Validation. Trans. ASABE 2012, 55, 1491–1508. [Google Scholar] [CrossRef]
  64. Neitsch, S.L.; Arnold, J.G.; Kiniry, J.R.; Williams, J.R. Soil and Water Assessment Tool Theoretical Documentation Version 2009; Texas Water Resources Institute: College Station, TX, USA, 2011. [Google Scholar]
  65. Devia, G.K.; Ganasri, B.P.; Dwarakish, G.S. A Review on Hydrological Models. Aquat. Procedia 2015, 4, 1001–1007. [Google Scholar] [CrossRef]
  66. Gassman, P.W.; Reyes, M.R.; Green, C.H.; Arnold, J.G. The Soil and Water Assessment Tool: Historical Development, Applications, and Future Research Directions. Trans. ASABE 2007, 50, 1211–1250. [Google Scholar] [CrossRef]
  67. Tegegne, G.; Park, D.K.; Kim, Y.-O. Comparison of Hydrological Models for the Assessment of Water Resources in a Data-Scarce Region, the Upper Blue Nile River Basin. J. Hydrol. Reg. Stud. 2017, 14, 49–66. [Google Scholar] [CrossRef]
  68. Wagena, M.B.; Sommerlot, A.; Abiy, A.Z.; Collick, A.S.; Langan, S.; Fuka, D.R.; Easton, Z.M. Climate Change in the Blue Nile Basin Ethiopia: Implications for Water Resources and Sediment Transport. Clim. Change 2016, 139, 229–243. [Google Scholar] [CrossRef]
  69. Li, X.; Zhang, Y.; Ma, N.; Li, C.; Luan, J. Contrasting Effects of Climate and LULC Change on Blue Water Resources at Varying Temporal and Spatial Scales. Sci. Total Environ. 2021, 786, 147488. [Google Scholar] [CrossRef]
  70. Yang, M.; Xiao, W.; Zhao, Y.; Li, X.; Huang, Y.; Lu, F.; Hou, B.; Li, B. Assessment of Potential Climate Change Effects on the Rice Yield and Water Footprint in the Nanliujiang Catchment, China. Sustainability 2018, 10, 242. [Google Scholar] [CrossRef]
  71. Abbaspour, K.C.; Rouholahnejad, E.; Vaghefi, S.; Srinivasan, R.; Yang, H.; Kløve, B. A Continental-Scale Hydrology and Water Quality Model for Europe: Calibration and Uncertainty of a High-Resolution Large-Scale SWAT Model. J. Hydrol. 2015, 524, 733–752. [Google Scholar] [CrossRef]
  72. Arnold, J.G.; Srinivasan, R.; Muttiah, R.S.; Williams, J.R. Large Area Hydrologic Modeling and Assessment Part I: Model Development 1. JAWRA J. Am. Water Resour. Assoc. 1998, 34, 73–89. [Google Scholar] [CrossRef]
  73. Abbaspour, K.C. SWAT-CUP: SWAT Calibration and Uncertainty Programs—A User Manual; Eawag: Dubendorf, Switzerland, 2015; pp. 17–66. [Google Scholar]
  74. Morris, G.L.; Fan, J. Reservoir Sedimentation Handbook: Design and Management of Dams, Reservoirs, and Watersheds for Sustainable Use; McGraw-Hill: New York, NY, USA, 1998. [Google Scholar]
  75. Liu, D. A Rational Performance Criterion for Hydrological Model. J. Hydrol. 2020, 590, 125488. [Google Scholar] [CrossRef]
  76. Liu, X.; Zhu, X.; Pan, Y.; Li, S.; Liu, Y.; Ma, Y. Agricultural Drought Monitoring: Progress, Challenges, and Prospects. J. Geogr. Sci. 2016, 26, 750–767. [Google Scholar] [CrossRef]
  77. Naiman, R.J.; Bilby, R.E.; Bisson, P.A. Riparian Ecology and Management in the Pacific Coastal Rain Forest. BioScience 2000, 50, 996–1011. [Google Scholar] [CrossRef]
  78. White, J.C.; Wulder, M.; Hobart, G.; Luther, J.; Hermosilla, T.; Griffiths, P.; Coops, N.; Hall, R.; Hostert, P.; Dyk, A. Pixel-Based Image Compositing for Large-Area Dense Time Series Applications and Science. Can. J. Remote Sens. 2014, 40, 192–212. [Google Scholar] [CrossRef]
  79. Alemayehu, F.; Tolera, M.; Tesfaye, G. Land Use Land Cover Change Trend and Its Drivers in Somodo Watershed South Western, Ethiopia. Afr. J. Agric. Res. 2019, 14, 102–117. [Google Scholar] [CrossRef]
  80. Ogato, G.S.; Bantider, A.; Geneletti, D. Dynamics of Land Use and Land Cover Changes in Huluka Watershed of Oromia Regional State, Ethiopia. Environ. Syst. Res. 2021, 10, 10. [Google Scholar] [CrossRef]
  81. Beshir, S.; Moges, A.; Dananto, M. Trend Analysis, Past Dynamics and Future Prediction of Land Use and Land Cover Change in Upper Wabe-Shebele River Basin. Heliyon 2023, 9, e19128. [Google Scholar] [CrossRef] [PubMed]
  82. Moriasi, D.N.; Gitau, M.W.; Pai, N.; Daggupati, P. Hydrologic and Water Quality Models: Performance Measures and Evaluation Criteria. Trans. ASABE 2015, 58, 1763–1785. [Google Scholar] [CrossRef]
  83. Monserud, R.A.; Leemans, R. Comparing Global Vegetation Maps with the Kappa Statistic. Ecol. Model. 1992, 62, 275–293. [Google Scholar] [CrossRef]
  84. Rahman, K.U.; Shang, S.; Shahid, M.; Wen, Y. Hydrological Evaluation of Merged Satellite Precipitation Datasets for Streamflow Simulation Using SWAT: A Case Study of Potohar Plateau, Pakistan. J. Hydrol. 2020, 587, 125040. [Google Scholar] [CrossRef]
  85. Amogu, O.; Descroix, L.; Yéro, K.S.; Le Breton, E.; Mamadou, I.; Ali, A.; Vischel, T.; Bader, J.-C.; Moussa, I.B.; Gautier, E.; et al. Increasing River Flows in the Sahel? Water 2010, 2, 170–199. [Google Scholar] [CrossRef]
  86. Choudhury, B. Evaluation of an Empirical Equation for Annual Evaporation Using Field Observations and Results from a Biophysical Model. J. Hydrol. 1999, 216, 99–110. [Google Scholar] [CrossRef]
  87. Yang, H.; Yang, D.; Lei, Z.; Sun, F. New Analytical Derivation of the Mean Annual Water-energy Balance Equation. Water Resour. Res. 2008, 44, W03410. [Google Scholar] [CrossRef]
  88. Xie, X.; Li, Y.; Hang, X.; Huang, S. The Effect of Air Temperature on the Process of Cyanobacteria Recruitment and Dormancy in Lake Taihu. J. Lake Sci. 2016, 28, 818–824. [Google Scholar] [CrossRef]
  89. Awotwi, A.; Kumi, M.; Jansson, P.E.; Yeboah, F.; Nti, I.K. Predicting Hydrological Response to Climate Change in the White Volta Catchment, West Africa. J. Earth Sci. Clim. Change 2015, 6, 249. [Google Scholar]
  90. Basche, A.D.; Archontoulis, S.V.; Kaspar, T.C.; Jaynes, D.B.; Parkin, T.B.; Miguez, F.E. Simulating Long-Term Impacts of Cover Crops and Climate Change on Crop Production and Environmental Outcomes in the Midwestern United States. Agric. Ecosyst. Environ. 2016, 218, 95–106. [Google Scholar] [CrossRef]
  91. Baker, T.J.; Miller, S.N. Using the Soil and Water Assessment Tool (SWAT) to Assess Land Use Impact on Water Resources in an East African Watershed. J. Hydrol. 2013, 486, 100–111. [Google Scholar] [CrossRef]
  92. Ghaffari, G.; Keesstra, S.; Ghodousi, J.; Ahmadi, H. SWAT-simulated Hydrological Impact of Land-use Change in the Zanjanrood Basin, Northwest Iran. Hydrol. Process. Int. J. 2010, 24, 892–903. [Google Scholar] [CrossRef]
  93. Kundu, S.; Khare, D.; Mondal, A. Individual and Combined Impacts of Future Climate and Land Use Changes on the Water Balance. Ecol. Eng. 2017, 105, 42–57. [Google Scholar] [CrossRef]
  94. Tang, W.; Yang, J. Agent-Based Land Change Modeling of a Large Watershed: Space-Time Locations of Critical Threshold. J. Artif. Soc. Soc. Simul. 2020, 23, 15. [Google Scholar] [CrossRef]
Figure 1. Rokel-Seli River Basin map.
Atmosphere 17 00543 g001
Figure 2. Research methodological framework.
Atmosphere 17 00543 g002
Figure 3. LULC maps of years (a) 1988, (b) 2013.
Atmosphere 17 00543 g003
Figure 4. Average monthly (a) precipitation and (b) temperature.
Atmosphere 17 00543 g004
Figure 5. Calibration and validation performance of the SWAT model.
Atmosphere 17 00543 g005
Figure 6. Avg. runoff contribution rate under (a) climate, (b) combined and (c) LULC changes in the wet season.
Atmosphere 17 00543 g006
Figure 7. Avg. runoff contribution rate under (a) climate, (b) combined and (c) LULC changes in the dry season.
Atmosphere 17 00543 g007
Figure 8. The double mass curve for the Rokel-Seli River Basin from 1965 to 2016. PCP_CUM and WLD_CUM represent cumulative precipitation and cumulative water yield, respectively.
Atmosphere 17 00543 g008
Figure 9. The Budyko framework analysis of the Rokel-Seli River Basin for study periods (1965–1990 and 1991–2016). The blue line denotes energy-limited and the orange line represents the theoretical Budyko plot.
Atmosphere 17 00543 g009
Figure 10. Avg. seasonal runoff contribution rate in the upper, middle and downstream of (a) wet season (b) dry season.
Atmosphere 17 00543 g010
Table 1. Scenarios of the research.
Scenarios (S)Climate DataLULC DataClimate ChangeLULC ChangeCombined ChangesDefinition
Baseline (S1)1965–19901988---Reference
S21991–20161988S2 − S1--∆_Climate = S2 − S1
S31965–19902013-S3 − S1-∆_LULU = S3 − S1
S41991–20162013--S4 − S1∆_Combined = S4 − S1
Note: the synergistic in scenario S4 − S1 ≠ S2 − S1 + S3 − S1.
Table 2. LULC accuracy assessment.
LULC Classes19882013
UA (%)PA (%)UA (%)PA (%)
AGRL10010010088.89
BARL8088.8977.1490
FRST87.510094.9291.8
URBN10082.6010095.24
WATR100100100100
Kappa coefficient92.30-89.98-
Overall accuracy92.87-92.57-
Note: UA and PA denote the User’s accuracy and Producer’s accuracy, respectively. AGRL, BARL, FRST, URBN and WATR represent Agricultural land, Bare land, Forest land, Urban land and Water bodies, respectively.
Table 3. The SWAT model calibration and validation performance.
StationProcessesStatistical Indicators
R2NSEPBIASKGE
Bumbuna Calibration0.710.61−23.200.71
Validation0.680.51−19.100.70
BadalaCalibration0.780.78−2.500.84
Validation0.680.68−13.800.57
Table 4. The LULC changes between 1988 and 2013.
LULC Classes19882013
km2%km2%
BARL248.762.43549.315.36
AGRL287.132.81370.6913.37
FRST9652.6894.178229.3880.15
URBN13.370.1357.780.76
WATR47.840.4742.620.36
Note: AGRL, BARL, FRST, URBN and WATR represent agricultural land, bare land, forest land, urban land and water bodies, respectively.
Table 5. SWAT-CUP calibration and validation sensitive parameters.
SWAT Parameterst-Statp-ValueBest Fitted Valuest-Statp-ValueBest Fitted Values
Bumbuna StationBadala Station
v__ALPHA_BF.gwBaseflow alpha factor−35.50940.000−8 × 10⁻⁴−45.190.000−0.0017
r__CN2.mgtSCS runoff curve number−28.20660.000−0.192−25.40.000−0.2263
r__SOL_K(..).solSaturated hydraulic conductivity−11.91440.0000.3925−4.4070.0000.626
v__ESCO.hruSoil evaporation compensation factor−2.08010.0380.0015−2.2010.0450.032
r__OV_N.hruManning’s “n” value for overland flow1.9890.0470.01934.6140.0000.007
Table 6. Runoff coefficient of variation from 1988 to 2013.
Impacts AssessmentUpstreamMiddle StreamDownstream
Wet SeasonDry SeasonWet SeasonDry SeasonWet seasonDry Season
LULC0.741.330.721.170.671.15
Climate change0.951.40.751.310.791.28
Combined Changes0.961.440.751.320.781.3
Table 7. Regression analysis to quantify the runoff generation efficiency from 1965 to 1990.
PeriodSlope Coefficients (K)Multiple RObservations (Year)R2Adjusted R2p-ValueSignificance (F)Lower 95%Upper 95%
1965–19900.67010.999923.000.99980.99980.00000.00000.66570.6745
1991–20160.68870.999523.000.99890.99890.00000.00000.67840.6990
Table 8. Statistical relation of parameters between the two periods.
SeasonPeriodCvCrSRSeasonCvCrSR
Wet Season65-90_LU880.760.550.36Dry Season1.251.330.08
65-90_LU130.740.560.411.271.270.10
91-16_LU880.810.600.421.371.680.07
91-16_LU130.800.610.471.401.600.08
Note: The mathematical indices, Cv, Cr and SR denote: coefficient of variation, runoff coefficient, and surface runoff, respectively. Period 65–90 means from the year 1965–1990, and LU88 represents the 1988 land use map, same for all other periods.
Table 9. The mean seasonal hydrological changes of water yield between the two epochs.
SeasonLULCHistorical (1965–1990)Present (1991–2016)Absolute Changes (mm)Percentage Changes (%)
Wet1988234.63206.48−28.15−12.00
2013239.38212.37−27.00−11.28
Dry198890.2076.58−13.62−15.10
201386.3469.47−16.87−19.54
Disclaimer/Publisher’s Note: The statements, opinions and data contained in all publications are solely those of the individual author(s) and contributor(s) and not of MDPI and/or the editor(s). MDPI and/or the editor(s) disclaim responsibility for any injury to people or property resulting from any ideas, methods, instructions or products referred to in the content.