Article

Spatiotemporal Heterogeneity of Intensifying Extreme Precipitation in China During the 21st Century and Its Asymmetric Climate Response

China Fire and Rescue Institute, Beijing 102202, China
*
Author to whom correspondence should be addressed.
Atmosphere 2026, 17(3), 330; https://doi.org/10.3390/atmos17030330
Submission received: 27 February 2026 / Revised: 19 March 2026 / Accepted: 20 March 2026 / Published: 23 March 2026
(This article belongs to the Section Climatology)

Abstract

Extreme precipitation events are projected to change under climate change in terms of frequency, intensity and duration, which would cause serious impacts on water resources, agriculture, urban systems and socioeconomic conditions in the future. Based on 10 CMIP5 simulations statistically downscaled to 0.25° resolution through the NASA Earth Exchange Global Daily Downscaled Projections (NEX-GDDP) initiative, seven precipitation climate extreme indices, as well as the probability ratio (PR) calculated by the Generalized Extreme Value (GEV) model for daily precipitation, were analyzed under scenarios RCP4.5 and RCP8.5. The results show that: (1) Annual precipitation is projected to increase significantly across China during the 21st century. The increasing rates are 1.4%/decade under RCP4.5 and 2.9%/decade under RCP8.5, respectively. The Tibetan Plateau exhibits the largest increase, particularly over the Karakoram Mountain area. Precipitation will also significantly increase in winter (13.59%/decade and 16.40%/decade) and spring (4.30%/decade and 6.33%/decade). (2) Precipitation extremes are projected to intensify markedly across China, with pronounced intensification in Southwest China and the Tibetan Plateau. (3) The more extreme the precipitation events, the greater the projected increase in the probability ratio (PR). It should be noted that the magnitude of the PR increase under RCP4.5 is significantly larger with respect to RCP8.5. These findings enhance the understanding of climate change and provide detailed regional-scale information to support adaptive policy-making.

1. Introduction

Precipitation fundamentally governs water resource distribution [1,2,3]. The IPCC Fifth Assessment Report (AR5) indicates that climate warming has intensified the frequency of extreme precipitation events over recent decades [4,5]. The changes in precipitation and extreme precipitation events will directly affect the hydrological cycle and agriculture as well as water resources management. Due to the tremendous influence of extreme precipitation events on society and ecosystems, variations in precipitation and extreme precipitation events under a warming climate have received much attention in recent years both globally and regionally [6,7,8,9,10,11]. Therefore, it is of great importance to understand the changing patterns of precipitation, especially of extreme precipitation events, which are not only useful for further understanding climate change but also for floods and droughts control and effective water management.
Due to its location in the East Asian monsoon climate zone and complex terrain, the climate change effects across China are more complex. China’s vast population and climatic diversity amplify its vulnerability to climate change [12]. The national mean annual temperature has risen by 1.2 °C since 1960. Accompanied by rapid temperature warming, more extreme precipitation events have been observed in recent decades [13]. For example, the extreme precipitation on 23 July 2013 in Beijing and 6 July 2016 in Wuhan, characterized by severe urban floods, resulted in enormous economic losses and serious casualties. Given the profound impacts of climate warming, projecting future changes in precipitation and extreme precipitation events across China is essential for assessing climate risks and informing adaptation strategies at both national and regional scales.
Global Climate Models (GCMs) serve as key instruments for analyzing past climate variations and forecasting future conditions. Significant advancements have been achieved in these models, notably the CMIP5 ensemble [14], which now features higher resolutions and more realistic physical processes. Despite these improvements, limitations in physical parameterization schemes continue to introduce substantial uncertainties in climate simulations. The Multi-Modal Ensemble (MME) method has gained widespread adoption in future climate projections [15,16,17,18,19,20], as it effectively mitigates these uncertainties while improving forecast accuracy. Numerous studies have focused on predicting extreme weather phenomena across China during various 21st-century timeframes, with particular attention given to heavy rainfall occurrences under diverse emission scenarios [21,22,23,24,25,26,27].
However, the previous studies using GCM projections with coarse resolution (e.g., 0.5~2° spatial resolution) are obviously not sufficient for practical regional applications such as water resources management and disaster prevention and mitigation. The NEX Global Daily Downscaled Climate Projections in NASA Earth Exchange (NASA-NEX) platform publicized the downscaled global CMIP5 simulations at a higher resolution of 0.25° (~25 km × 25 km) [14]. This dataset would help the scientific community to form a verifiable and systematic understanding of the impact climate change at global and regional scales by eliminating the difference in higher resolution regional climate projections, which is often caused by diverse observation datasets from multi-source and downscale methods.
Many studies have assessed the CMIP5 model as well as MME simulations globally and regionally and indicate that the present climatology and climate variability as well as the trend and spatial distributions of precipitation extreme indices can be reproduced well by CMIP5 models [23,24,25,28,29,30,31]. Motivated by the pressing need for regional extreme precipitation change projection and the availability of the high-resolution NASA-NEX datasets (0.25° × 0.25°), this study provides a comprehensive assessment of future precipitation and extreme precipitation indices over China under RCP4.5 and RCP8.5. By revealing the spatiotemporal asymmetry in precipitation changes—such as the contrasting trends between seasons and across sub-regions—this study underscores the importance of region-specific climate adaptation strategies. Understanding this asymmetric response is critical for informing tailored policies in water-sensitive sectors, particularly in vulnerable areas like the Tibetan Plateau and southern China, where the intensity and frequency of extreme events are projected to diverge markedly. The novelty lies in the combined use of multiple extreme indices, the Generalized Extreme Value (GEV) model for probability ratio analysis, and the high spatial resolution. This approach enables the detection of detailed regional patterns that are often masked in coarse-resolution studies. The findings offer crucial insights for climate risk assessment and provide high-resolution spatial information to support the formulation of effective, region-specific climate adaptation and mitigation policies.

2. Materials and Methods

2.1. Study Area

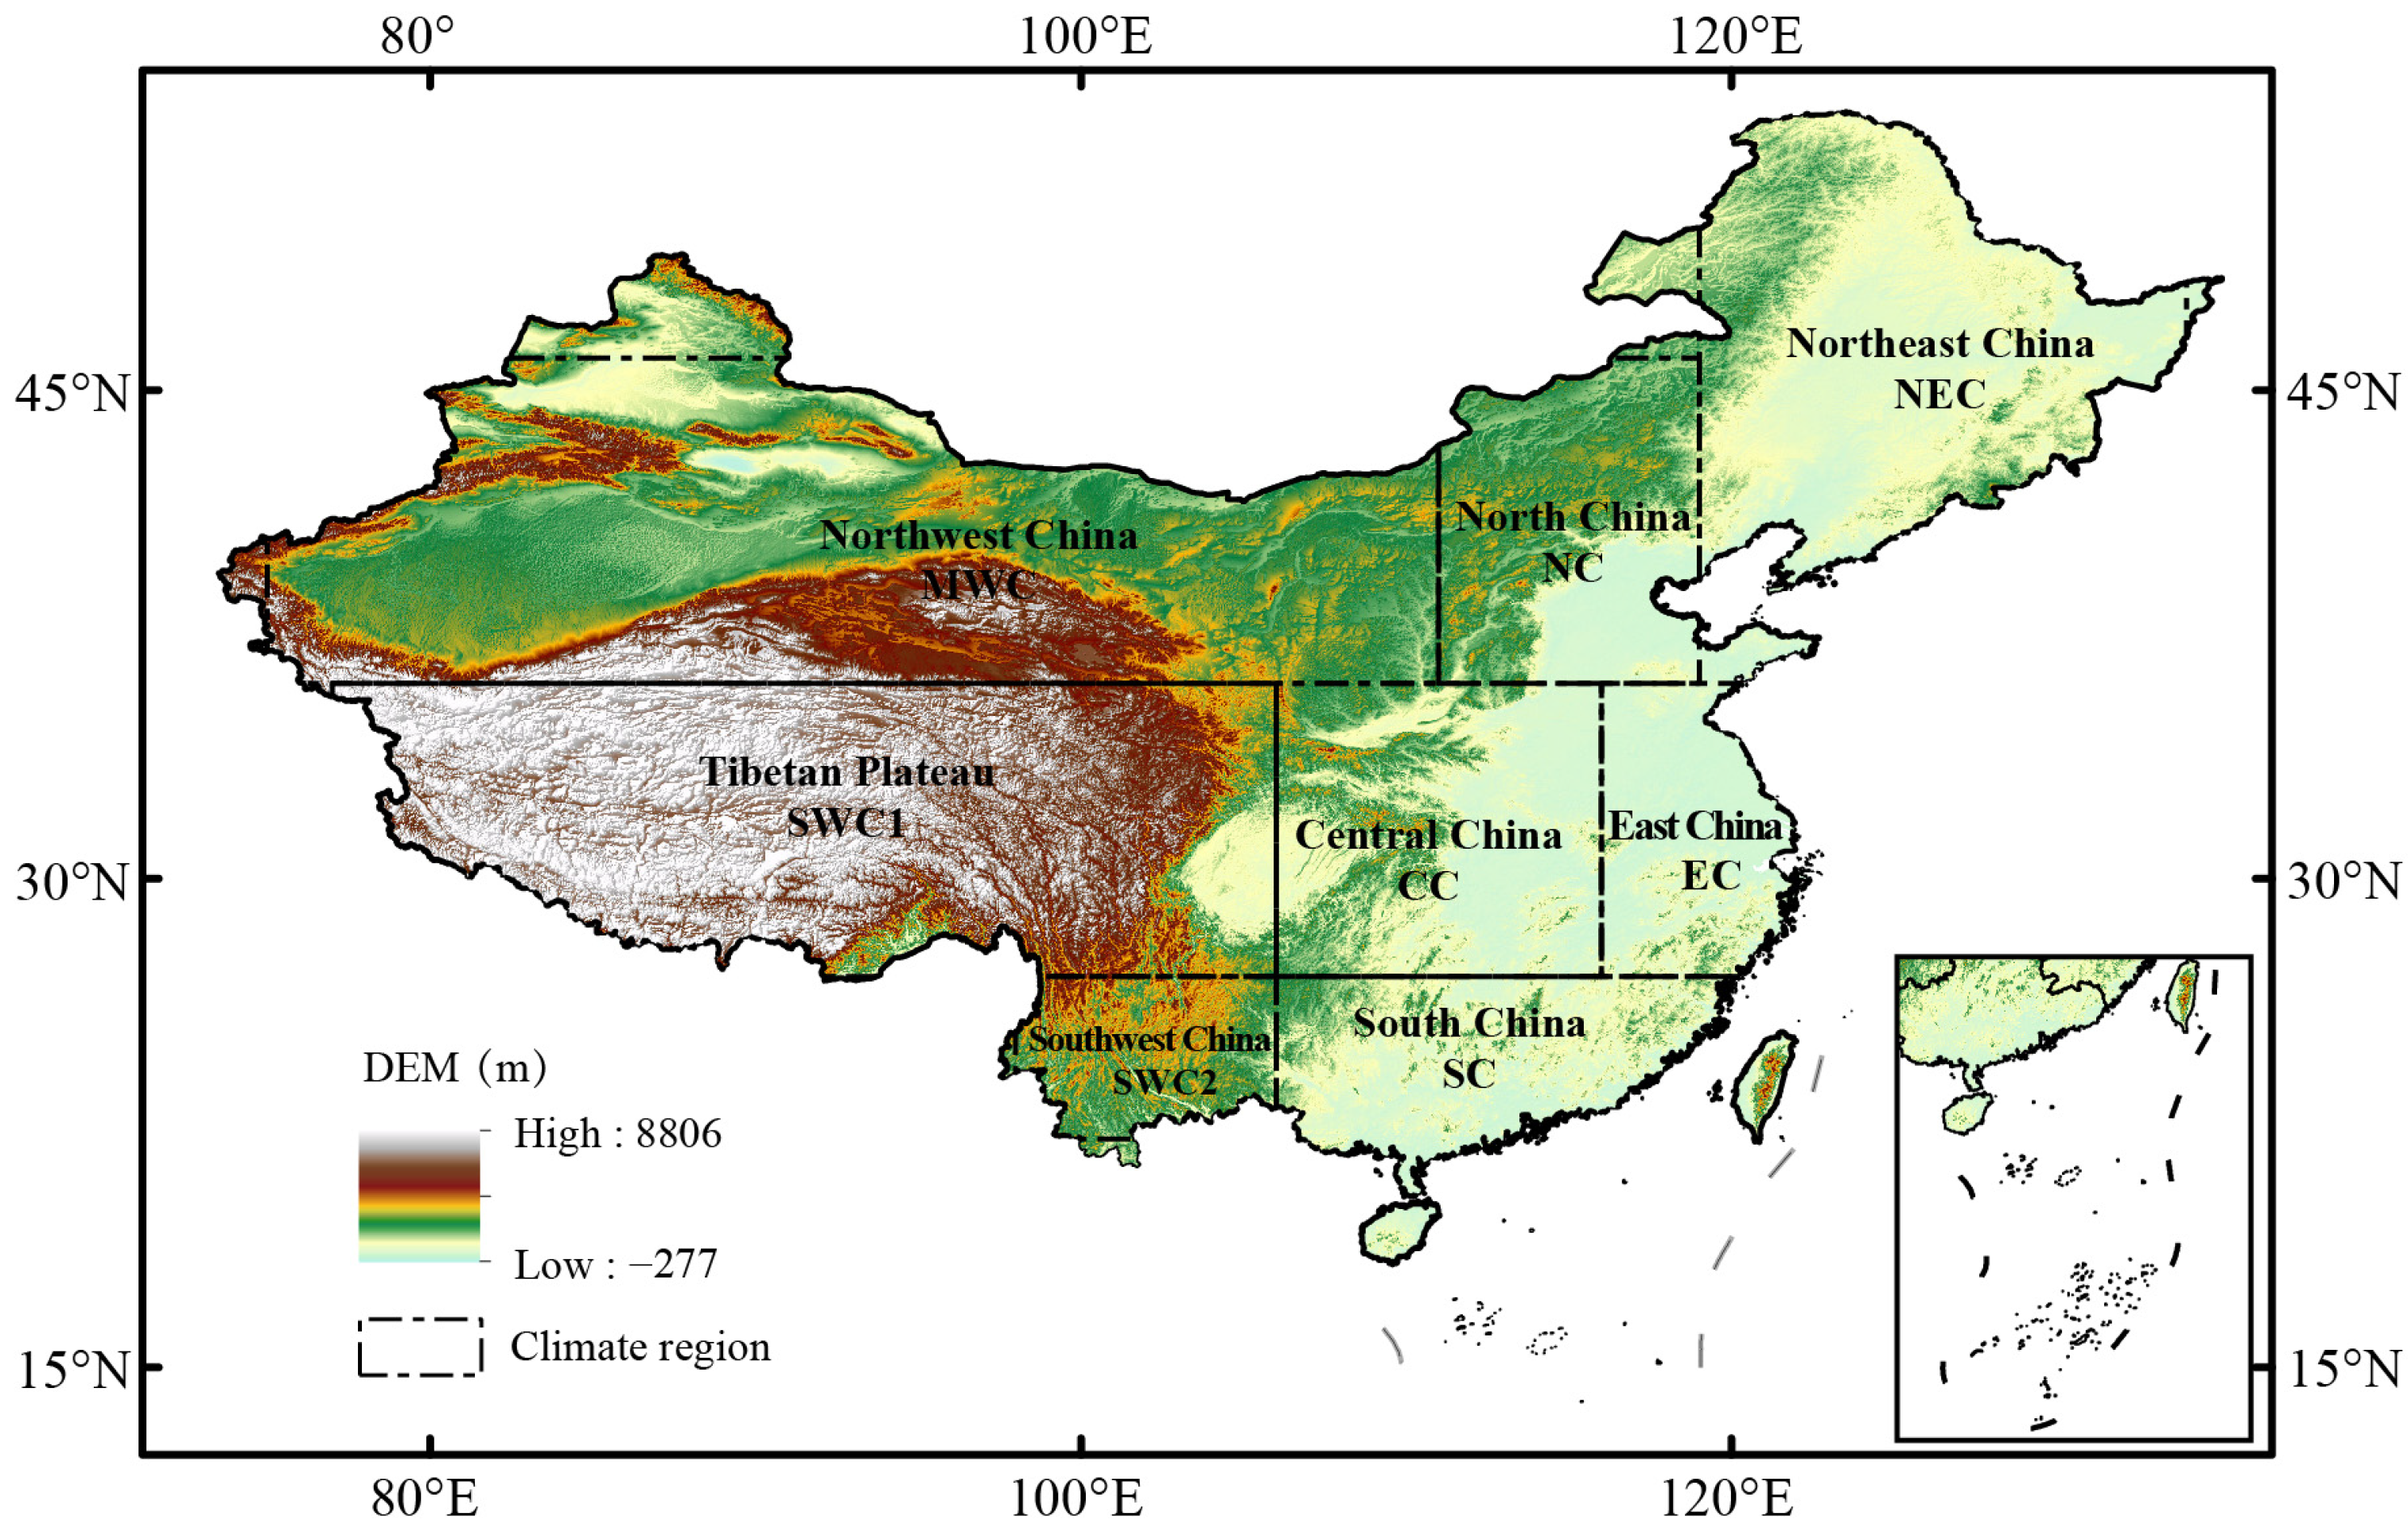
To comprehensively examine the spatial and temporal variations in precipitation across China from a zonal perspective, the study area was divided into eight sub-regions (Figure 1). The division was performed based on the topographical features and climatic characteristics of China, following the criteria outlined in the National Assessment Report of Climate Change [32].

2.2. Data

The NEX-GDDP initiative provides climate projections with global coverage, derived from CMIP5 model outputs at a 0.25° spatial resolution (roughly 25 km × 25 km) [33]. This dataset incorporates 21 GCMs for two emission scenarios (RCP4.5 and RCP8.5). Climate downscaling is performed using the Bias Correction Spatial Disaggregation (BCSD) approach [34], a widely recognized method in climate studies [35,36]. The BCSD process utilizes observational data from Princeton University’s Global Meteorological Forcing Dataset (GMFD) for Land Surface Modeling [37] Compared to raw CMIP5 GCM outputs, this statistically refined dataset demonstrates superior accuracy and reliability in climate projections [38,39,40].
For the present study, ten representative GCMs were selected from the full set of 21. The selection was guided by the native spatial resolution of the original CMIP5 models; only those with relatively high native resolution were selected to ensure that the downscaled results at 25 km benefit from finer-scale initial information. These ten models have been extensively utilized in prior climate change investigations. Their affiliated institutions, countries, and original resolutions are listed in Table 1. In the subsequent analysis, MME results are derived by averaging the outputs of these ten models with equal weight under both RCP4.5 and RCP8.5.

2.3. Extreme Precipitation Indices

In this study, a series of climate change indicators developed by the Expert Team on Climate Change Detection and Indices (ETCCDI) [41,42,43] were utilized to characterize extreme precipitation phenomena. These metrics have found extensive application in analyzing and forecasting variations in extreme weather patterns at both global and regional scales [25,26,28,44,45]. For conciseness, seven key precipitation-related extreme climate indices from the ETCCDI’s recommendations (http://etccdi.pacificclimate.org/list_27_indices.shtml (accessed on 1 May 2023)) and Firch et al. (2002) [41] were chosen. Details about these indices can be found in Table 2.

2.4. Mann–Kendall Test with Sen’s Estimator

The Mann–Kendall (MK) test, a nonparametric approach utilizing Kendall’s τ statistic, has been widely used in recent years to evaluate trends in hydro-meteorological data such as rainfall, temperature, and river discharge [46,47,48,49,50]. Recognized by the World Meteorological Organization (WMO), this method is a standard tool for analyzing trends in environmental datasets.
Based on Mann’s (1945) framework [51,52], the MK test calculates the statistic Z_mk, where positive and negative results indicate upward and downward trends, respectively. Statistical significance is determined at a chosen level α, with the null hypothesis (absence of trend) being rejected when Z m k exceeds Z 1 α / 2 , a value obtained from the standard normal distribution. For this analysis, α was set at 0.05, requiring Z m k > 1.96 for significance.
To quantify the rate of change, Sen’s slope estimator [53] was employed alongside the MK test, providing a robust, non-parametric measure of trend magnitude.

2.5. Probability Ratio of Extreme Precipitation Events

Extreme precipitation magnitudes are commonly characterized by return values derived from annual daily precipitation maxima [7,24,54]. The probability ratio (PR) is employed to quantify changes in the likelihood of extreme events, defined as PR = P 1 / P 0 , where P 0 and P 1 represent the occurrence probabilities of a given extreme event during the reference and future periods, respectively [45,55]. A PR greater than 1 indicates an increased probability of the reference-period extreme event occurring in the future, while a PR below 1 signifies a decrease. To derive the PR, we first estimated extreme daily precipitation amounts for seven return periods (20, 50, 100, 200, 500, 1000 and 2000 years) over the reference period (1961–1990) and two future 30-year windows: early century (2010–2040) and late century (2070–2100). These estimates were obtained by fitting the Generalized Extreme Value (GEV) distribution to annual maxima from both MMEs and individual CMIP5 simulations [56,57]. The GEV distribution is theoretically advantageous for extreme value analysis because it unifies the three types of extreme value distributions (Gumbel, Fréchet and Weibull) within a single flexible framework, allowing it to adapt to various tail behaviors exhibited by extreme precipitation data. This flexibility makes the GEV particularly suitable for accurately estimating long-return-period extremes, as required in this study. The Kolmogorov–Smirnov (K–S) test was applied to assess the goodness-of-fit of the GEV distribution [24,58]. The PR values for each return period were then derived as the ratio of future occurrence probability to that of the reference period [45].

3. Results and Discussion

3.1. Spatiotemporal Evolution of Precipitation

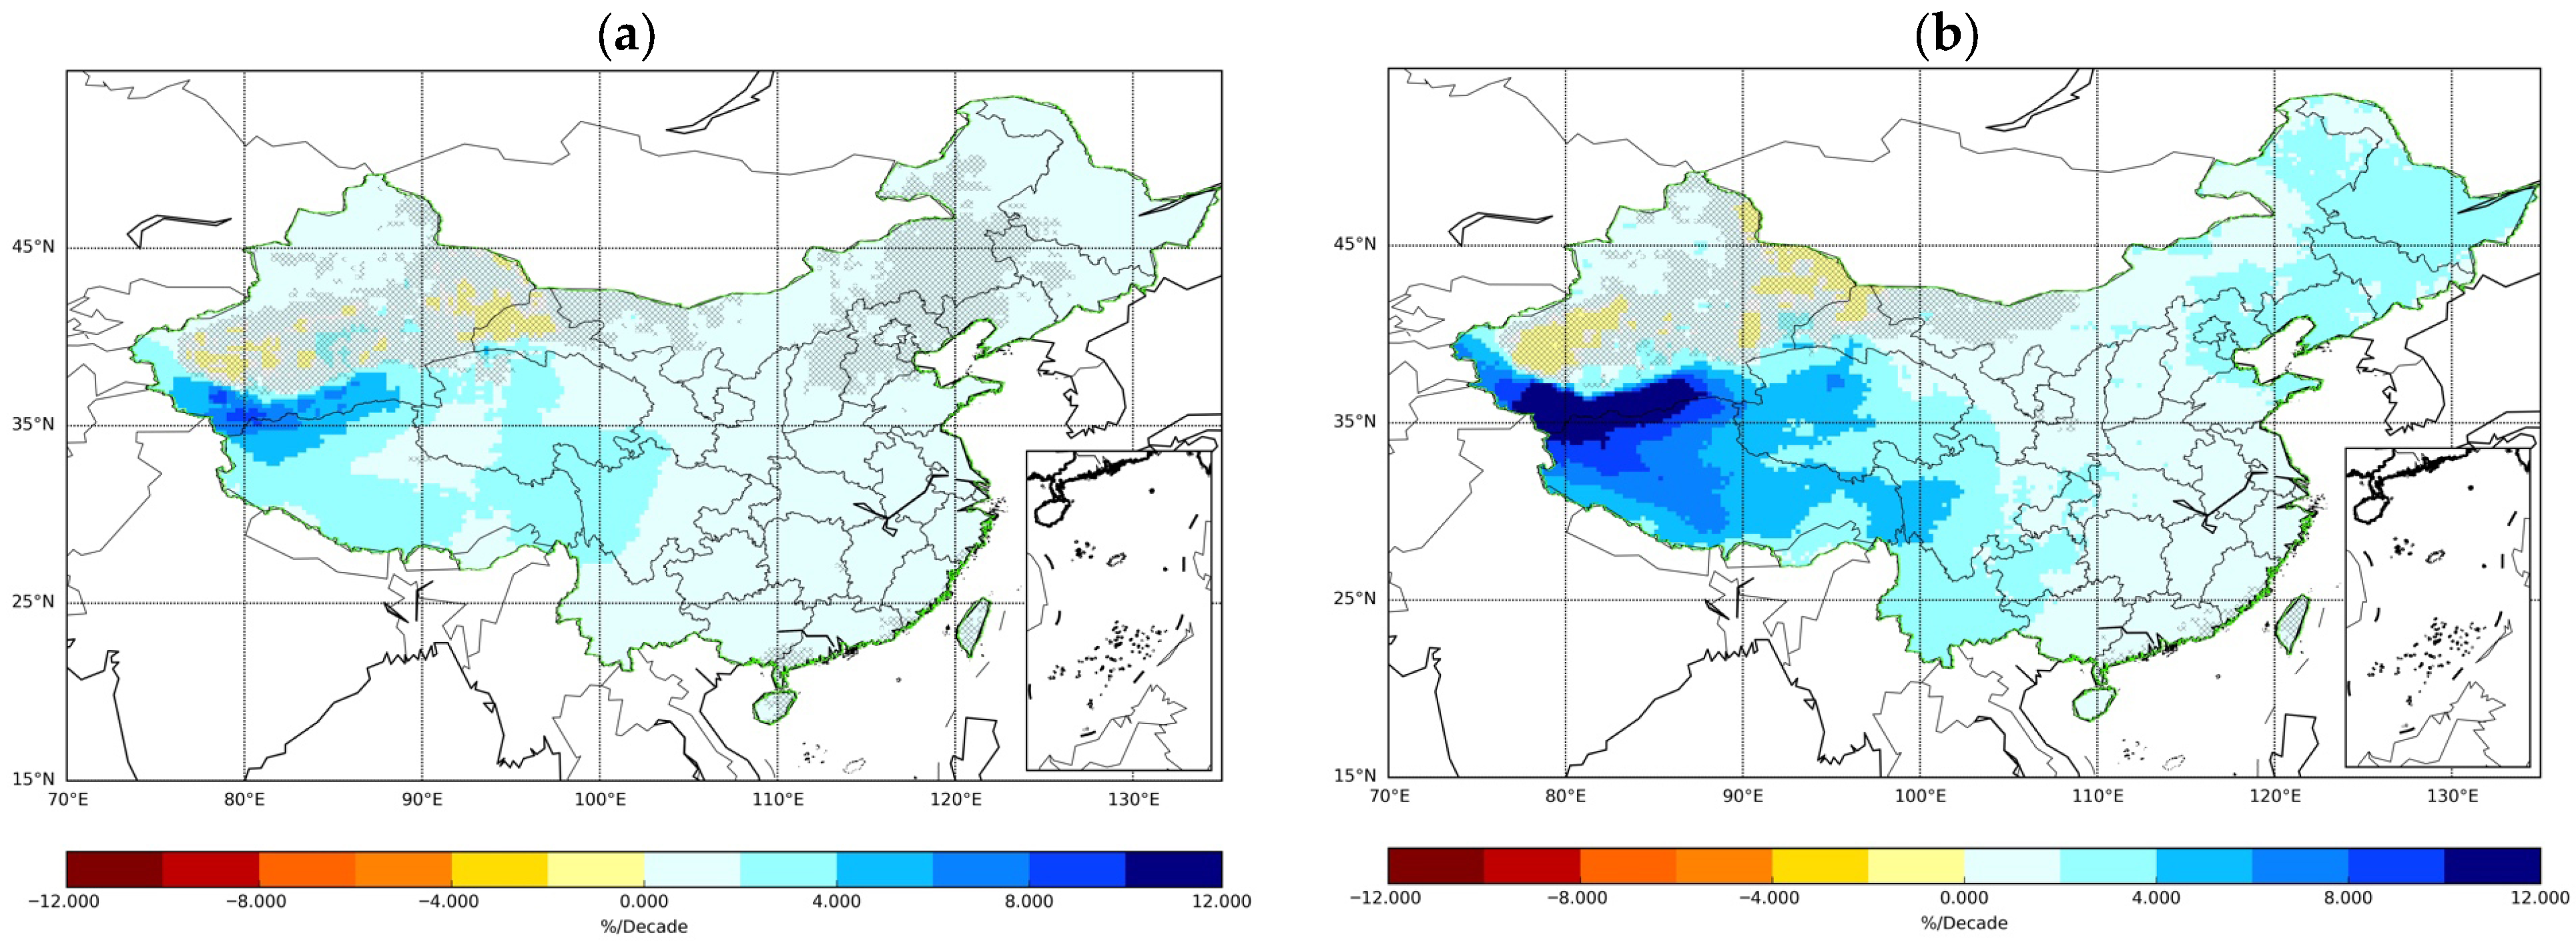
As shown in Figure 2, the annual precipitation is projected to increase over most regions of China (except parts of northern China) with greater increase rates under RCP8.5. For the whole of China, the annual precipitation will significantly increase at a rate of 1.4%/decade and 2.9%/decade, respectively. In addition, two scenarios shared a similar increase pattern, with the largest increase being in the Tibetan Plateau (across the Karakoram Mountain area) with a rate of 9%/decade and 16%/decade, respectively. Large variations exist for both scenarios at the pixel scale, with a range of 1.5%/decade to ~15%/decade. However, the increasing trend is more notable for RCP8.5. For example, much larger increases are found in the Tibetan Plateau, Southwest China, North China and Northeast China under RCP8.5. Moreover, unlike the statistically insignificant trends under RCP4.5, northeastern and northern China are expected to see marked increases of 3.5%/decade under RCP8.5. Notably, annual precipitation in Northwest China shows no statistically significant trend at the pixel scale under either scenario, except in northern Xinjiang Province.
On a regional scale, except for North China which is expected to insignificantly increase by 0.83%/decade under RCP4.5, all other regions will significantly increase under the two scenarios. As shown in Table 3, the largest precipitation increase will happen in the Tibetan Plateau with 2.55%/decade under RCP4.5 and 5.02%/decade under RCP8.5. In addition, different from other regions which show a noticeable increase in the magnitude of the precipitation changes under RCP8.5, there is no notable difference for the precipitation change rate in southern China (including EC, SC and CC) between RCP4.5 and RCP8.5.
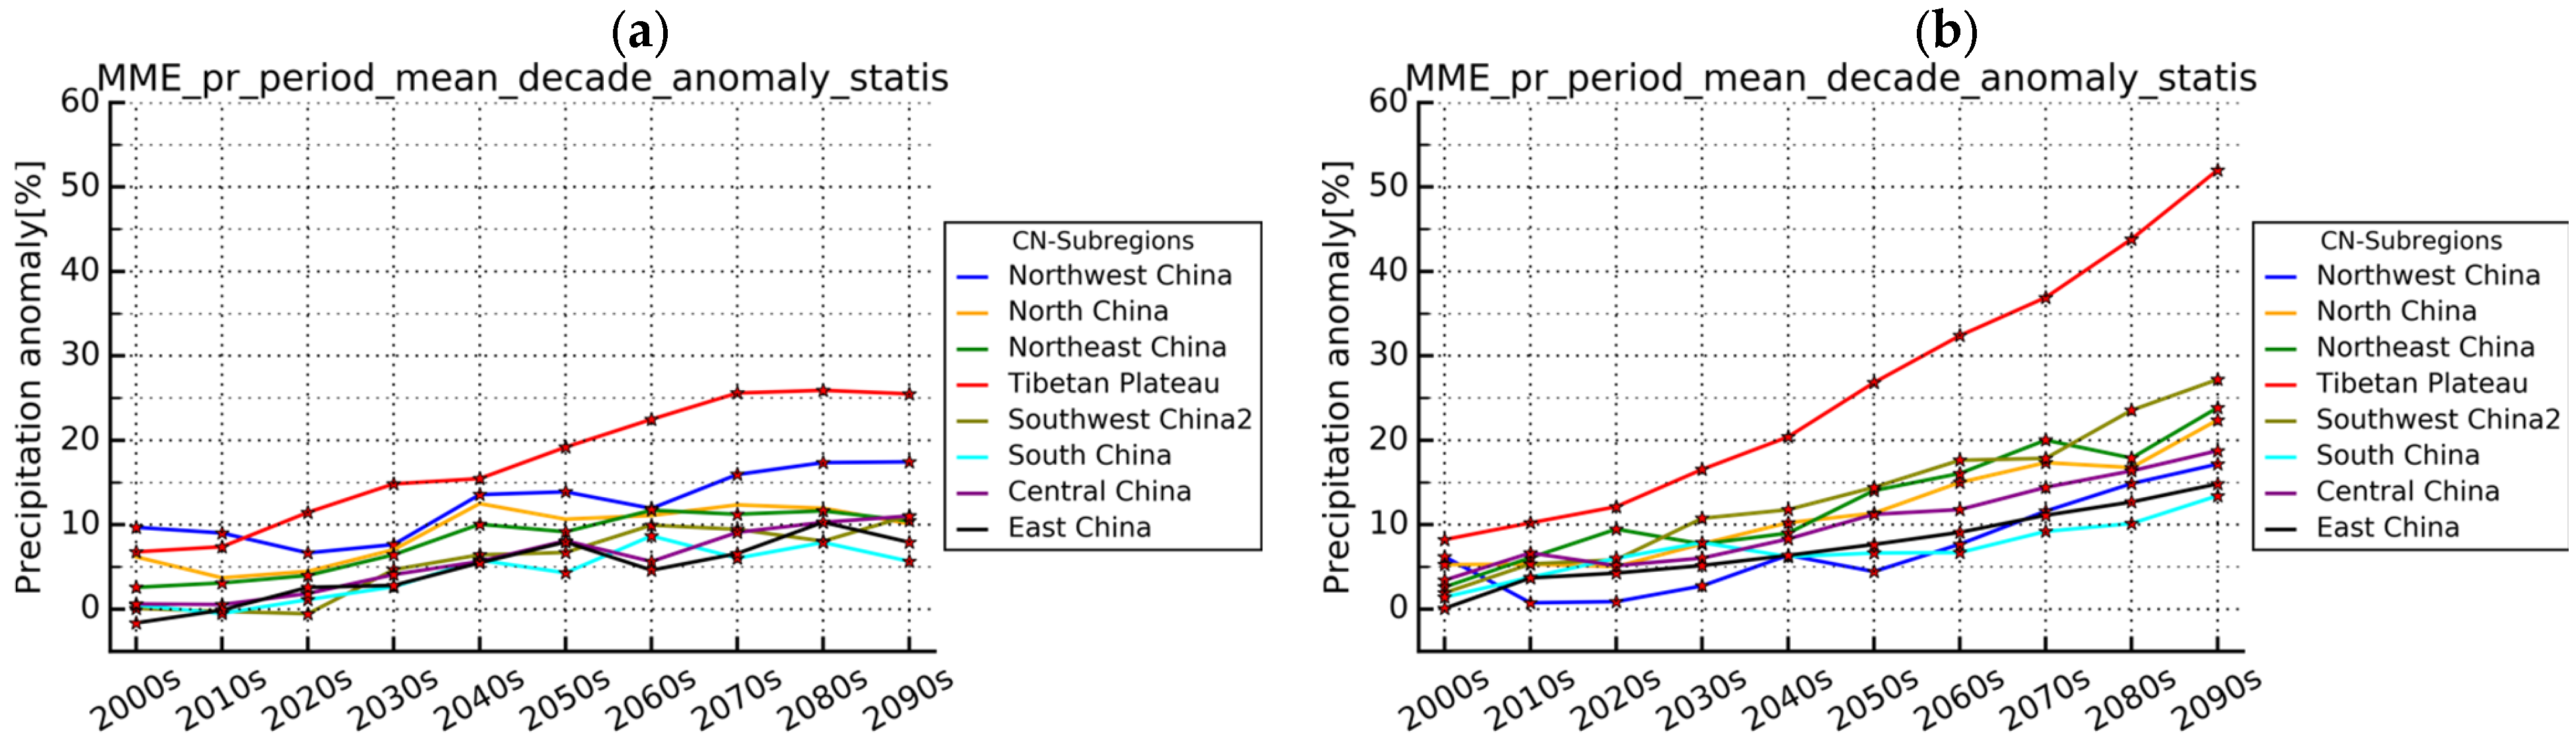
Figure 3 presents the temporal evolution of annual precipitation anomalies over eight climate regions. Like Figure 2, the value in Figure 3 is also expressed as a percentage relative to the average annual precipitation during the reference period of 1961–1990. On the regional scale, the annual precipitation is projected to exhibit a significant increasing trend over all the sub-regions (except for North China under RCP4.5) under the two scenarios, with the largest increase in the Tibetan Plateau (2.55 and 5.04%/decade), which is consistent with Table 3.
The results in Figure 2 and Figure 3 show that the change in precipitation is closely related to the warming scenario. In addition, as presented in Figure 3, although all the sub-regions are projected to experience an increasing trend in the 21st century, the order of increases varies with time under both scenarios, implying that there will be significant variations in the spatial pattern of annual precipitation anomalies in the 21st century. For example, from a zonal perspective, the increasing amplitude of annual precipitation is projected to be 25% in the Tibetan Plateau, followed by Northwest China with 18% and the smallest increase is projected to appear in South China with only 5% at the end of 21st century under RCP 4.5. However, under RCP8.5, the increase in annual precipitation in the Tibetan Plateau reaches up to 53% and Southwest China ranks second to the Tibetan Plateau with an amplitude of around 28%. Northwest China exhibits a moderate increase relative to other regions under RCP8.5.
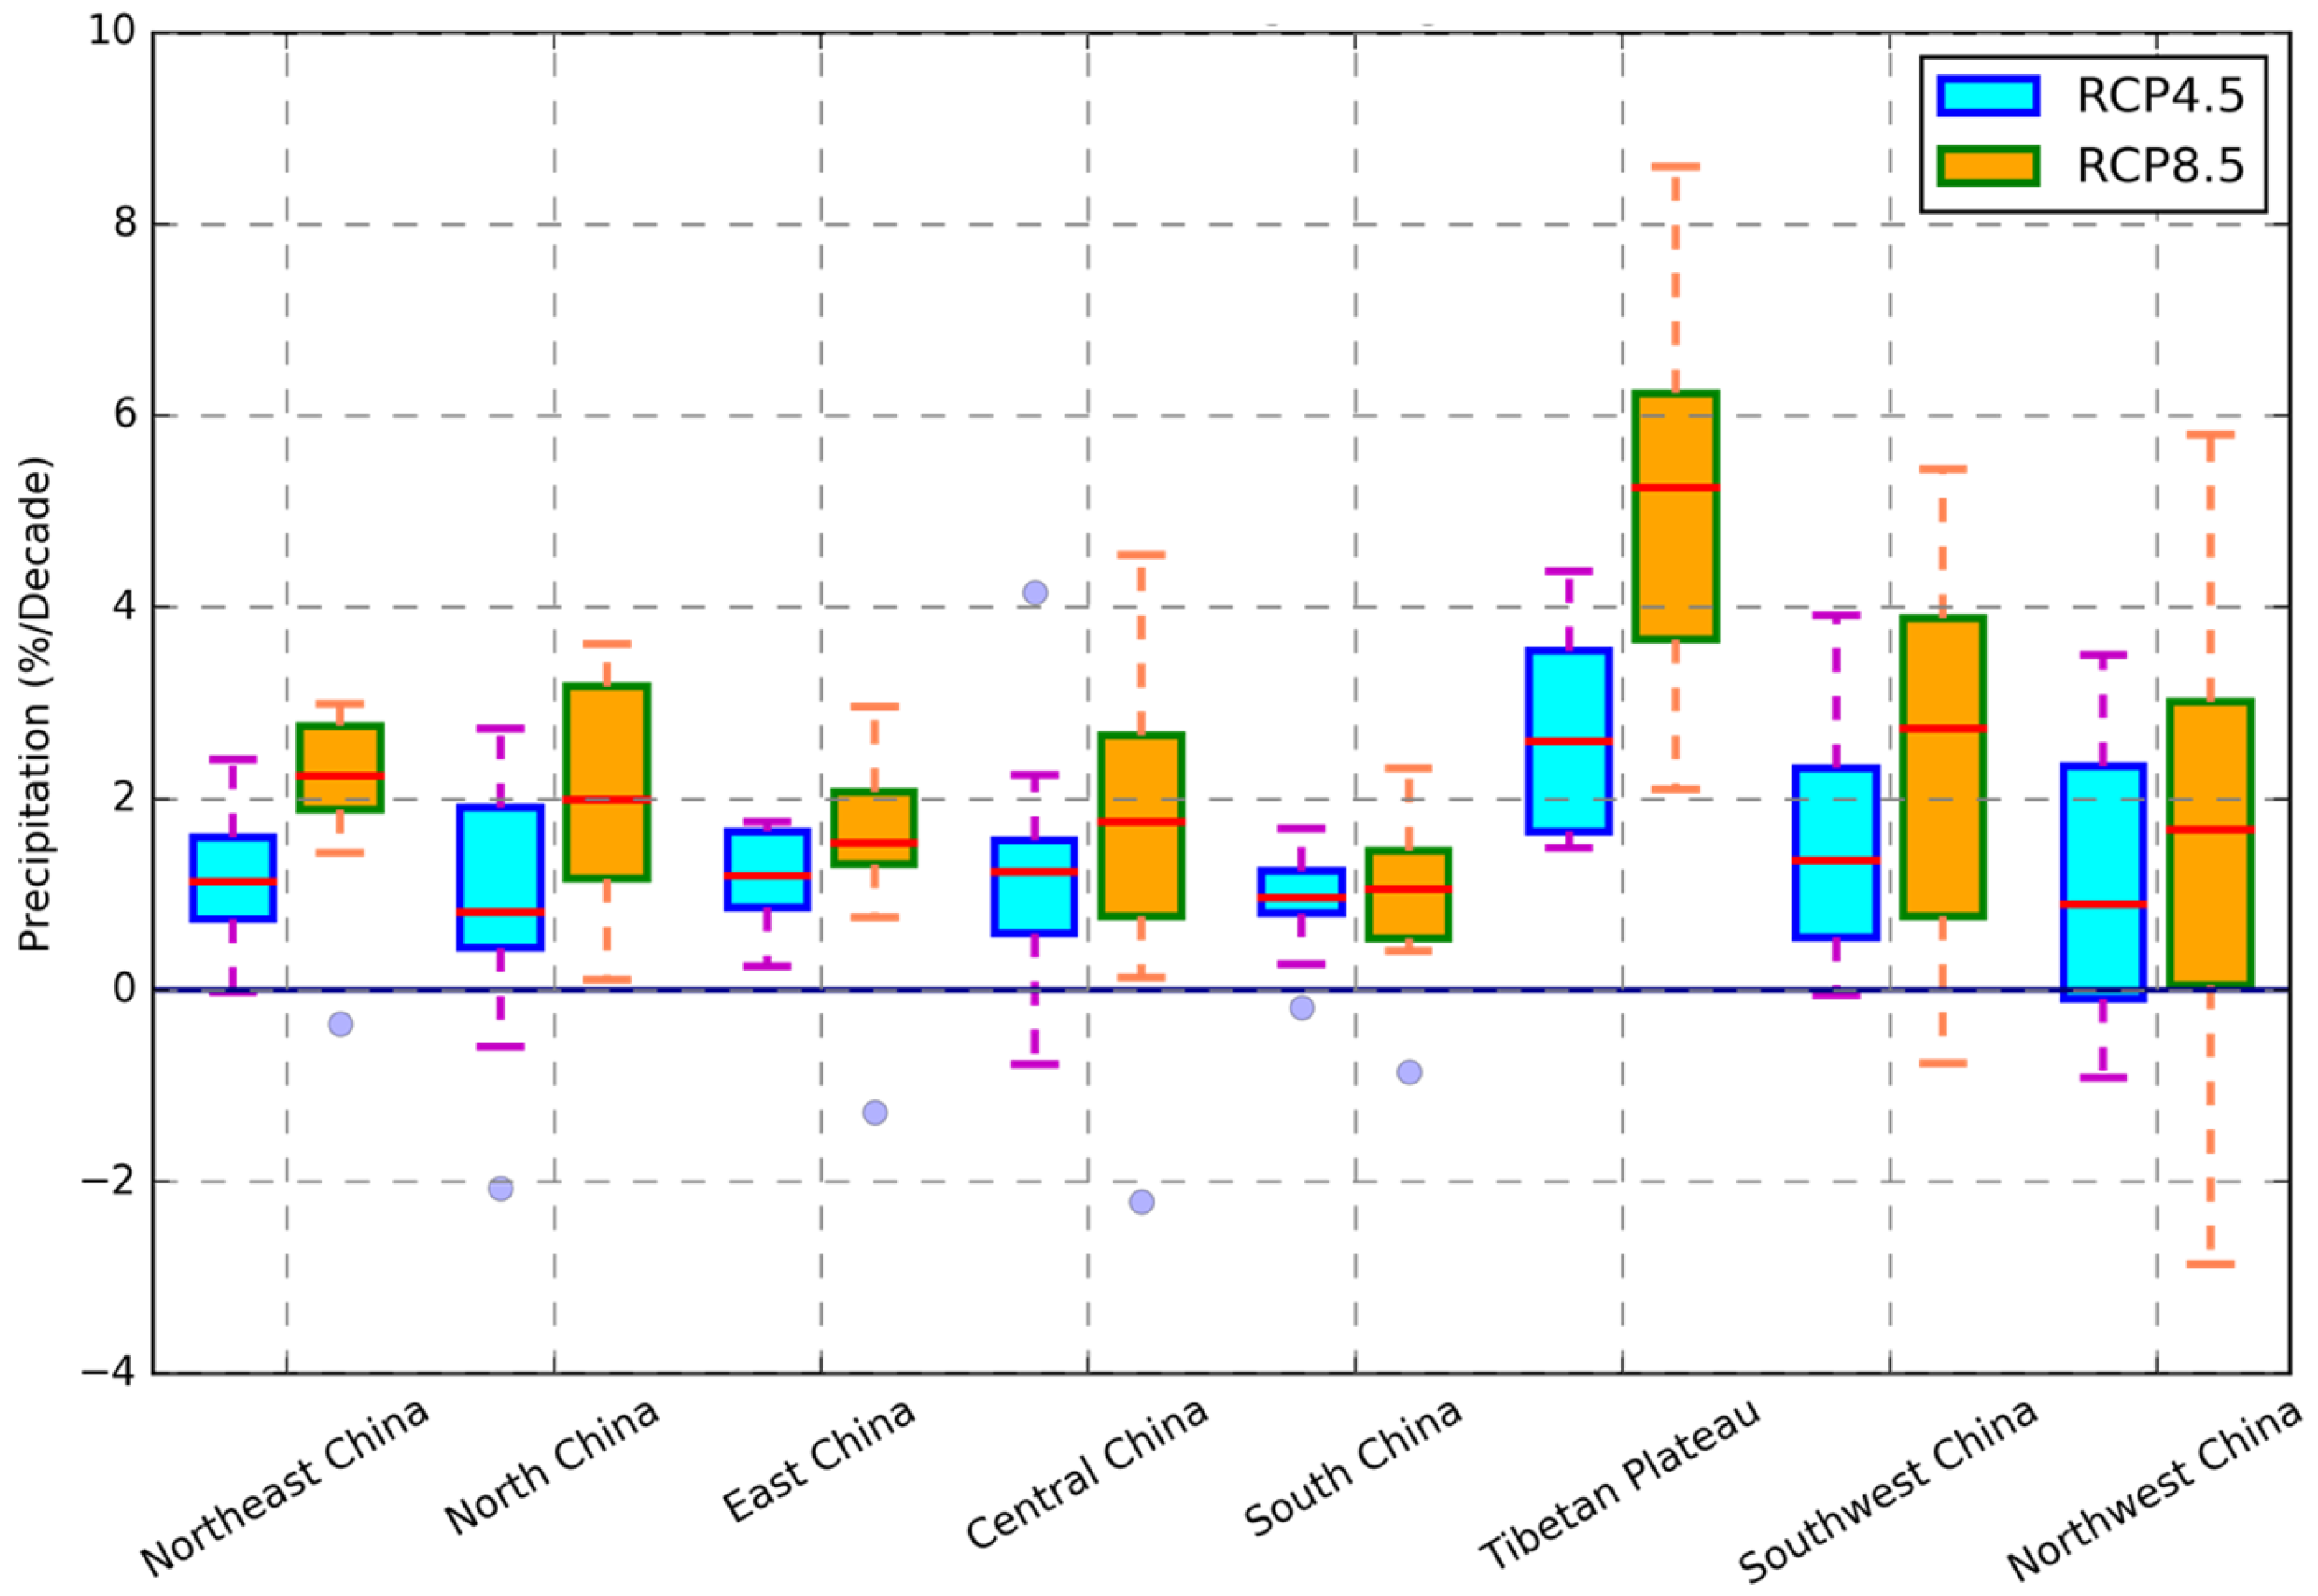
Figure 4 illustrates the inter-model spread of projected precipitation change rates (%/decade) across sub-regions. The boxes represent the interquartile range (25th–75th percentiles), with MME values denoted by horizontal red lines. The relatively narrow box ranges (0.7–3.1) under both RCP4.5 and RCP8.5 suggest robust agreement among the ten CMIP5 models regarding regional precipitation increases. All the MME projections across the eight regions fall within the boxes (25–75%) under the two scenarios, which means that the analysis based on the MME result could better represent the ten CMIP5 model projection results.
In general, projections under RCP8.5 are associated with larger inter-model spread compared with those under RCP4.5. It should be noted that Northeast China, East China and South China are the regions with relatively narrow model spread under the two scenarios in comparison with other regions, which means that the ten CMIP5 model projections are more consistent over these regions.
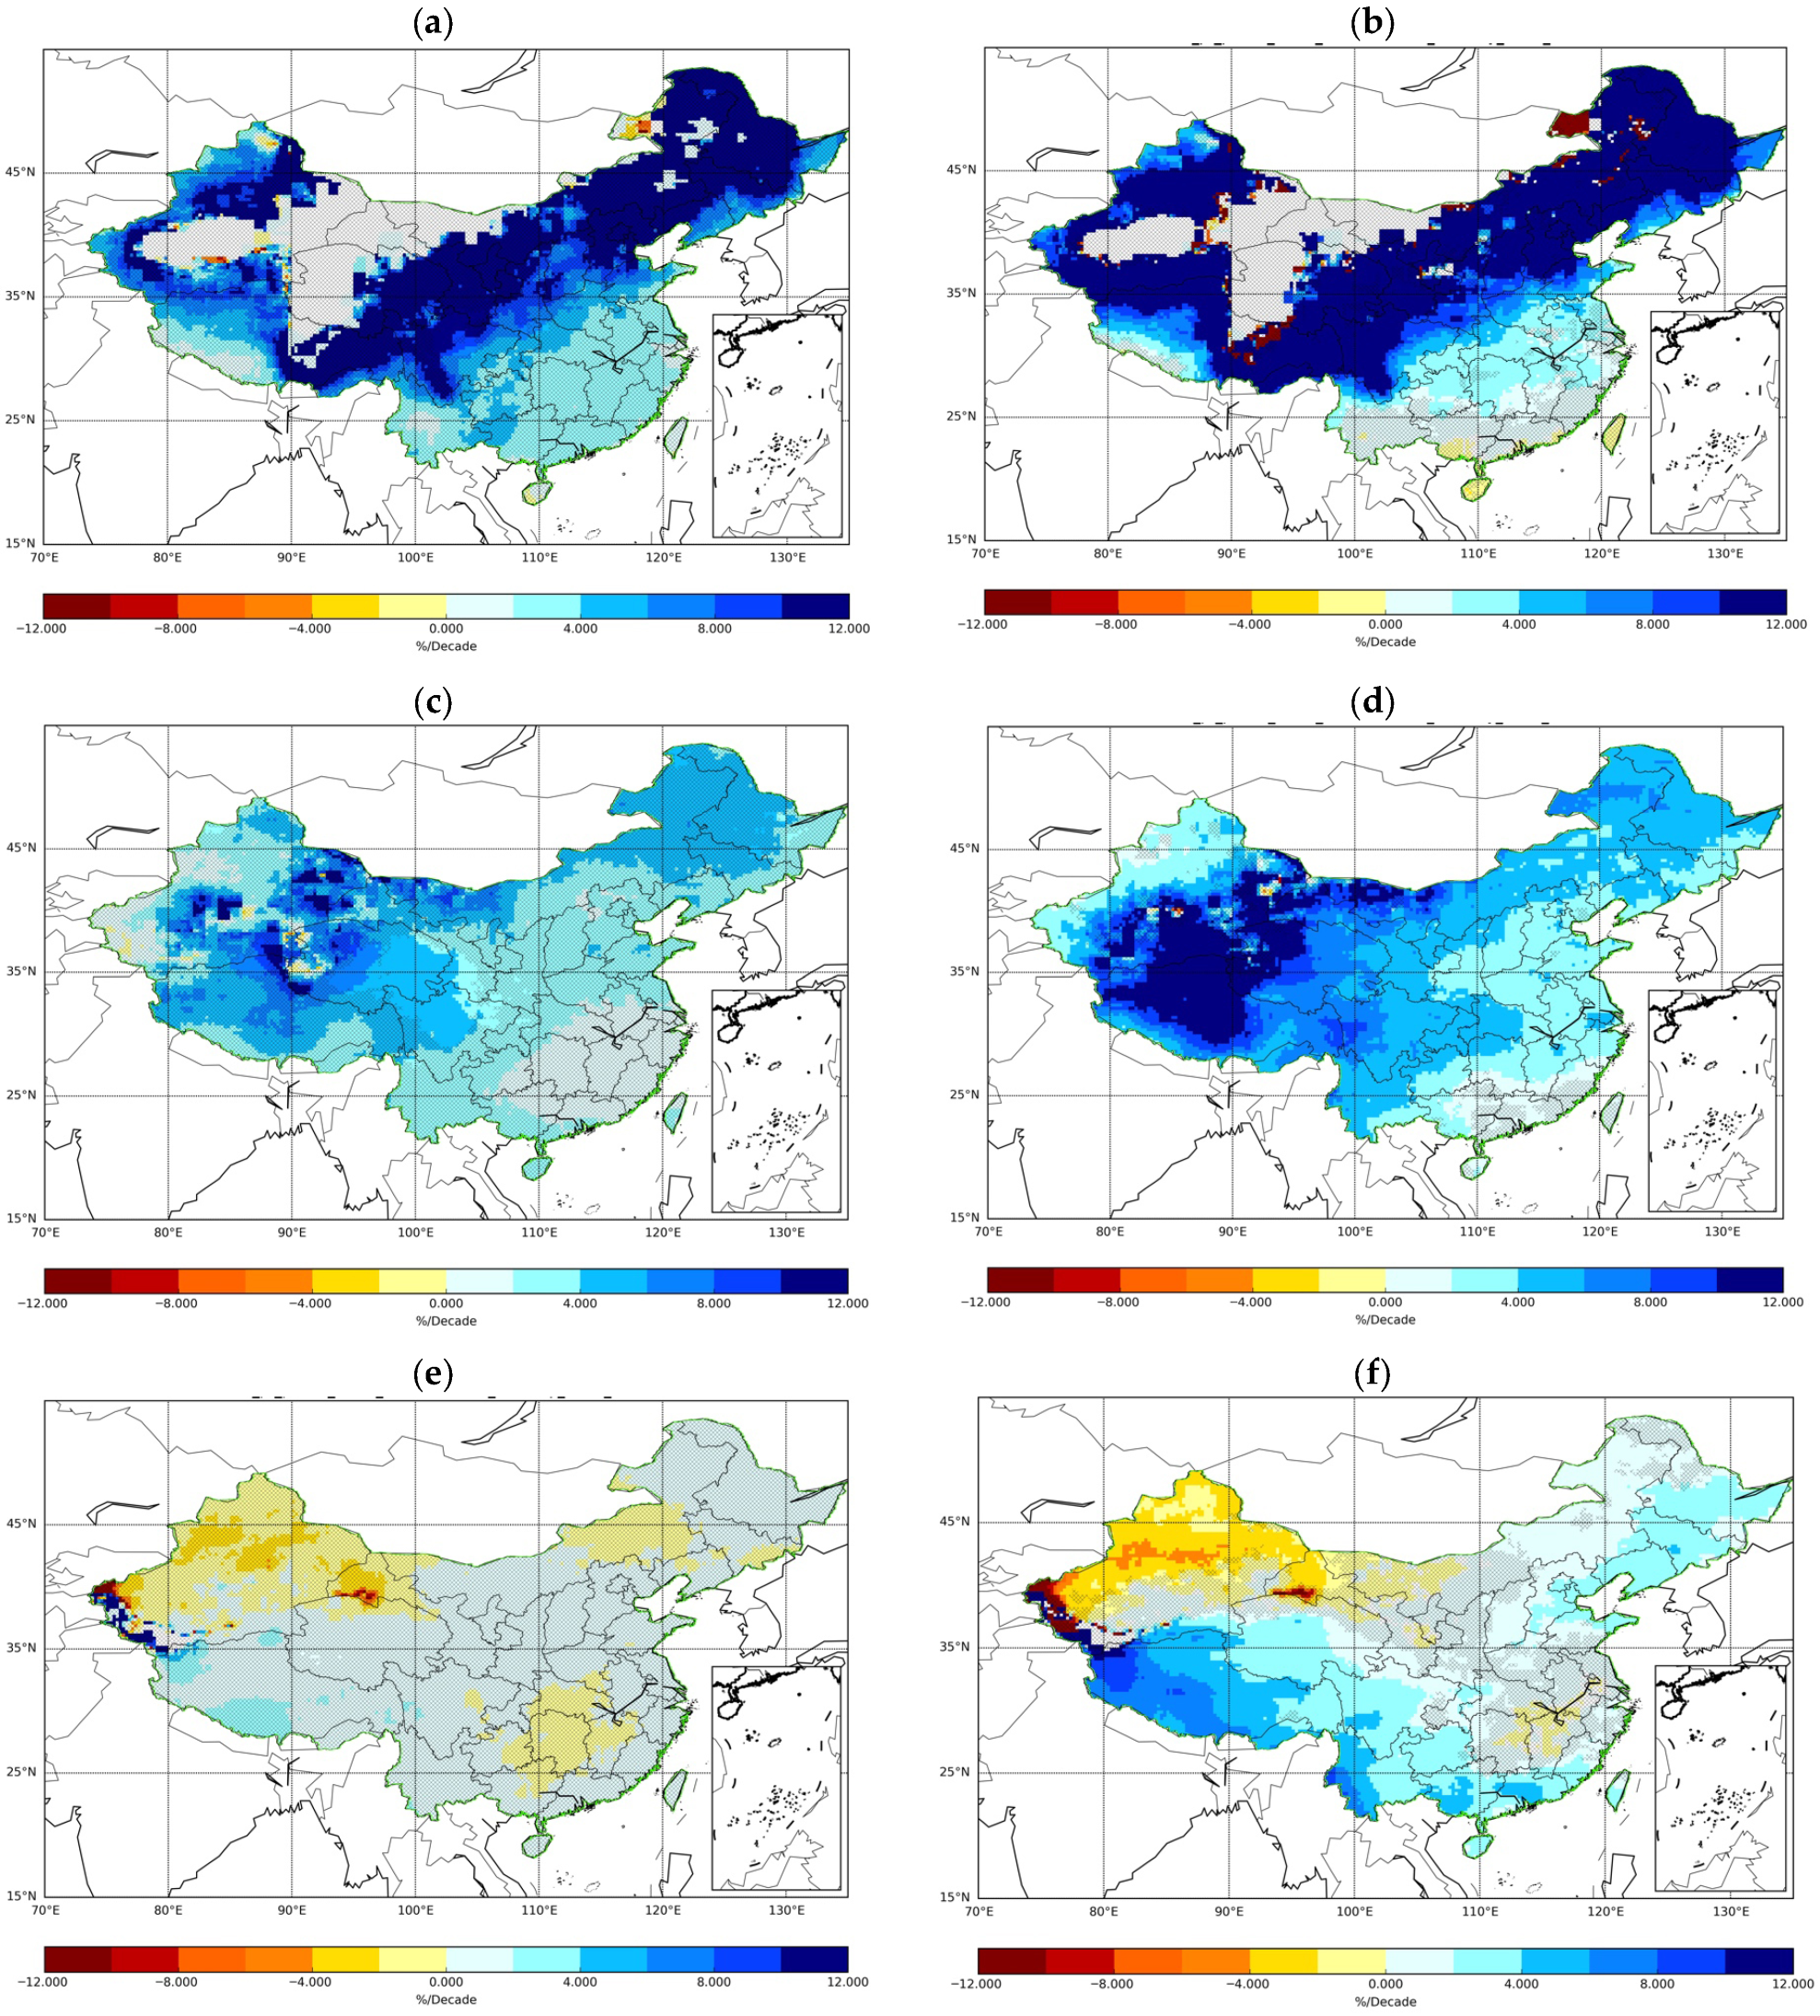
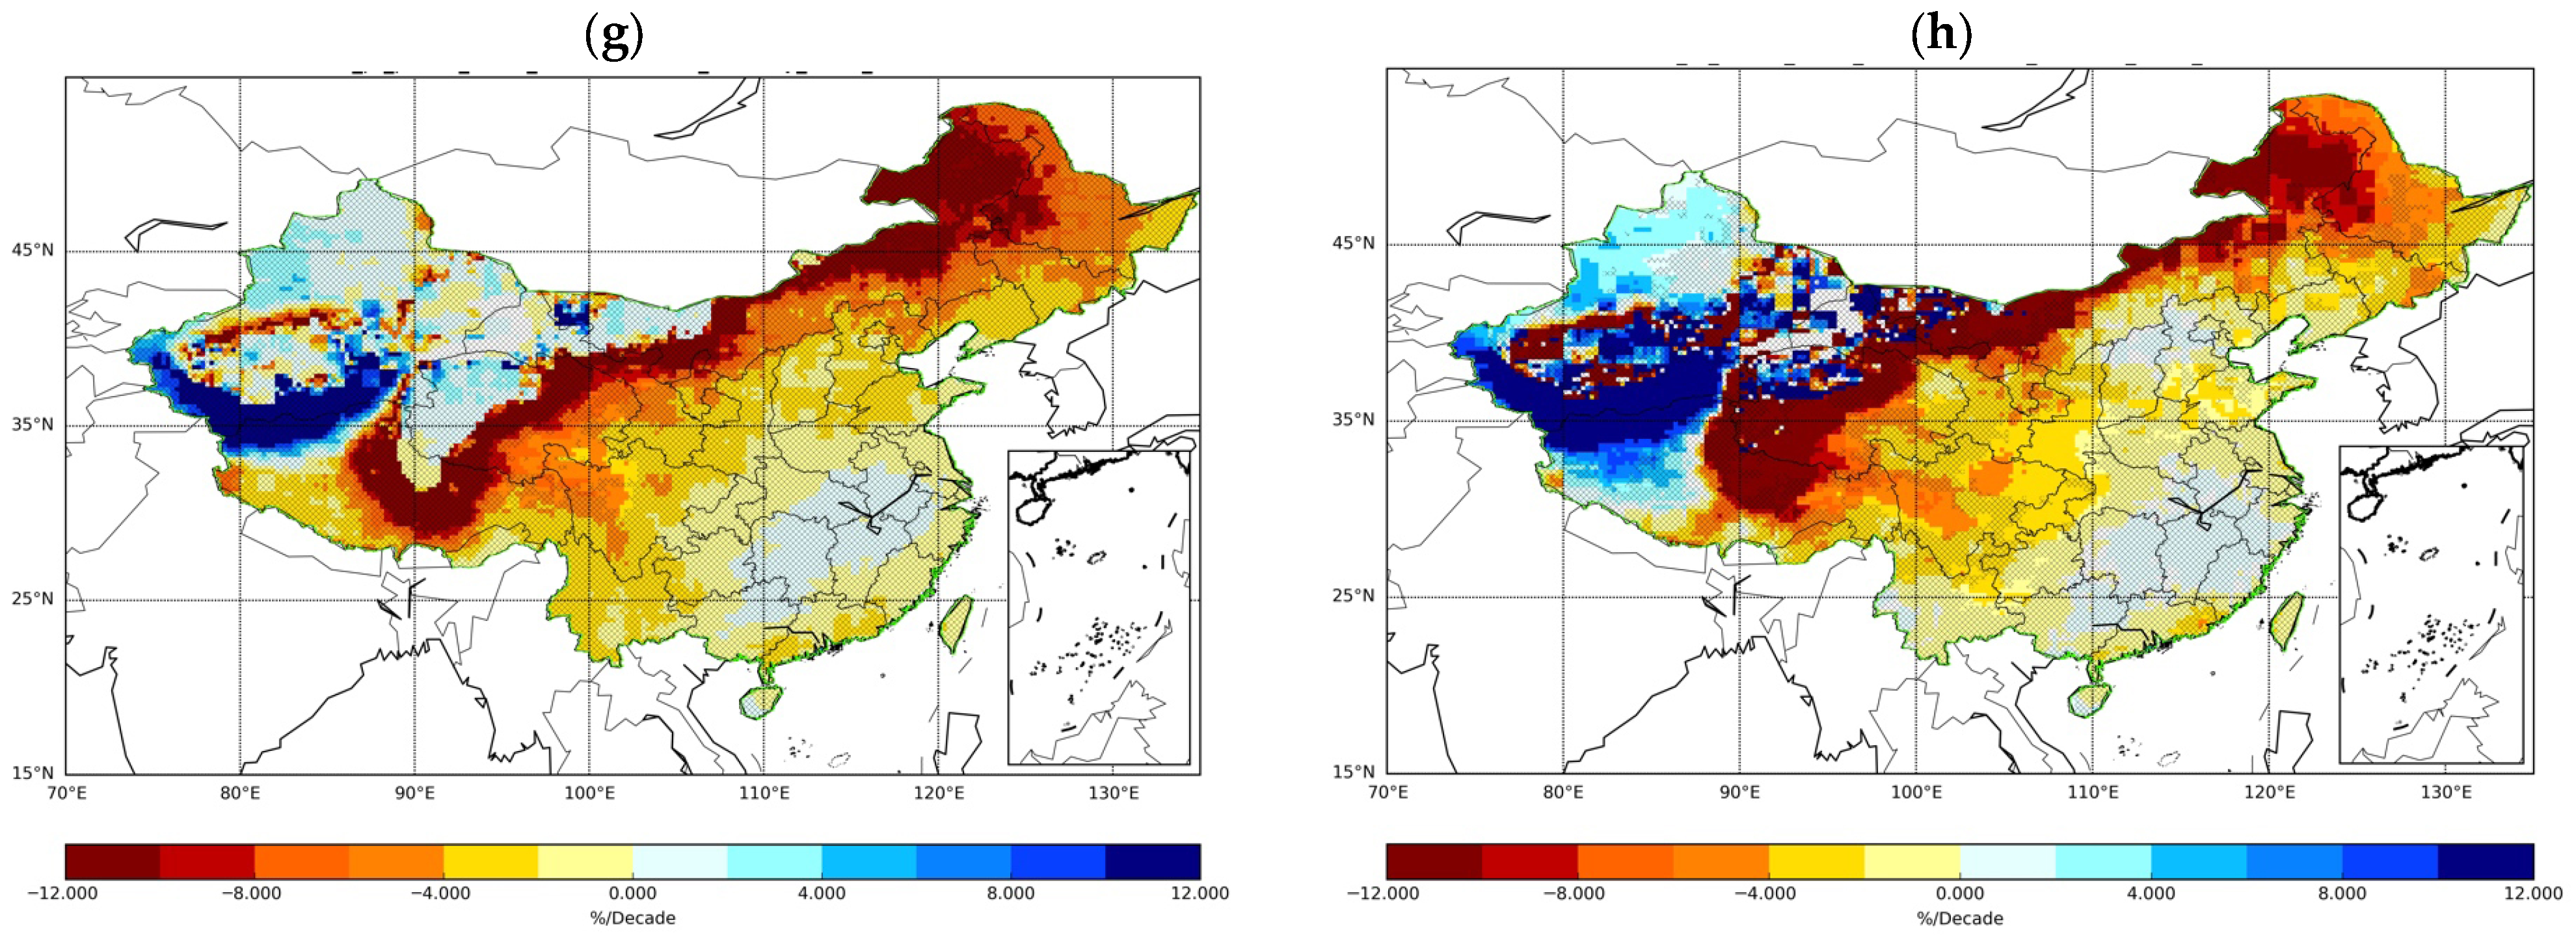
As shown in Figure 5, the spatial pattern of seasonal precipitation is completely different from that of annual precipitation (Figure 2). Although there are also huge variations for the spatial patterns among the four seasons, the spatial pattern of seasonal precipitation change under the two scenarios are similar but with a larger amplitude and more significant change trend under RCP8.5. Overall, precipitation is projected to rise markedly in winter (13.59% and 16.40%) and spring (4.30% and 6.33%) across both scenarios, while it will insignificantly change in summer (−0.27% and 0.88%) and autumn (−4.21% and −0.89%). In winter (Figure 5a,b) and spring (Figure 5c,d), the rate of increase will decrease from northwest to southeast. Except for the eastern Tibetan Plateau, there is no significant change trend in seasonal precipitation across all the other regions in spring and winter under RCP4.5. However, under RCP8.5, the significant increasing trend of seasonal precipitation will occur over all the regions except for southeastern China, and the amplitude of increase will vary from 3.5%/decade to 68%/decade in winter and 2.8%/decade to 20%/decade in spring.
In summer (Figure 5e,f), precipitation is projected to experience a decreasing change over Northwest China and part of Central China. Meanwhile, the increasing trend is dominant over other regions with the largest increase over the Tibetan Plateau. Like winter and spring, the changing trend in summer is insignificant at the pixel scale over China (except a small region in the eastern Tibetan Plateau in summer) under RCP4.5, while for most pixels with an increasing or decreasing trend, the change in trend is significant at the 5% significance level under RCP8.5.Different from other seasons, the decreasing trend in autumn (Figure 5g,h) is dominant over most of China. In general, the spatial pattern of the changing trend for autumn precipitation contrasts with that in summer in Southern China. For example, the change in precipitation in Central China in autumn (Figure 5g,h) contrasts with that in summer (Figure 5e,f). In autumn, the Tibetan Plateau is projected to be the region with the largest increase over the western part of this area and the largest decrease over the eastern part of this area (Figure 5h). Under both RCP4.5 and RCP8.5, over most of China, there is no significant change in trend at the pixel scale.
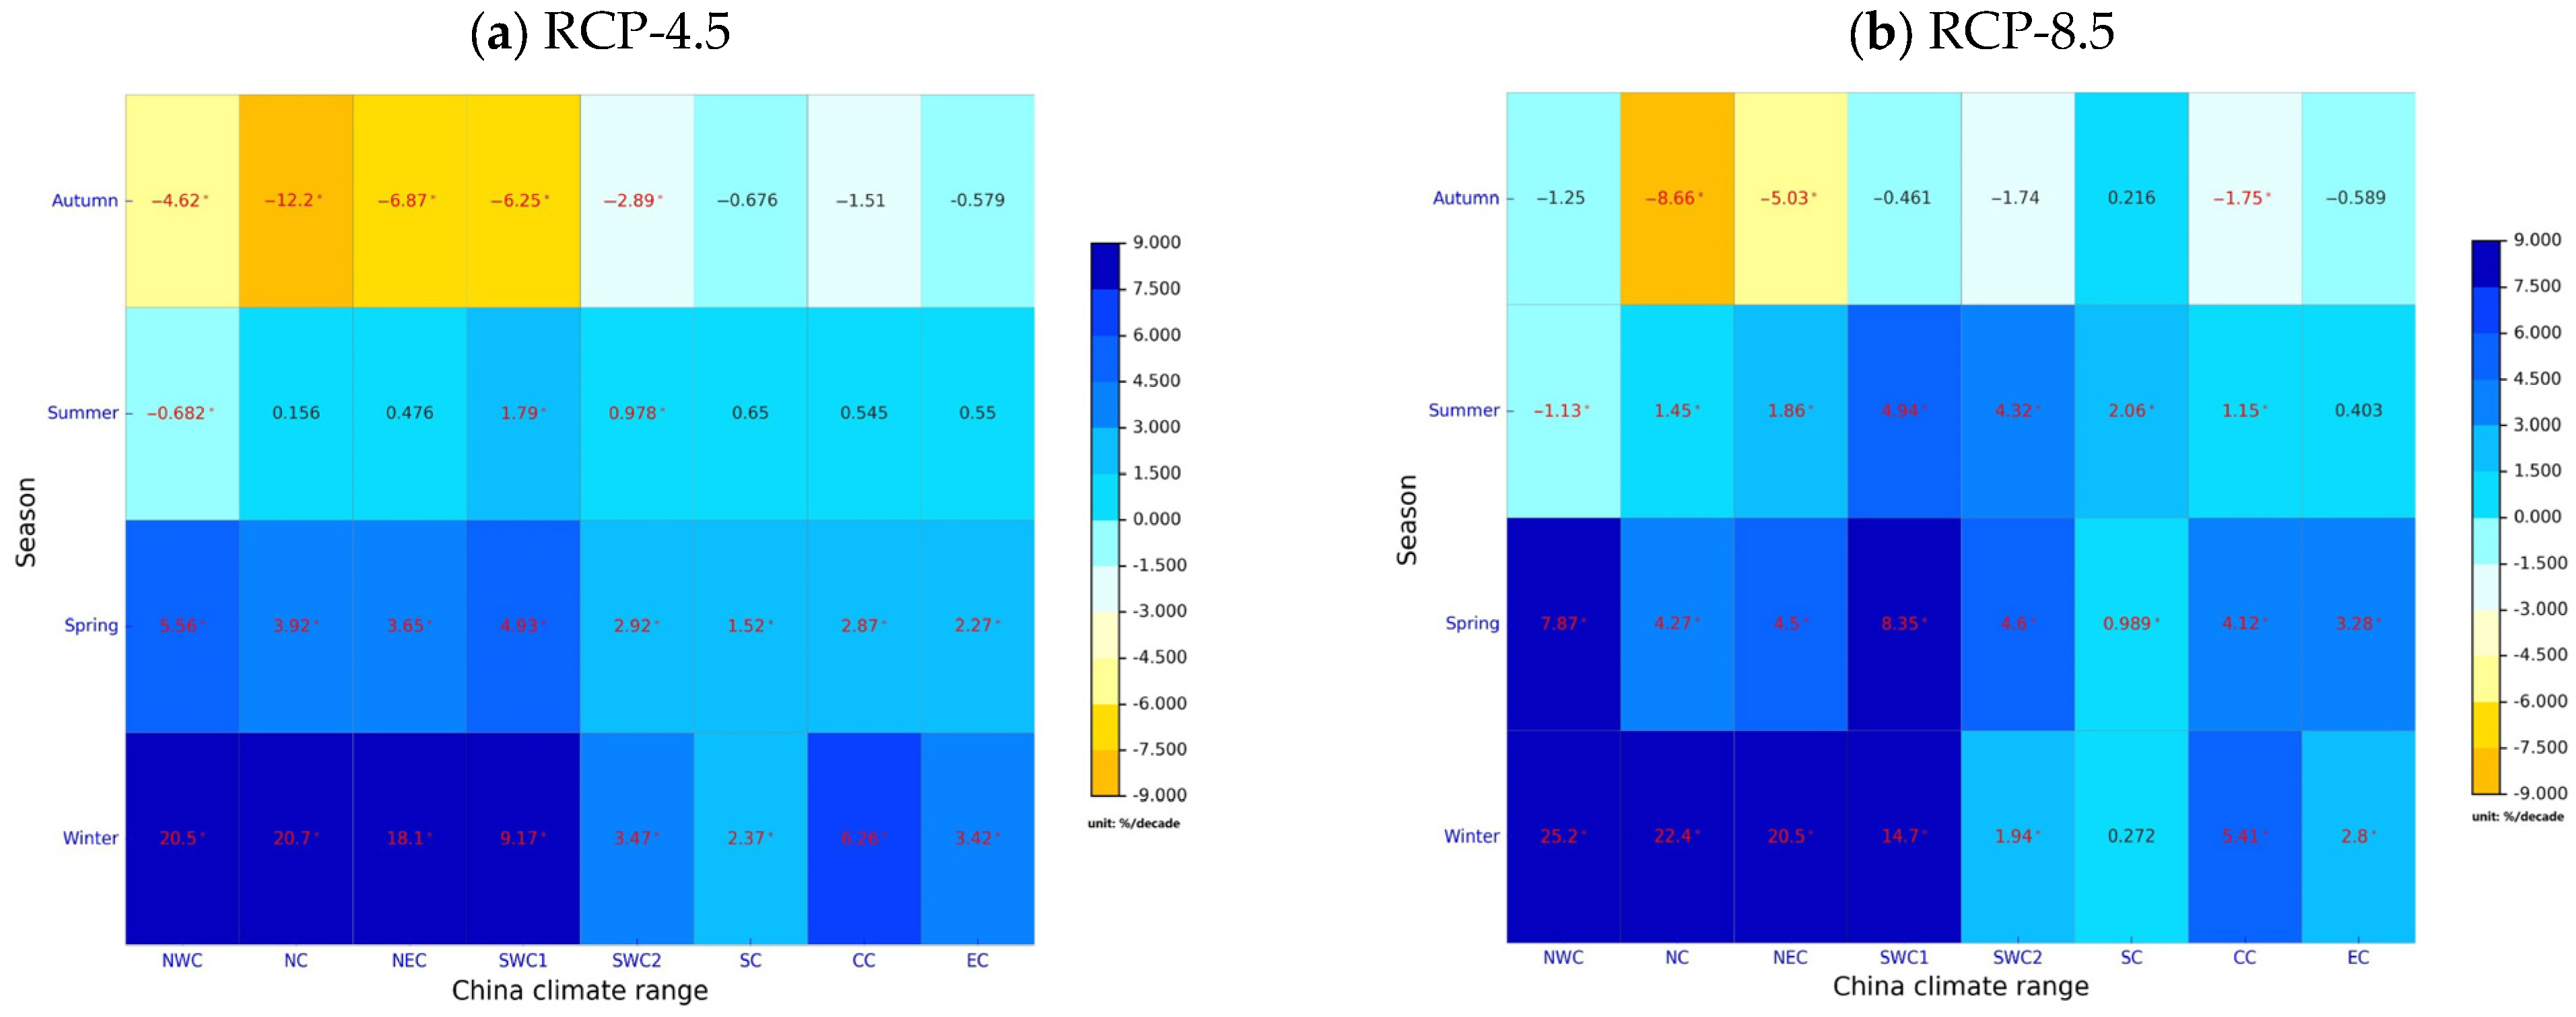
Seasonal precipitation changes vary substantially across China’s eight sub-regions (Figure 6). Winter and spring show significant increases nationwide, with the smallest gains in South China. Summer precipitation rises in all regions except Northwest China, while autumn exhibits an overall declining trend. Notably, Northwest China, Northeast China, North China and the Tibetan Plateau—regions characterized by higher latitudes or elevations—demonstrate amplified seasonal contrasts: steeper increases in winter and spring but more pronounced decreases in autumn compared to other areas.
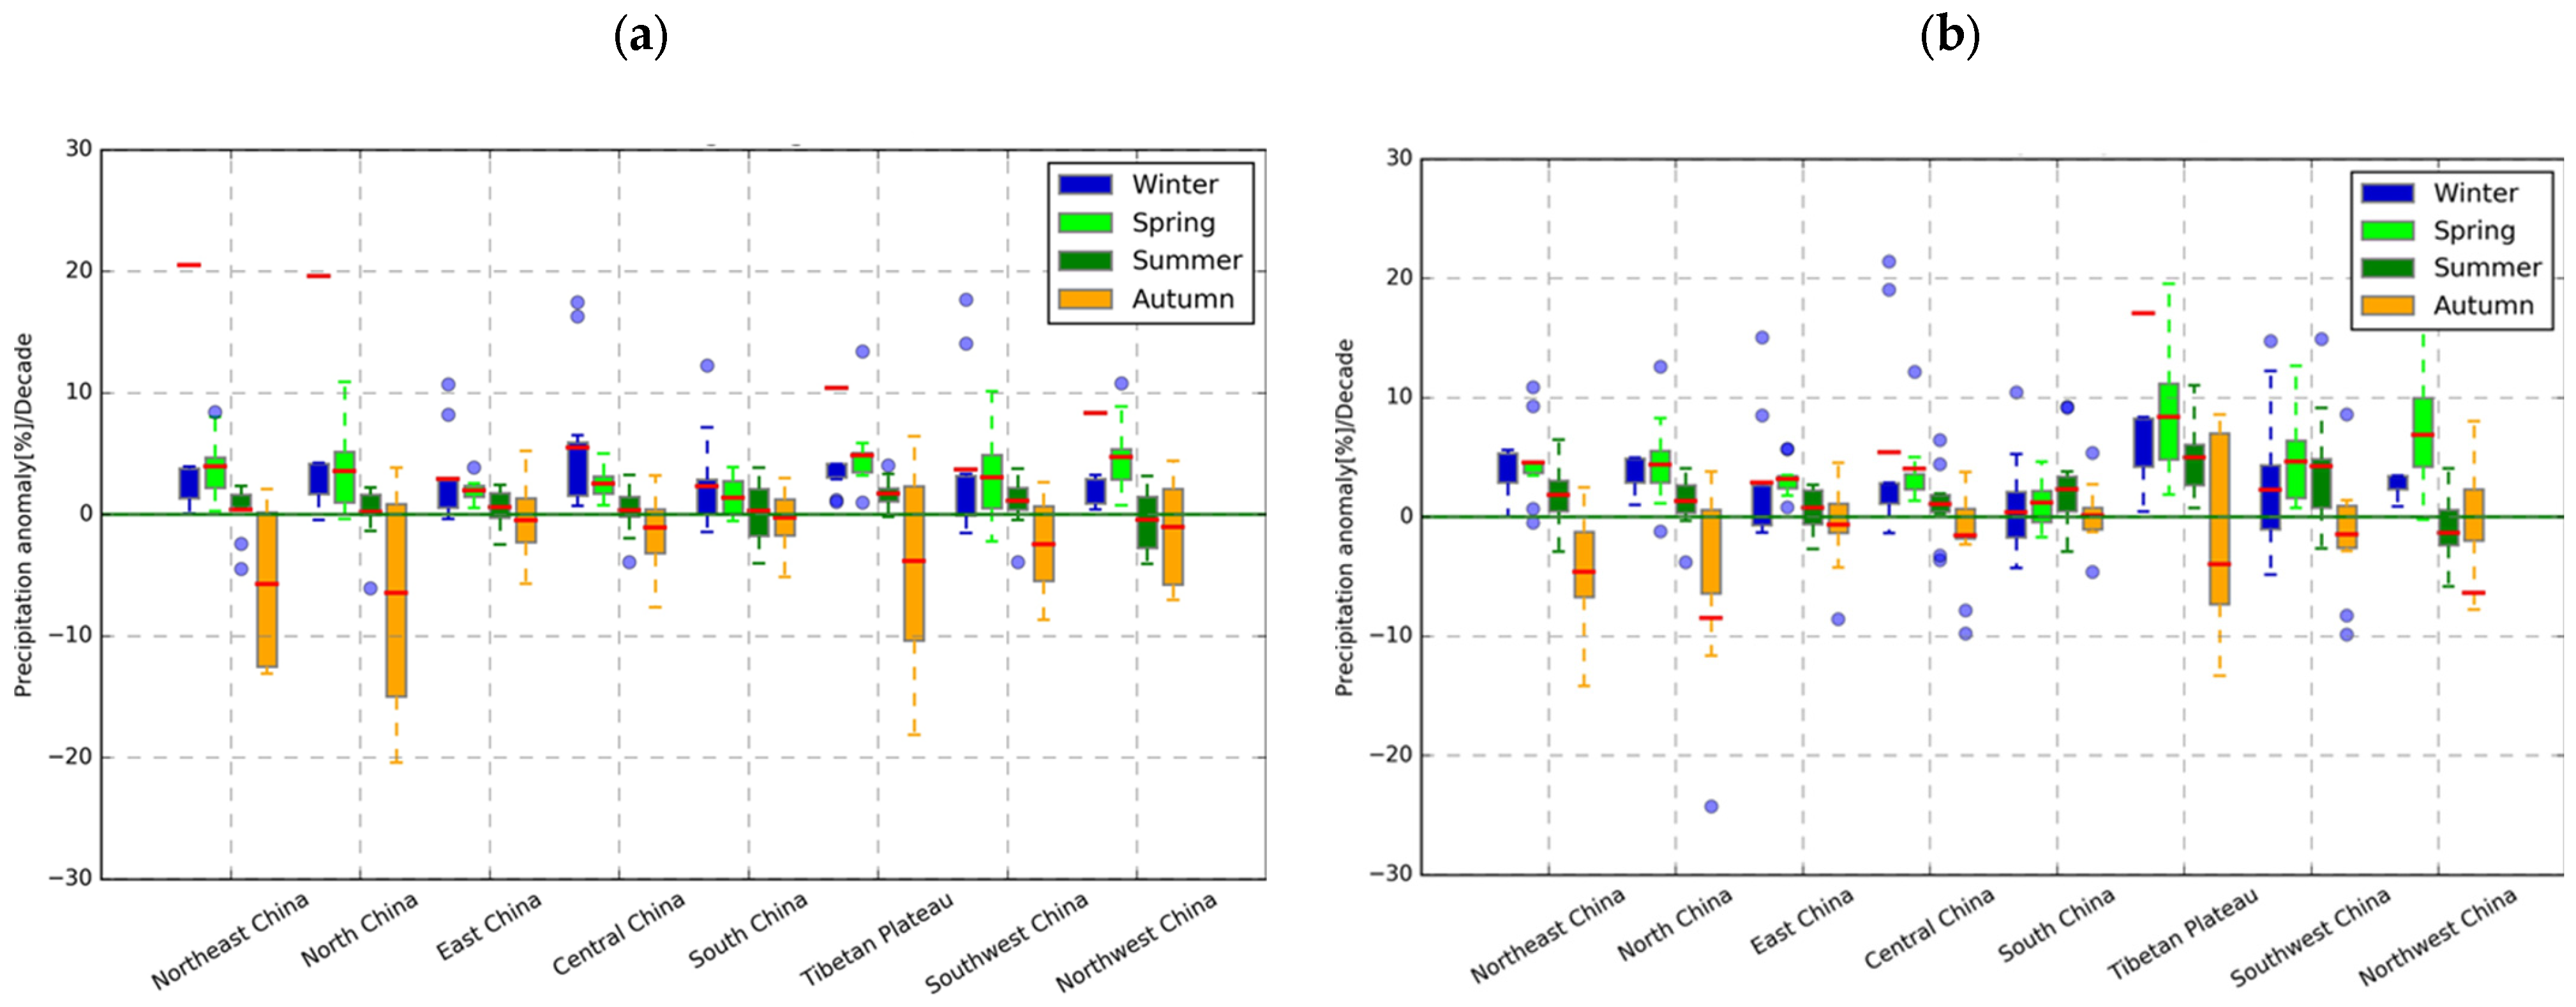
Figure 7 shows the spread ranges of the rates of change over the sub-regions for the projected seasonal precipitation rates of change (%/decade). Different from the annual projection presented in Figure 4, the spread range of season precipitation is wider with obvious whiskers, implying that there is a relatively larger spread for the projected increase rate among the ten CMIP5 models on a seasonal scale. In general, there is no significant discrepancy between the model spreads under two scenarios (Figure 7). Autumn precipitation is projected to have a wider spread range relative to other seasons.
It should be noted that part of the MME result is outside of the 15–75% range, especially for winter. For example, the increase rate for higher latitudes and higher elevations is predicted to range from 14.7%/decade to 24.5%/decade by the MME on a regional scale, which is obviously out of the spread range of the ten CMIP5 models. The reason for this large discrepancy is that the increase rate for the MME on a regional scale is calculated from the MME seasonal precipitation anomalies at the pixel level, while the spread range is directly calculated based on the ten individual CMIP5 seasonal precipitation projected increase rates. The winter precipitation amount, especially over northern China, such as Northwest China and North China, is very small. Therefore, although there is a similar change trend for winter precipitation, the precipitation magnitude difference could cause very large values for the percentage which represents the seasonal precipitation change in winter.
As presented in the spatial distribution of the winter precipitation change rate (Figure 5a,b), due to the MME seasonal precipitation change being the median of the ten corresponding CMIP5 model results, the pixel value for the winter precipitation change is very large. Thus, some pixels are NaN in the MME results because of unreasonable values (i.e., >900% for winter precipitation change) and the change rate for the MME result over Northwest China and the Tibetan Plateau is very large. That is also the reason for the very high change rate in winter over the higher latitude and higher elevation regions in Figure 7.
Generally, Figure 7 illustrates that the inter-model agreement among the ten CMIP5 models for seasonal precipitation is lower than the spread of annual precipitation change rates at the regional scale shown in Figure 4.

3.2. Evolution of Extreme Precipitation Indices

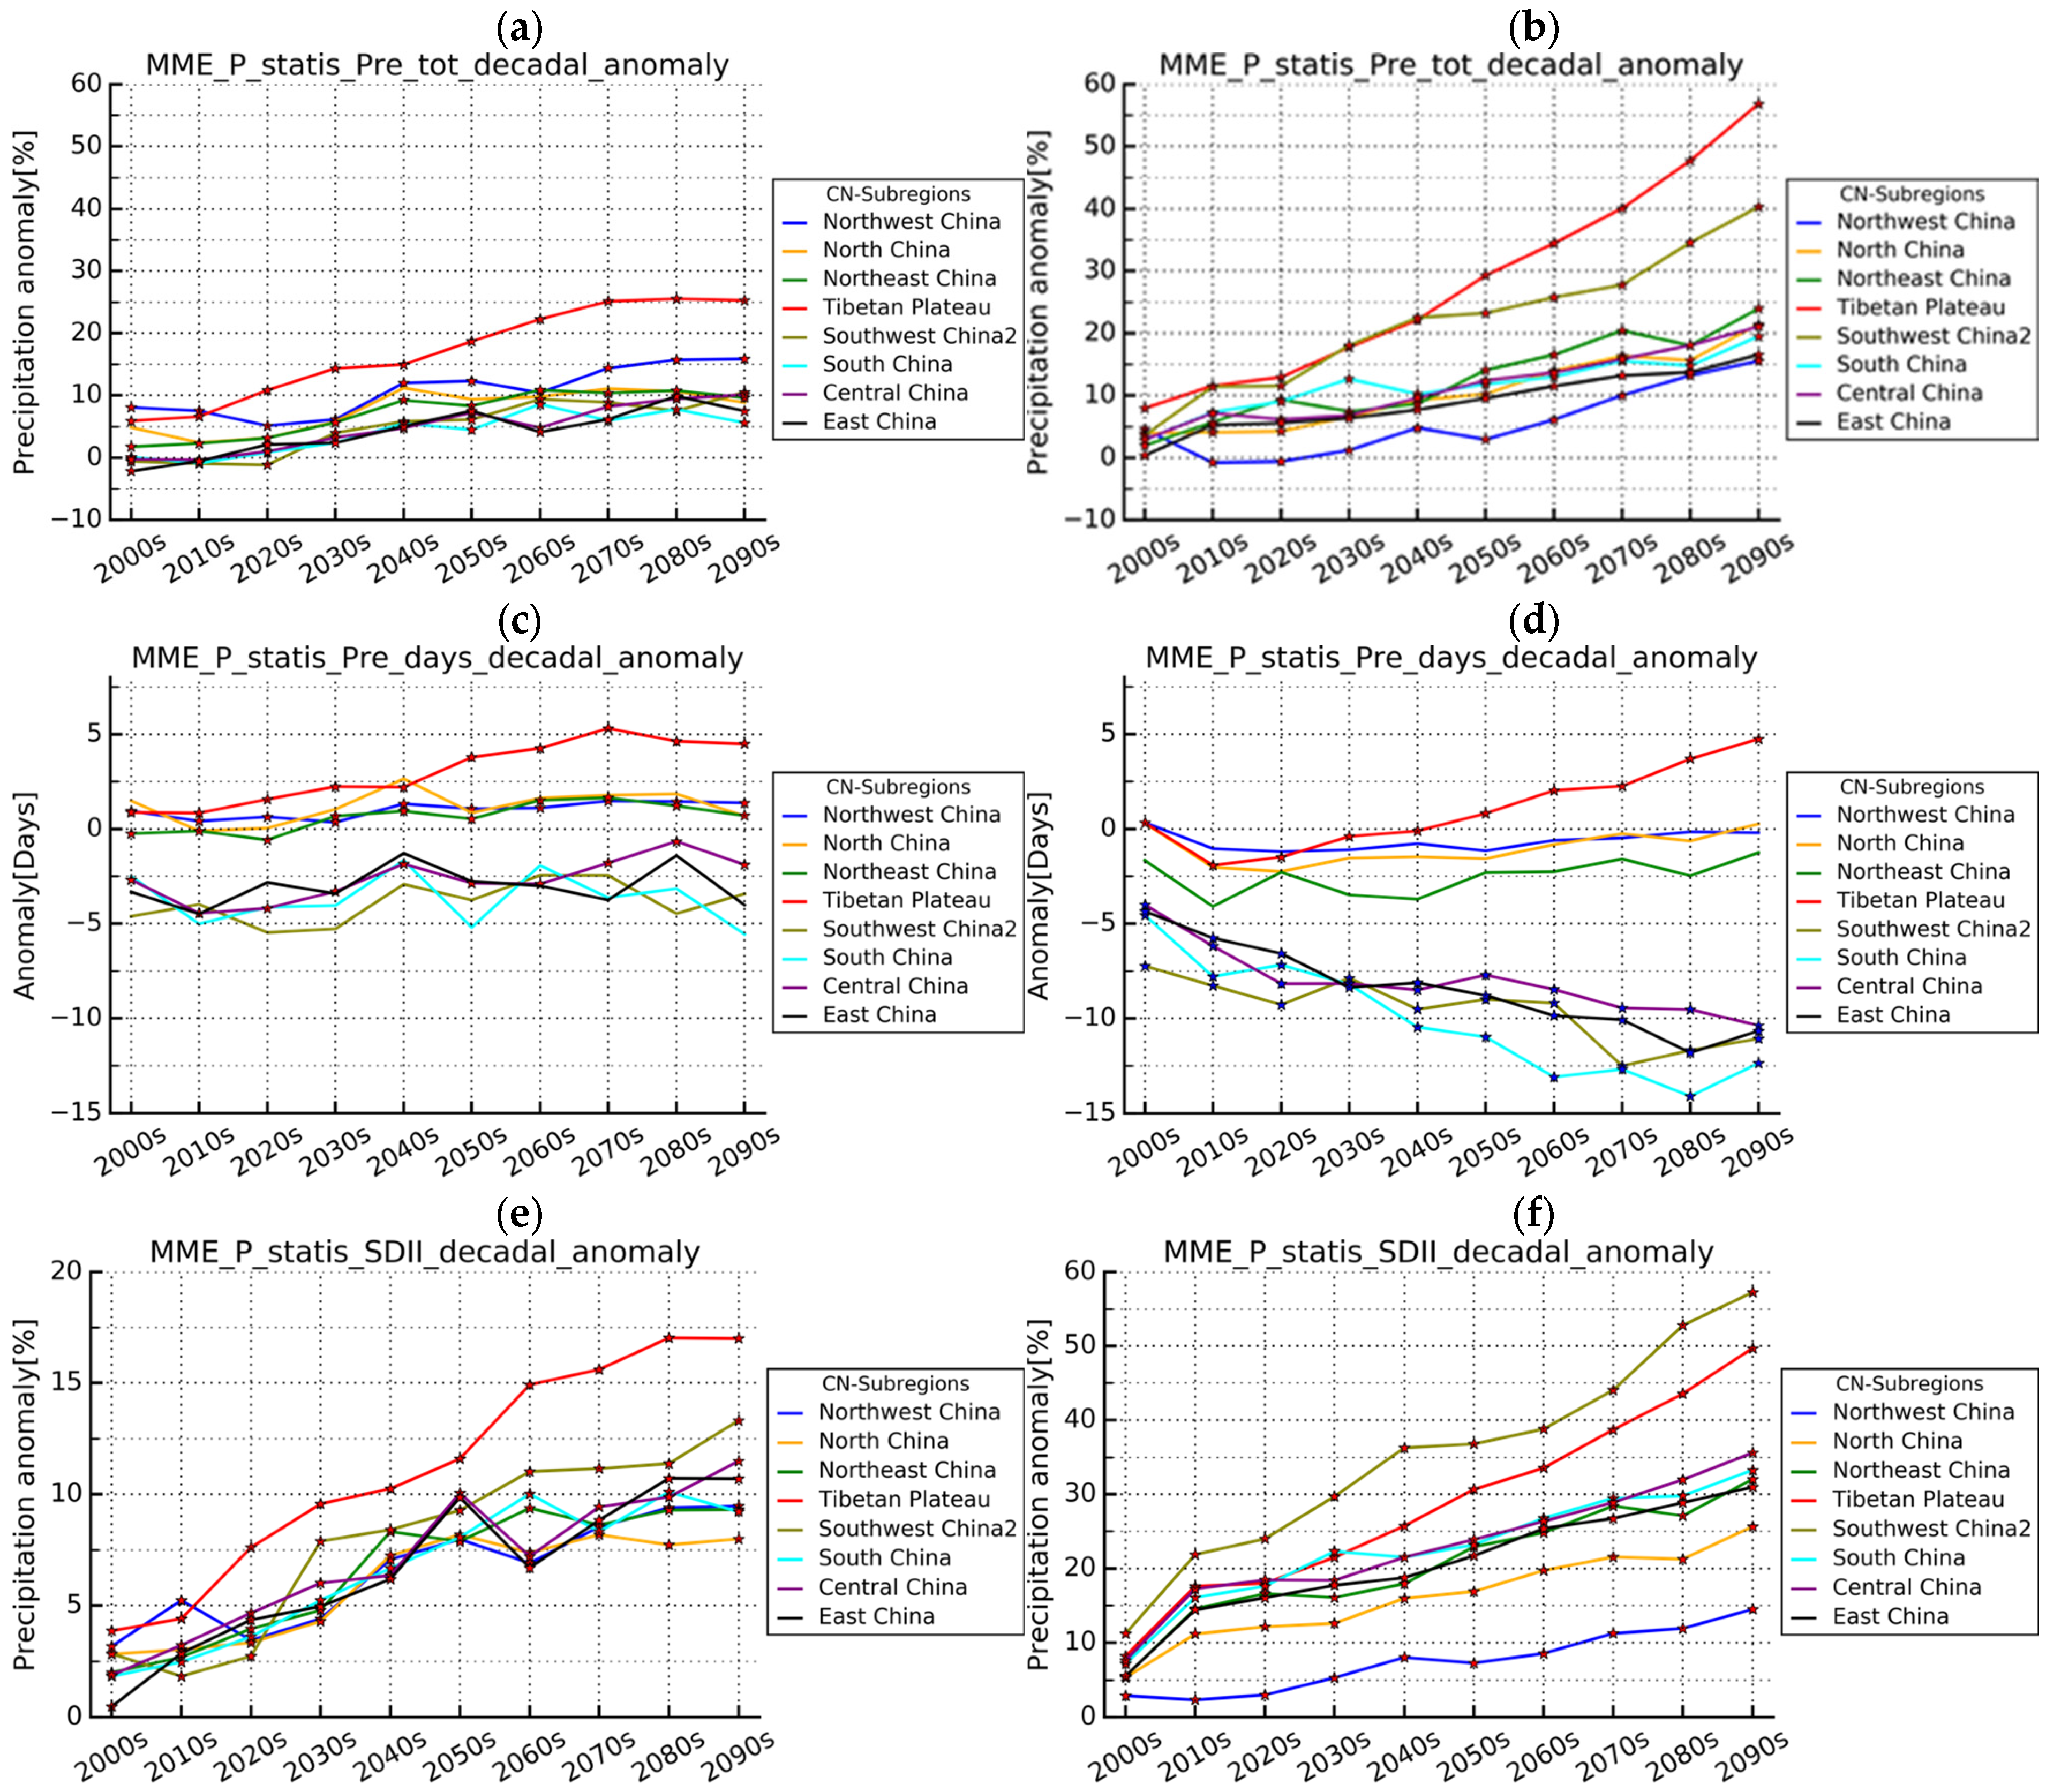
Figure 8 shows the temporal evolution of indices describing extreme precipitation, including total wet-day precipitation (PRCPTOT), the number of wet days (R1mm) and simple daily precipitation intensity (SDII). Changes in SDII and PRCPTOT indices are expressed as a percentage relative to the reference period of 1961–1990. The change in R1mm is directly expressed as an anomaly (days) with respect to 1961–1990.
PRCPTOT shows a robust upward trend across China, with the Tibetan Plateau exhibiting the most pronounced increase under both RCP4.5 and RCP8.5. The temporal instability of regional rankings suggests substantial spatiotemporal heterogeneity in PRCPTOT anomalies throughout the 21st century. Notably, scenario-dependent divergence emerges even within identical time windows. For instance, Northwest China demonstrates the second-largest PRCPTOT increment under RCP4.5, whereas Southwest China occupies an intermediate position. Conversely, under RCP8.5, Northwest China projects the weakest amplification among all sub-regions, while Southwest China ranks immediately after the Tibetan Plateau.
Unlike the uniform increase in PRCPTOT, R1mm exhibits distinct regional patterns. The eight sub-regions split into two contrasting groups: high-latitude/high-altitude areas (Northwest, Northeast, North China, and the Tibetan Plateau) versus southern China (East, South, Southwest, and Central China). The former group shows higher R1mm values than the latter. In general, the R1mm change in the former group of regions is higher than that in later ones. For regions with the higher latitudes and higher elevations, except the Tibetan Plateau with a significant increase in trend under both scenarios, other regions are projected to experience a slight significant increase in the 21st century under RCP4.5 and an insignificant change in decrease trend under RCP8.5, while the R1mm in Southern China is projected to decrease under the two scenarios with a significantly decreasing trend in the 21st century under RCP8.5.
The SDII will significantly increase across China with the largest increase in trend in the Tibetan Plateau and Southwest China under RCP4.5 and 8.5, respectively. Like the change in PRCTOT, the temporal variation in SDII also implies that there will be huge spatial variations in the PRCTOT anomaly in different periods of the 21st century, especially under RCP8.5.
As we know, the PRCTOT is decided by the SDII and R1mm. Except for the Tibetan Plateau, the increase in PRCTOT is accompanied by the increase in SDII and the decrease in R1mm; this phenomenon is more obvious under RCP8.5. According to the results shown in Figure 8, we could conclude that the increase in PRCTOT is mainly caused by the increase in SDII, especially for southern China. In other words, across southern China, it is possible that the area will experience more frequent heavy precipitation in the future, especially under RCP8.5.
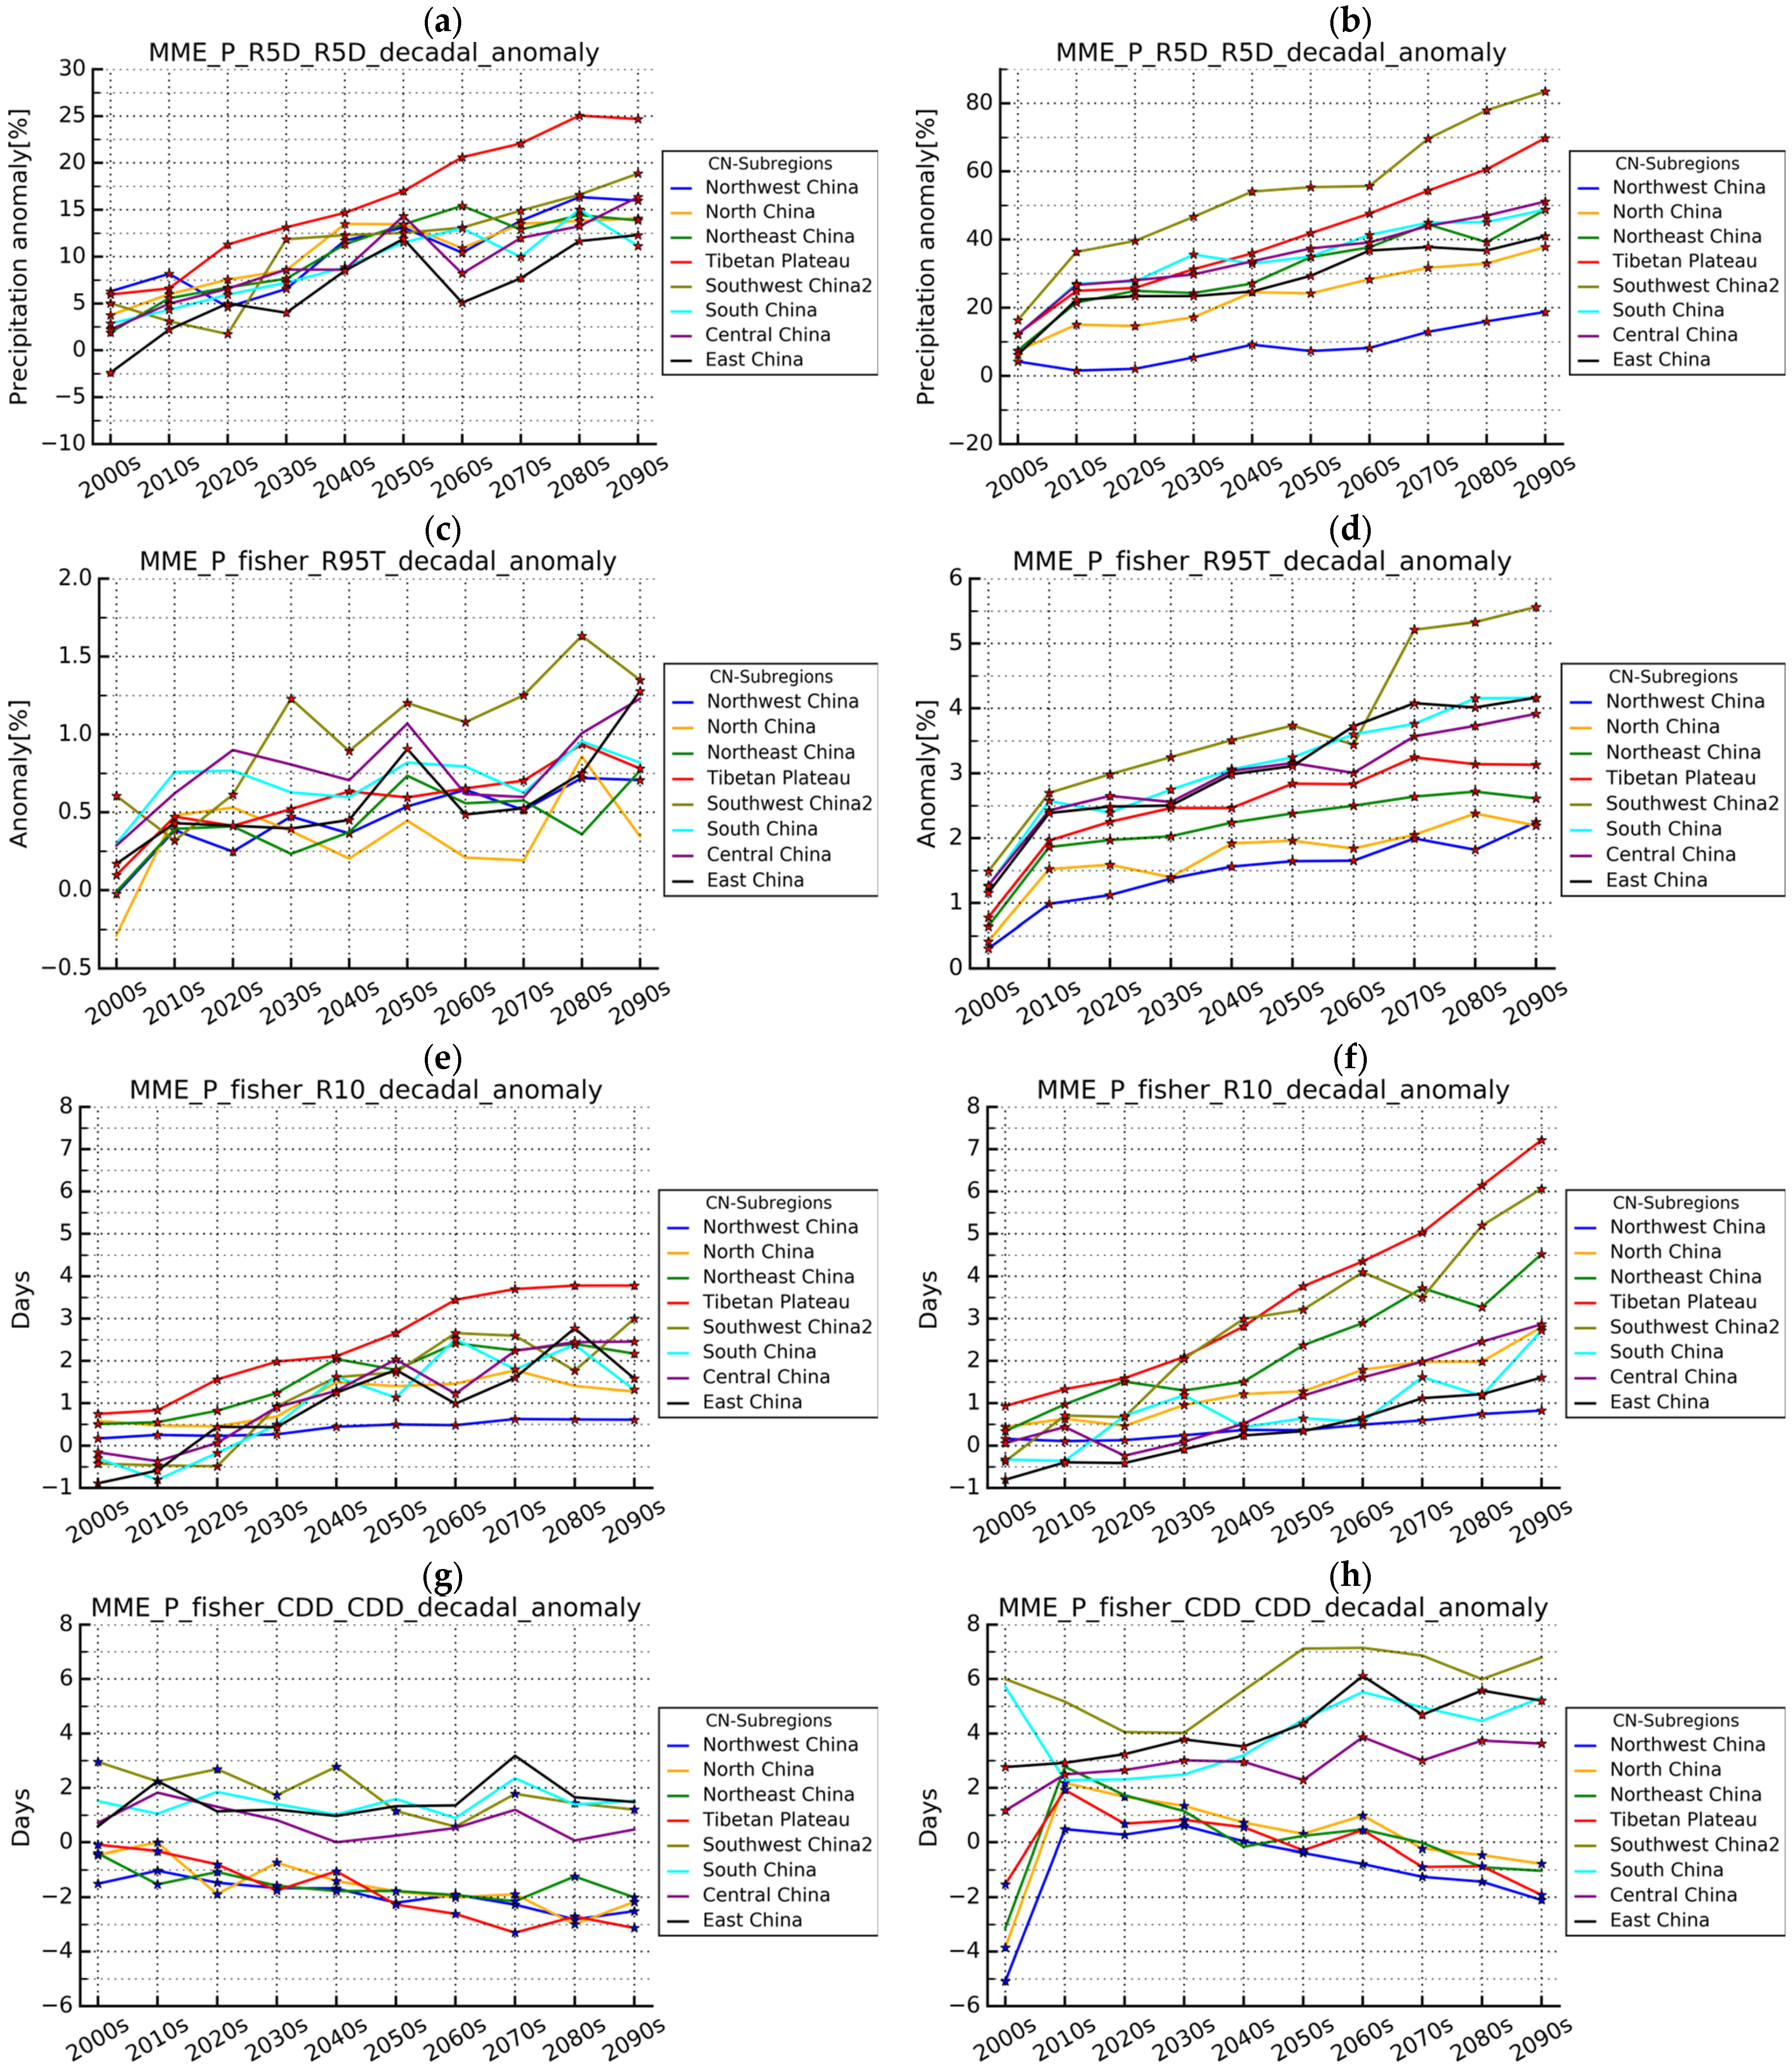
Figure 9 displays the temporal variations in four extreme indices (R5D, R95p, R10, and CDD). Similar to SDII and PRCTOT, R5D changes are quantified as percentage deviations from the 1961–1990 reference-period mean. The remaining indices (CDD, R10, and R95p) are shown as anomalies relative to the same reference period.
Projections indicate the Tibetan Plateau will experience the greatest R5D increase under RCP4.5, while Southwest China shows maximum growth under RCP8.5. Except for Northwest China with the smallest increase trend under RCP8.5, the magnitude of the increase in R5D under PRC8.5 is almost around 3–4 times that under RCP4.5. At the end of the 21st century, the increasing amplitude of R5D on the regional scale under RCP4.5 projected to be 12–13% and it is 19–84% under RCP8.5 over different sub-regions.
In comparison with the significant increase in R95p from 0.5 to 5.5% under RCP8.5, the increase in R95p is relatively modest under RCP4.5 and the value of increase is always under 1% for most periods in the 21st century across most of China, except in Southwest China with 1.5% in the middle and end of the 21st century. The largest increase for R95p is projected to be in Southwest China, with the magnitude being 1.5% and 5.5% in the 2090s under RCP4.5 and RCP8.5, respectively.
R10 is also projected to significantly increase over all the sub-regions with the largest increase over the Tibetan Plateau and smallest increase over Northwest China under the two scenarios. In the 2090s, the R10 is projected to increase by 0.6–3.6 days and 0.8–7.2 days (over the Tibetan Plateau and Northwest China) under RCP4.5 and RCP8.5, respectively.
For the R5D, R10 and R95p, the essence of these three indices is a simple measure of extremely heavy rain events, while CDD indicates the longest continuous days without precipitation. Therefore, different from the three extreme indexes mentioned, CDD is a measurement for dry conditions. In addition, CDD is closely related to R1mm. Thus, like the change in wet days (R1mm) in China (Figure 9c,d), the eight sub-regions also could be divided into the two same groups. Specifically, the decrease in CDD is significant over higher latitudes and higher elevations under RCP4.5. Under RCP8.5, except for there being an anomaly for the change in CDD in the 2020s, a significant decrease in CDD is also projected to occur across this kind of region. Across southern China the increase in CDD is expected to occur under the two scenarios, but there is no significant change trend at the 5% significance level (except across Southwest China under RCP4.5 and across Central China and East China under RCP8.5).
Similar to the PRCPTOTO, R1mm and SDII, there are variations in the change order for R95p, R10, R5D and CDD in the same period under the two scenarios. In addition, changes in these indices are also very unstable over time. All of these indicate that there would be large temporal–spatial variations for the spatial pattern of these precipitation extreme indices over China.
Due to the different CMIP5 models and time periods for analysis, there are some differences in spatial pattern and the absolute magnitude of trends between these results and those of previous works. However, the increasing trend of extreme precipitation indices, e.g., PRCTOT, SDII, R95p and R5D, is consistent with previous studies [25]. In addition, the spatial pattern of change in R95p and CDD is also in agreement with previous works [59]. Overall, the projection results confirm the viewpoint in IPCC AR5 that more frequent, more widespread and/or more intense extreme precipitation events will occur over China during the 21st century [60].

3.3. Change in PR for the Extreme Precipitation Events Based on GEV

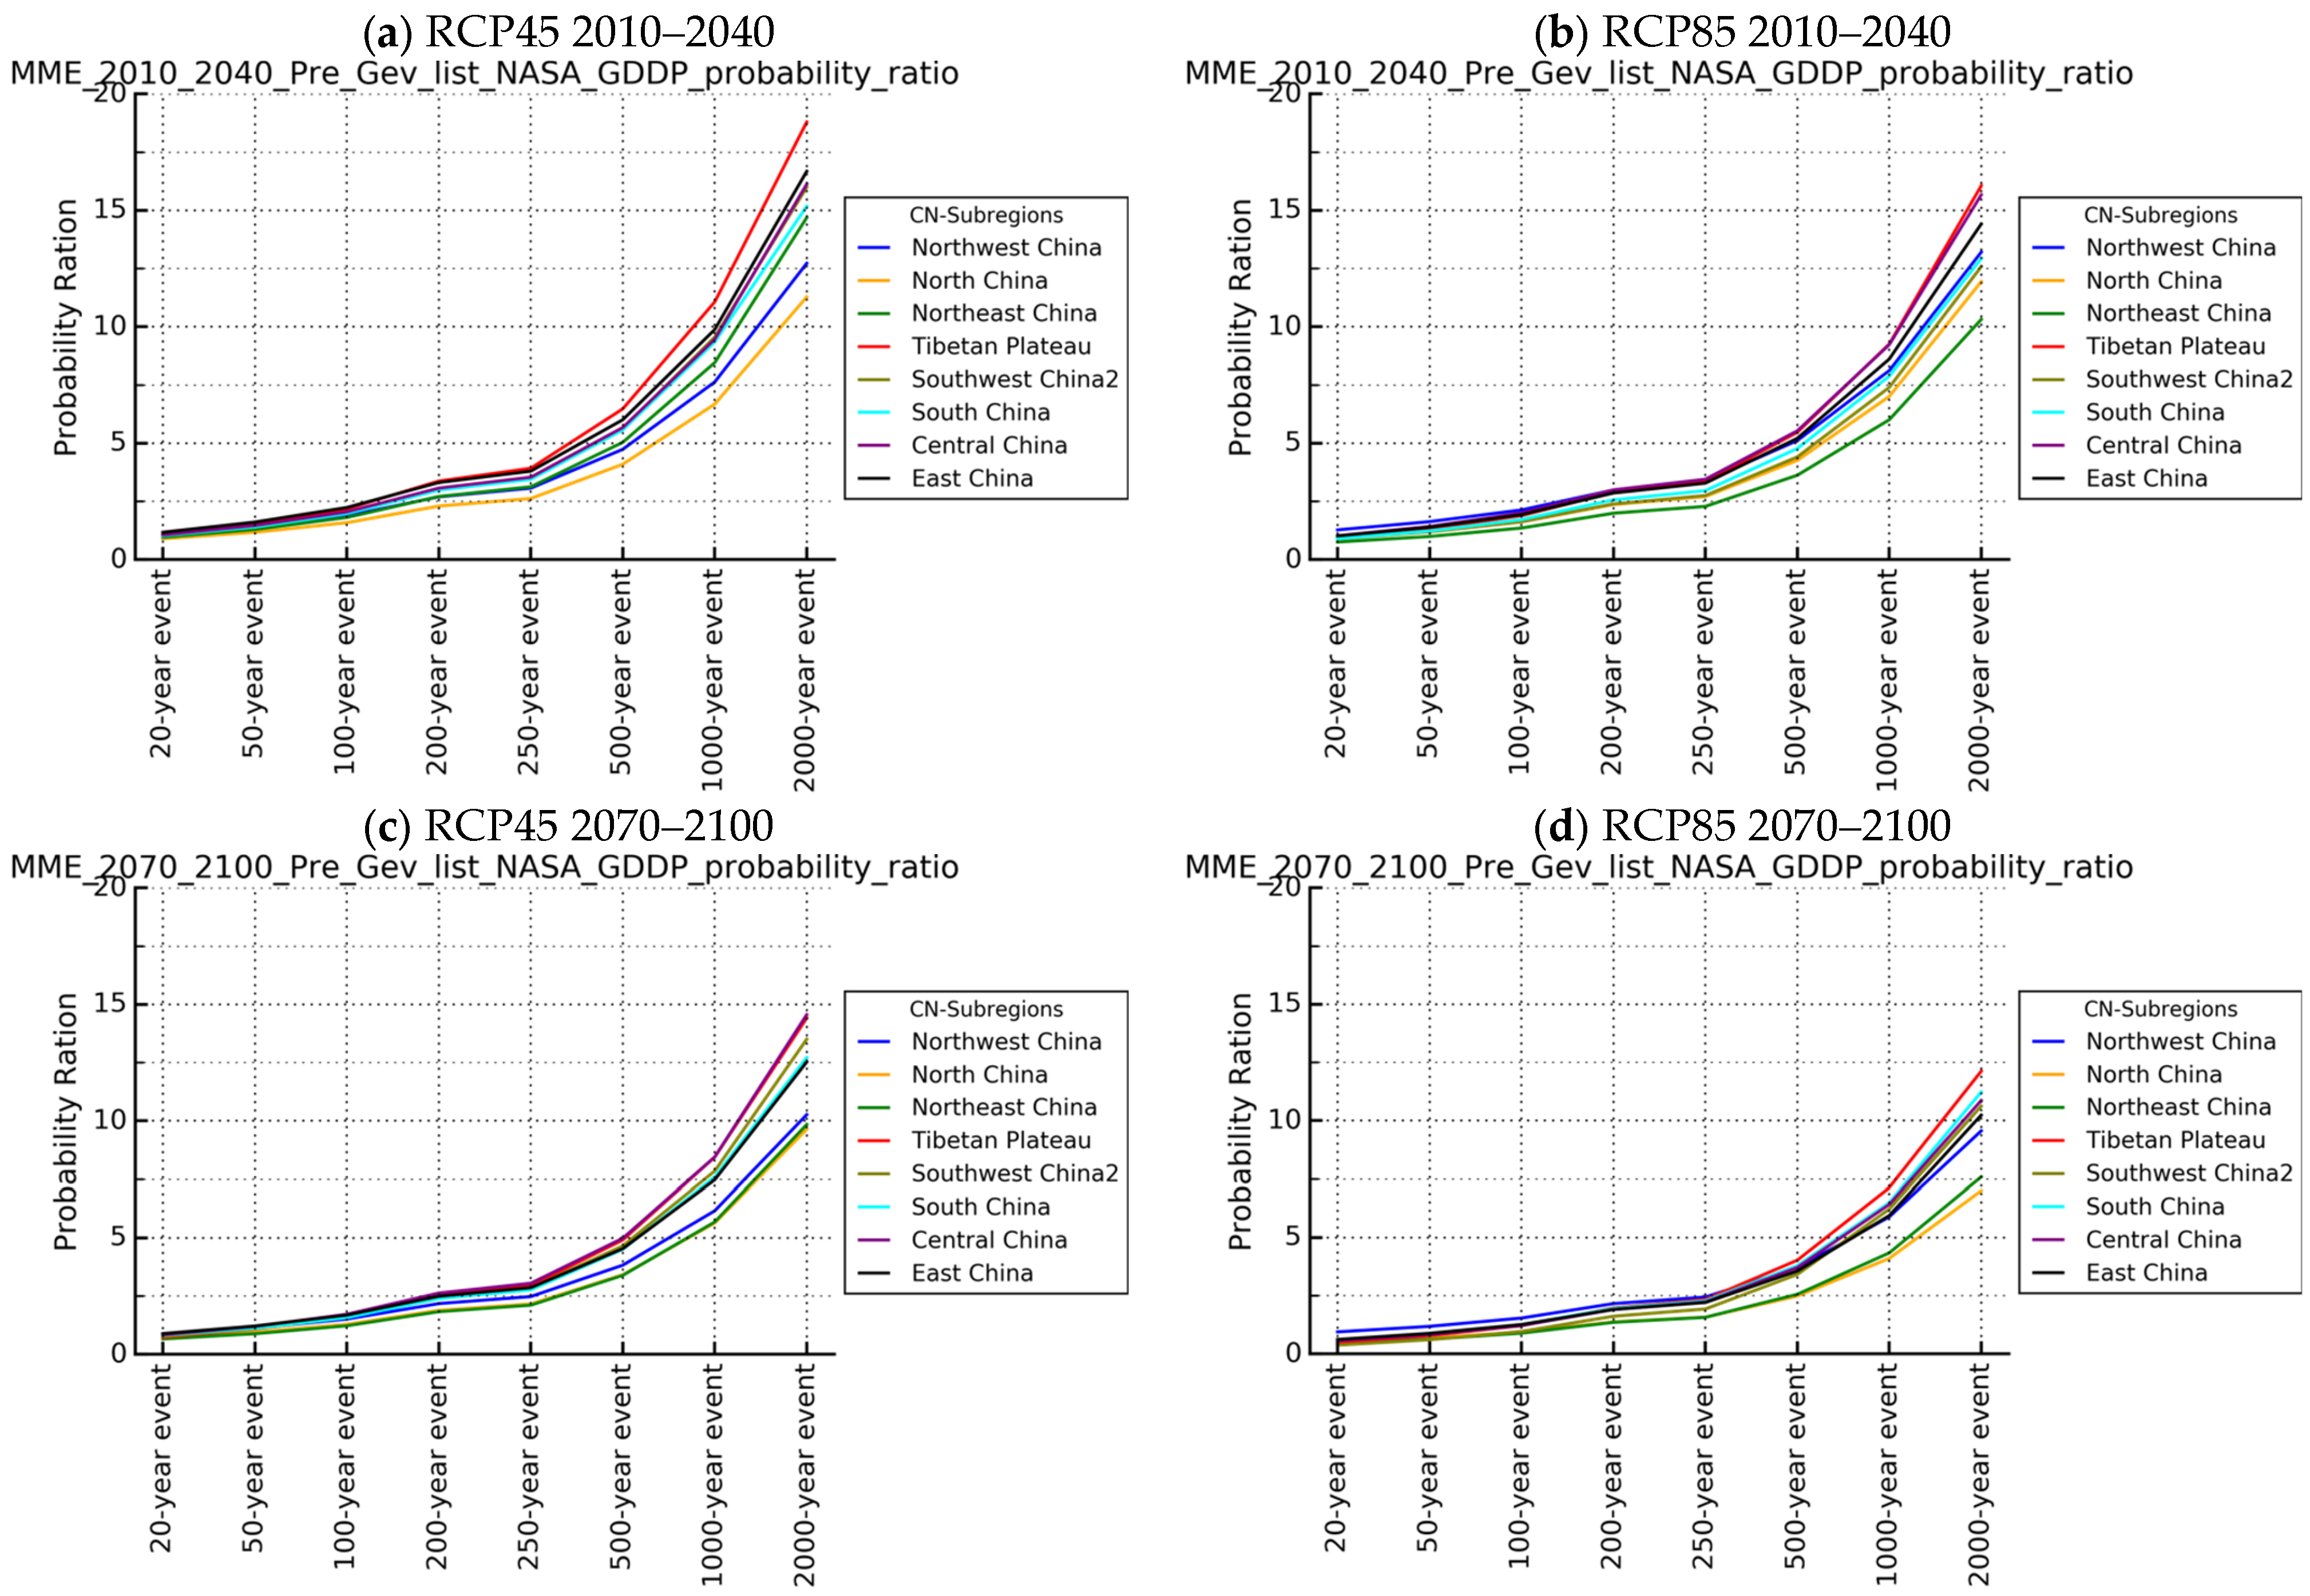
To quantitate the probability of changes in extreme rainfall events, the probability ratio (PR), fitted using the GEV model, is adopted to describe the risk of extreme rainfall events in the middle (2010–2040) and later (2070–2100) 21st century compared with 1961–1990. A larger PR value means that there is a higher probability for extreme precipitation events at a specific return period in the future. The results in Figure 10 show that there will be a much higher probability for extreme events in the future. In addition, the more extreme a precipitation event is (such as 1000-year events and 2000-year events), the higher the probability that it is projected to occur over China in the future.
In general, the projected increase in the probability of extreme precipitation events is more pronounced during the early 21st century (2010–2040) than in the later period (2070–2100). Under both scenarios, the likelihood of such events rises across all regions. However, the magnitude of increase is weaker under RCP8.5 compared to RCP4.5. This contrast is especially evident for more extreme events, such as those with 500-, 1000-, and 2000-year return periods. During the early 21st century, the increase in extreme precipitation indices is significant across China. Under RCP4.5, the largest increase occurs over the Tibetan Plateau, followed by East China and Central China. The smallest increases are found in North China and Northwest China. Under RCP8.5, the regional ranking differs notably. The Tibetan Plateau still shows the largest increase, closely followed by Central China, then East China. Northeast China and North China exhibit the smallest increases.
In the later period of the 21st century, the largest increase in PR is projected in Central China as well as the Tibetan Plateau and the least increase is projected to occur in Northeast China and North China under RCP4.5. Similar to the change in the early 21st century, the increasing order is remarkably different under the two scenarios. Under RCP8.5, the Tibetan Plateau is still projected to experience the largest increase for the probability of extreme precipitation with South China closely following, and North China would experience the smallest increase.
The similar order over eight sub-regions under the two scenarios during the two periods implies that the spatial pattern of PR for the extreme precipitation event over China is relatively stable but with different magnitudes for precipitation extreme events at different return levels. This is also more obvious for the more extreme precipitation events, such as the 500-, 1000-, and 2000-year events.
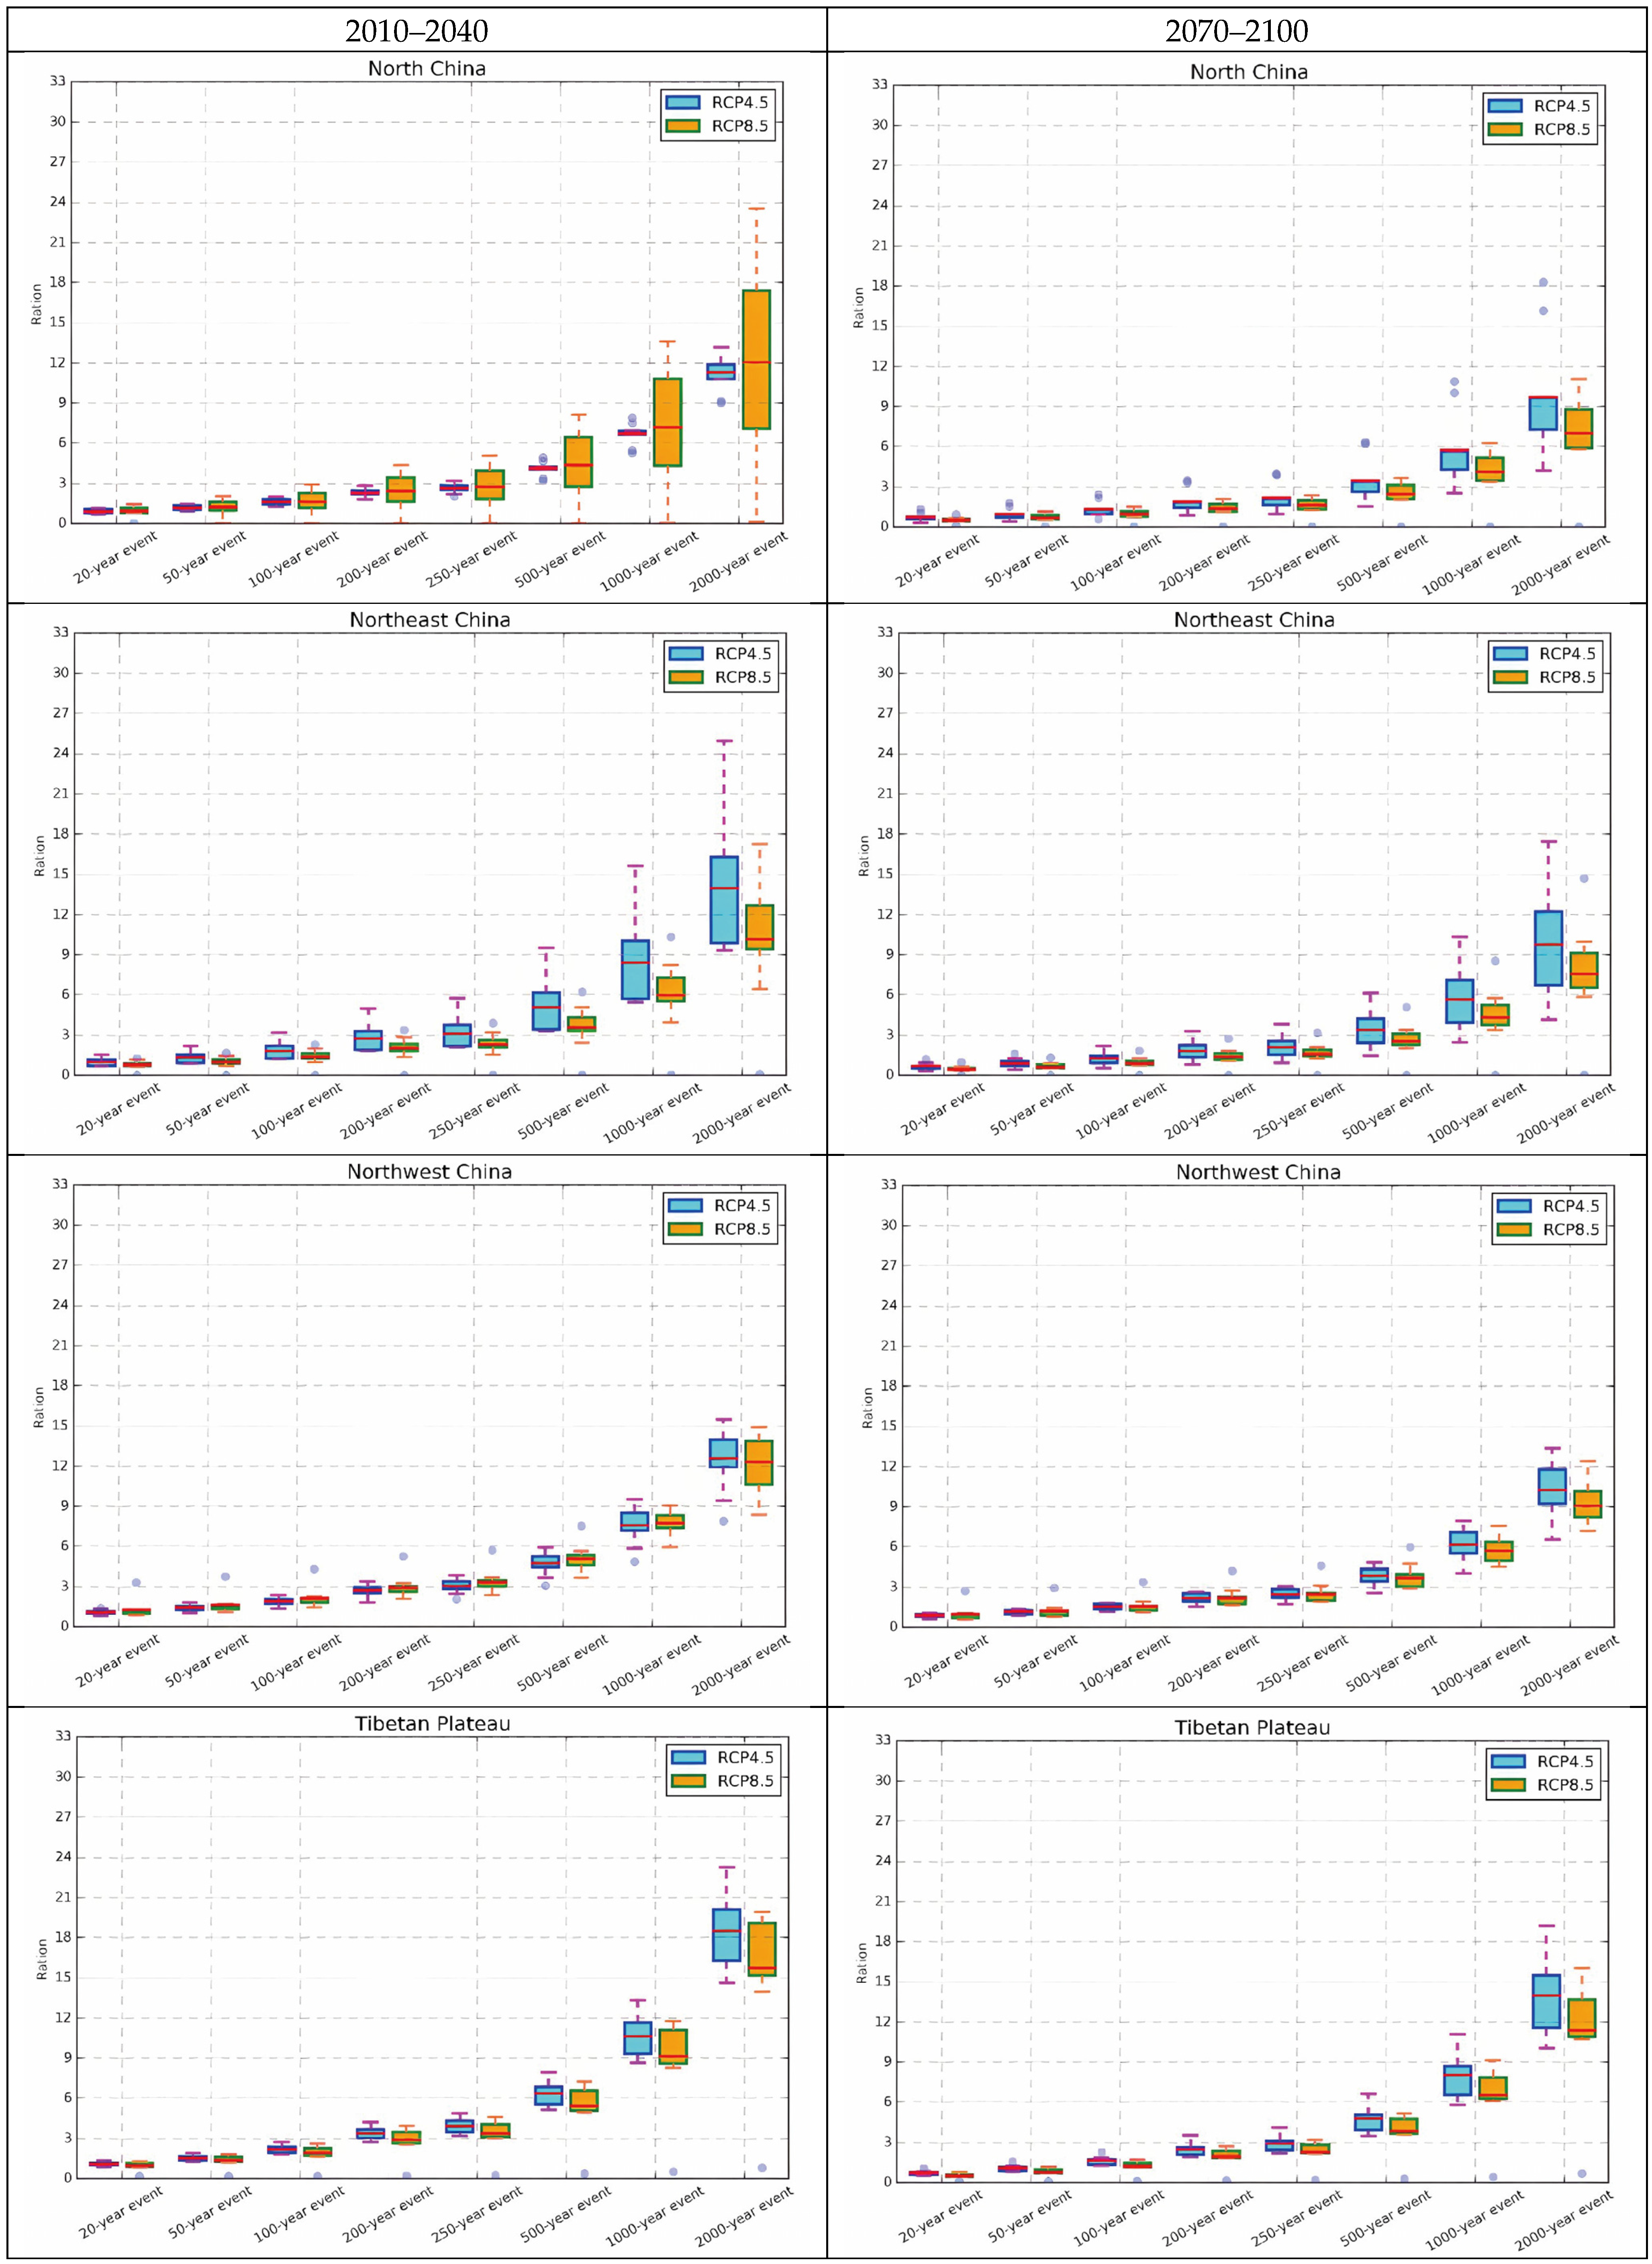
Although the model spreads are different for different precipitation extreme events across different climatic regions of China under the two scenarios, all the model spreads are positive for all the extreme precipitation events defined in this study. That means that all the model projections illustrate that the probability of extreme rain events will increase in the two periods in the 21st century. Under the two scenarios, the model spreads are generally wider for the more extreme precipitation events, e.g., the 1000-year-event and the 2000-year-event in comparison with other extreme precipitation events such as the 20-year-event and the 100-year-event across all the regions.
The model spread for the same region under RCP4.5 and RCP8.5 also is different for different periods. For example, the model spread is wider for North China under RCP8.5 than under RCP4.5 during 2010–2040, while during 2070–2100 the model spread is larger with extreme outliers under RCP4.5 compared with RCP8.5. For Central China, this discrepancy over the two periods under the two scenarios is also obvious. There is a large difference among different model projections for the increasing magnitude for PR of extreme precipitation events under two scenarios, but all the models tend to project an increase in possibility of extreme precipitation events over different sub-regions in the early and later 21st century under two scenarios.
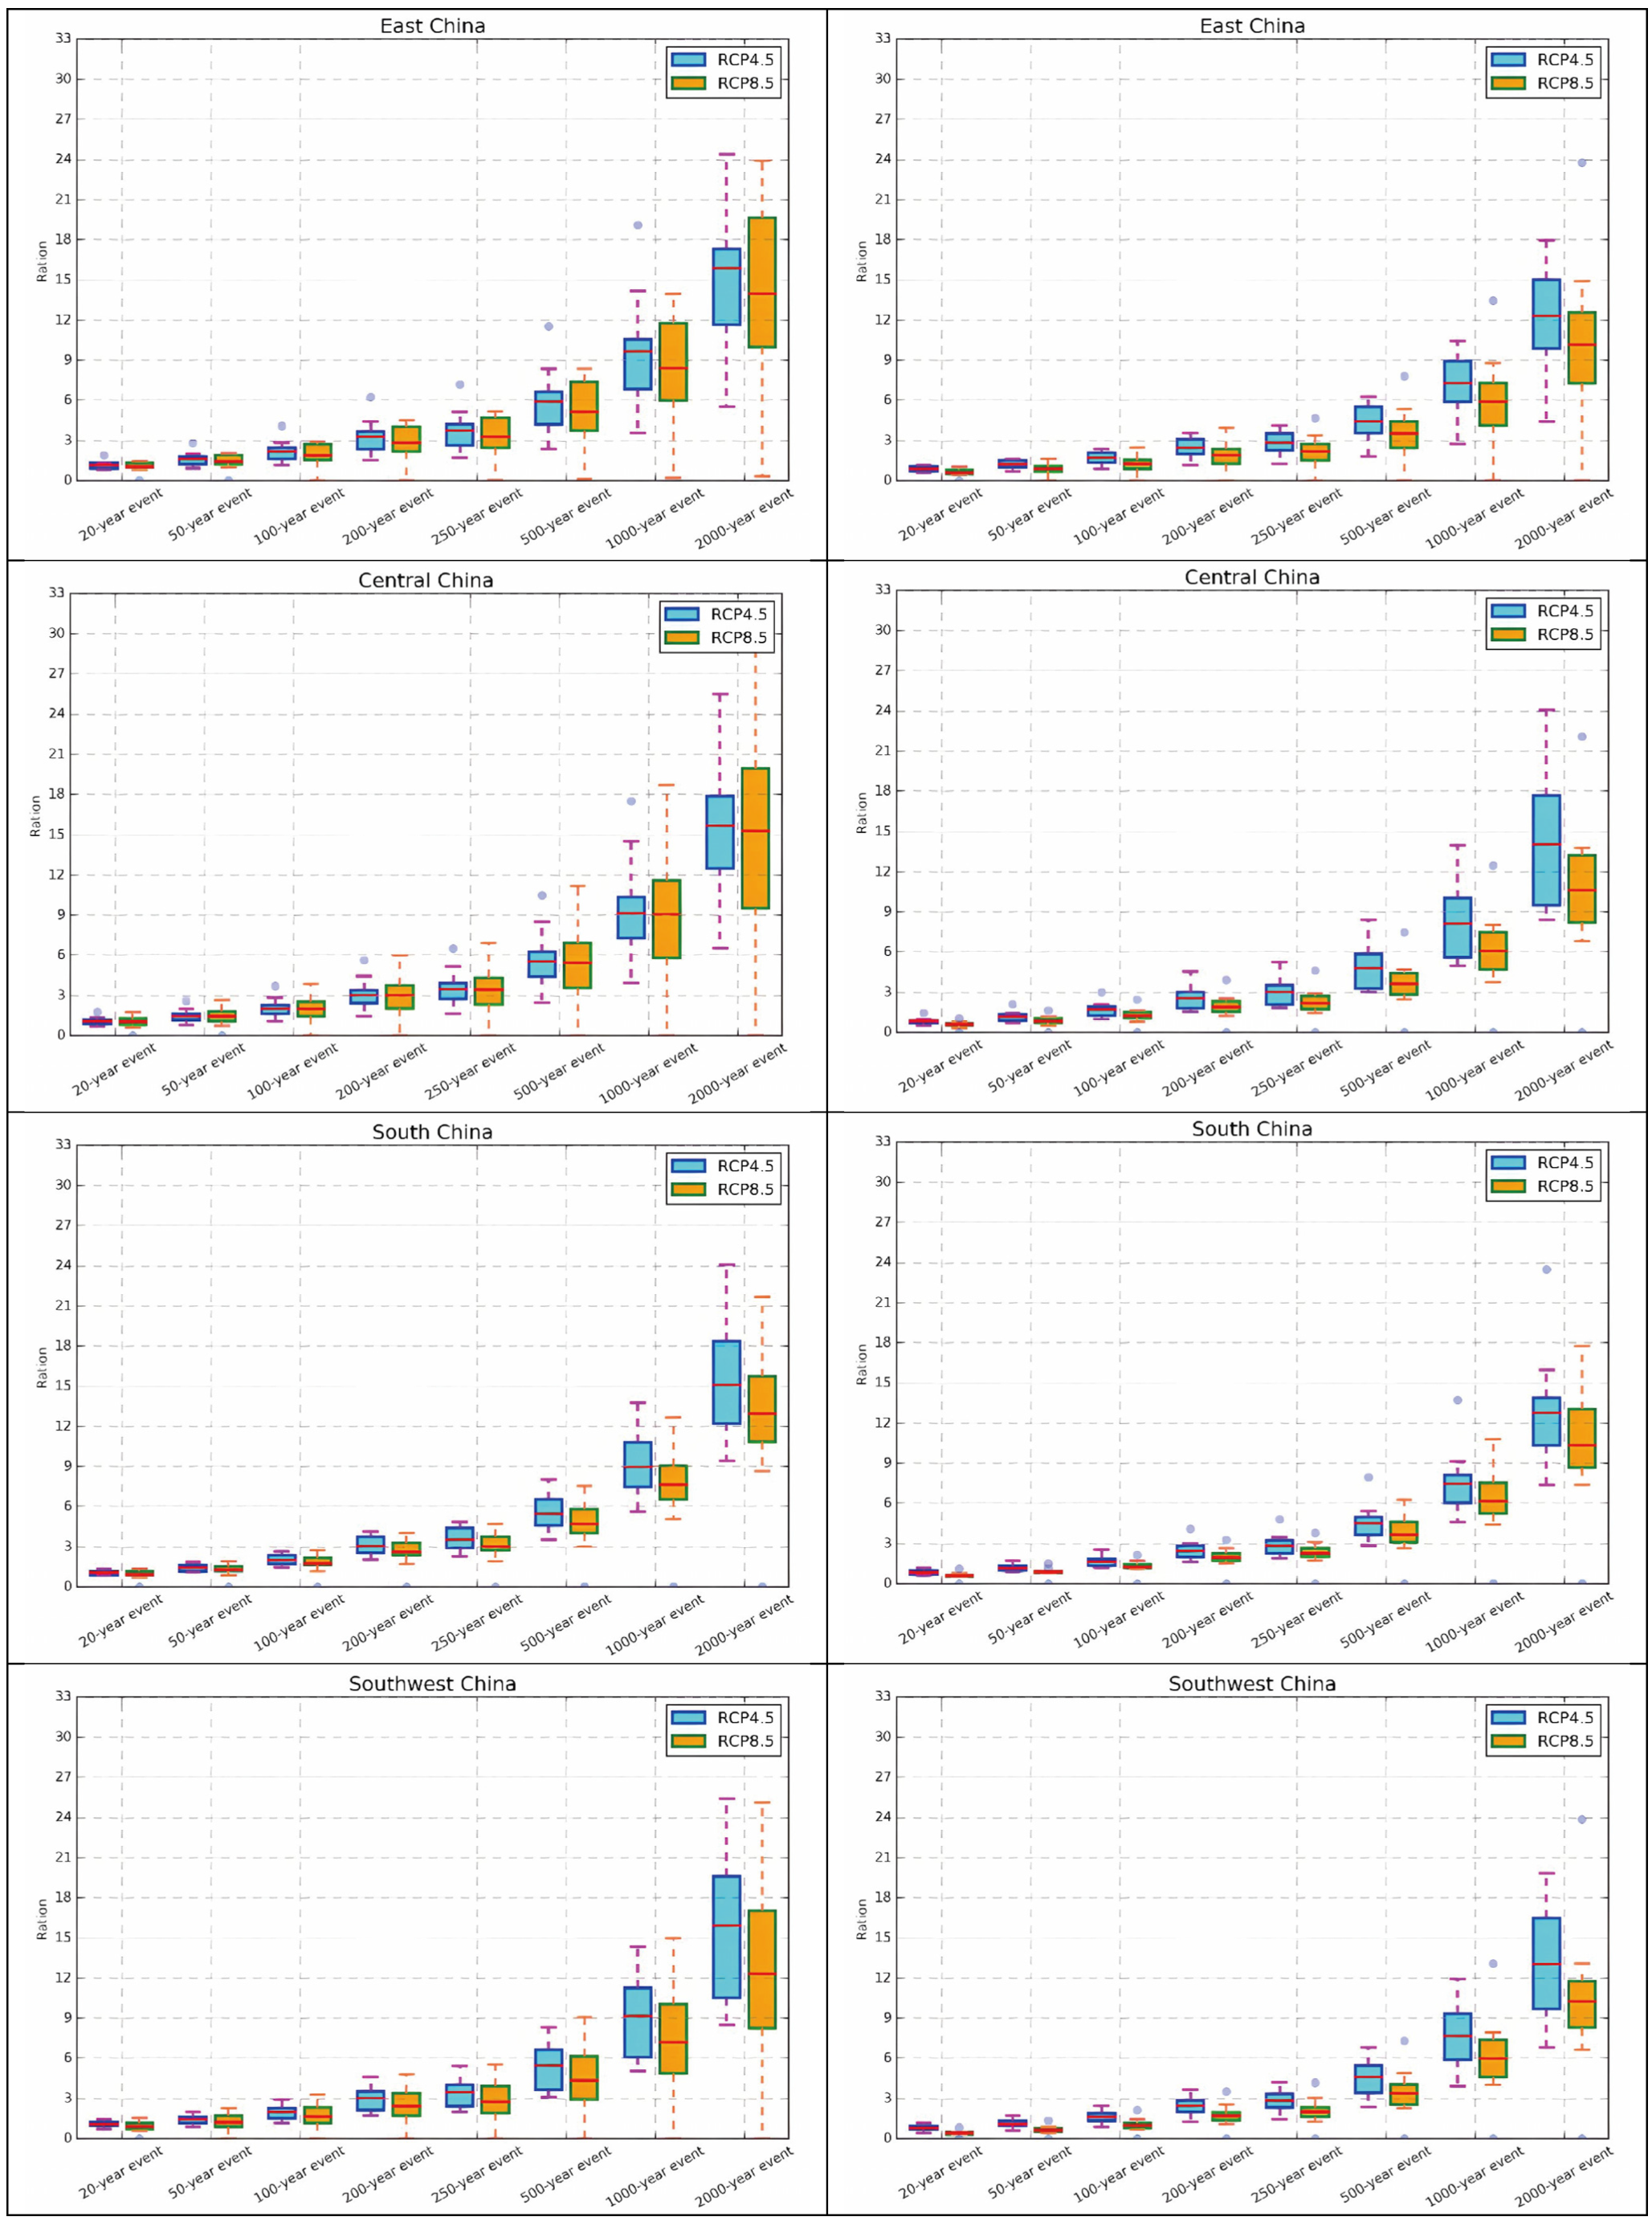
Overall, the spread range of PR derived from the GEV also clearly indicates that the more frequent the extreme precipitation events, the higher the probability in the future (Figure 11). In addition, the PR of extreme precipitation events is much larger under RCP4.5 than that under RCP8.5.

4. Conclusions

This study utilized NEX-GDDP’s 25 km × 25 km CMIP5 projections to estimate variations in precipitation and extreme precipitation events across China throughout the 21st century under RCP4.5 and RCP8.5 scenarios. The key findings regarding precipitation changes are presented as follows:
(1)
Taken as a whole, mean precipitation is projected to increase significantly across China by 1.4% and 2.9% per decade under RCP4.5 and RCP8.5, respectively. Except for Northwest China, annual precipitation is projected to increase significantly (at the 5% significance level). The Tibetan Plateau—specifically the Karakoram Mountain area—shows the most pronounced growth. Under RCP4.5, the rate reaches 9% per decade. This doubles to 16% per decade under RCP8.5.
(2)
Seasonal precipitation patterns reveal marked asymmetry. Winter and spring show robust increases: 13.59%/decade (RCP4.5) and 16.40%/decade (RCP8.5) for winter; 4.30%/decade and 6.33%/decade for spring. Conversely, summer changes remain marginal (−0.27% and 0.88%/decade). Autumn exhibits slight declines (−4.21% and −0.89%/decade). None of these summer or autumn trends reach statistical significance.
(3)
Spatially, winter and spring see widespread gains across China. Summer follows a similar pattern. Most regions experience increases, except for portions of Central China and Northwest China. Autumn presents a contrasting picture. Decreases dominate nationwide. Only Central China, western Northwest China, and the Tibetan Plateau buck this trend.
In terms of changes in precipitation extremes, the main conclusions are as follows:
(1)
PRCPTOT and SDII both show upward trends throughout the 21st century. The increase is steeper under RCP8.5. Under RCP4.5, the Tibetan Plateau sees the largest gain. Under RCP8.5, Southwest China leads.
(2)
Wet days (R1mm) behave differently across zones. Northern and western regions (Northwest, Northeast, North China, Tibetan Plateau) show modest changes. Southern regions see clearer declines. CDD patterns reverse this trend. Dry spells shorten in the south but lengthen in the north and west, especially under RCP8.5.
(3)
Extreme indices (R5D, R95p, R10) spike most dramatically in Southwest China and the Tibetan Plateau. Northwest China shows the weakest response.
(4)
The more extreme the precipitation event, the larger the magnitude of the probability ratio (PR) increase, accompanied by wider model spreads during both the early (2010–2040) and late (2070–2100) 21st century under both scenarios. The PR increase under RCP4.5 exceeds that under RCP8.5 during both periods. All ten models exhibit wider spreads for rarer events. Yet every model agrees: extreme precipitation will become more likely in both the early and late 21st century. This holds true for both emission scenarios.
Based on the 25 km × 25 km MME CMIP5 projections from the NEX-GDDP dataset, this study provides more comprehensive and spatially detailed information on changes in precipitation and precipitation-related climate extremes across China. Nevertheless, these results alone are insufficient for a full assessment of climate change impacts on hydrological processes, water availability, or agricultural productivity. A logical next step involves integrating these high-resolution projections into distributed hydrological models—such as the Soil and Water Assessment Tool (SWAT), Variable Infiltration Capacity (VIC) model, or HBV—to simulate water balance components, streamflow responses, and extreme event dynamics at basin scales. Such modeling efforts would enable more robust evaluations of future water resource availability, flood and drought risks, and the efficacy of adaptive measures in climate-sensitive regions like Northwest China and the Tibetan Plateau. Furthermore, the coupling of downscaled climate outputs with hydrological models offers a pathway to support decision-making in integrated water resource management, particularly under data-scarce conditions.

Author Contributions

Conceptualization, methodology, software, validation, formal analysis, investigation, resources, data curation, writing—original draft preparation, visualization, supervision, project administration, and funding acquisition were conducted primarily by Z.L.; D.G. contributed to conceptualization, investigation, writing—review and editing, and funding acquisition. All authors have read and agreed to the published version of the manuscript.

Funding

This research was funded by the China Fire and Rescue Institute Scientific Research Project [XFKYB202516] and the Research Project on Meteorological Monitoring Support Technology for UAV Swarms in Disaster Scenarios [HZ202402-01].

Institutional Review Board Statement

Not applicable.

Informed Consent Statement

Not applicable.

Data Availability Statement

The data that support the findings of this study were derived from the following resources available in the public domain: [NEX-GDDP | NASA Center for Climate Simulation].

Conflicts of Interest

The authors declare no conflict of interest.

References

  1. Ma, Z.; Shi, Z.; Zhou, Y.; Xu, J.; Yu, W.; Yang, Y. A spatial data mining algorithm for downscaling TMPA 3B43 V7 data over the Qinghai–Tibet Plateau with the effects of systematic anomalies removed. Remote Sens. Environ. 2017, 200, 378–395. [Google Scholar] [CrossRef] [Scilit]
  2. Ma, Y.; Hong, Y.; Chen, Y.; Yang, Y.; Tang, G.; Yao, Y.; Long, D.; Li, C.; Han, Z.; Liu, R. Performance of optimally merged multisatellite precipitation products using the dynamic Bayesian model averaging scheme over the Tibetan Plateau. J. Geophys. Res. 2018, 123, 814–834. [Google Scholar] [CrossRef] [Scilit]
  3. Simonovic, S.P. Bringing future climatic change into water resources management practice today. Water Resour. Manag. 2017, 31, 2933–2950. [Google Scholar] [CrossRef] [Scilit]
  4. Coumou, D.; Rahmstorf, S. A decade of weather extremes. Nat. Clim. Change 2012, 2, 491–496. [Google Scholar] [CrossRef] [Scilit]
  5. Meehl, G.A.; Tebaldi, C. More intense, more frequent, and longer lasting heat waves in the 21st century. Science 2004, 305, 994–997. [Google Scholar] [CrossRef] [Scilit]
  6. Donat, M.G.; Lowry, A.L.; Alexander, L.V.; O’Gorman, P.A.; Maher, N. More extreme precipitation in the world’s dry and wet regions. Nat. Clim. Change 2016, 6, 508. [Google Scholar] [CrossRef] [Scilit]
  7. Kharin, V.V.; Zwiers, F.; Zhang, X.; Wehner, M. Changes in temperature and precipitation extremes in the CMIP5 ensemble. Clim. Change 2013, 119, 345–357. [Google Scholar] [CrossRef] [Scilit]
  8. Gao, X.; Pal, J.S.; Giorgi, F. Projected changes in mean and extreme precipitation over the Mediterranean region from a high resolution double nested RCM simulation. Geophys. Res. Lett. 2006, 33, 3706–3709. [Google Scholar] [CrossRef] [Scilit]
  9. Janssen, E.; Sriver, R.; Wuebbles, D.; Kunkel, K. Seasonal and regional variations in extreme precipitation event frequency using CMIP5. Geophys. Res. Lett. 2016, 43, 5385–5393. [Google Scholar] [CrossRef] [Scilit]
  10. Jiang, Z.; Zhang, X.; Wang, J. Projection of climate change in China in the 21st century by IPCC-AR4 models. Geogr. Res. 2008, 27, 787–799. [Google Scholar]
  11. Jiang, Z.; Song, J.; Li, L.; Chen, W.; Wang, Z.; Wang, J. Extreme climate events in China: IPCC-AR4 model evaluation and projection. Clim. Change 2012, 110, 385–401. [Google Scholar] [CrossRef] [Scilit]
  12. Piao, S.; Ciais, P.; Huang, Y.; Shen, Z.; Peng, S.; Li, J.; Zhou, L.; Liu, H.; Ma, Y.; Ding, Y.; et al. The impacts of climate change on water resources and agriculture in China. Nature 2010, 467, 43–51. [Google Scholar] [CrossRef] [Scilit] [PubMed]
  13. Wang, H.J.; Sun, J.Q.; Chen, H.P.; Zhu, Y.L.; Zhang, Y.; Jiang, D.B.; Lang, X.M.; Fan, K.; Yu, E.T.; Yang, S. Extreme Climate in China: Facts, Simulation and Projection. Meteorol. Z. 2012, 21, 279–304. [Google Scholar] [CrossRef] [Scilit]
  14. Taylor, K.E.; Stouffer, R.J.; Meehl, G.A. An Overview of CMIP5 and the Experiment Design. Bull. Am. Meteorol. Soc. 2012, 93, 485–498. [Google Scholar] [CrossRef] [Scilit]
  15. Zhu, H.; Jiang, Z.; Li, J.; Li, W.; Sun, C.; Li, L. Does CMIP6 inspire more confidence in simulating climate extremes over China? Adv. Atmos. Sci. 2020, 37, 1119–1132. [Google Scholar] [CrossRef] [Scilit]
  16. Chen, H.; Sun, J.; Lin, W.; Xu, H. Comparison of CMIP6 and CMIP5 models in simulating climate extremes. Sci. Bull. 2020, 65, 1415–1418. [Google Scholar] [CrossRef] [Scilit]
  17. Kim, Y.H.; Min, S.K.; Zhang, X.; Sillmann, J.; Sandstad, M. Evaluation of the CMIP6 multi-model ensemble for climate extreme indices. Weather. Clim. Extrem. 2020, 29, 100269. [Google Scholar] [CrossRef] [Scilit]
  18. Wang, D.; Liu, J.; Luan, Q.; Shao, W.; Fu, X.; Wang, H.; Gu, Y. Projection of future precipitation change using CMIP6 multimodel ensemble based on fusion of multiple machine learning algorithms: A case in Hanjiang River Basin, China. Meteorol. Appl. 2023, 30, e2144. [Google Scholar] [CrossRef] [Scilit]
  19. Xin, X.; Wu, T.; Zhang, J.; Yao, J.; Fang, Y. Comparison of CMIP6 and CMIP5 simulations of precipitation in China and the East Asian summer monsoon. Int. J. Climatol. 2020, 40, 6423–6440. [Google Scholar] [CrossRef] [Scilit]
  20. Jiang, D.; Hu, D.; Tian, Z.; Lang, X. Differences between CMIP6 and CMIP5 models in simulating climate over China and the East Asian monsoon. Adv. Atmos. Sci. 2020, 37, 1102–1118. [Google Scholar] [CrossRef] [Scilit]
  21. Xu, H.; Chen, H.; Wang, H. Future changes in precipitation extremes across China based on CMIP6 models. Int. J. Climatol. 2022, 42, 635–651. [Google Scholar] [CrossRef] [Scilit]
  22. Wang, L.; Li, Y.; Li, M.; Li, L.; Liu, F.; Liu, D.; Pulatov, B. Projection of precipitation extremes in China’s mainland based on the statistical downscaled data from 27 GCMs in CMIP6. Atmos. Res. 2022, 280, 106462. [Google Scholar] [CrossRef] [Scilit]
  23. Zhang, J.; Li, C.; Zhang, X.; Zhao, T. Improving simulations of extreme precipitation events in China by the CMIP6 global climate models through statistical downscaling. Atmos. Res. 2024, 303, 107344. [Google Scholar] [CrossRef] [Scilit]
  24. Yang, L.; Yang, Y.; Shen, Y.; Yang, J.; Zheng, G.; Smith, J.; Niyogi, D. Urban development pattern’s influence on extreme rainfall occurrences. Nat. Commun. 2024, 15, 3997. [Google Scholar] [CrossRef] [Scilit]
  25. Thrasher, B.; Wang, W.; Michaelis, A.; Melton, F.; Lee, T.; Nemani, R. NASA Global Daily Downscaled Projections, CMIP6. Sci. Data 2022, 9, 262. [Google Scholar] [CrossRef] [Scilit]
  26. Yang, B.; Wei, L.; Tang, H.; Li, Y.; Wang, Y.; Zhang, F.; Zhou, J.; Zhang, T.; Lv, T. Future changes in extremes across China based on NEX-GDDP-CMIP6 models. Clim. Dyn. 2024, 62, 9587–9617. [Google Scholar]
  27. Guo, J.; Shen, Y.; Wang, X.; Liang, X.; Liu, Z.; Liu, L. Evaluation and projection of precipitation extremes under 1.5 °C and 2.0 °C GWLs over China using bias-corrected CMIP6 models. iScience 2023, 26, 106179. [Google Scholar] [CrossRef] [Scilit]
  28. Sillmann, J.; Kharin, V.; Zwiers, F.; Zhang, X.; Bronaugh, D. Climate extremes indices in the CMIP5 multimodel ensemble: Part 2. Future climate projections. J. Geophys. Res. Atmos. 2013, 118, 2473–2493. [Google Scholar] [CrossRef] [Scilit]
  29. Jiang, D.; Tian, Z.; Lang, X. Reliability of climate models for China through the IPCC Third to Fifth Assessment Reports. Int. J. Climatol. 2016, 36, 1114–1133. [Google Scholar] [CrossRef] [Scilit]
  30. Jie, Z.; Laurent, L.I.; Zhou, T.; Xin, X. Evaluation of Spring Persistent Rainfall over East Asia in CMIP3/CMIP5 AGCM Simulations. Adv. Atmos. Sci. 2013, 30, 1587–1600. [Google Scholar]
  31. Yao, Y.; Luo, Y.; Huang, J.; Zhao, Z. Comparison of Monthly Temperature Extremes Simulated by CMIP3 and CMIP5 Models. J. Clim. 2013, 26, 7692–7707. [Google Scholar] [CrossRef] [Scilit]
  32. Jia, W.; Bo-Tao, Z.; Ying, X. Response of precipitation and its extremes over China to warming: CMIP5 simulation and projection. Chin. J. Geophys. 2015, 58, 461–473. [Google Scholar] [CrossRef] [Scilit]
  33. Thrasher, B.; Maurer, E.P.; Mckellar, C.; Duffy, P.B. Technical Note: Bias correcting climate model simulated daily temperature extremes with quantile mapping. Hydrol. Earth Syst. Sci. 2012, 16, 3309–3314. [Google Scholar] [CrossRef] [Scilit]
  34. Wood, A.W.; Maurer, E.P.; Kumar, A.; Lettenmaier, D.P. Long-range experimental hydrologic forecasting for the eastern United States. J. Geophys. Res. Atmos. 2002, 107, ACL 6-1–ACL 6-15. [Google Scholar] [CrossRef] [Scilit]
  35. Wood, A.W.; Leung, L.R.; Sridhar, V.; Lettenmaier, D.P. Hydrologic Implications of Dynamical and Statistical Approaches to Downscaling Climate Model Outputs. Clim. Change 2004, 62, 189–216. [Google Scholar] [CrossRef] [Scilit]
  36. Maurer, E.P.; Hidalgo, H.G. Utility of daily vs. monthly large-scale climate data: An intercomparison of two statistical downscaling methods. Hydrol. Earth Syst. Sci. 2008, 12, 551–563. [Google Scholar] [CrossRef] [Scilit]
  37. Sheffield, J.; Goteti, G.; Wood, E.F. Development of a 50-Year High-Resolution Global Dataset of Meteorological Forcings for Land Surface Modeling. J. Clim. 2006, 19, 3088–3111. [Google Scholar] [CrossRef] [Scilit]
  38. Bao, Y.; Wen, X. Projection of China’s near- and long-term climate in a new high-resolution daily downscaled dataset NEX-GDDP. J. Meteorol. Res. 2017, 31, 236–249. [Google Scholar] [CrossRef] [Scilit]
  39. Chen, H.-P.; Sun, J.-Q.; Li, H.-X. Future changes in precipitation extremes over China using the NEX-GDDP high-resolution daily downscaled data-set. Atmos. Ocean. Sci. Lett. 2017, 10, 403–410. [Google Scholar] [CrossRef] [Scilit]
  40. Bokhari, S.A.A.; Ahmad, B.; Ali, J.; Ahmad, S.; Mushtaq, H.; Rasul, G. Future Climate Change Projections of the Kabul River Basin Using a Multi-model Ensemble of High-Resolution Statistically Downscaled Data. Earth Syst. Environ. 2018, 2, 477–497. [Google Scholar] [CrossRef] [Scilit]
  41. Frich, P.; Alexander, L.; Dellamarta, P.; Gleason, B.; Haylock, M.; Klein Tank, A.; Peterson, T. Observed coherent changes in climatic extremes during the second half of the twentieth century. Clim. Res. 2002, 19, 193–212. [Google Scholar] [CrossRef] [Scilit]
  42. Tank, A.M.K.; Zwiers, F.W.; Zhang, X. Guidelines on Analysis of Extremes in a Changing Climate in Support of Informed Decisions for Adaptation; WMO: Geneva, Switzerland, 2009. [Google Scholar]
  43. Zhang, X.; Alexander, L.; Hegerl, G.C.; Jones, P.; Tank, A.K.; Peterson, T.C.; Trewin, B.; Zwiers, F.W. Indices for monitoring changes in extremes based on daily temperature and precipitation data. Wiley Interdiscip. Rev. Clim. Change 2011, 2, 851–870. [Google Scholar] [CrossRef] [Scilit]
  44. Jiyun, X.U.; Shi, Y.; Gao, X.J.; Filippo, G. Projected changes in climate extremes over China in the 21st century from a high resolution regional climate model (RegCM3). Sci. Bull. 2013, 58, 1443–1452. [Google Scholar]
  45. Li, W.; Jiang, Z.; Zhang, X.; Li, L.; Sun, Y. Additional risk in extreme precipitation in China from 1.5 °C to 2.0 °C global warming levels. Sci. Bull. 2018, 63, 228–234. [Google Scholar] [CrossRef] [Scilit] [PubMed]
  46. Tabari, H.; Marofi, S.; Aeini, A.; Talaee, P.H.; Mohammadi, K. Trend analysis of reference evapotranspiration in the western half of Iran. Agric. For. Meteorol. 2011, 151, 128–136. [Google Scholar] [CrossRef] [Scilit]
  47. Tabari, H.; Marofi, S. Changes of Pan Evaporation in the West of Iran. Water Resour. Manag. 2011, 25, 97–111. [Google Scholar] [CrossRef] [Scilit]
  48. Douglas, E.M.; Vogel, R.M.; Kroll, C.N. Trends in floods and low flows in the United States: Impact of spatial correlation. J. Hydrol. 2000, 240, 90–105. [Google Scholar] [CrossRef] [Scilit]
  49. You, Q.; Min, J.; Kang, S. Rapid warming in the Tibetan Plateau from observations and CMIP5 models in recent decades. Int. J. Climatol. 2016, 36, 2660–2670. [Google Scholar] [CrossRef] [Scilit]
  50. Wu, C.; Huang, G.; Yu, H. Prediction of extreme floods based on CMIP5 climate models: A case study in the Beijiang River basin, South China. Hydrol. Earth Syst. Sci. 2015, 19, 1385–1399. [Google Scholar] [CrossRef] [Scilit]
  51. Mann, H.B. Nonparametric tests against trend. Econom. J. Econom. Soc. 1945, 13, 245–259. [Google Scholar] [CrossRef] [Scilit]
  52. Gocic, M.; Trajkovic, S. Analysis of changes in meteorological variables using Mann-Kendall and Sen’s slope estimator statistical tests in Serbia. Glob. Planet. Change 2013, 100, 172–182. [Google Scholar] [CrossRef] [Scilit]
  53. Sen, P.K. Estimates of the regression coefficient based on Kendall’s tau. J. Am. Stat. Assoc. 1968, 63, 1379–1389. [Google Scholar] [CrossRef]
  54. Kharin, V.V.; Zwiers, F.W.; Zhang, X.; Hegerl, G.C. Changes in Temperature and Precipitation Extremes in the IPCC Ensemble of Global Coupled Model Simulations. J. Clim. 2007, 20, 1419–1444. [Google Scholar] [CrossRef] [Scilit]
  55. Fischer, E.M.; Knutti, R. Anthropogenic contribution to global occurrence of heavy-precipitation and high-temperature extremes. Nat. Clim. Change 2015, 5, 560–564. [Google Scholar] [CrossRef] [Scilit]
  56. Zhang Xinyi, F.G.; Wen, X.; Ye, J.; Guo, Y. Statistical Model and Threshold Value Selection of Gridded Daily Precipitation Extremes in China. Clim. Change Res. 2017, 13, 346–355. [Google Scholar]
  57. Wuebbles, D.; Meehl, G.; Hayhoe, K.; Karl, T.R.; Kunkel, K.; Santer, B.; Wehner, M.; Colle, B.; Fischer, E.M.; Fu, R.; et al. CMIP5 Climate Model Analyses: Climate Extremes in the United States. Bull. Am. Meteorol. Soc. 2014, 95, 571–583. [Google Scholar] [CrossRef] [Scilit]
  58. Kharin, V.V.; Zwiers, F.W. Changes in the Extremes in an Ensemble of Transient Climate Simulations with a Coupled Atmosphere–Ocean GCM. J. Clim. 2000, 13, 3760–3788. [Google Scholar] [CrossRef] [Scilit]
  59. Xu, Y.; Wu, J.; Shi, Y.; Zhou, B.T.; Li, R.K.; Wu, J. Change in extreme climate events over China based on CMIP5. Atmos. Oceanic. Sci. Lett. 2015, 8, 185–192. [Google Scholar]
  60. IPCC. Climate Change 2021: The Physical Science Basis. Contribution of Working Group I to the Sixth Assessment Report of the Intergovernmental Panel on Climate Change; Cambridge University Press: Cambridge, UK, 2021. [Google Scholar]
Figure 1. Schematic illustration of the eight climatic sub-regions across China.
Atmosphere 17 00330 g001
Figure 2. Spatial pattern of projected annual total precipitation changes trend and rate (%/decade) under scenario RCP4.5 (a) and RCP8.5 (b) by using MME in the 21st century. Cross-hatched areas denote pixels lacking statistical significance (α = 0.05) in the Mann–Kendall trend test.
Atmosphere 17 00330 g002
Figure 3. Regional asymmetry in 21st-century annual precipitation changes under RCP4.5 (a) and RCP8.5 (b), expressed as percentage anomalies from the 1961–1990 baseline. Trend significance (MK test, α = 0.05) is indicated by star-filled symbols (red: positive; blue: negative).
Atmosphere 17 00330 g003
Figure 4. Box and whisker plots of projected precipitation change rate (%/decade) over eight sub-regions in the 21st century under RCP4.5 (cyan) and RCP8.5 (orange). Boxes denote the interquartile range (25th–75th percentiles), horizontal lines represent the MME median, and whiskers indicate the full range of model outputs.
Atmosphere 17 00330 g004
Figure 5. Seasonal precipitation change rates (%/decade) for 1961–1990 baseline under RCP4.5 (a,c,e,g) and RCP8.5 (b,d,f,h). Winter (top), spring, summer and autumn from top to bottom. Hatched areas indicate insignificant Mann–Kendall trends.
Atmosphere 17 00330 g005aAtmosphere 17 00330 g005b
Figure 6. Heatmap of Sen’s slope for seasonal precipitation trends across eight sub-regions during the 21st century under RCP4.5 (a) and RCP8.5 (b). Values in red with asterisks denote statistical significance at the 5% level.
Atmosphere 17 00330 g006
Figure 7. Box and whisker plots of projected seasonal precipitation change rates (%/decade) across eight sub-regions for the 21st century under RCP4.5 (a) and RCP8.5 (b). Boxes denote interquartile ranges (25th–75th percentiles), horizontal lines mark MME medians, and whiskers extend to the full model range.
Atmosphere 17 00330 g007
Figure 8. Temporal evolution of three precipitation extreme indices over China sub-regions: (a,b) PRCPTOT (%), (c,d) R1mm (days), and (e,f) SDII (%) relative to 1961–1990. Left panels (a,c,e): RCP4.5; right panels (b,d,f): RCP8.5. Red/blue stars indicate statistically significant positive/negative trends (MK test, p < 0.05).
Atmosphere 17 00330 g008
Figure 9. Temporal variation in RX5day (a,b), R95p (c,d), R10mm (e,f) and CDD (g,h) anomalies under RCP4.5 (left) and RCP8.5 (right). Units and significance markers follow Figure 8.
Atmosphere 17 00330 g009
Figure 10. Regional PR values for extreme precipitation in China. (a,b) Early century projections (2010–2040). (c,d) Late-century projections (2070–2100). Left column: RCP4.5 scenario. Right column: RCP8.5 scenario. All values are relative to the 1961–1990 reference period.
Atmosphere 17 00330 g010
Figure 11. Projection spread range of probability ratio (PR) over eight sub-regions for precipitation extreme events during 2010–2040 (left) and 2070–2100 (right) by using 10 GCMs under scenario RCP4.5 (cyan color) and RCP8.5 (orange color). MME is indicated by the horizontal red lines within boxes.
Atmosphere 17 00330 g011aAtmosphere 17 00330 g011b
Table 1. Specifications of the 10 CMIP5 climate models employed in this study.
AffiliationModelNative Resolution
(Lon × Lat, °)
Country
Centre National de Recherches MeteorologiquesCNRM-CM51.40° × 1.40°France
Institute Pierre-Simon LaplaceIPSL-CM5A-MR1.267° × 3.750°France
Max Planck Institute for MeteorologyMPI-ESM-MR1.875° × 1.875°Germany
National Science Foundation, Department of Energy, National Center for Atmospheric ResearchCESM-BGC0.94° × 1.25°USA
National Center for Atmospheric ResearchCCSM40.94° × 1.25°USA
Commonwealth Scientific and Industrial Research Organization and Bureau of MeteorologyACCESS1.01.25° × 1.875°Australia
Commonwealth Scientific and Industrial Research Organisation in collaboration with the Queensland Climate Change Centre of ExcellenceCSIRO-Mk3.6.01.875° × 1.875°Australia
Institute for Numerical MathematicsINM-CM42.0° × 1.5°Russia
Atmosphere and Ocean Research Institute (The University of Tokyo), National Institute for Environmental Studies, and Japan Agency for Marine-Earth Science and TechnologyMIROC51.40° × 1.40°Japan
Meteorological Research InstituteMRI-CGCM31.125° × 1.125°Japan
Table 2. Summary of precipitation extreme indices used in this study.
IndexFull NameDefinitionUnits
CDDConsecutive dry daysMaximum number of consecutive days when precipitation <1 mmdays
PRCPTOTAnnual total wet-day precipitationAnnual total precipitation from days ≥1 mmmm
R1mmNumber of precipitation daysAnnual count when daily precipitation ≥1 mmdays
R10mmNumber of heavy precipitation daysAnnual count when precipitation ≥10 mmdays
R95pStrong precipitation eventsThe fraction of annual total precipitation due to events exceeding the 1961–1990 95th percentile%
RX5dayMax 5-day precipitation amountAnnual maximum consecutive 5-day precipitationmm
SDIISimple daily intensity indexThe ratio of annual total precipitation to the number of wet days (≥1 mm)mm/day
Table 3. Projected changes in regional mean annual precipitation (%/decade) under RCP4.5 and RCP8.5 scenarios.
RegionRCP4.5RCP8.5
Northwest China1.03 *1.88 *
North China0.821.96 *
Northeast China1.13 *2.22 *
Tibetan Plateau2.55 *5.04 *
Southwest China1.34 *2.71 *
South China0.93 *0.99 *
Central China1.24 *1.74 *
East China1.17 *1.50 *
* The results are statistically significant (p < 0.05), with positive values indicating upward trends and negative values showing downward trends.
Disclaimer/Publisher’s Note: The statements, opinions and data contained in all publications are solely those of the individual author(s) and contributor(s) and not of MDPI and/or the editor(s). MDPI and/or the editor(s) disclaim responsibility for any injury to people or property resulting from any ideas, methods, instructions or products referred to in the content.