Article

Simulation of Temperature and Water Vapor Profiles Retrieved from FORUM and IASI-NG Measurements

1
Istituto Universitario di Studi Superiori, Piazza della Vittoria 15, 27100 Pavia, Italy
2
Istituto per la BioEconomia del Consiglio Nazionale delle Ricerche, Via Madonna del Piano 10, 50019 Sesto Fiorentino, Italy
3
Istituto di Fisica Applicata “Nello Carrara” del Consiglio Nazionale delle Ricerche, Via Madonna del Piano 10, 50019 Sesto Fiorentino, Italy
*
Authors to whom correspondence should be addressed.
These authors contributed equally to this work.
Atmosphere 2026, 17(3), 329; https://doi.org/10.3390/atmos17030329
Submission received: 2 March 2026 / Revised: 17 March 2026 / Accepted: 18 March 2026 / Published: 23 March 2026
(This article belongs to the Section Atmospheric Techniques, Instruments, and Modeling)

Abstract

To advance our understanding of atmospheric processes and climate dynamics, improved knowledge of outgoing long-wave radiation (OLR) spectral emission is essential. The FORUM mission, selected for the ninth cycle of the European Space Agency’s Earth Explorer programme, is specifically designed to address the long-standing observational gap in the far-infrared (FIR) spectral region. When combined with measurements from the IASI-NG instrument, FORUM will provide complete spectral coverage of Earth’s OLR emission (spanning 100 to 2760 cm−1 wavenumber, or 3.62 to 100 μm wavelength), thereby enabling robust climate model validation and enhanced understanding of climate change processes. While IASI-NG’s primary mission is to support numerical weather prediction, FORUM is designed to measure key climate variables, which also enable the retrieval of atmospheric parameters in the troposphere and lower stratosphere. In this study, we assess the information content of FORUM and IASI-NG measurements for atmospheric profiling through a simulation-based approach. Synthetic retrieval products are generated using a linearized formulation of the retrieval transfer function, allowing an efficient and physically consistent evaluation of the sensitivity of the two instruments to atmospheric temperature and water vapor profiles. The analysis reveals a non-negligible sensitivity of FORUM to atmospheric temperature extending into the stratosphere, resulting in significant information content at altitudes higher than previously reported. This finding highlights the potential of far-infrared observations to contribute to atmospheric temperature profiling beyond the lower troposphere. The complementary capabilities of FORUM and IASI-NG suggest that their combined use can enhance the characterization of the atmospheric thermal structure. These results represent a first step toward evaluating the potential role of FORUM Level-2 products in future numerical weather prediction applications.

1. Introduction

Accurate measurements of outgoing longwave radiation (OLR), particularly across the infrared spectral domain, including the far-infrared (FIR), are essential for improving climate and weather prediction models. Such measurements enhance our understanding of atmospheric processes and can support more reliable forecasting of extreme weather events. FIR observations have historically been limited due to technical challenges, including sensitivity to surface emissivity, cloud contamination, and partial atmospheric absorption by various species. Consequently, despite the critical importance of OLR for climate studies, few space missions have systematically sampled this spectral region, particularly in the FIR [1].
The FORUM (Far-Infrared Outgoing Radiation Understanding and Monitoring) mission [2], selected as European Space Agency’s (ESA) 9th Earth Explorer mission and scheduled for launch in mid 2028, was specifically designed to address these observational gaps. Operating in tandem with the IASI-NG (Infrared Atmospheric Sounding Interferometer—New Generation) instrument, FORUM will enable comprehensive measurements of the Earth’s OLR spectrum from 100 to 2760 cm−1 (3.62 to 100 μm wavelength). FORUM will cover the FIR spectral range between 100 and 1600 cm−1 with a spectral resolution of 0.5 cm−1, while IASI-NG will provide measurements in the mid-infrared range (MIR) between 645 and 2760 cm−1 with higher spectral resolution. Together, these observations will significantly improve our understanding of Earth’s radiation budget [3] and advance climate research [4]. The FORUM instrument employs a Fourier-transform spectrometer to map Earth’s atmosphere and surface, with measurement footprints of approximately 15 km in diameter. By providing accurate FIR measurements, FORUM addresses a critical gap in Earth observation: a substantial portion of outgoing thermal energy resides in the FIR, a region particularly sensitive to key atmospheric climate variables such as water vapor, ice clouds, and temperature. One primary objective of the mission is to evaluate how these new measurements will enhance climate models. In addition, FIR observations from FORUM will help constrain cloud radiative properties, which remain poorly understood despite their crucial role in modulating Earth’s radiation budget and influencing cloud optical and microphysical characteristics. Looking forward, an interesting scientific question is whether FORUM measurements can be effectively assimilated into operational forecast models, potentially improving weather prediction capabilities through the unique information content provided by FIR observations.
Previous studies have shown that temperature and water vapor retrievals from FORUM measurements are generally most accurate in the lower troposphere (up to approximately 5 km altitude) [5,6]. This is consistent with FORUM’s design, which maximizes spectral sensitivity in the infrared region, providing high information content primarily within tropospheric levels. However, in this work, we demonstrate that FORUM exhibits unexpected sensitivity to temperature variations in the upper atmosphere, expanding its potential applicability beyond the initially targeted lower layers.
IASI-NG, launched in August 2025 aboard the MetOp-SG (Meteorological Operational satellite—Second Generation) A1 satellite, is a high-performance atmospheric sounder building on the success of the original IASI (Infrared Atmospheric Sounding Interferometer) instrument. IASI-NG offers enhanced spectral resolution and radiometric accuracy, enabling detailed retrievals of atmospheric temperature and humidity profiles, trace gases, cloud properties, and surface temperatures. Covering the mid-infrared spectral range (645–2760 cm−1) with a spatial resolution of 12 km at nadir, IASI-NG delivers global observations critical for weather forecasting, air-quality monitoring, and climate research. It is important to emphasize that IASI-NG is an operational mission that continues the observations of IASI with a planned operational coverage of more than 20 years (three IASI-NG instruments will equip the MetOp-SG satellite series, with each satellite having a nominal lifetime of 7.5 years, ensuring full temporal coverage over a 21-year period), while FORUM is an Earth Explorer mission, with a planned mission lifetime of 3 years. Therefore, FORUM’s primary objective is scientific research rather than operational, specifically aimed at verifying in which aspects of atmospheric physics and climate the FORUM observations in the far-infrared can contribute.
Prior to satellite launch and/or to the availability of the operational products, synthetic measurements are generated to simulate the OLR spectra that FORUM and IASI-NG will observe. These simulations use line-by-line radiative transfer models such as LBLRTM [7] (Line-By-Line Radiative Transfer Model) and KLIMA [4], or faster approximation-based codes like SIGMA-FORUM [8]. In this work, we use a simplified procedure that bypasses conventional retrieval, directly generating simulated profiles based on the true atmospheric state and first-order transfer function approximations [9]. Using these profiles, we present simulated retrieval products for water vapor, temperature, surface temperature, and emissivity, and discuss the performance characteristics of FORUM and IASI-NG in capturing these atmospheric parameters.
The present study is part of a new broader research framework aimed at assessing the potential contribution of far-infrared observations to numerical weather prediction. Unlike what has been done so far, where most studies focused on radiance observations, our analysis focuses on retrieved atmospheric variables, primarily temperature and water vapor profiles, obtained through a simulation of the retrieval process.
The objective of this work is to quantify the information content and expected retrieval accuracy of each instrument, providing a necessary preliminary step toward future assimilation-oriented studies, testing the use of Level 2 products. The method presented in this study can be used to simulate a large number of Level 2 data that can be ingested by data assimilation systems to assess the contribution of the simulated observations to numerical weather forecasting.
This paper is structured as follows: Section 2.1 describes the FORUM and IASI-NG missions and instrumentation, Section 2.2 presents the theoretical approach and methodology, Section 2.3 describes the generation of synthetic observations and simulated retrieval products, Section 3 presents the results of the simulated retrievals for each instrument and provides a quantitative comparison of the complementary capabilities of FORUM and IASI-NG. Section 5 draws the conclusions.

2. Materials and Methods

2.1. FORUM and IASI-NG Missions

The FORUM mission, recently selected as ESA’s ninth Earth Explorer mission and scheduled for launch in 2028, is an exploratory project aimed at closing a critical observational gap in the Earth’s emission spectrum [2,10,11,12,13]. Approximately 99% of the Earth’s thermal radiation lies within the OLR spectral range, between 100 and 2500 cm−1, with roughly half of this energy originating from the far-infrared (FIR, 100–667 cm−1). Despite its importance, the FIR part of the OLR spectrum has never been systematically measured from space due to technological limitations, leaving significant uncertainty in the assessment of its role in the Earth’s energy budget [2].
The primary goal of FORUM is to resolve the FIR component of the Earth’s emitted spectrum with high spectral resolution and absolute accuracy. This capability will allow the scientific community to better constrain the physical mechanisms driving atmospheric processes, thereby improving climate models. The lack of FIR observations has so far limited our understanding of key processes, such as the role of water vapor as a greenhouse gas, its modulation by clouds, and the influence of surface emissivity. FORUM will provide accurate information on the distribution of atmospheric water vapor, the absorption mechanisms under different climate conditions—particularly in hot and humid regions—and offer detailed insights into cloud microphysics. At high latitudes, where the atmosphere is relatively transparent in the FIR, FORUM will also enable the characterization of surface longwave emission, including the emissivity of frozen surfaces [2].
The FORUM mission will rely on a Fourier-transform spectrometer designed to measure the upwelling OLR in nadir geometry [2,10]. The instrument acquires circular ground pixels of about 15 km in diameter and maintains a fixed footprint during the ∼ 8 s acquisition time through continuous pointing compensation to counteract satellite motion (step-and-stare mode). As no across-track scanning is planned, the along-track separation between successive observations is approximately 100 km . The measured interferograms will be processed into geolocated and calibrated spectral radiances over the 100– 1600 cm 1 interval, with an unapodized spectral resolution of 0.5 cm 1 (FWHM, full width half maximum) and a sampling step of ∼ 0.36 cm 1 . The noise-equivalent spectral radiance (NESR) is expected to meet the mission goal requirements, namely 40 nW ( cm 2 sr cm 1 ) 1 in the 200– 800 cm 1 range and 100 nW ( cm 2 sr cm 1 ) 1 elsewhere, whereas the absolute radiometric accuracy (ARA) is required to be significantly smaller than the NESR [6].
FORUM will be embarked on a Sun-synchronous, polar-orbiting satellite with an inclination of 98.7°, a mean local solar time of 09:30 at the descending node, an altitude of approximately 830 km , and a repeat cycle of 29 days. These orbital characteristics are coincident with those of the MetOpSG-A platform hosting IASI-NG, as required by the FORUM mission requirements [14], which mandate a temporal co-registration between FORUM and IASI-NG observations of less than 1 min and an across-track separation of less than 100 km. This orbital design ensures coordinated spatial and temporal sampling between the two sensors, enabling the synergistic use of their complementary spectral observations.
The Infrared Atmospheric Sounding Interferometer-New Generation (IASI-NG) is the next-generation hyperspectral infrared sounder developed by the European Organisation for the Exploitation of Meteorological Satellites (EUMETSAT) and the Centre National d’Études Spatiales (CNES) as part of the MetOp Second Generation (MetOpSG) program [15,16,17,18,19]. IASI-NG is designed to ensure operational continuity of the highly successful IASI mission while providing enhanced capabilities crucial for numerical weather prediction (NWP) applications. The instrument features improved spectral resolution (0.25 cm−1 compared to 0.5 cm−1 of IASI), enhanced radiometric accuracy, and reduced instrumental noise, enabling more accurate retrievals of atmospheric temperature and humidity profiles that are essential inputs for NWP data assimilation systems. Operating in the thermal infrared spectral range from 645 to 2760 cm−1 (3.62 to 15.5 μm), IASI-NG will maintain the long-term operational monitoring capability established by IASI, with three units planned for the MetOpSG series to guarantee continuous atmospheric observations well into the 2040s. The first IASI-NG instrument was successfully launched aboard MetOpSG-A on August 2025, marking the beginning of this new era in operational meteorological sounding. The instrument employs a detector array that simultaneously observes a 4 × 4 set of ground pixels, each with a diameter of 12 km , defining its field of regard (FOR). Global coverage is achieved through across-track scanning, enabling the acquisition of up to seven FORs on each side of the satellite track. According to [18], IASI-NG provides apodized spectra characterized by a Gaussian response function with a spectral resolution (FWHM) of 0.25 cm−1 and a sampling step of 0.125 cm−1. Its NESR is approximately half that of the current IASI instrument on board MetOp, while the ARA requirement specifies an accuracy better than 0.25 K ( 2 σ ) at a blackbody temperature of 280 K . Table 1 summarizes the main instrumental specifications for the two missions.

2.2. Simulation of FORUM and IASI-NG Measurements

2.2.1. Inverse Problem of a Remote Measurement

Measurements obtained through remote sensing are typically in the form of radiance. From these radiance measurements, it is possible to infer information about the atmospheric state—such as temperature, humidity, and gas concentrations—solving the inverse problem [20,21,22].
Let us assume the radiance measurements can be represented as a vector, where every element represents the radiance corresponding to a determined frequency of the spectrum:
y = [ y 1 , y 2 , , y n ] .
The goal of the inverse problem is to determine the corresponding atmospheric state vector:
x = [ x 1 , x 2 , , x n ] ,
where the different x i represent the values of one or more atmospheric parameters, which, in the case they can be represented on levels of altitude or pressure, we talk about vertical profiles of the atmospheric parameters. The relationship between the atmospheric state and the measurements is described by a forward model f ( x ) , such that
y = f ( x ) + ε ,
where ε represents the measurement noise. Due to the presence of this noise term, there is no longer a unique mapping between a specific atmospheric state and a given measurement. Furthermore, the solution of the inverse problem is often ill-posed [23].
According to Bayes’ Theorem [24], in the context of optimal estimation approach [20], the posterior probability of a state x given a measurement y is
P ( x | y ) = P ( y | x ) · P ( x ) P ( y ) ,
where
  • P ( y | x ) : likelihood of observing the measurement y given the state x
  • P ( x ) : prior probability of the state x
  • P ( y ) : marginal probability of the measurement y , which serves as a normalization constant.
In order to obtain an explicit retrieval of the atmospheric state, we can select the maximum a posteriori (MAP) estimate, which corresponds to the state that maximizes the posterior probability:
x ^ = arg max x P ( x | y ) .

2.2.2. Linearization of the Transfer Function

Since we know the true atmospheric state for which we wish to simulate the retrieved state as seen by FORUM and IASI-NG instruments, we can adopt a simple way that does not involve to make a retrieval and is based on the first order approximation of the transfer function. In particular, in this work we apply the method described in [9], in order to obtain simulations of retrieved profiles in a simple and efficient way.
The overall measurement and retrieval process can be considered as a function—the transfer function—mapping the true state vector x t into the retrieved state vector x ^ , which also depends on the measurement noise ε . Thus
x ^ = x ^ ( y ) = x ^ ( f ( x t ) + ε ) x ^ ( x t , ε ) .
We expand the transfer function at first order around the a priori state vector and zero errors ( x t = x a and ε = 0 ):
x ^ ( x t , ε ) x ^ ( x a , 0 ) + 𝜕 x ^ ( x t , ε ) 𝜕 x t x t = x a ε = 0 ( x t x a ) + 𝜕 x ^ ( x t , ε ) 𝜕 ε x t = x a ε = 0 ε .
Using the fact that in the case of the optimal estimation method:
x ^ ( x a , 0 ) = x a ,
and assuming that the derivatives are approximately the same if calculated in x a or x ^ , we can write:
𝜕 x ^ ( x t , ε ) 𝜕 x t x t = x a ε = 0 A , 𝜕 x ^ ( x t , ε ) 𝜕 ε x t = x a ε = 0 𝜕 x ^ ( y ) 𝜕 y y = f ( x ^ ) = G ,
A being the averaging kernel matrix (AKM) given by
A = K T S y 1 K + S a 1 1 K T S y 1 K ,
where K is the Jacobian matrix, i.e., K = 𝜕 y 𝜕 x x t = x ^ ε = 0 , S a is the a priori covariance matrix, S y is the measurement error covariance matrix and G is the gain matrix, given by
G = K T S y 1 K + S a 1 1 K T S y 1 ,
which represents the sensitivity of the retrieved state vector x ^ to the measurements y .
The AKM represents the sensitivity of the retrieved state vector x ^ to the true state vector x t and when A is close to the identity matrix, the retrieved state vector depends only on the true state vector and not on the a priori information.
Hence, using Equations (7)–(9), we can express the simulated retrieval vector x ^ as
x ^ = x a + A ( x t x a ) + σ
where σ = G ε is the error term, obtained applying G to the noise error ε on the radiance.
The error term σ is modelled as Gaussian noise with zero mean and covariance matrix S noise :
σ N ( 0 , S noise )
S noise = K T S y 1 K + S a 1 1 K T S y 1 K K T S y 1 K + S a 1 1 ,
which depends on the Jacobian of the forward model ( K ), on the assumed uncertainties in the measurements ( S y ) and on the prior knowledge ( S a ).
The following sections will detail the procedure used to generate simulated atmospheric profiles as measured by the FORUM and IASI-NG instruments.

2.3. Analysis

The analysis presented in this section is based on Level-2 synthetic measurements generated within an Observing System Simulation Experiment (OSSE) framework, corresponding to retrieved atmospheric states from FORUM and IASI-NG for simulated observations over the Mediterranean basin, with particular emphasis on the Italian peninsula. Since neither instrument has yet provided operational Level-2 products—IASI-NG being in its commissioning phase and FORUM still in the preparatory stage—synthetic observations derived from simulated atmospheric profiles represent the only viable approach for evaluating their retrieval capabilities at this stage.
For the generation of synthetic data, we selected a case study over the Mediterranean region, with a focus on the Italian peninsula. This area was chosen given its complex orography and its susceptibility to high-impact weather events, which make it a particularly relevant testbed for the assessment of new observing systems. The selected scenario corresponds to the 06:00 UTC (Coordinated Universal Time) forecast of 24 July 2024, characterized by largely clear-sky conditions over the domain covered by the two sensors. A few hours later, scattered convective cells developed across the area, producing localized precipitation of moderate to high intensity. Starting from a clear-sky atmospheric state was considered preferable, as it significantly simplifies the forward simulation and retrieval steps by removing the complexity associated with cloud–radiation interactions. At the same time, focusing on a pre-convective scenario is scientifically meaningful, as such situations are among the most challenging for numerical weather prediction and are expected to show the largest potential benefit from the assimilation of new satellite observations sensitive to temperature and water vapor.

2.3.1. Generation of Synthetic Observations

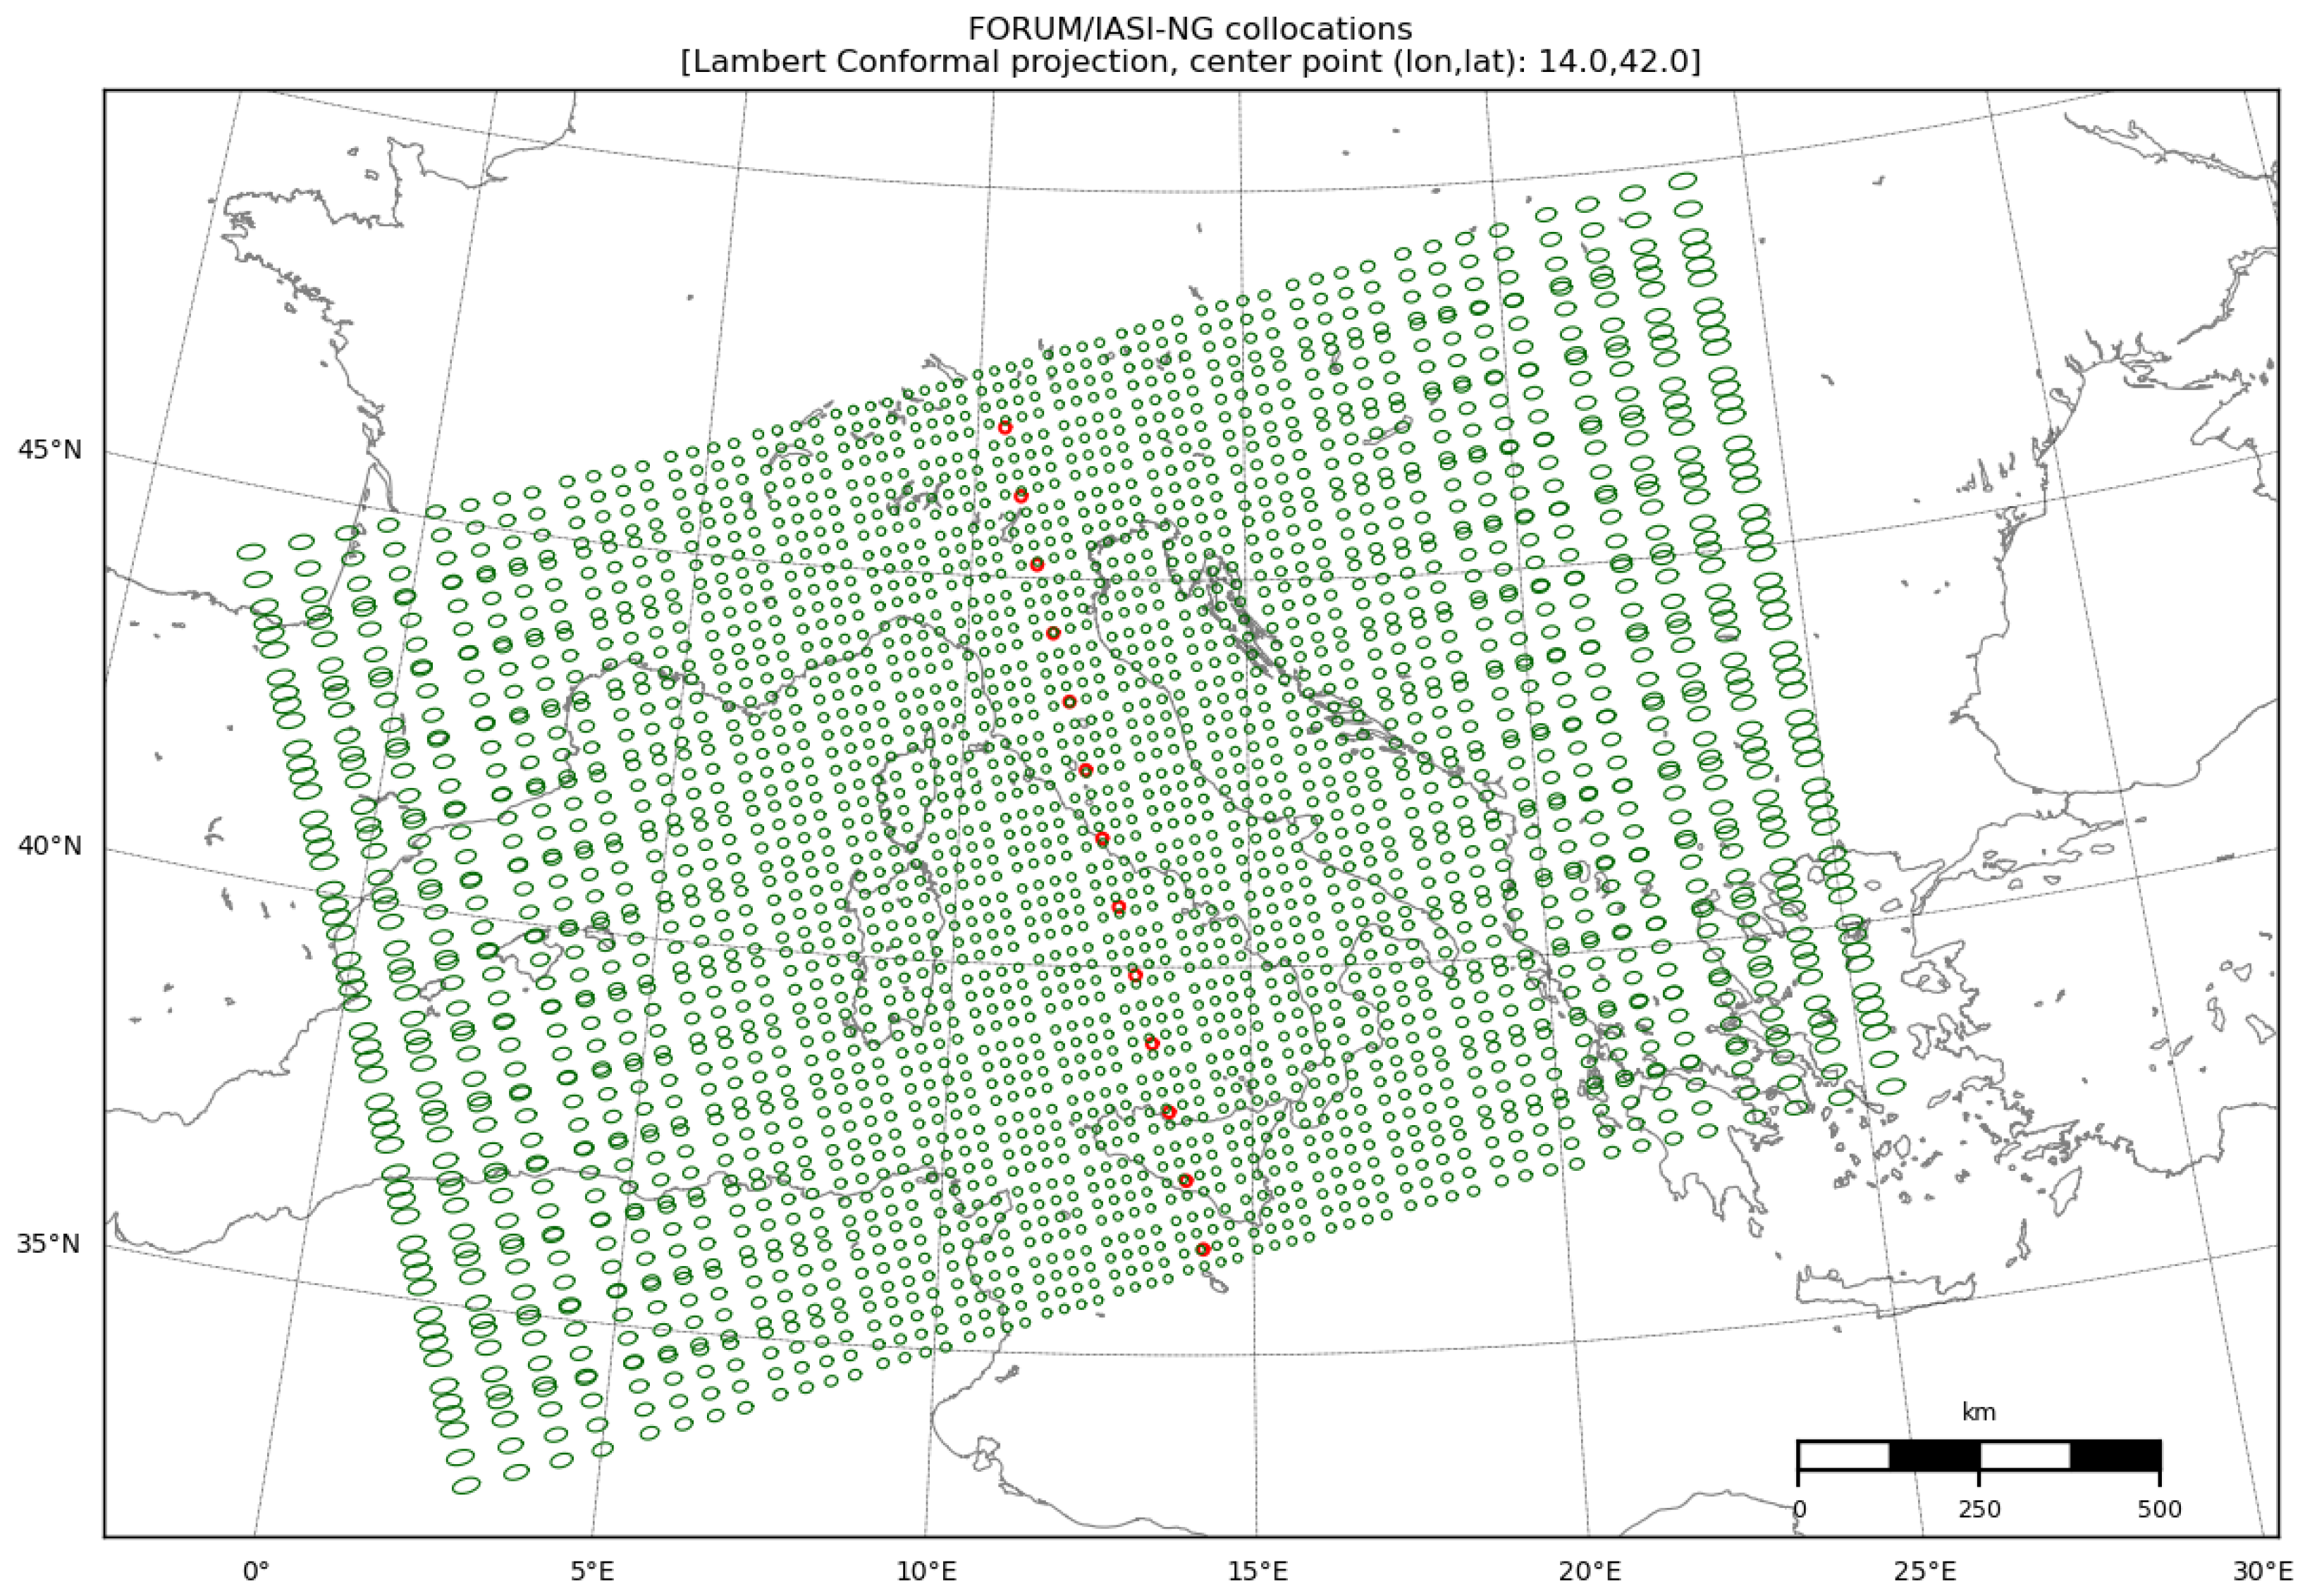
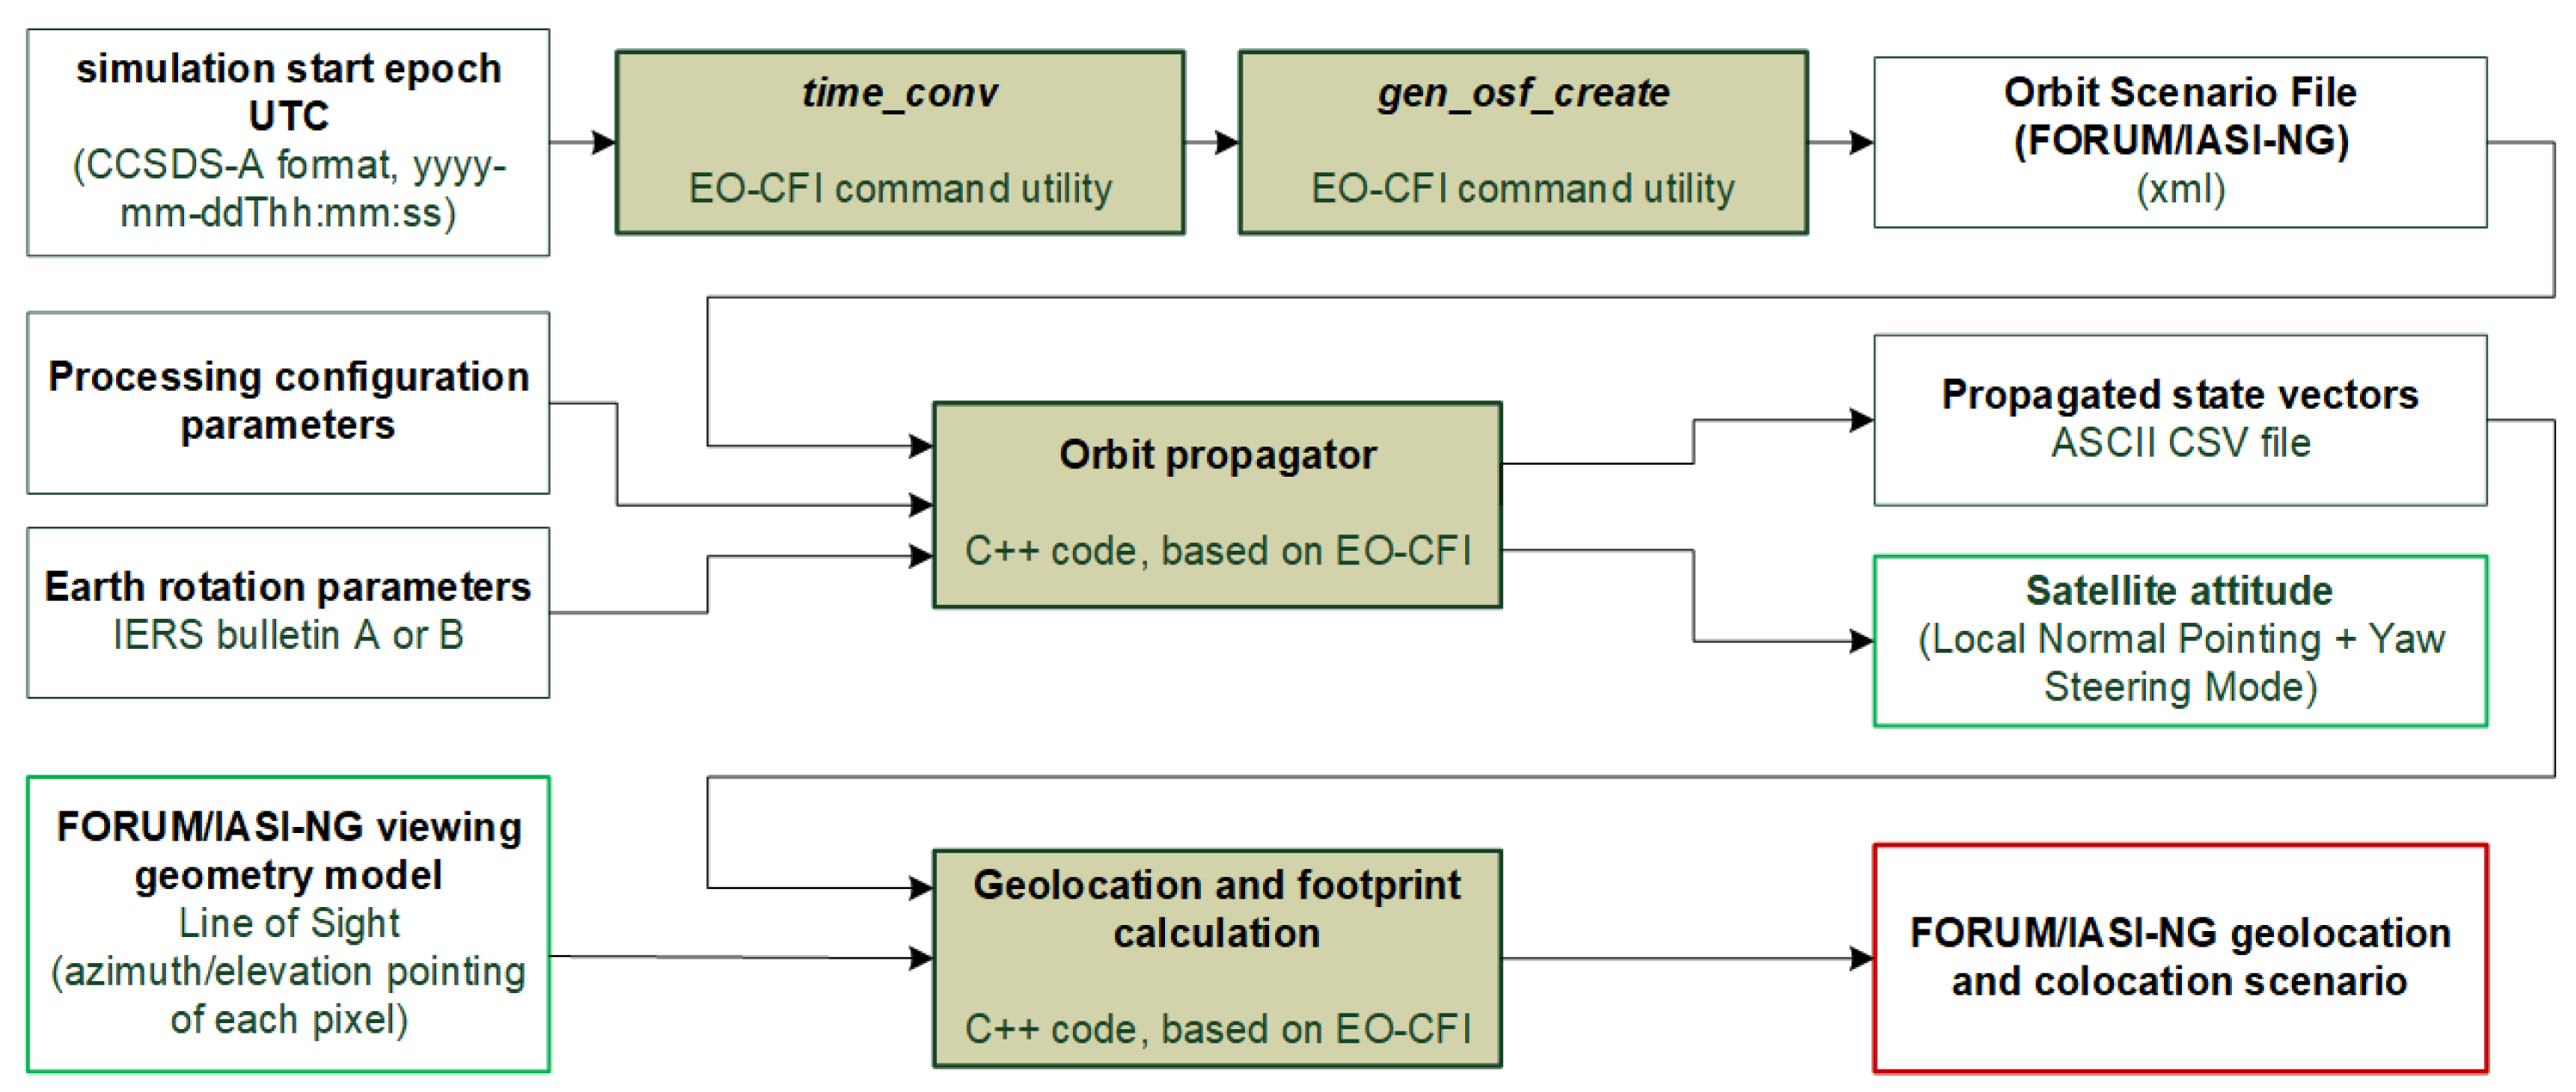
A complete simulation of the observation geometry for both IASI-NG and FORUM sensors was then performed, accounting for the orbital parameters of MetOpSG-A and FORUM (Table 1) and for the viewing geometry of each instrument. The simulated scene (Figure 1) reproduces a realistic co-location scenario, showing the spatial coincidence of the two instruments’ measurements over the study domain. The simulation pipeline (sketched in Figure 2) comprises the following main steps: (i) definition and propagation of the FORUM and IASI-NG orbits, based on the nominal MetOpSG-A orbital parameters and the FORUM mission requirements [14]; (ii) line-of-sight calculation and geolocation of the individual measurements for both instruments [14,25]; and (iii) estimation of the actual footprint shape and size on the ground, based on the scanning characteristics and instantaneous field of view (IFOV) of each sensor.
For the simulation, specific tools have been developed (in C++ code), based on the Earth Observation—Customer Furnished Item (EO-CFI) software v. 4.28 [26] and on the file format specifications [27] provided by ESA.
Figure 1. Map of FORUM and IASI-NG collocations, shown using a Lambert Conformal projection centered at (14.0° E, 42.0° N) of the selected scenario corresponding to 06:00 UTC forecast of 24 July 2024. Green circles represent IASI-NG measurement points, while red points indicate the ground track of the FORUM satellite. A distance scale in kilometers is provided in the lower right corner.
Atmosphere 17 00329 g001
Figure 2. Scheme for the simulation of the geometry and co-location scenario: the EO-CFI utilities time _ conv [28] and gen _ osf _ create [29] are used for generating the orbital specification of MetOpSG-A and FORUM (Orbit Scenario Files), the orbit propagation and geolocation is carried out using the developed tools (based on the EO-CFI libraries [26]).
Atmosphere 17 00329 g002
To analytically define the orbits of both MetOpSG-A (hosting IASI-NG) and FORUM, the EO-CFI utilities time _ conv and gen _ osf _ create were used to generate the corresponding Orbit Scenario Files (OSF) [27,28,29]. The MetOpSG-A orbital parameters are those of the nominal operational orbit (Table 1). The FORUM orbit was defined with the same mean local solar time (MLST) as MetOpSG-A, with the longitude of the ascending node (ANX) adjusted to ensure a temporal co-registration between the two instruments of less than 1 min, consistent with FORUM mission requirements [14] (Table 2 and Table 3). For each propagation step, the orbit state vector—comprising position and velocity in the Earth-Centred Earth-Fixed (ECEF) reference frame—was calculated using dedicated C++ tools based on the EO-CFI libraries [30]. The orbit propagation step was set differently for the two instruments, reflecting their different scanning strategies. For FORUM, which acquires a single nadir measurement per step, the propagation step was set to 15.15   s , corresponding to the along-track spatial sampling distance of 100 km [14]. For IASI-NG, the propagation is instead driven by the instrument scan cycle: one orbit state vector is computed for each of the 14 Fields of Regard acquired per scan, with a scan period of 15.58   s .
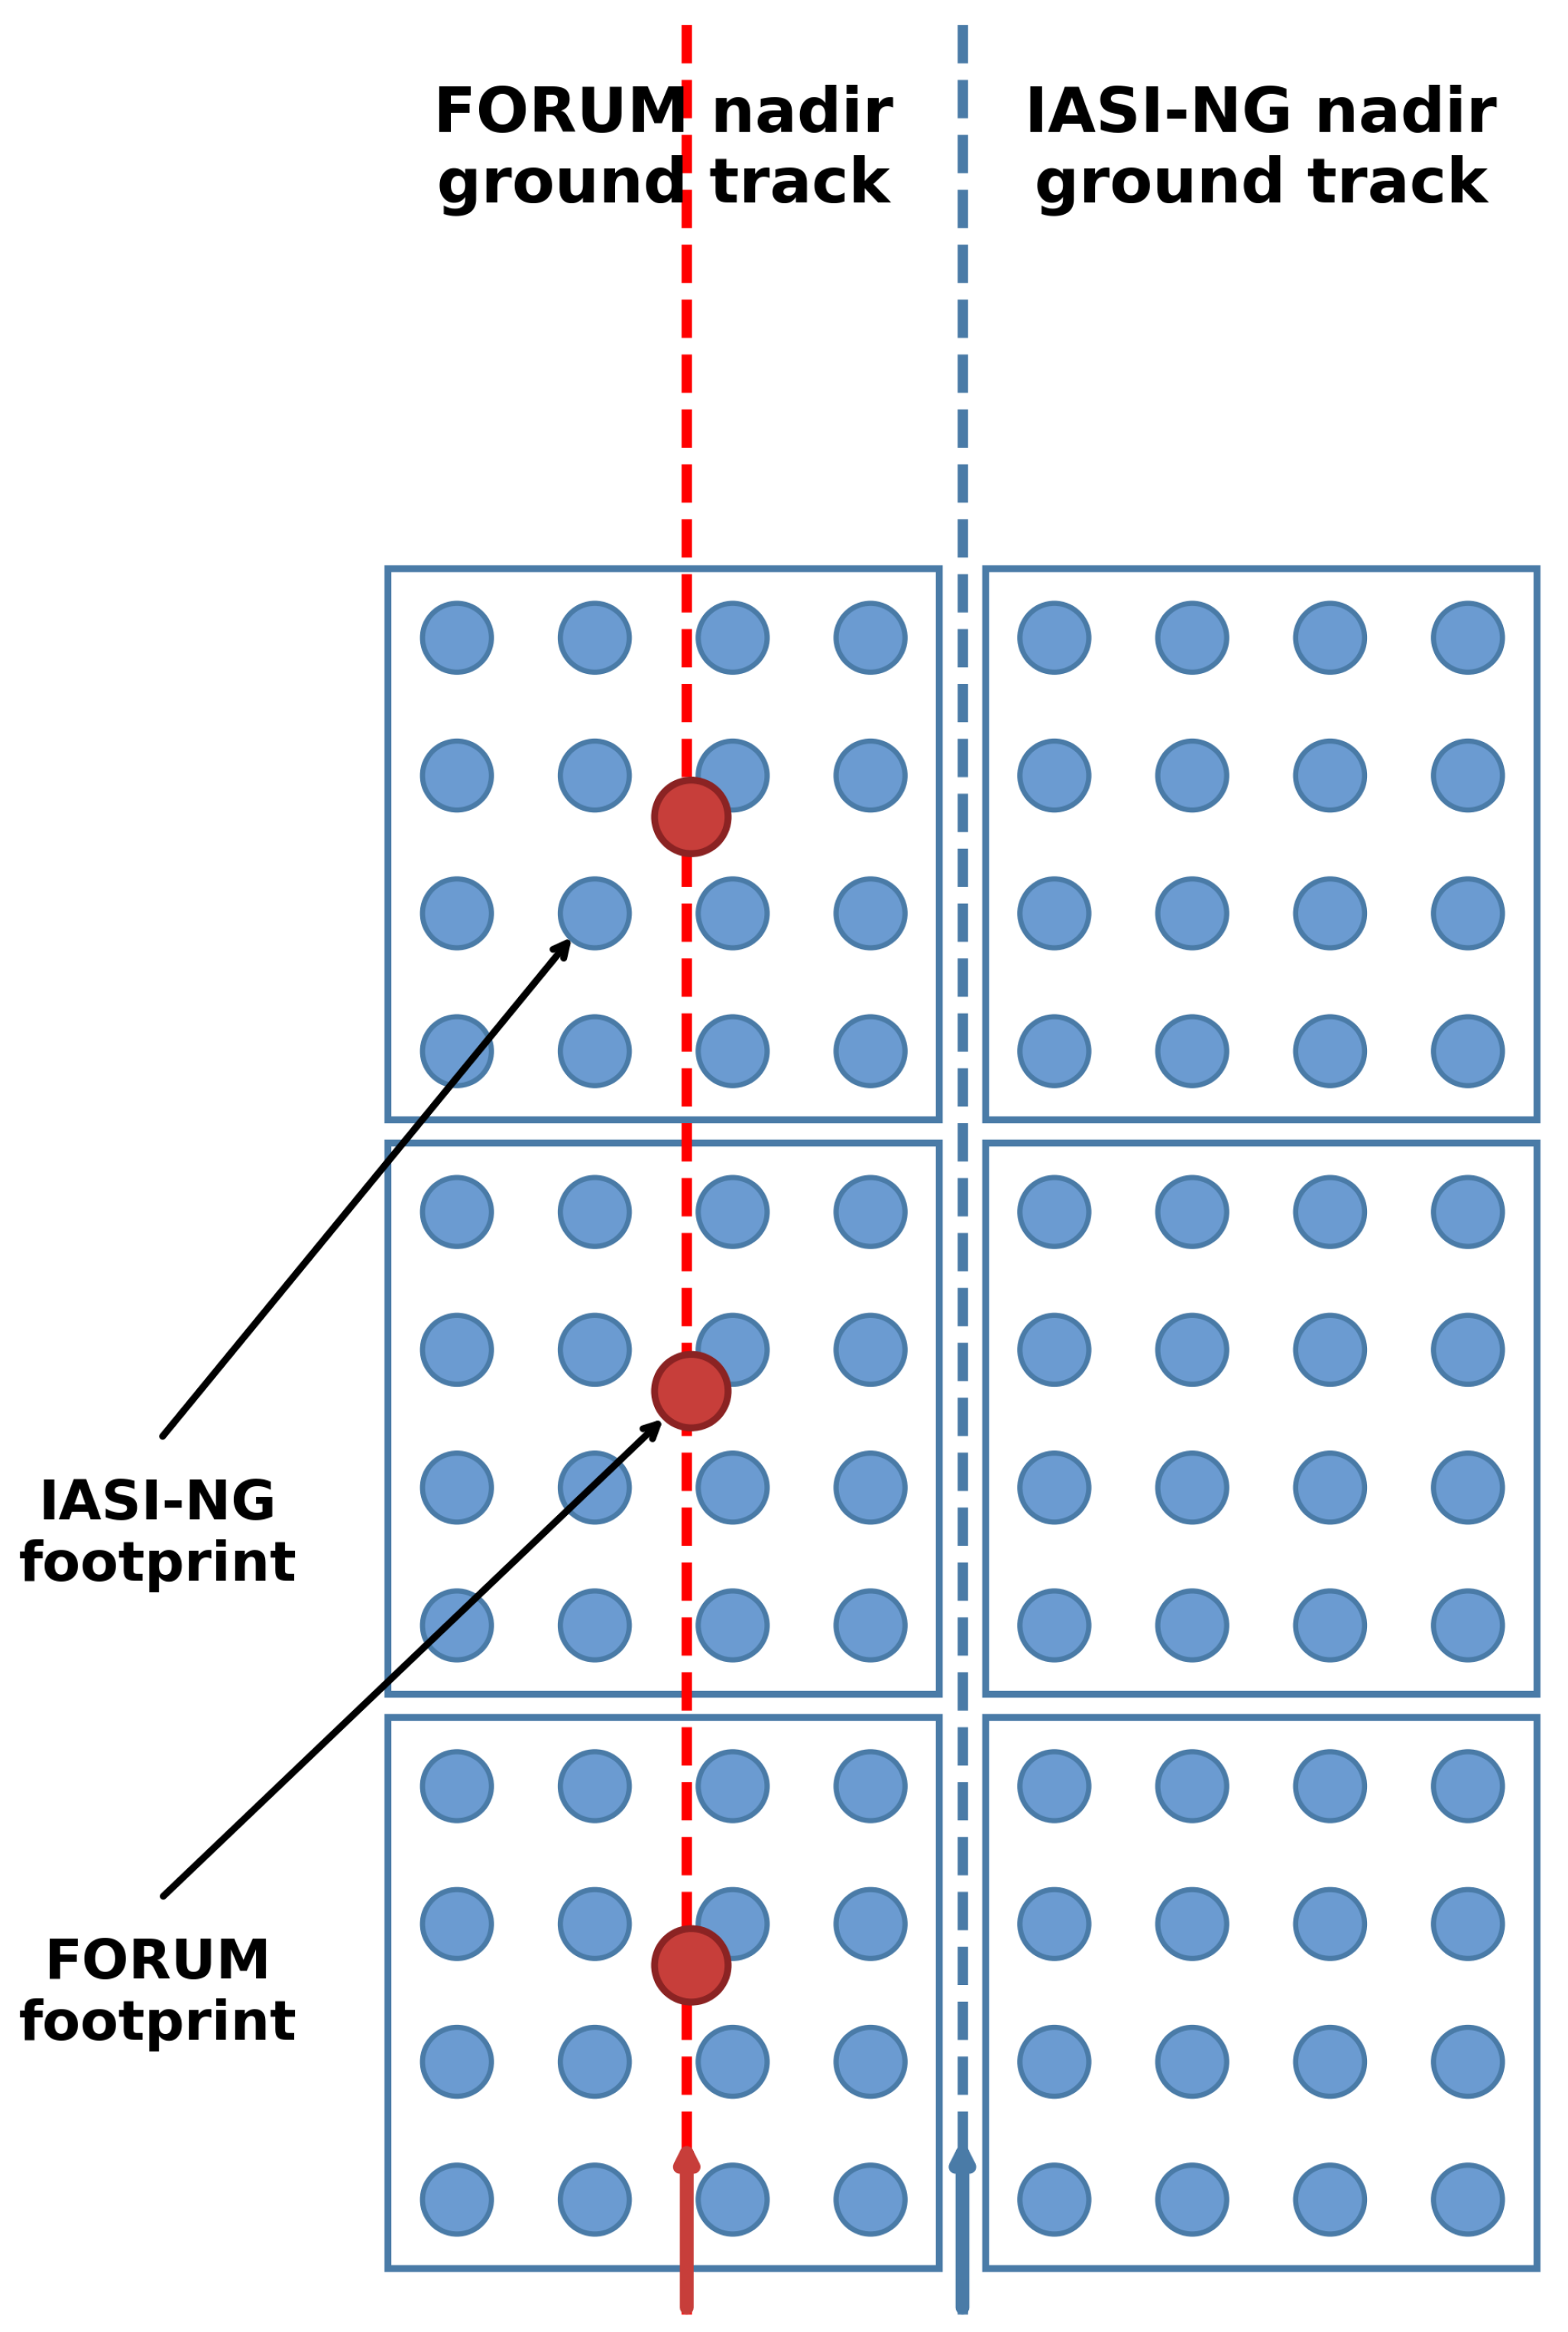
The geolocation of each individual FORUM and IASI-NG measurement was computed as geodetic WGS84 longitude and latitude, based on the scanning geometry of the two instruments and assuming yaw-steering mode (YSM) plus local normal pointing (LNP) attitude for both platforms. FORUM acquires a single measurement per scan, while IASI-NG acquires 16 pixels per Field of Regard, arranged in a 4 × 4 pattern (Figure 3). The line-of-sight (LOS) unit vector in the instrument reference frame and the geolocation of the measurement centre were calculated using the same EO-CFI-based tools.
The instantaneous field of view (IFOV) of each instrument was estimated at the reference satellite altitude of 817 km, based on the nominal nadir footprint size (15 km for FORUM and 12 km for IASI-NG) (see Table 4). The resulting footprint shape on the ground was approximated as a 32-sided polygon, whose vertices were computed by successive rotations of the central LOS vector. This polygonal representation allows accurate assessment of the spatial overlap between FORUM and IASI-NG observations. A comparison between nominal and simulated geometrical parameters is reported in Table 5, confirming good agreement with the instrument specifications.

2.3.2. Simulation of Measurements

The state vector retrieved from the FORUM and IASI-NG simulated measurements includes atmospheric temperature and water vapor profiles, surface temperature, and surface emissivity. Atmospheric temperature and water vapour profiles are given by the values corresponding to the 60 pressure levels used to discretize the atmosphere. Surface temperature is the soil temperature and surface emissivity accounts for the radiative properties of the surface within the FORUM and IASI-NG spectral ranges and is included in the state vector due to its direct impact on the measured radiance.
The “true” vertical atmospheric profiles were generated through numerical simulations performed with a mesoscale Limited Area Model (LAM). Specifically, the WRF-ARW model (Weather Research and Forecasting—Advanced Research WRF [31]) was configured to reproduce the selected atmospheric scenario, providing high-resolution spatial and temporal fields of the requested thermodynamic variables. WRF was initialized and laterally forced using analyses from the Integrated Forecasting System (IFS) of the European Centre for Medium-Range Weather Forecasts (ECMWF), available at a horizontal resolution of 0.125° on 15 pressure levels. The simulation was initialized at 00:00 UTC on 24 July 2024 and integrated for 18 h. The model configuration is summarized in Table 6. For each pixel along the IASI-NG and FORUM orbital tracks (see Figure 1), collocated atmospheric state variables (including pressure, temperature, and water vapor mixing ratio at all model vertical levels) were extracted from the WRF output at 06:00 UTC on 24 July 2024, assuming negligible atmospheric variability during the satellite overpass, which spans only a few minutes over the study area. To account for the different horizontal resolutions of WRF grid and satellite pixels, a spatial averaging procedure was applied. For each satellite pixel, the nearest WRF grid point was identified and a box-averaged mean was computed over a square area centered on that point, with a half-width of 0.08°. Ozone vertical profiles were obtained from the ECMWF Integrated Forecasting System (IFS), available on 25 pressure levels at a horizontal resolution of 0.125° × 0.125°.
Table 6. Configuration of the LAM model used in this study.
ParameterValue
LAM modelWRF-ARW v4.7.0
Grid spacing0.03° × 0.03°
Vertical levels50
Time step12 s
Cumulus convectionExplicit (no parameterization)
MicrophysicsThompson scheme [32]
Boundary layerYonsei University scheme [33]
Land SurfaceUnified Noah model [34]
RadiationRapid Radiative Transfer Model [35]
TurbulenceYonsei University + 2D Smagorinski [33]
Starting from atmospheric profiles considered as true, derived as described above, forward simulations were performed using the SIGMA-FORUM radiative transfer code. SIGMA-FORUM is a fast radiative transfer model developed within the FIT-FORUM (Forward and Inverse Tool for FORUM) framework to simulate the spectrally resolved outgoing long-wave radiation emitted by the Earth in the spectral range relevant for the FORUM mission [2,36]. Although SIGMA-FORUM does not achieve the same spectral accuracy as line-by-line radiative transfer models, it provides an efficient and computationally fast alternative while preserving the essential physical description of radiative transfer processes. The model is based on the radiative transfer equation and can do all-sky simulations. Cloud effects are included through the parametrization proposed by Chou et al. (1999) [37], which provides an approximate description of scattering due to clouds by means of scaling laws that render the cloudy-sky radiative transfer formally equivalent to the clear-sky case. This approach allows cloud contributions to be accounted for without explicitly modifying the structure of the radiative transfer equation, enabling efficient simulations under both clear-sky and cloudy conditions [36,38].
Given the true state vector, SIGMA-FORUM simulates the outgoing radiance—i.e., the emission spectra that a satellite instrument would observe—and computes the associated Jacobians, providing sensitivity information with respect to the parameters included in the state vector.
Up to this stage, the simulation procedures for FORUM and IASI-NG observations are identical. However, since the objective is to realistically reproduce the measurements perceived by each instrument, the forward-model results are subsequently processed through the instrument-specific spectral response functions (ISRFs). In particular, FORUM results are convolved using a Norton–Beer apodization function, consistent with its Fourier-transform spectrometer design, while IASI-NG results are filtered using a Gaussian spectral response function, reflecting its instrumental line-shape characteristics. This step ensures that the simulated spectra and jacobians reproduce the effective response of each sensor.
In order to apply the retrieval simulation described in Section 2.2, we need the definition of an a priori atmospheric state, which provides the background information needed to constrain the inversion. The a priori state vector is defined consistently with the state vector described above and includes atmospheric temperature, water vapor, surface temperature, and surface emissivity. The a priori profiles for temperature and water vapor are selected from the ERS climatological database [39], which provides multi-annual monthly mean atmospheric profiles for January, April, July, and October over five latitude bands (90–70° S, 55–35° S, 20°S–20° N, 35–55° N, and 70–90° N). The associated a priori error covariance matrices are constructed from the same climatological information to represent realistic uncertainties and vertical correlations of the atmospheric state variables. The a priori value and a priori error for the surface temperature are taken equal to those of the temperature corresponding to the lowest layer of the atmosphere. The a priori values for surface emissivity are taken equal to 0.99 with an a priori error of 0.1, and no correlations are assumed between different spectral points. These quantities are used within the framework described in Section 2.2 to compute the averaging kernel matrix and the retrieval error estimates.
Another important ingredient of the procedure described in Section 2.2 is the covariance matrix of the spectrum, S y . This is computed starting from the FORUM NESR as described in [6] and from IASI-NG NESR in [18]. The NESR is used to characterize the instrumental noise affecting the simulated radiance and is assumed to be Gaussian and uncorrelated in the spectral domain.
Once the retrieved state vector has been obtained, the atmospheric temperature and water vapor profiles are extracted for each atmospheric column in order to analyze their vertical structure and characteristics. Along with these quantities, surface temperature and surface emissivity are also extracted and examined, with the aim of verifying that the simulated products are physically consistent and representative of a realistic observation scenario.
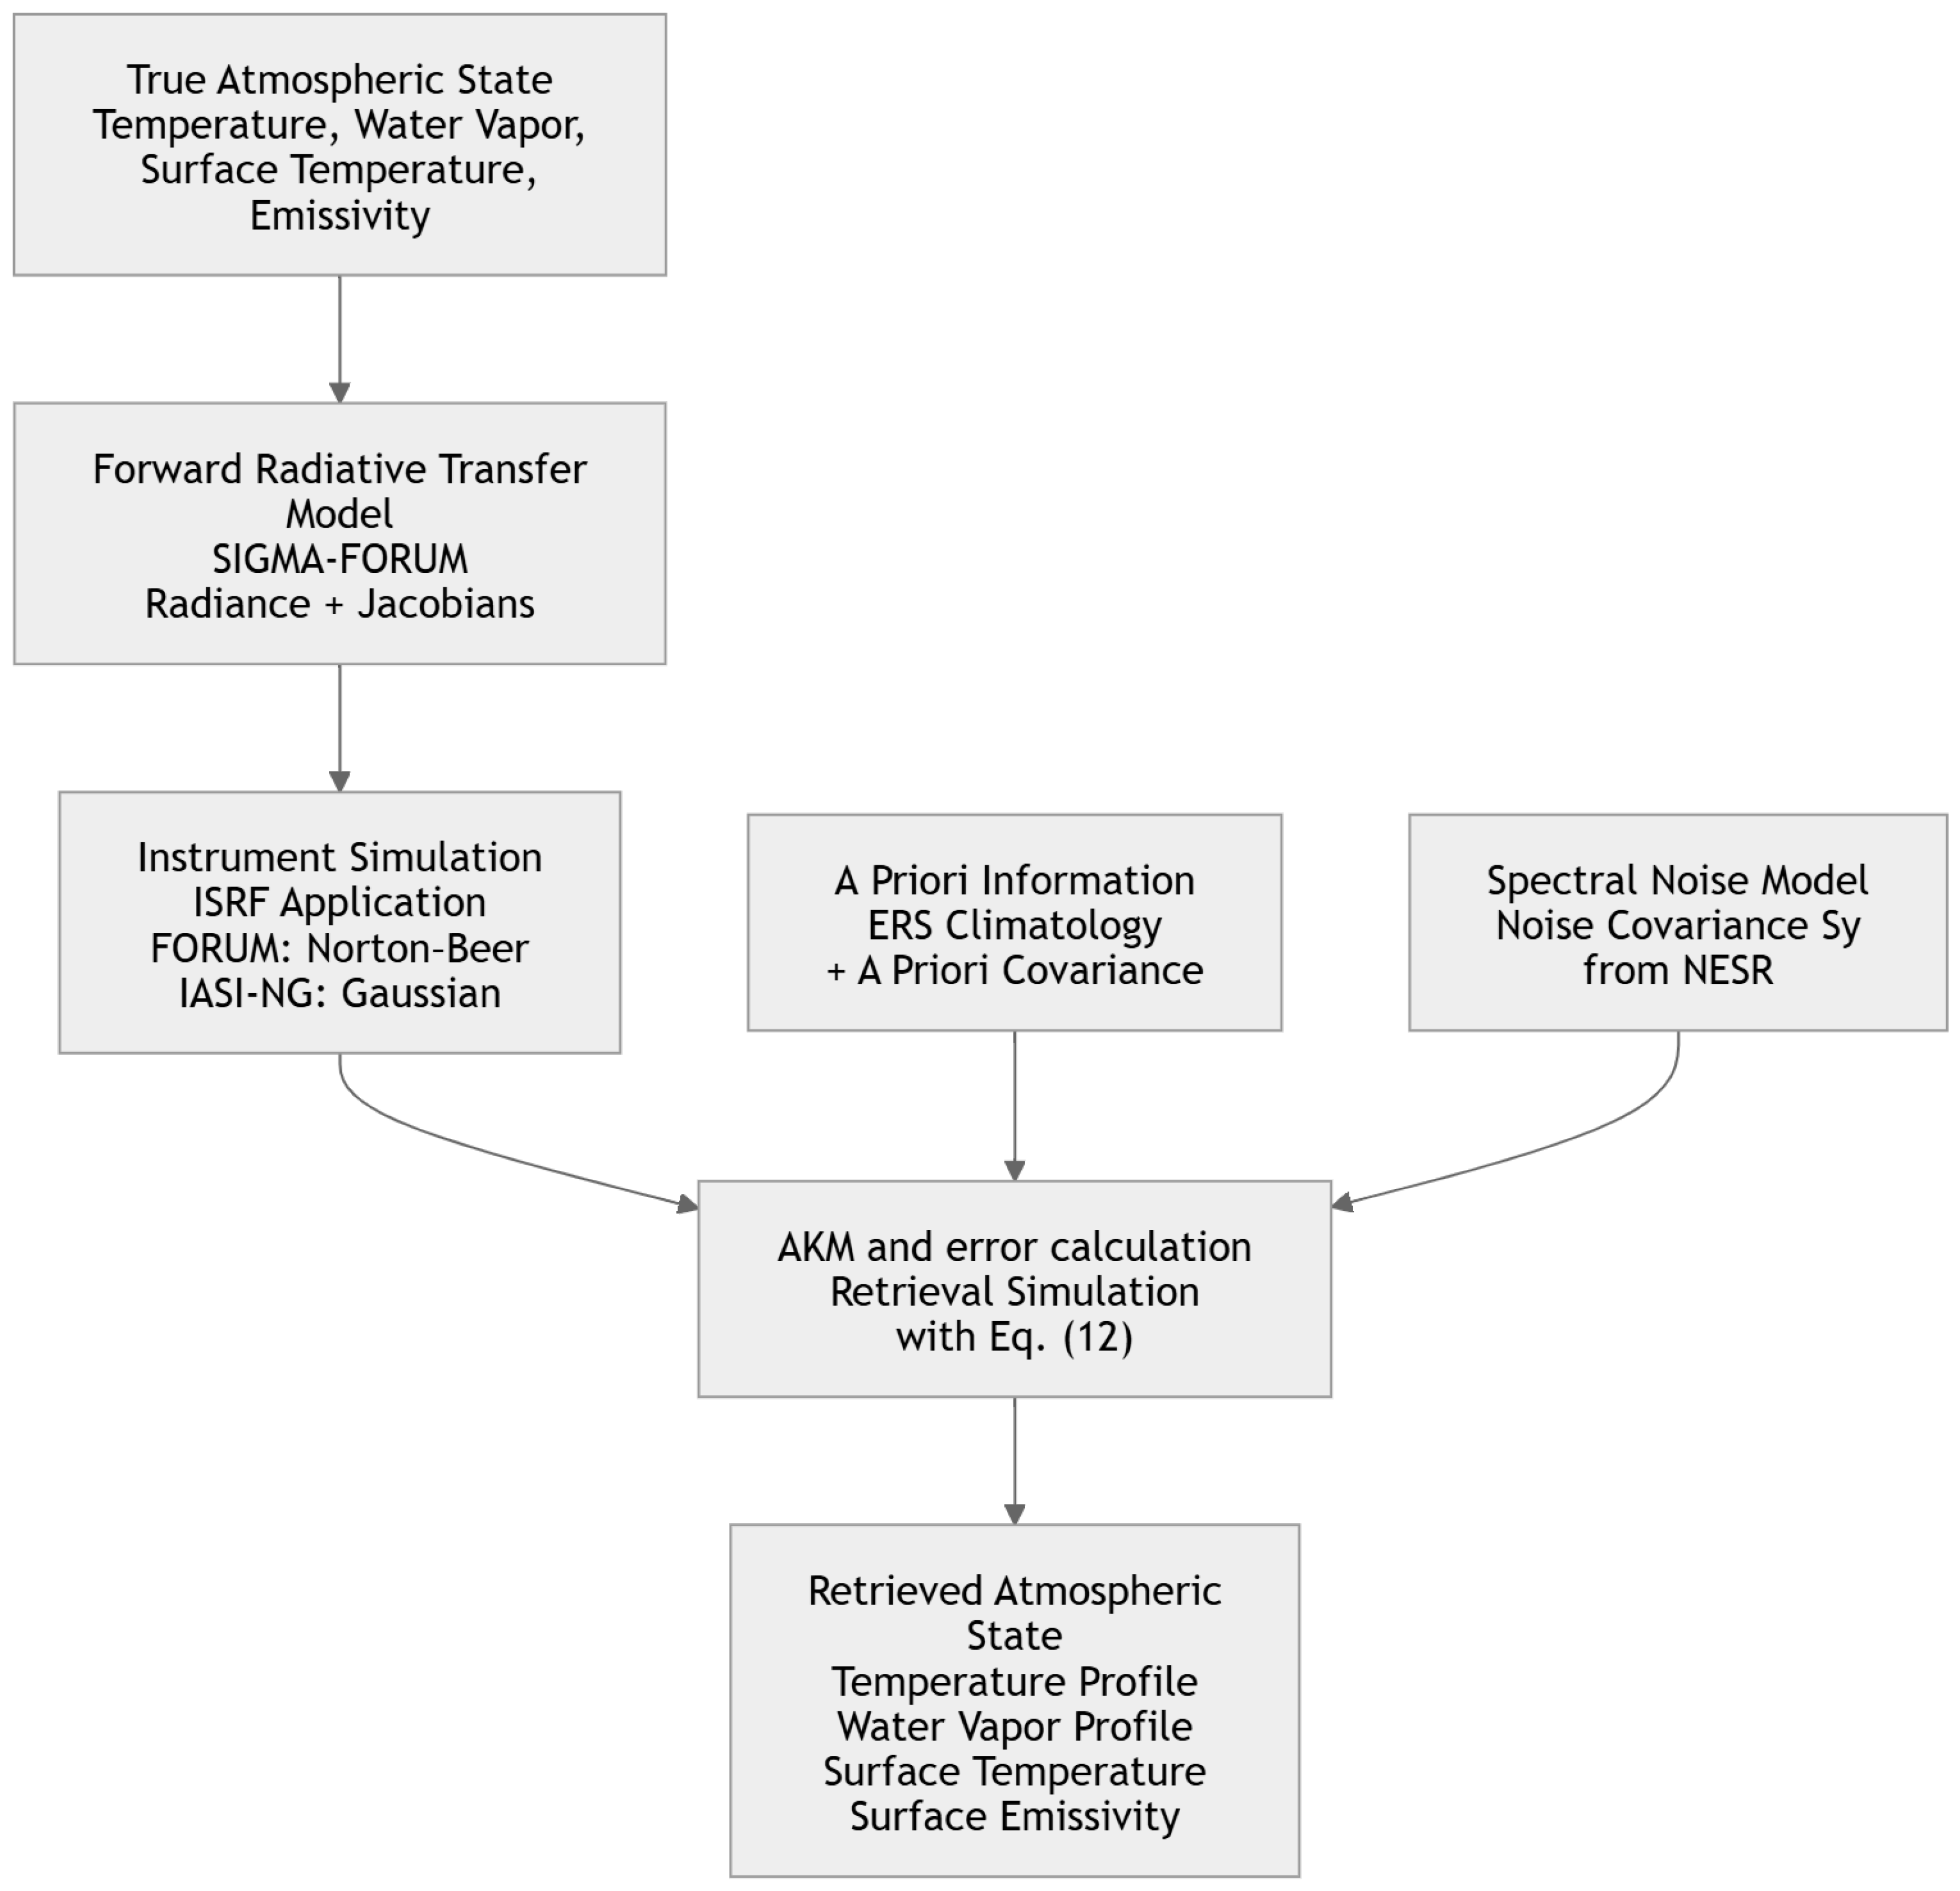
The procedure used to simulate the FORUM and IASI-NG retrieved products is summarized in Figure 4.

3. Results

This section presents the results of the simulated retrievals of atmospheric temperature, water vapor, surface temperature, and surface emissivity from synthetic FORUM and IASI-NG measurements over the Italian peninsula for the 06:00 UTC forecast of 24 July 2024. Results for each instrument are presented separately in Section 3.1 and Section 3.2, followed by a quantitative comparison of their complementary capabilities in Section 4.1.

3.1. FORUM Measurement Simulation Example

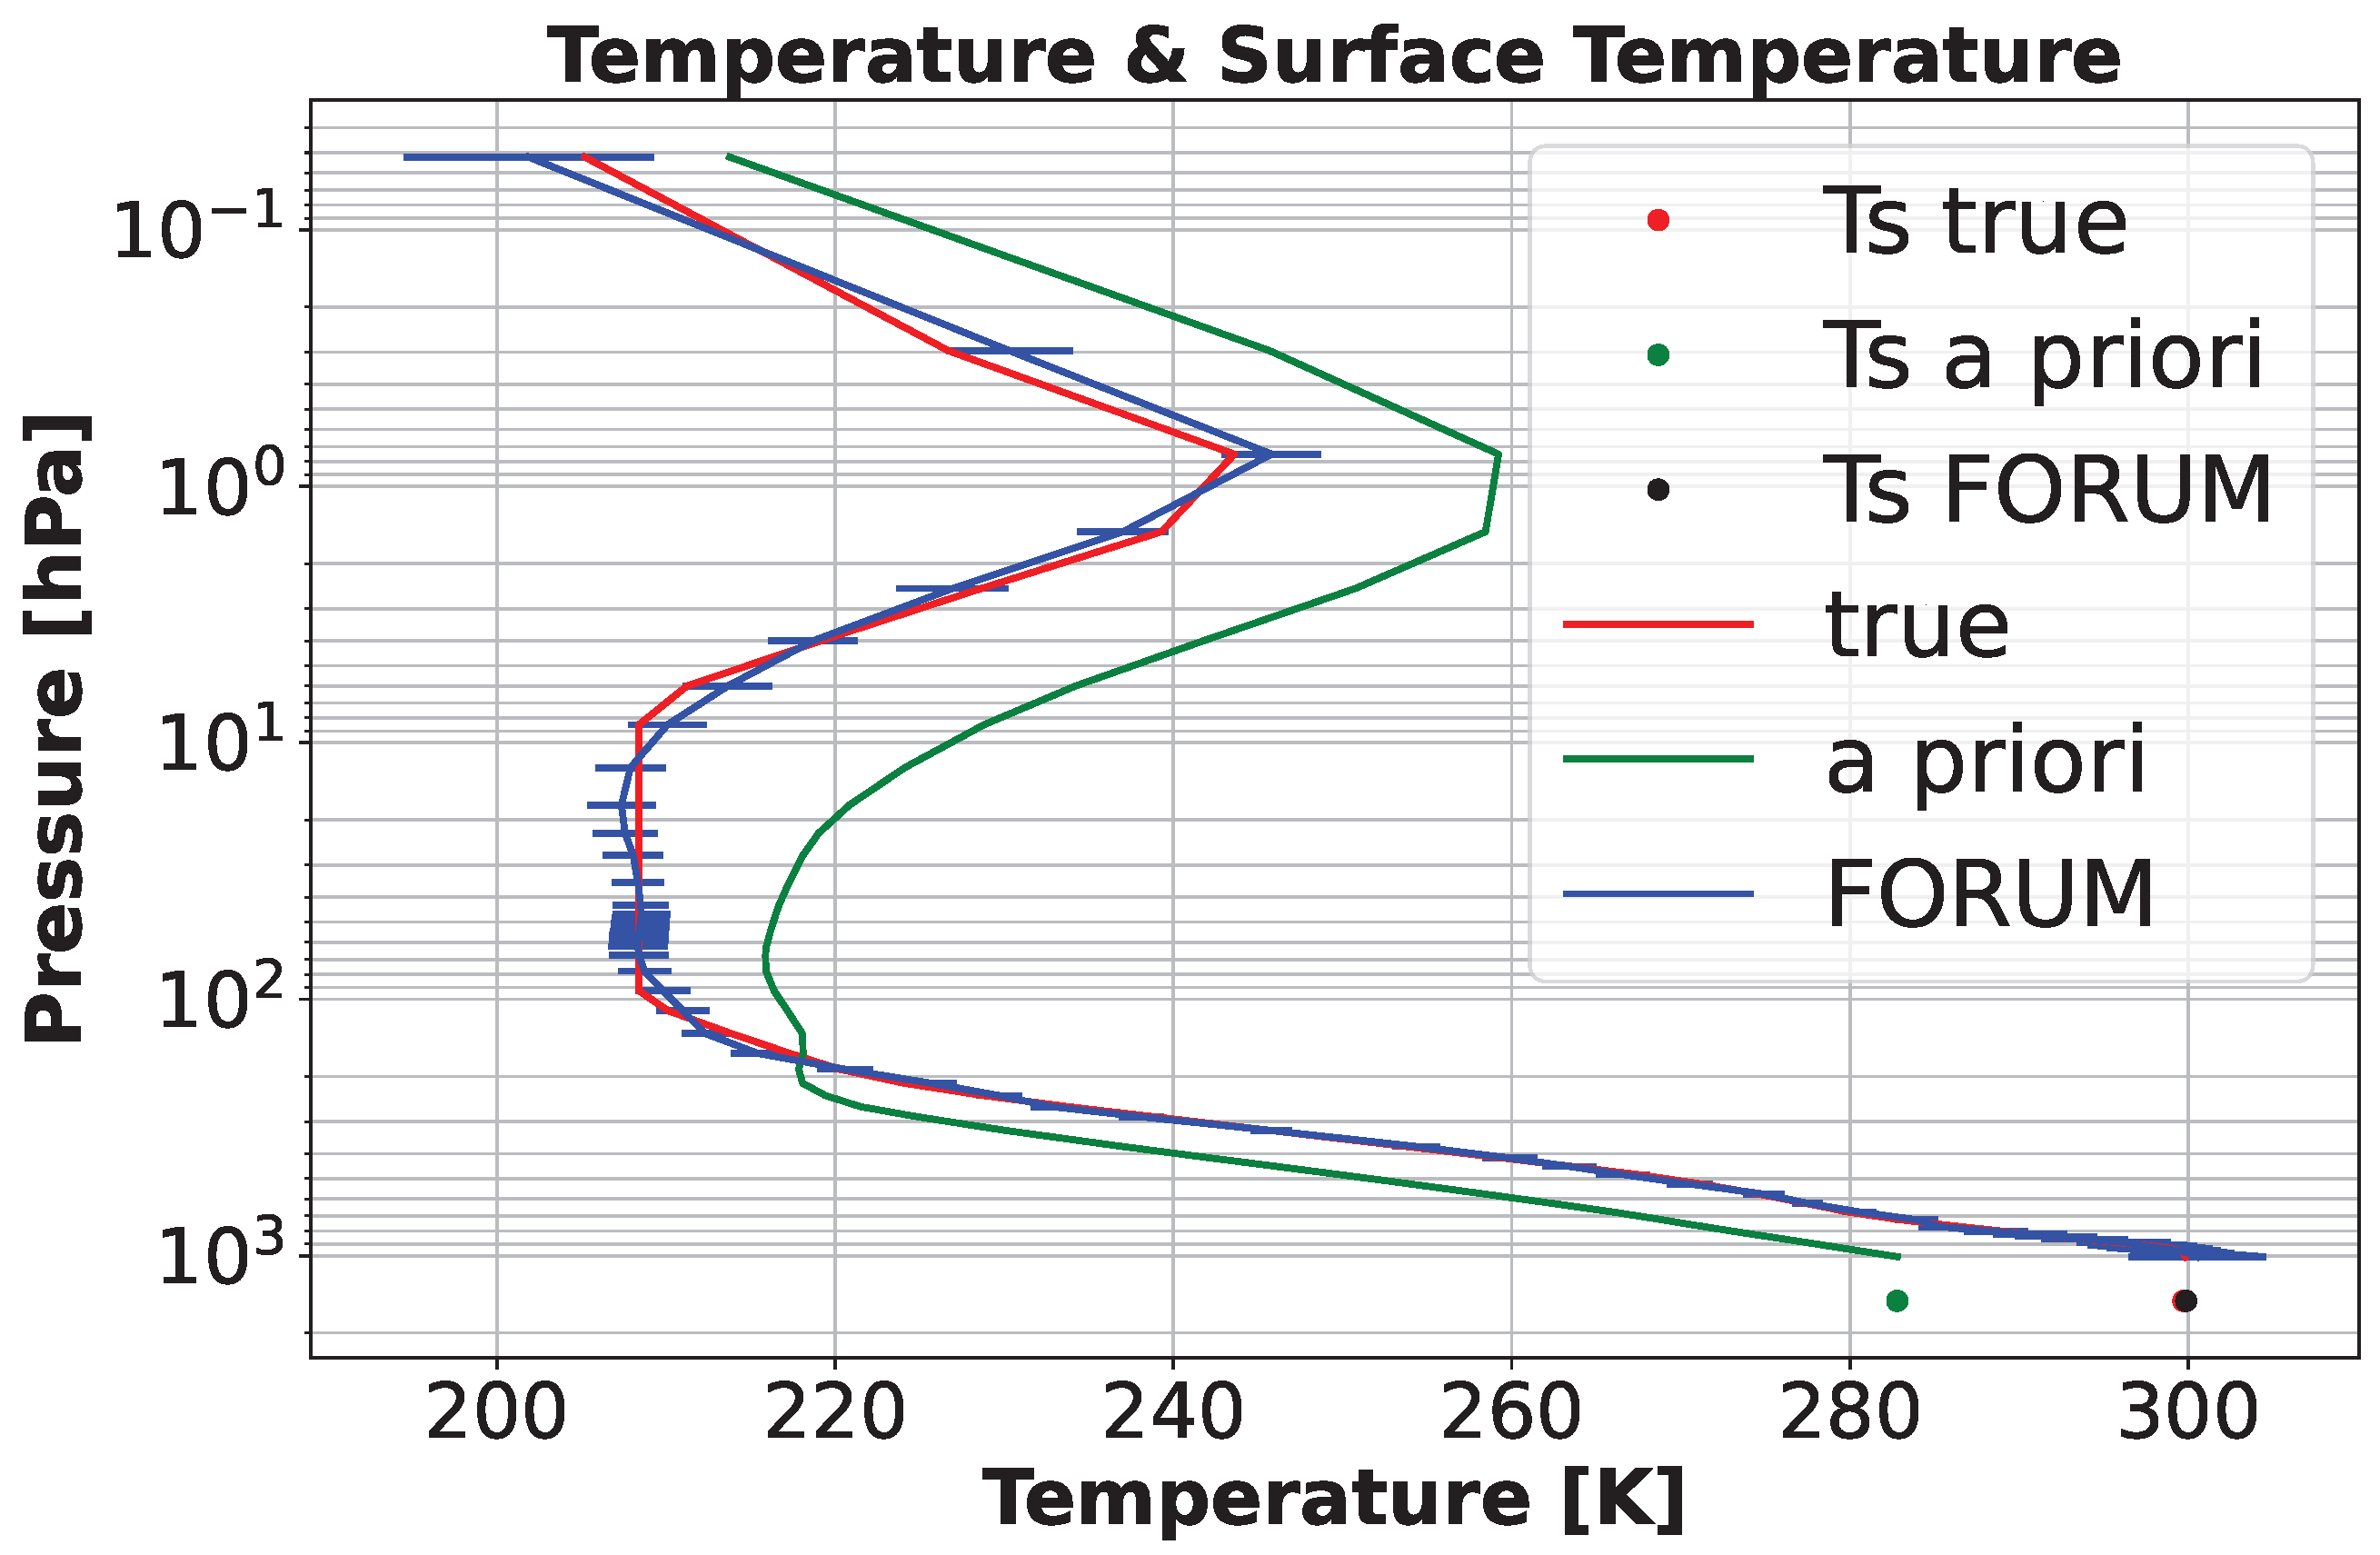
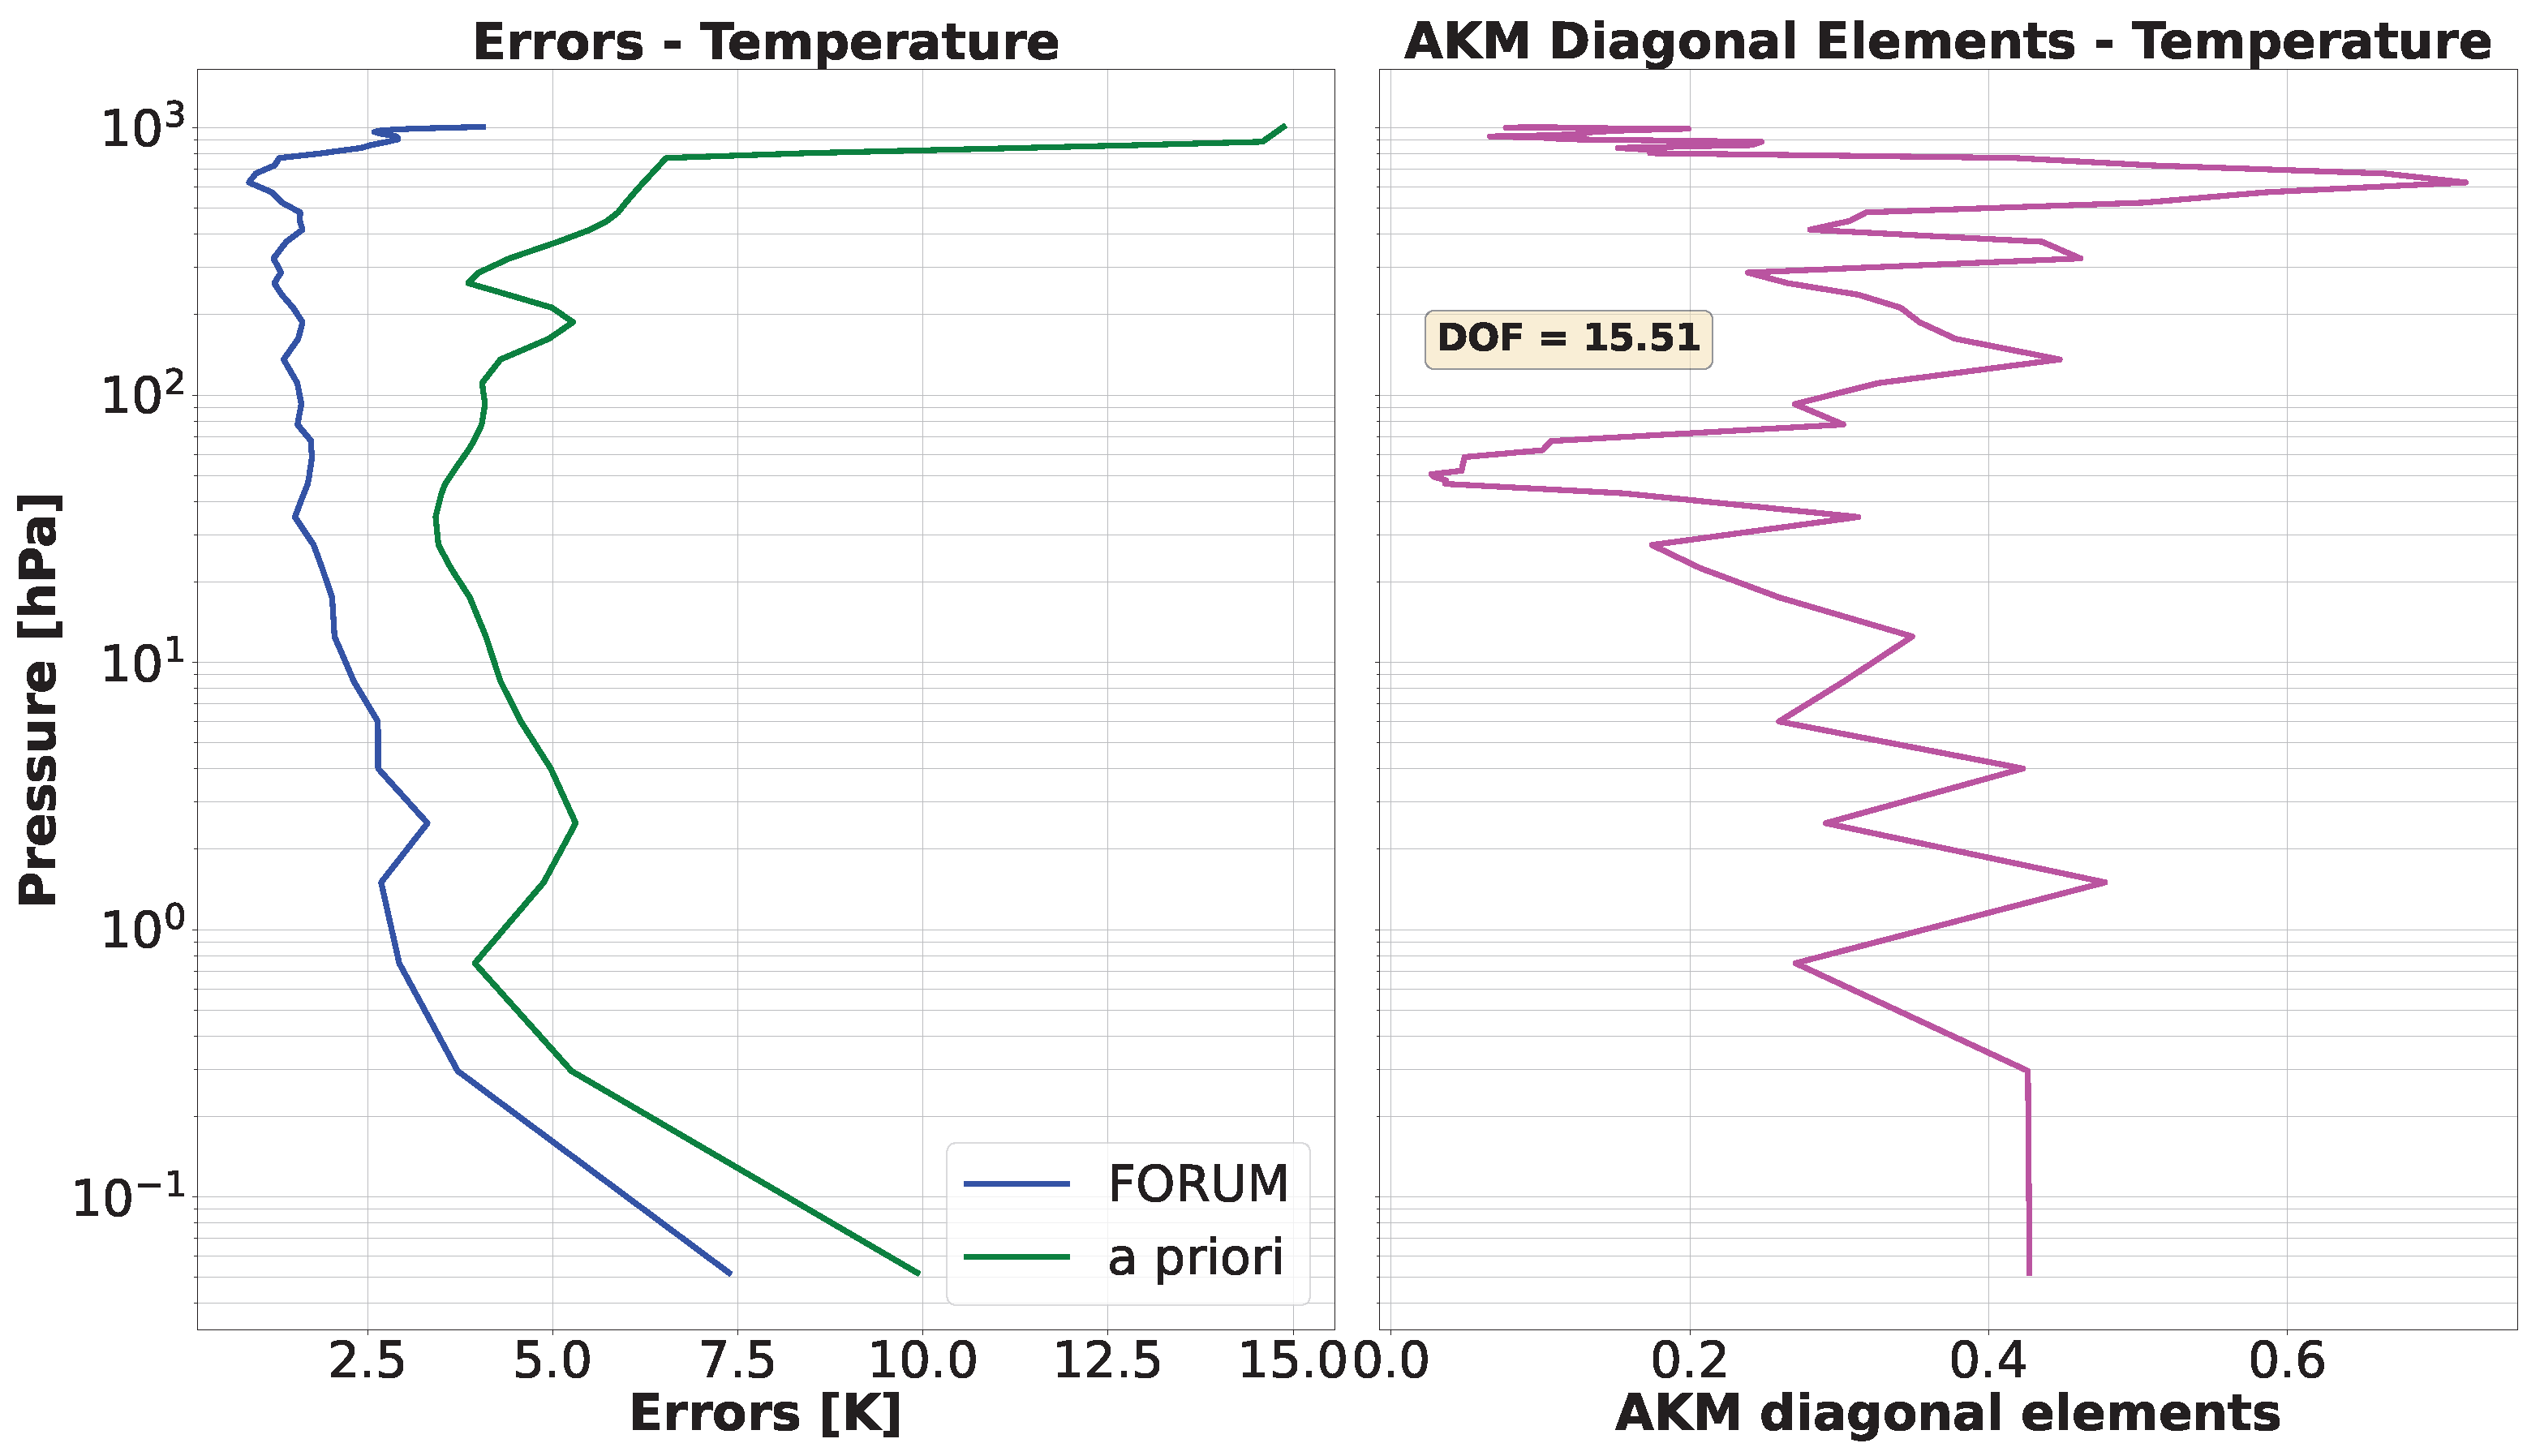
Figure 5 shows the simulated retrieved temperature profile, together with the true and a priori ones, from the ground up to approximately 70 km of altitude. While previous studies have shown that FORUM retrievals exhibit their highest accuracy in the lower troposphere [5], consistent with its design which maximizes spectral sensitivity primarily within tropospheric levels, the results presented here demonstrate unexpected sensitivity extending well beyond this range. The retrieved profile closely approximates the true state throughout the troposphere and lower stratosphere, and notably diverges from the a priori and approaches the true profile even at higher altitudes. Figure 6 shows that the total retrieval error is consistently reduced with respect to the a priori throughout the entire altitude range, with the largest improvement observed in the troposphere. The diagonal elements of the AKM show appreciable values both in the lower troposphere, reaching a maximum of approximately 0.7, and in the stratosphere, where values around 0.4 indicate non-negligible sensitivity at higher altitudes. The total number of degrees of freedom (DOFs) for temperature is 15.5, confirming that FORUM carries meaningful information on the thermal structure of the atmosphere well beyond the troposphere.
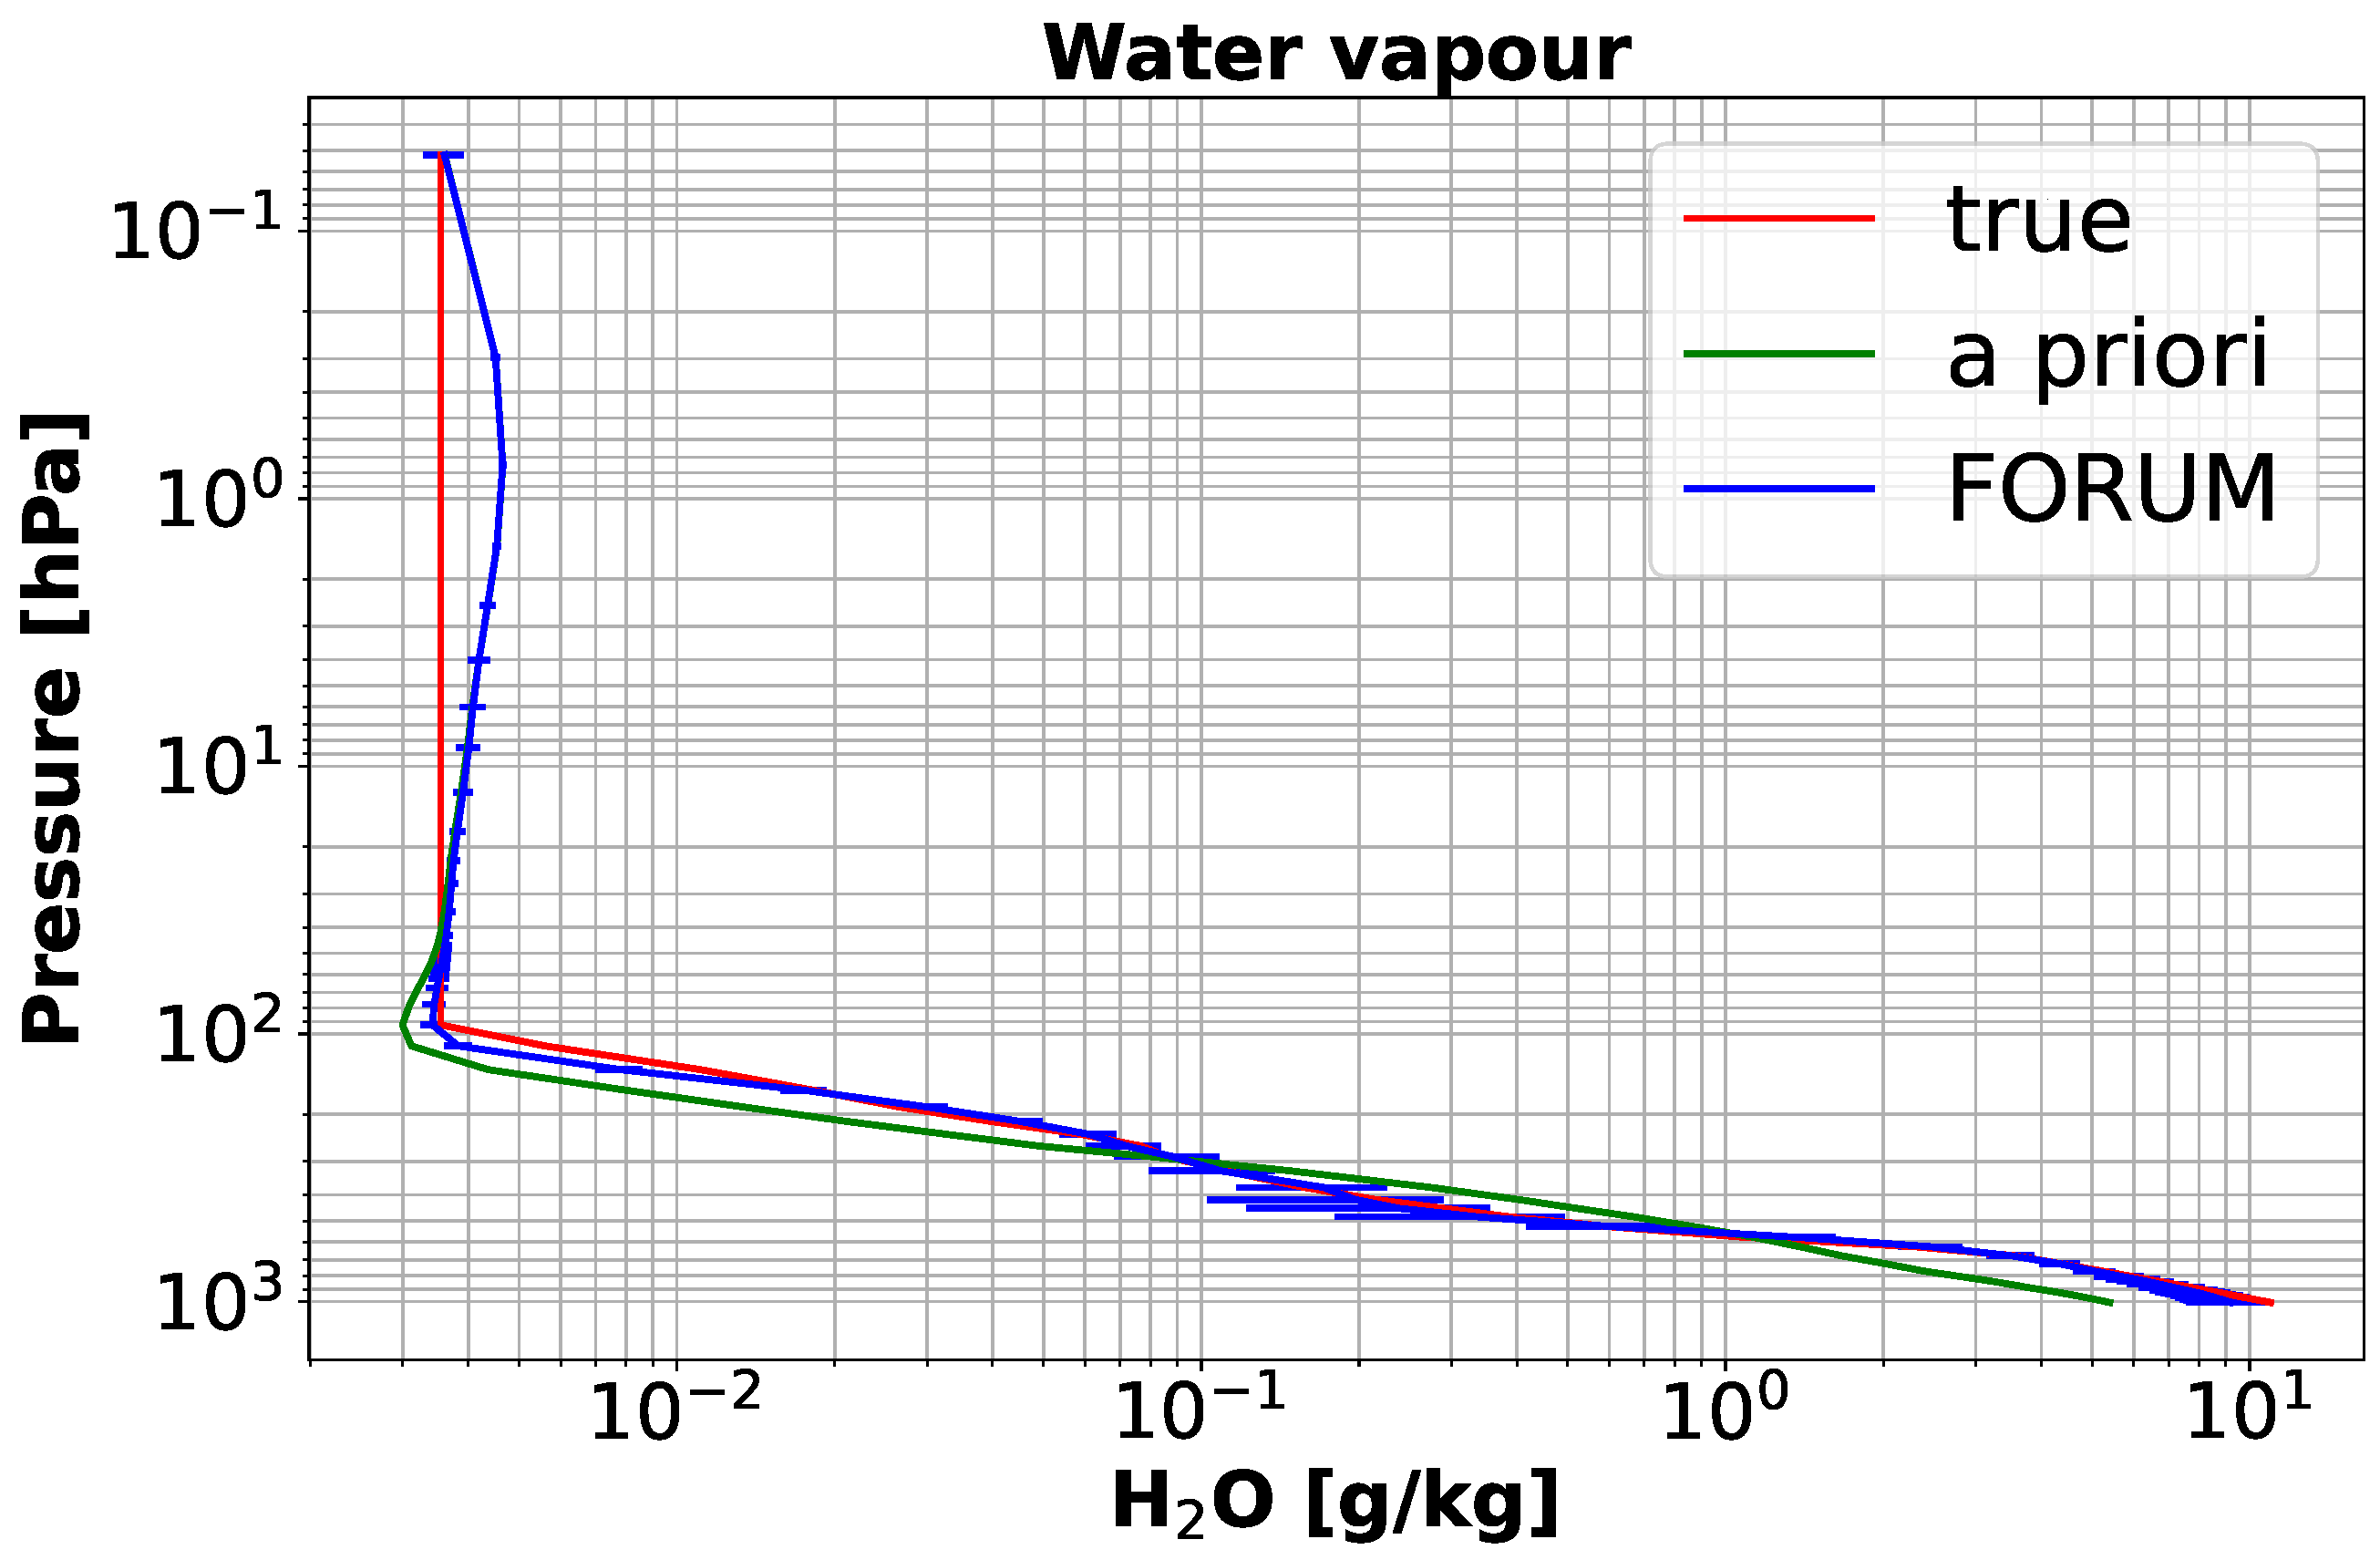
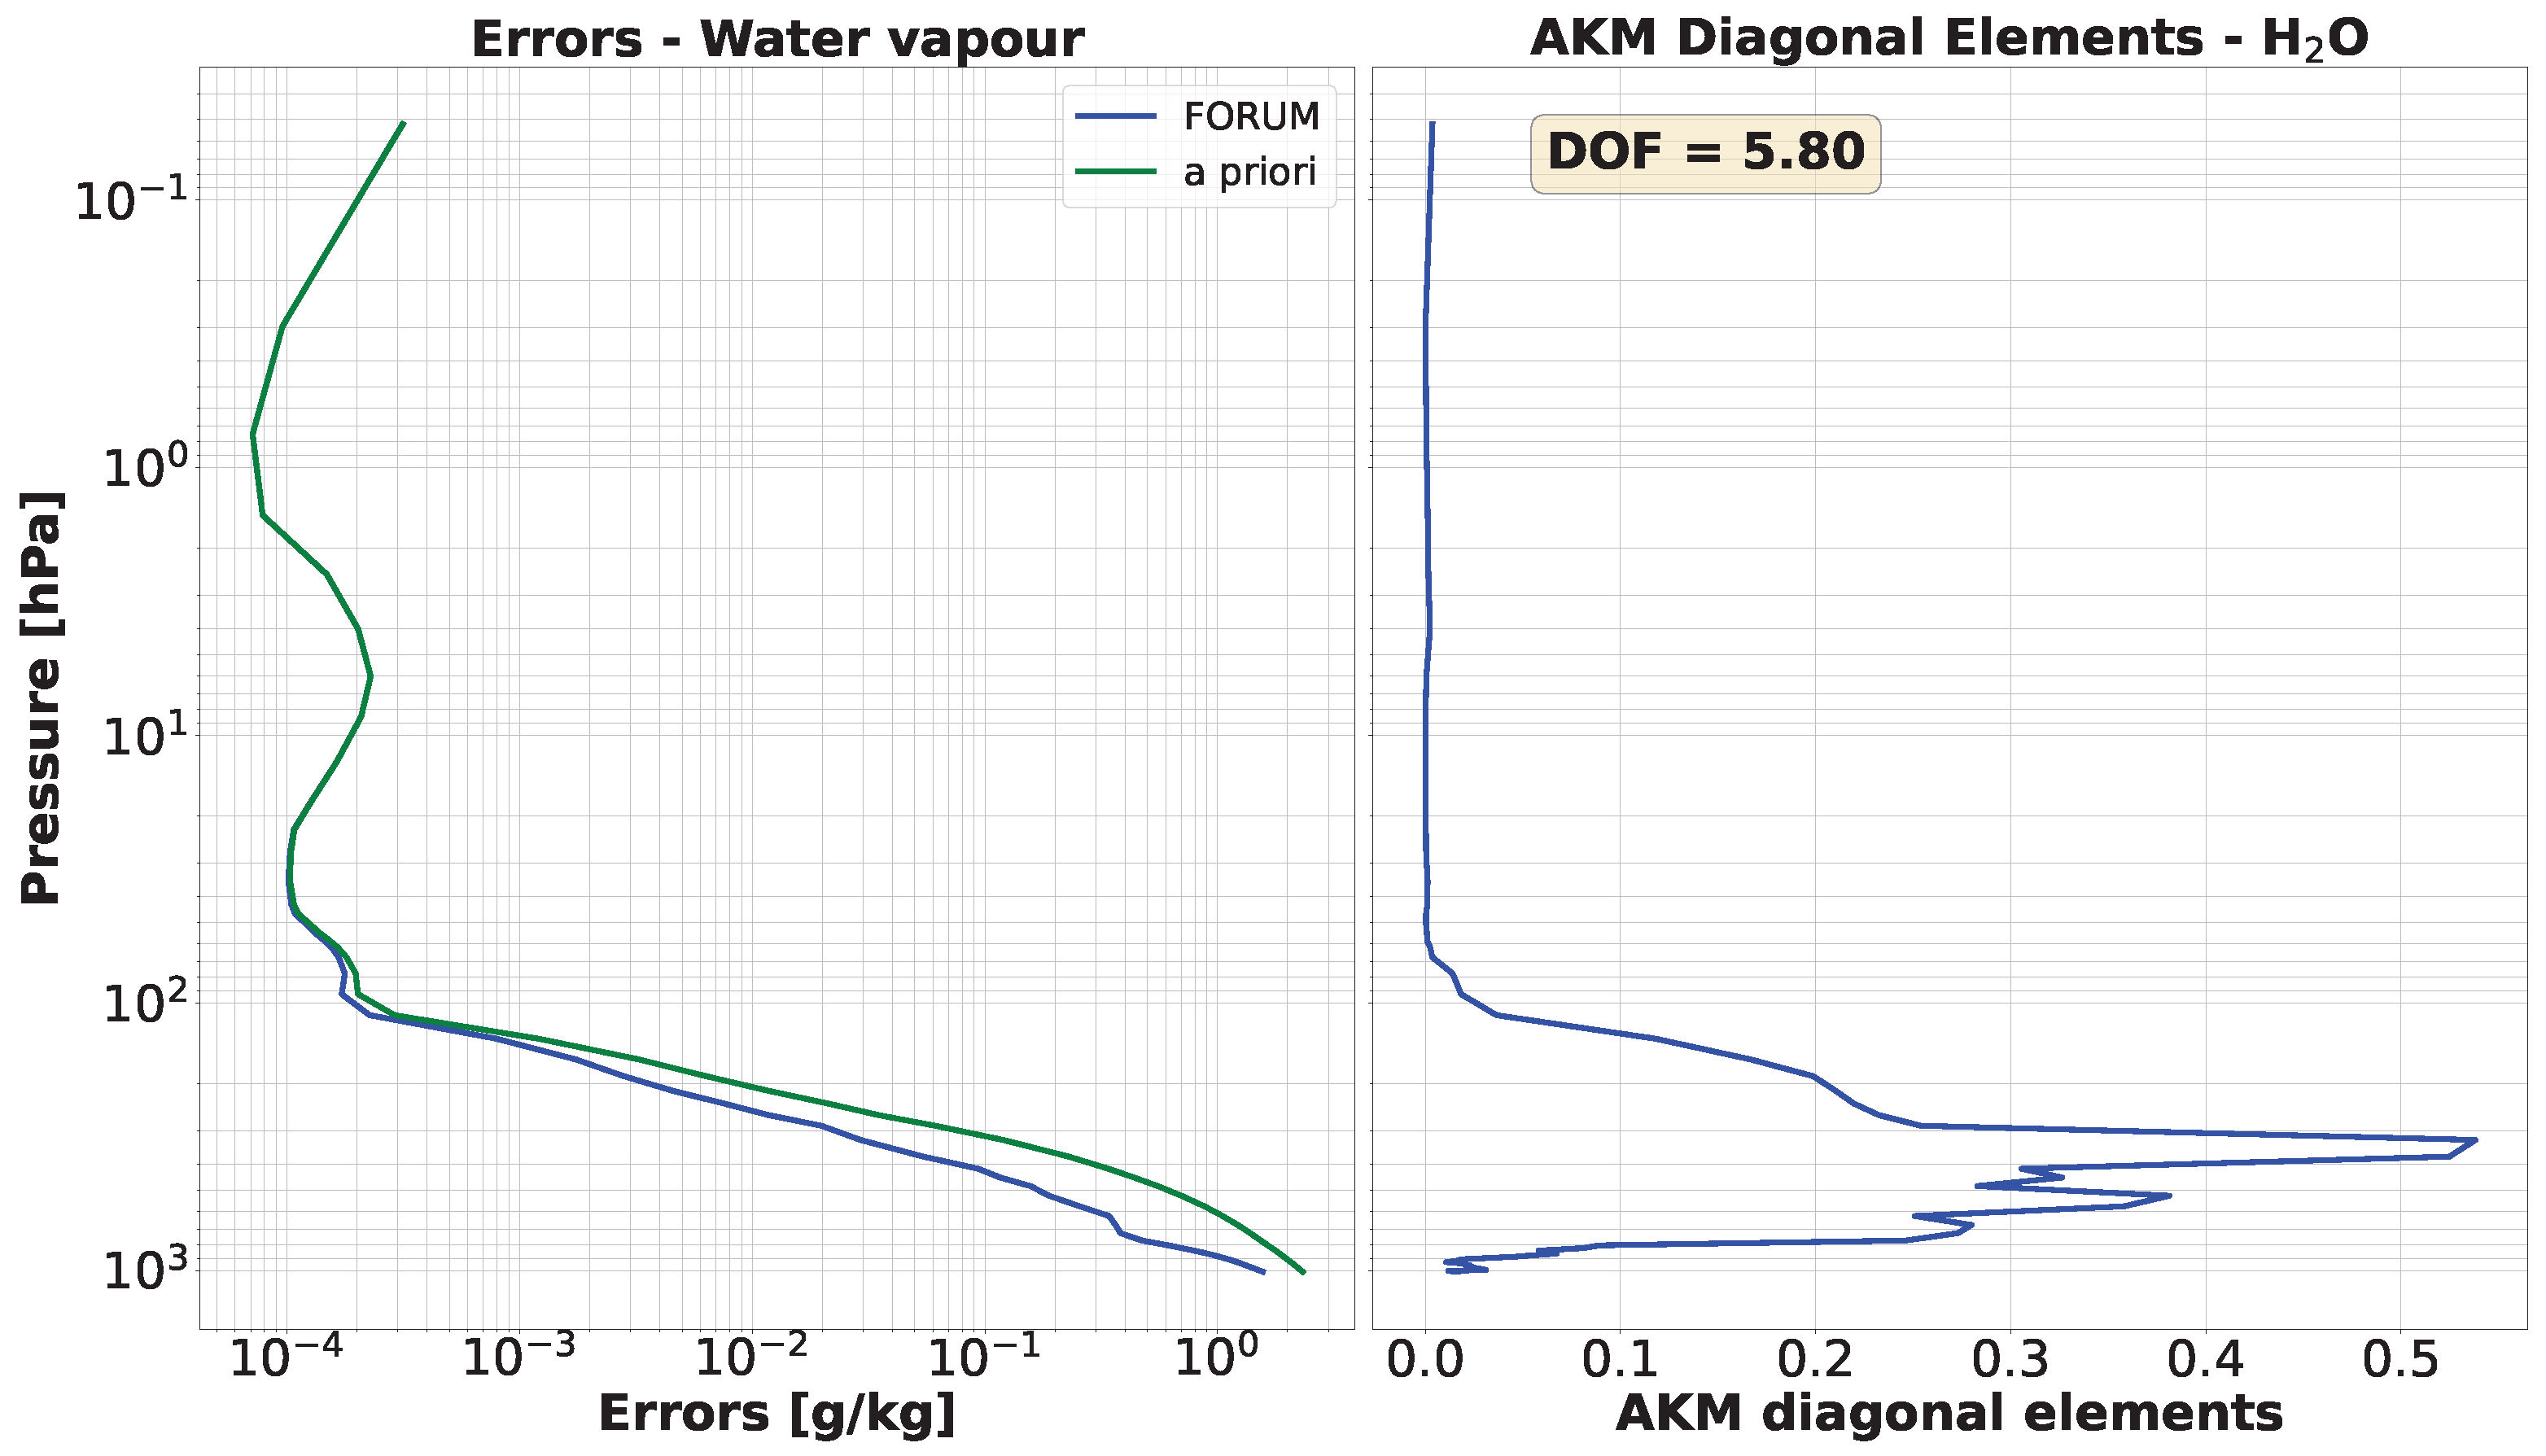
The water vapor retrieval is shown in Figure 7. Below the tropopause, the retrieved profile closely follows the true state, indicating good sensitivity of FORUM in the troposphere. Above the tropopause, however, the retrieved profile collapses onto the a priori, reflecting the lack of information in the FORUM measurements at stratospheric levels. This behaviour is confirmed by the error profile and the AKM diagonal elements shown in Figure 8. The water vapor error profile shows error reduction with respect to the a priori exclusively in the troposphere. The sensitivity increases gradually from the surface, reaching a peak value of approximately 0.5 at around 300 hPa, and then drops rapidly to zero near 80 hPa, indicating that FORUM sensitivity to water vapor is confined to the troposphere, with maximum information content in the upper troposphere. The total number of DOFs for water vapor is 5.8, significantly lower than that obtained for temperature, consistently with the more limited vertical extent of the sensitive region for this parameter.
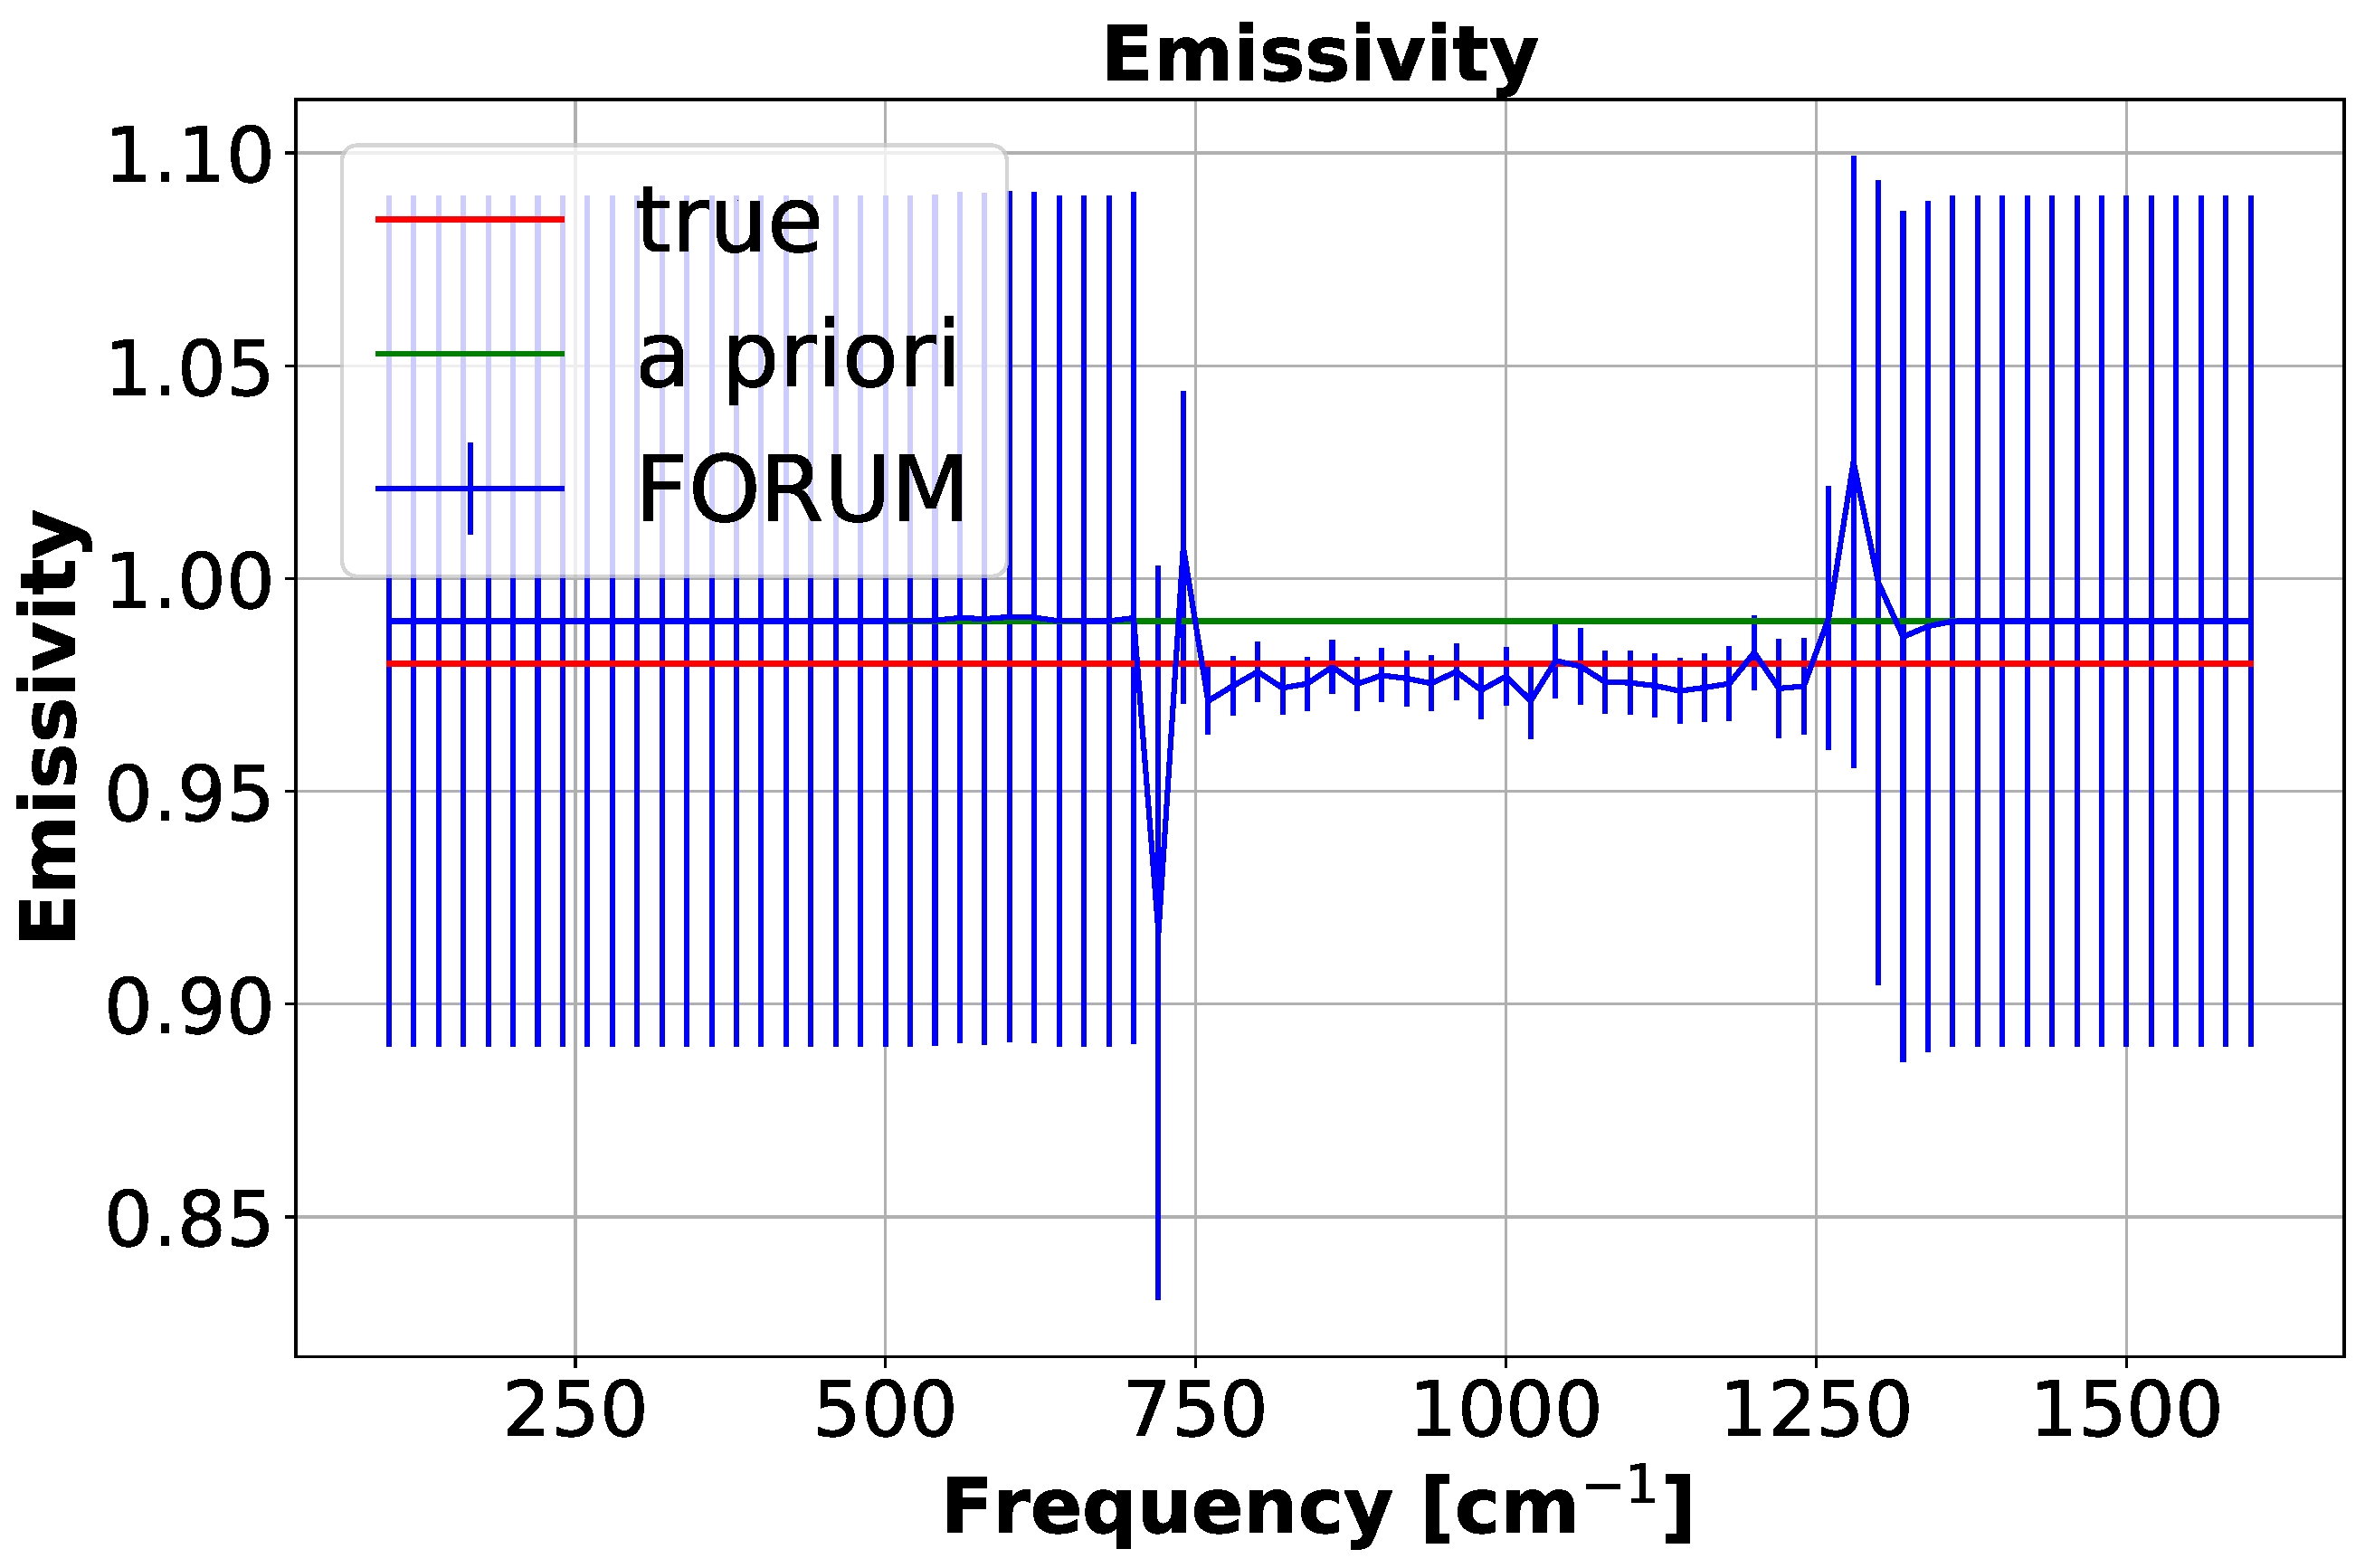
Finally, Figure 9 shows the retrieved surface emissivity. FORUM provides meaningful information in the 700–1300 cm−1 spectral range, where the retrieved emissivity deviates from the a priori and approaches the true values. Outside this range, the retrieved emissivity remains superimposed on the a priori, indicating no sensitivity of the FORUM measurements to surface emissivity in those spectral regions.

3.2. IASI-NG Measurement Simulation Example

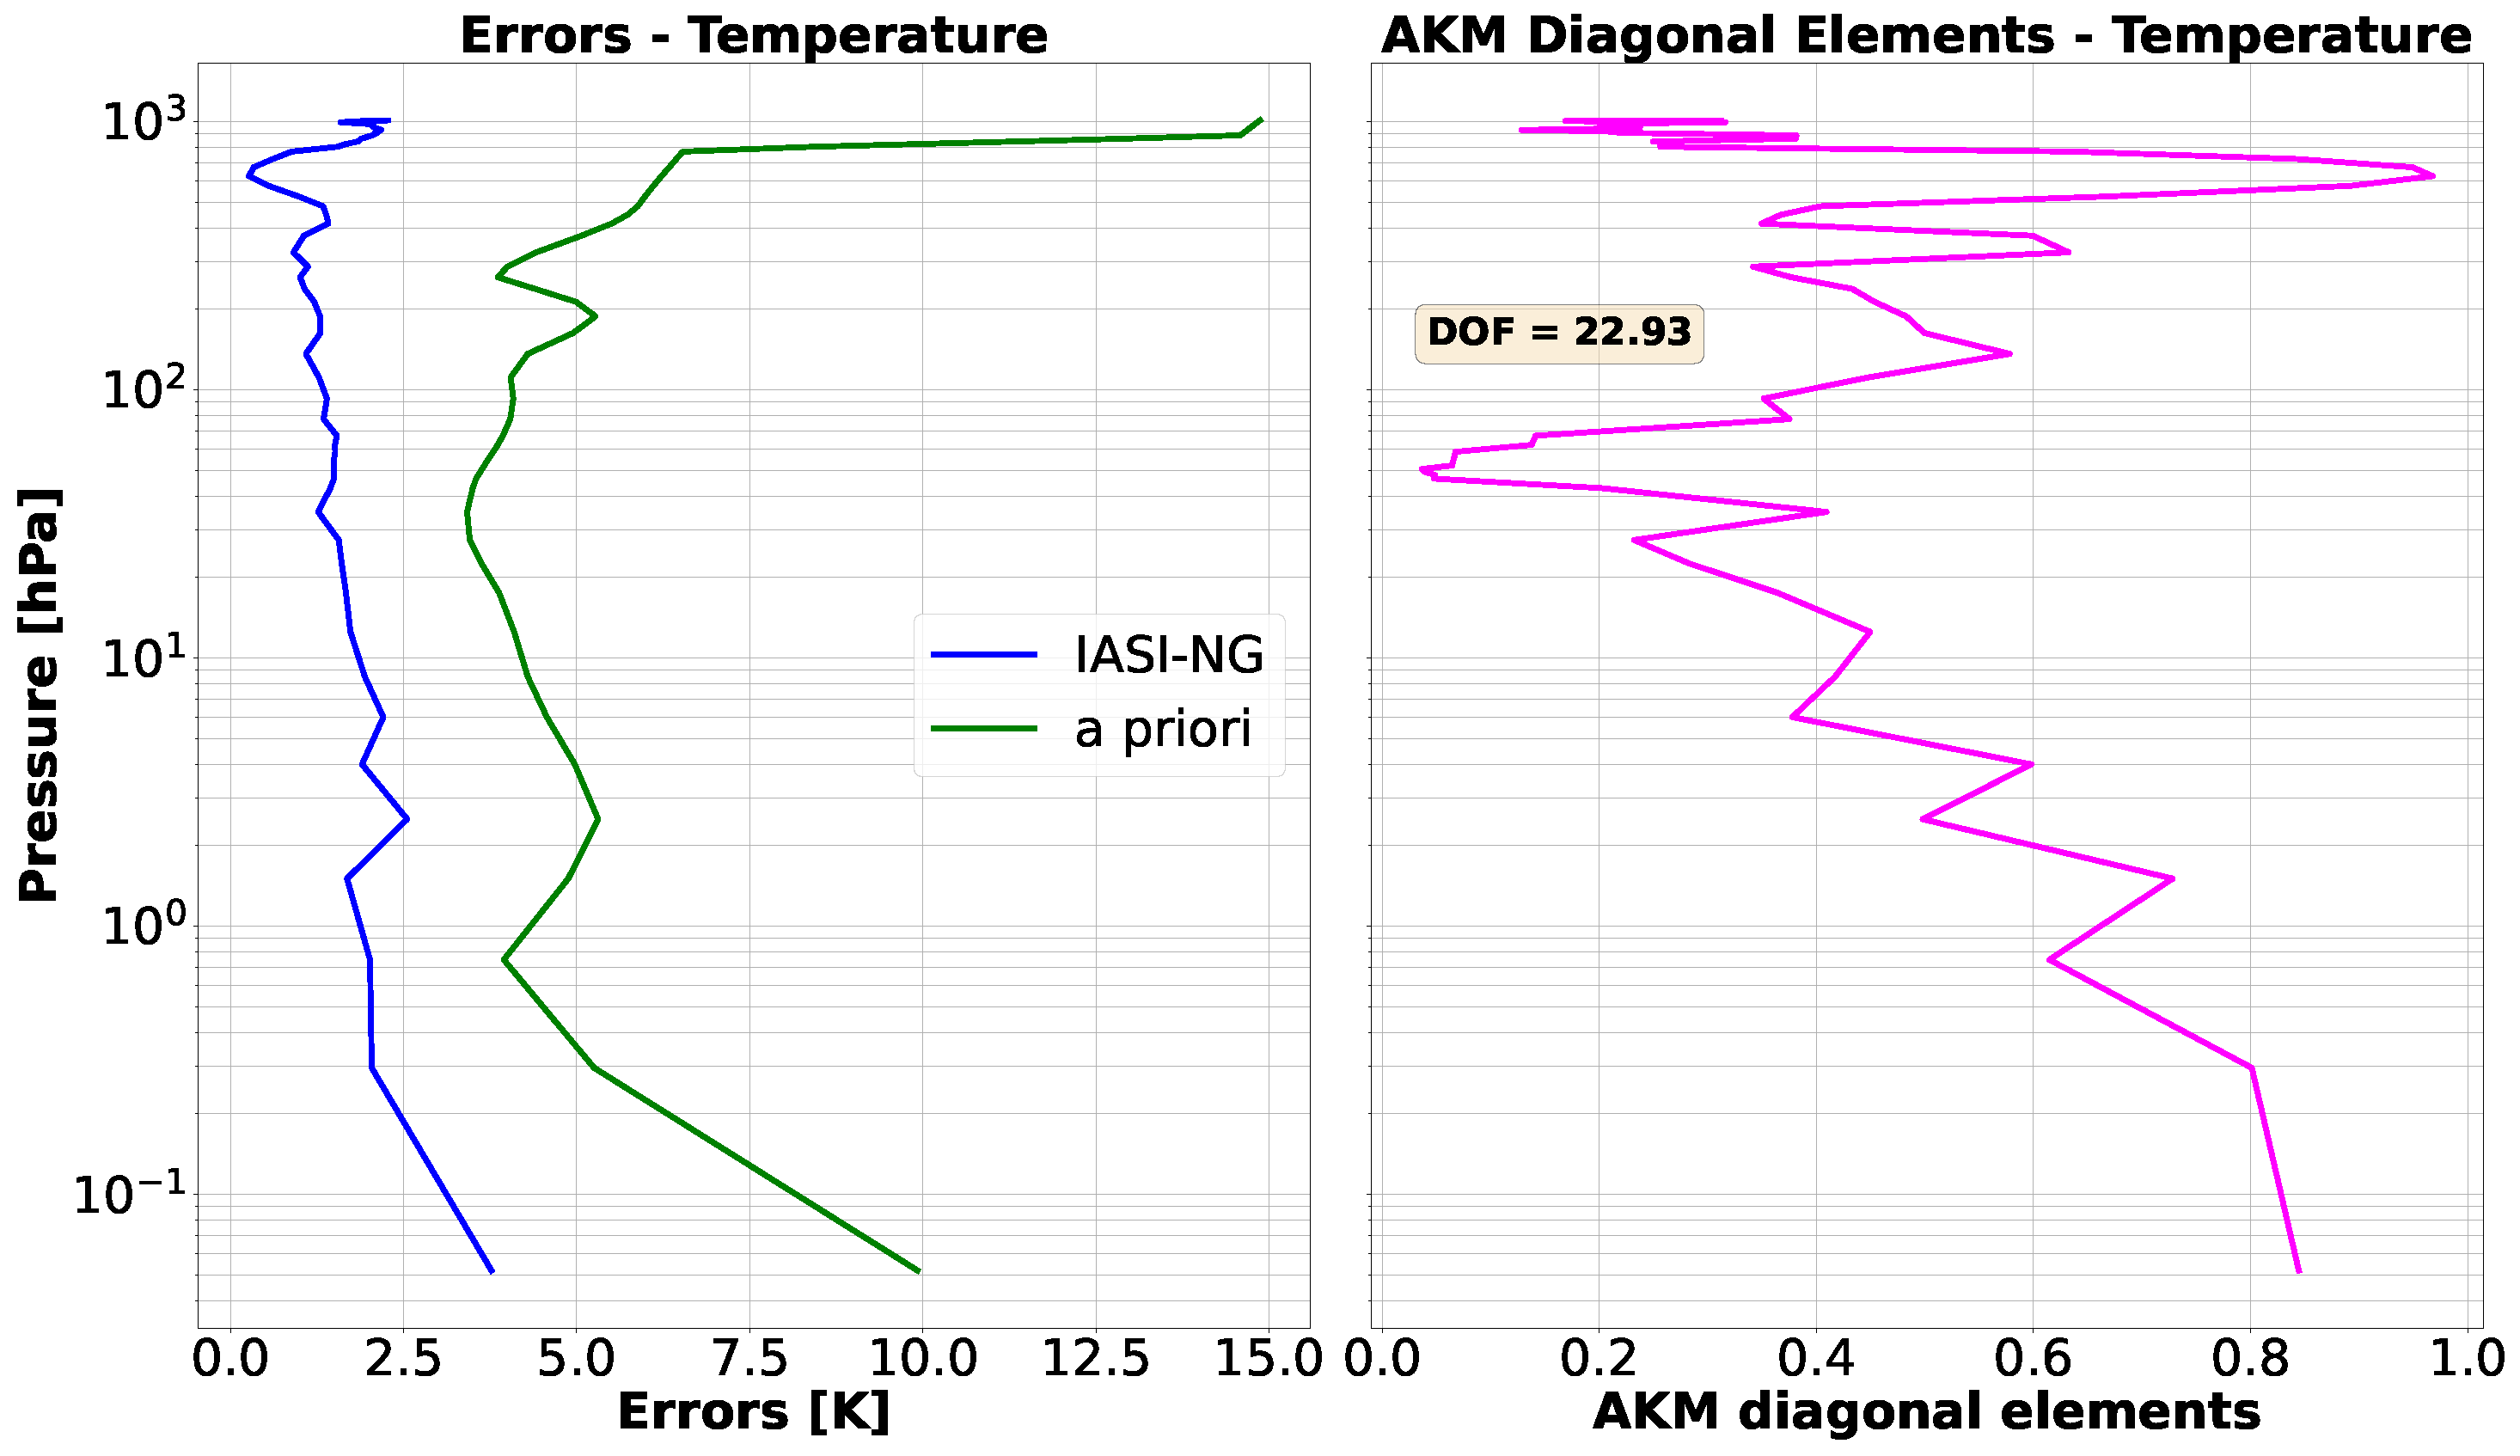
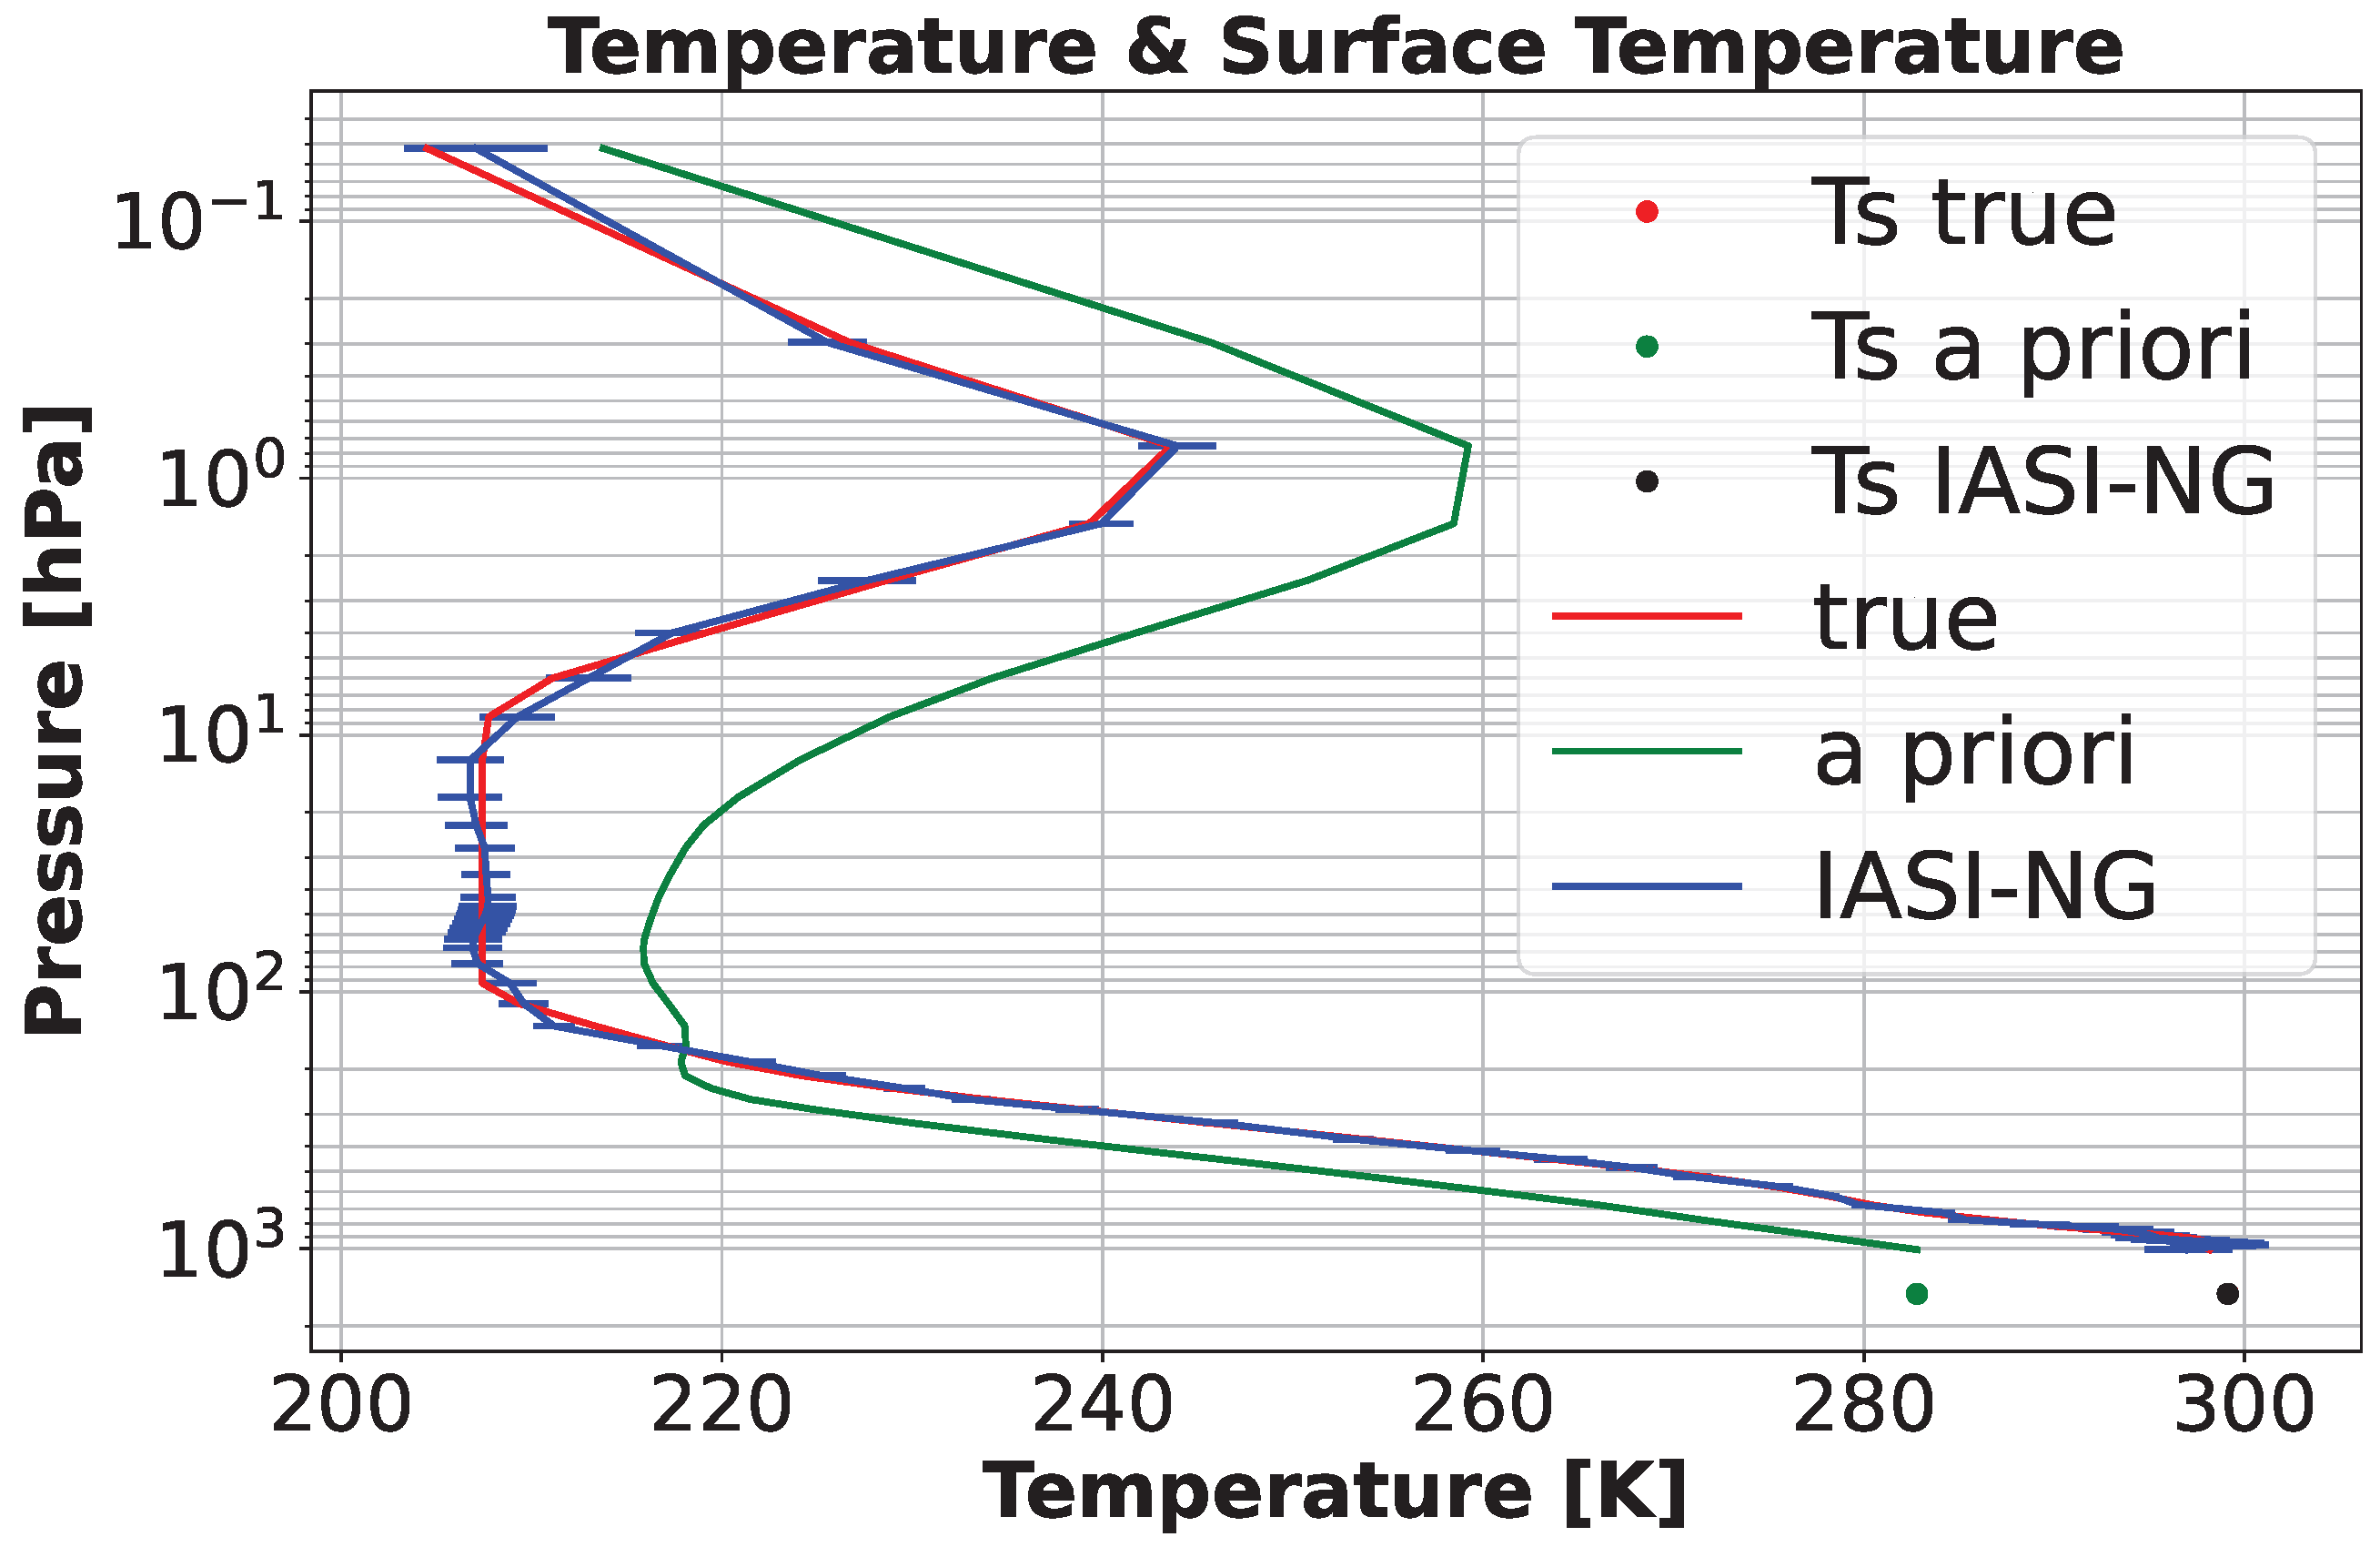
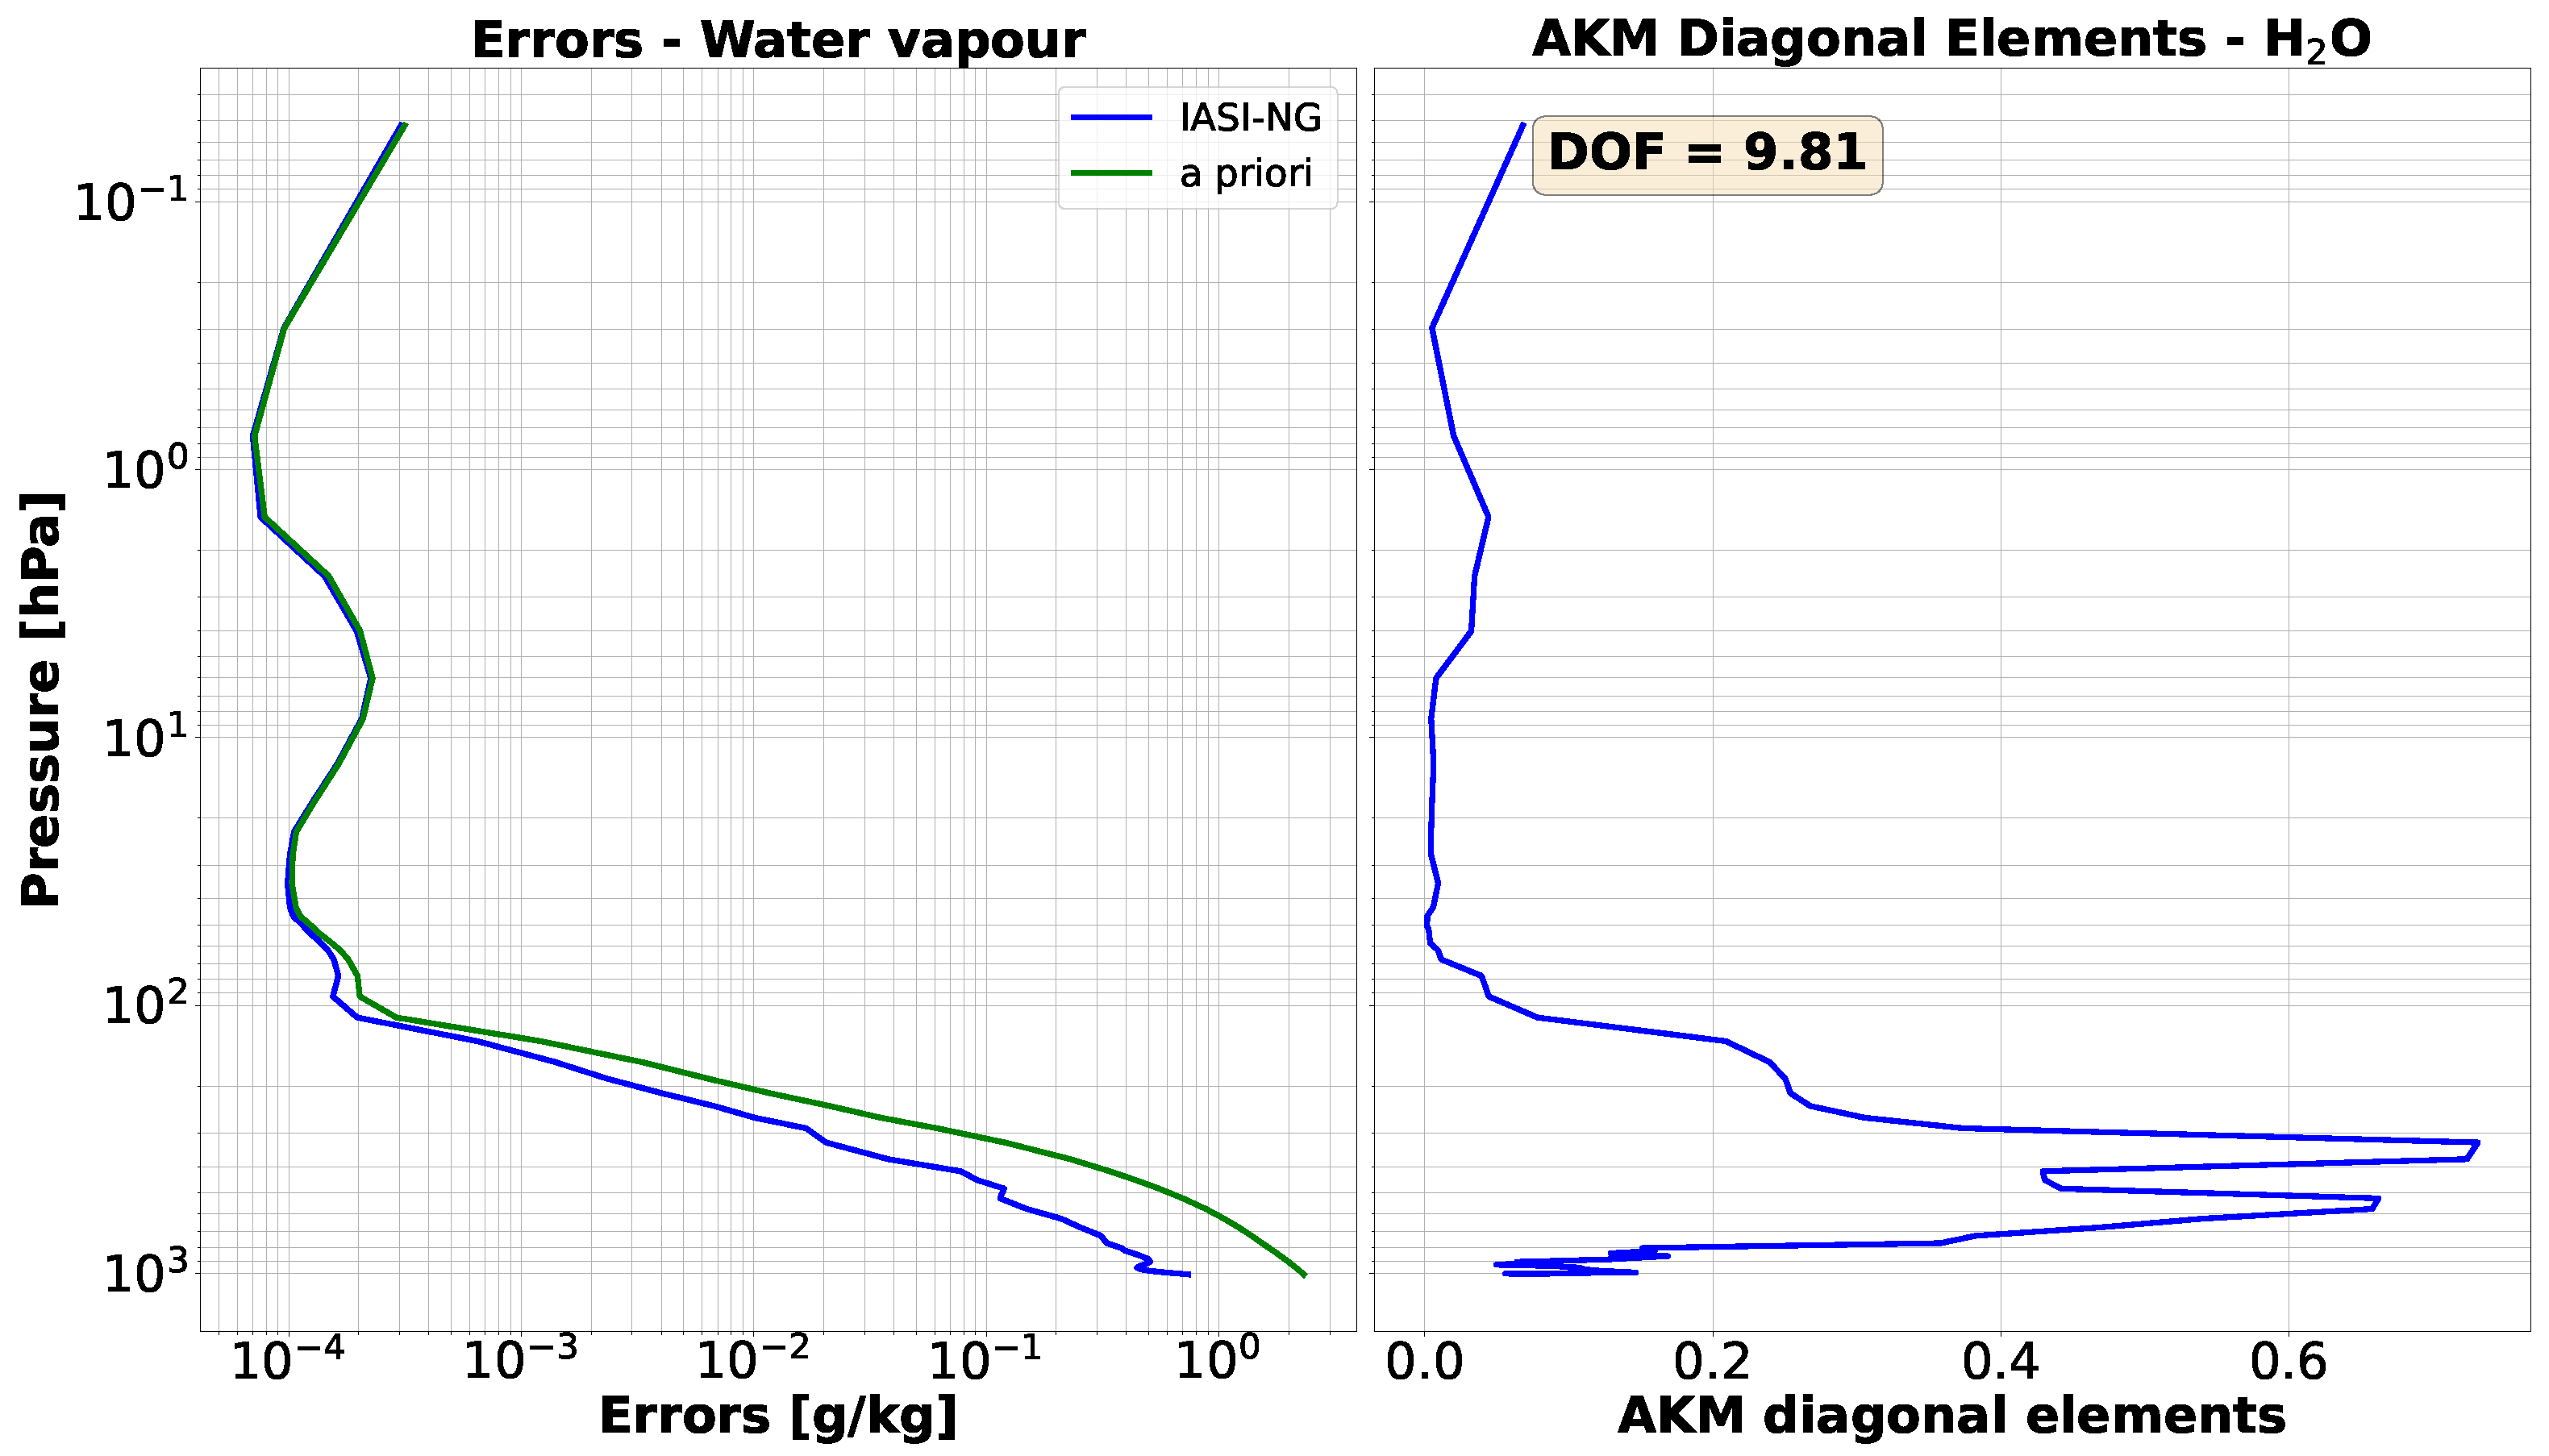
The simulated retrieved profiles for IASI-NG are shown in Figure 10, Figure 11, Figure 12, Figure 13 and Figure 14. Overall, the retrieval performance is qualitatively similar to that of FORUM, but with notable differences that reflect the distinct spectral characteristics of the two instruments. For temperature (Figure 10 and Figure 11), the retrieved profile closely follows the true state across the full pressure range, including the upper atmosphere. As for FORUM, the retrieved profile diverges from the a priori even at higher altitudes, confirming that IASI-NG also provides meaningful sensitivity beyond the troposphere. However, the AKM diagonal elements for IASI-NG show significantly higher values than those of FORUM, reaching a maximum of approximately 1.0 both in the lower troposphere and in the stratosphere above 40 km. This results in a total of 22.9 DOFs for temperature, reflecting the superior sensitivity of IASI-NG with respect to FORUM across the full atmospheric column. Correspondingly, the total retrieval errors are lower than those of FORUM throughout the profile, consistent with the higher spectral resolution and reduced noise of IASI-NG.
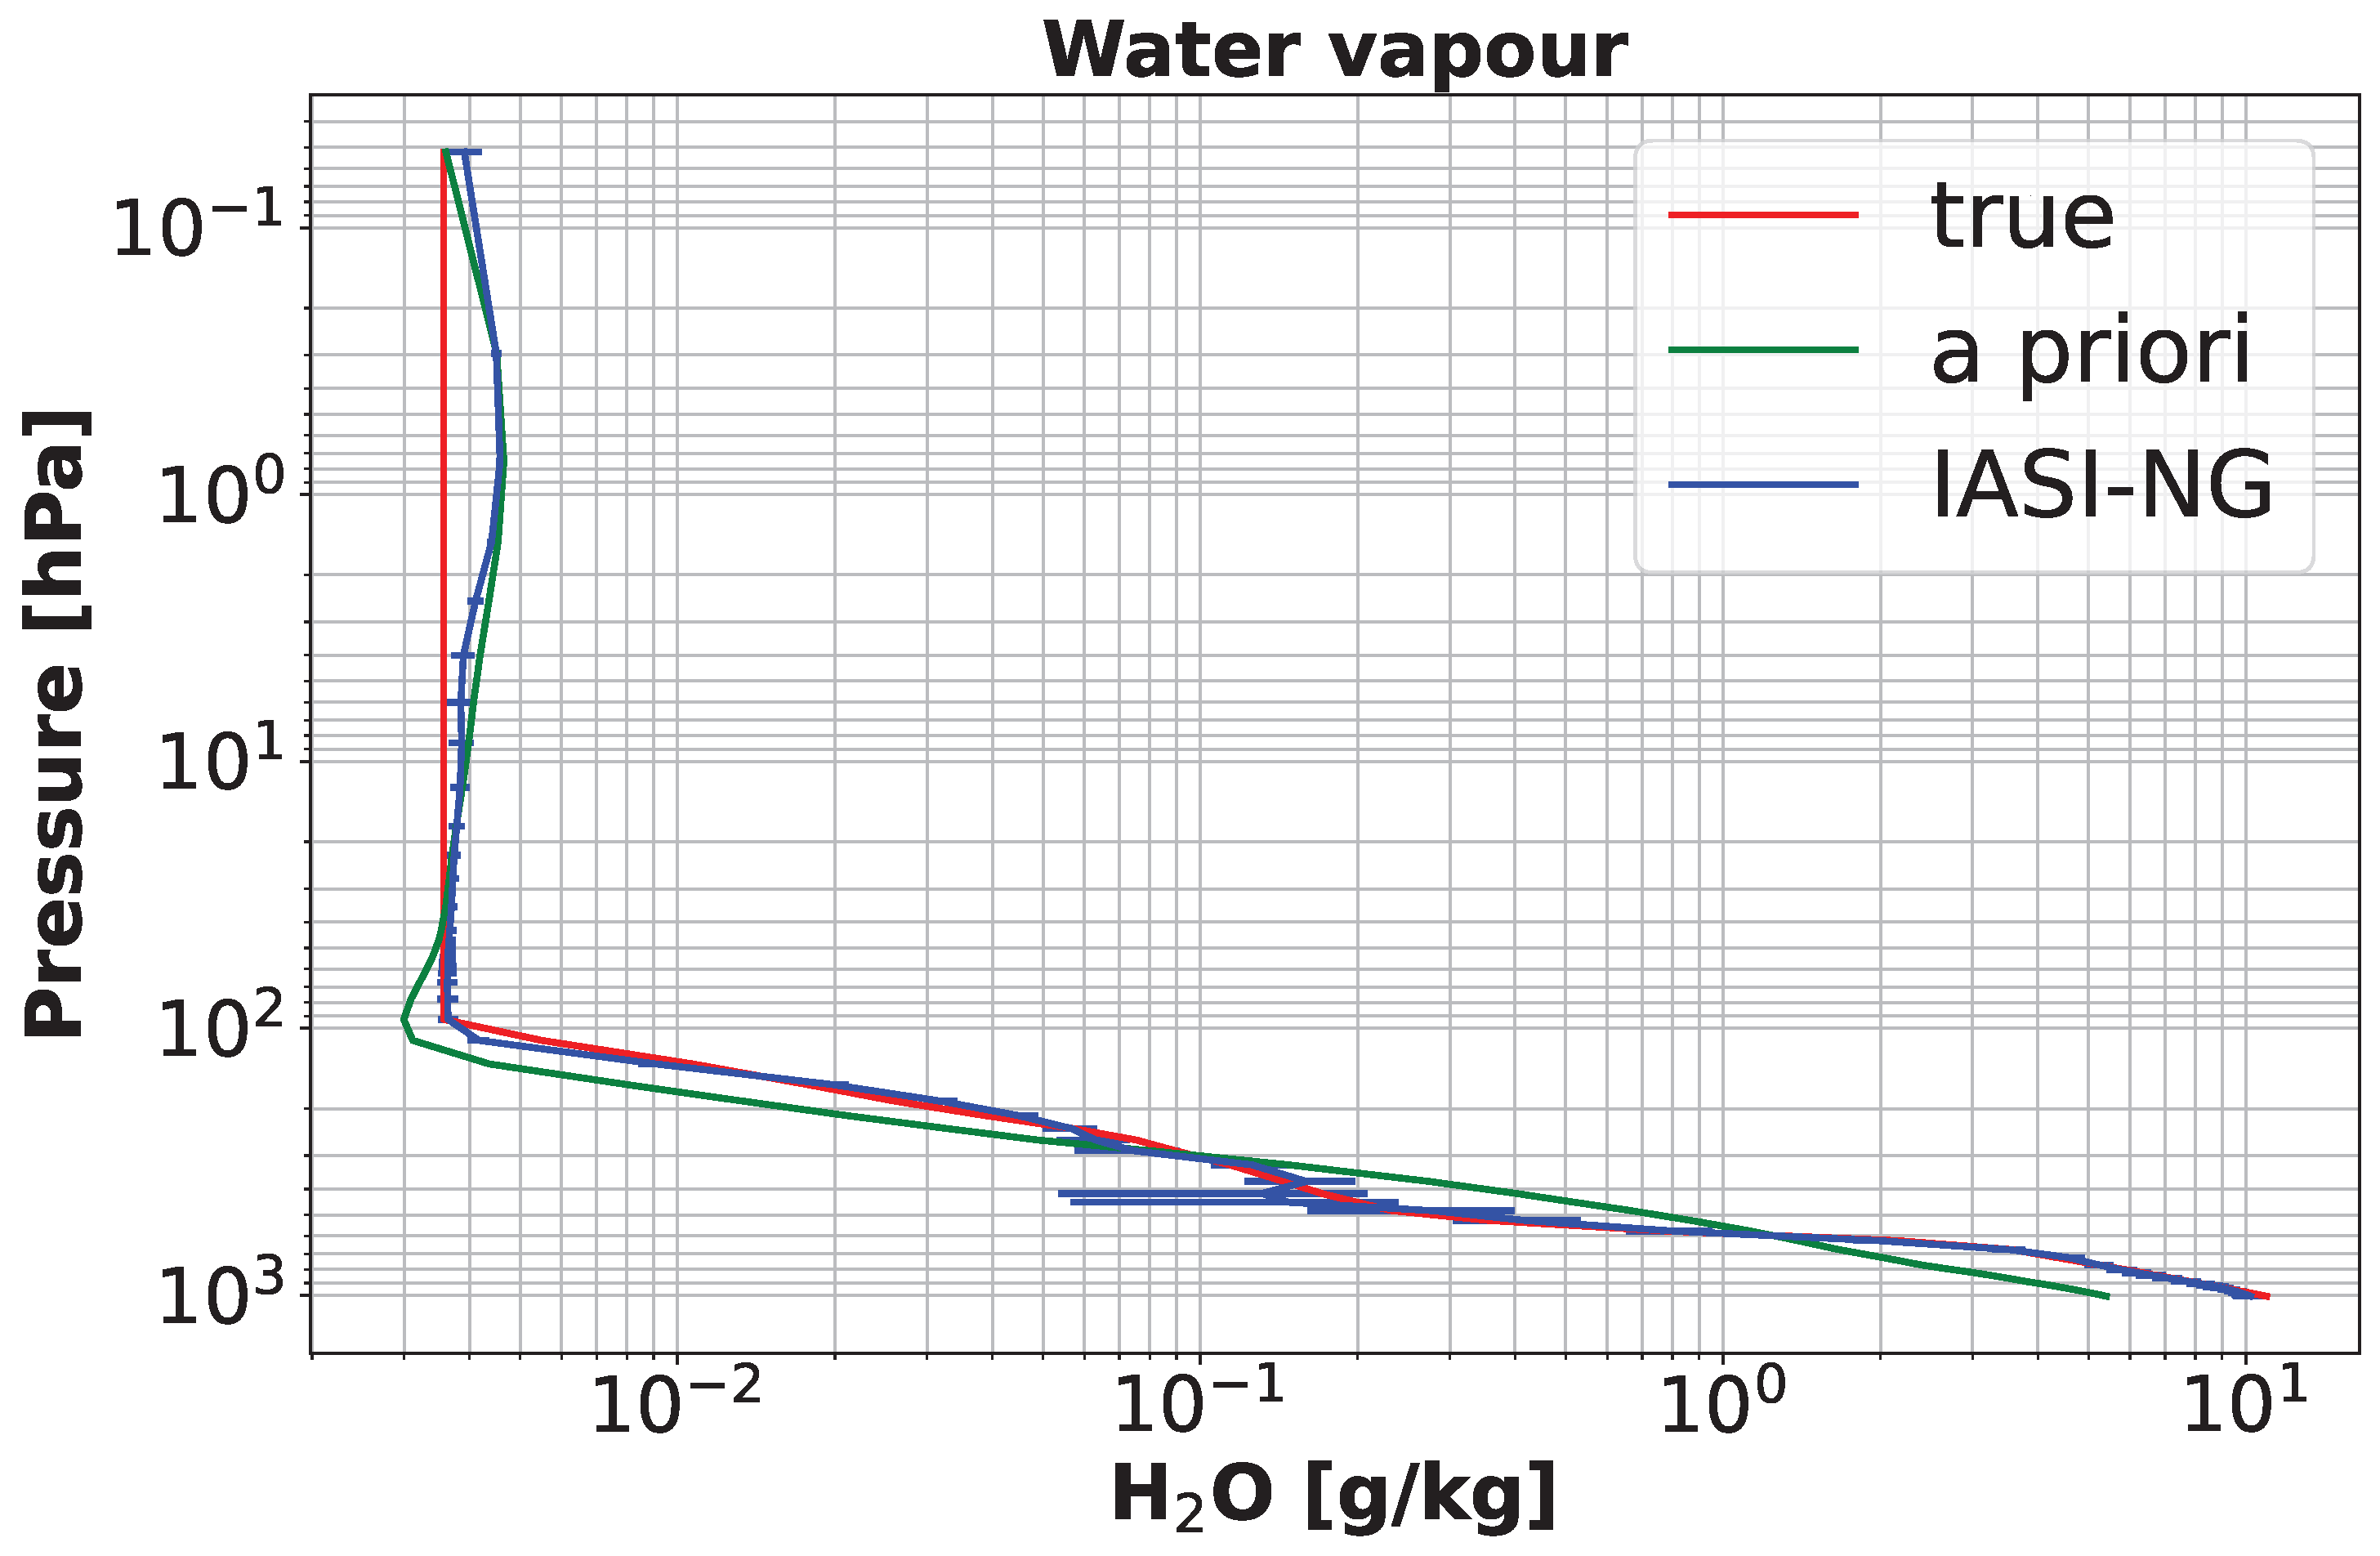
The water vapor retrieval (Figure 12 and Figure 13) shows the same qualitative behaviour as FORUM below the tropopause, with the retrieved profile closely following the true state. Above the tropopause, the retrieved profile collapses onto the a priori, confirming that neither instrument carries significant information on stratospheric water vapor. However, the AKM diagonal elements for IASI-NG reach higher values than those of FORUM throughout the troposphere, with a peak sensitivity of approximately 0.7 in the lower troposphere compared to 0.5 for FORUM, and demonstrate a higher sensitivity above 10 hPa. This results in a total of 9.8 DOFs for water vapor, significantly higher than the 5.8 DOFs obtained for FORUM, reflecting the superior sensitivity of IASI-NG due to its broader spectral coverage in the thermal infrared.
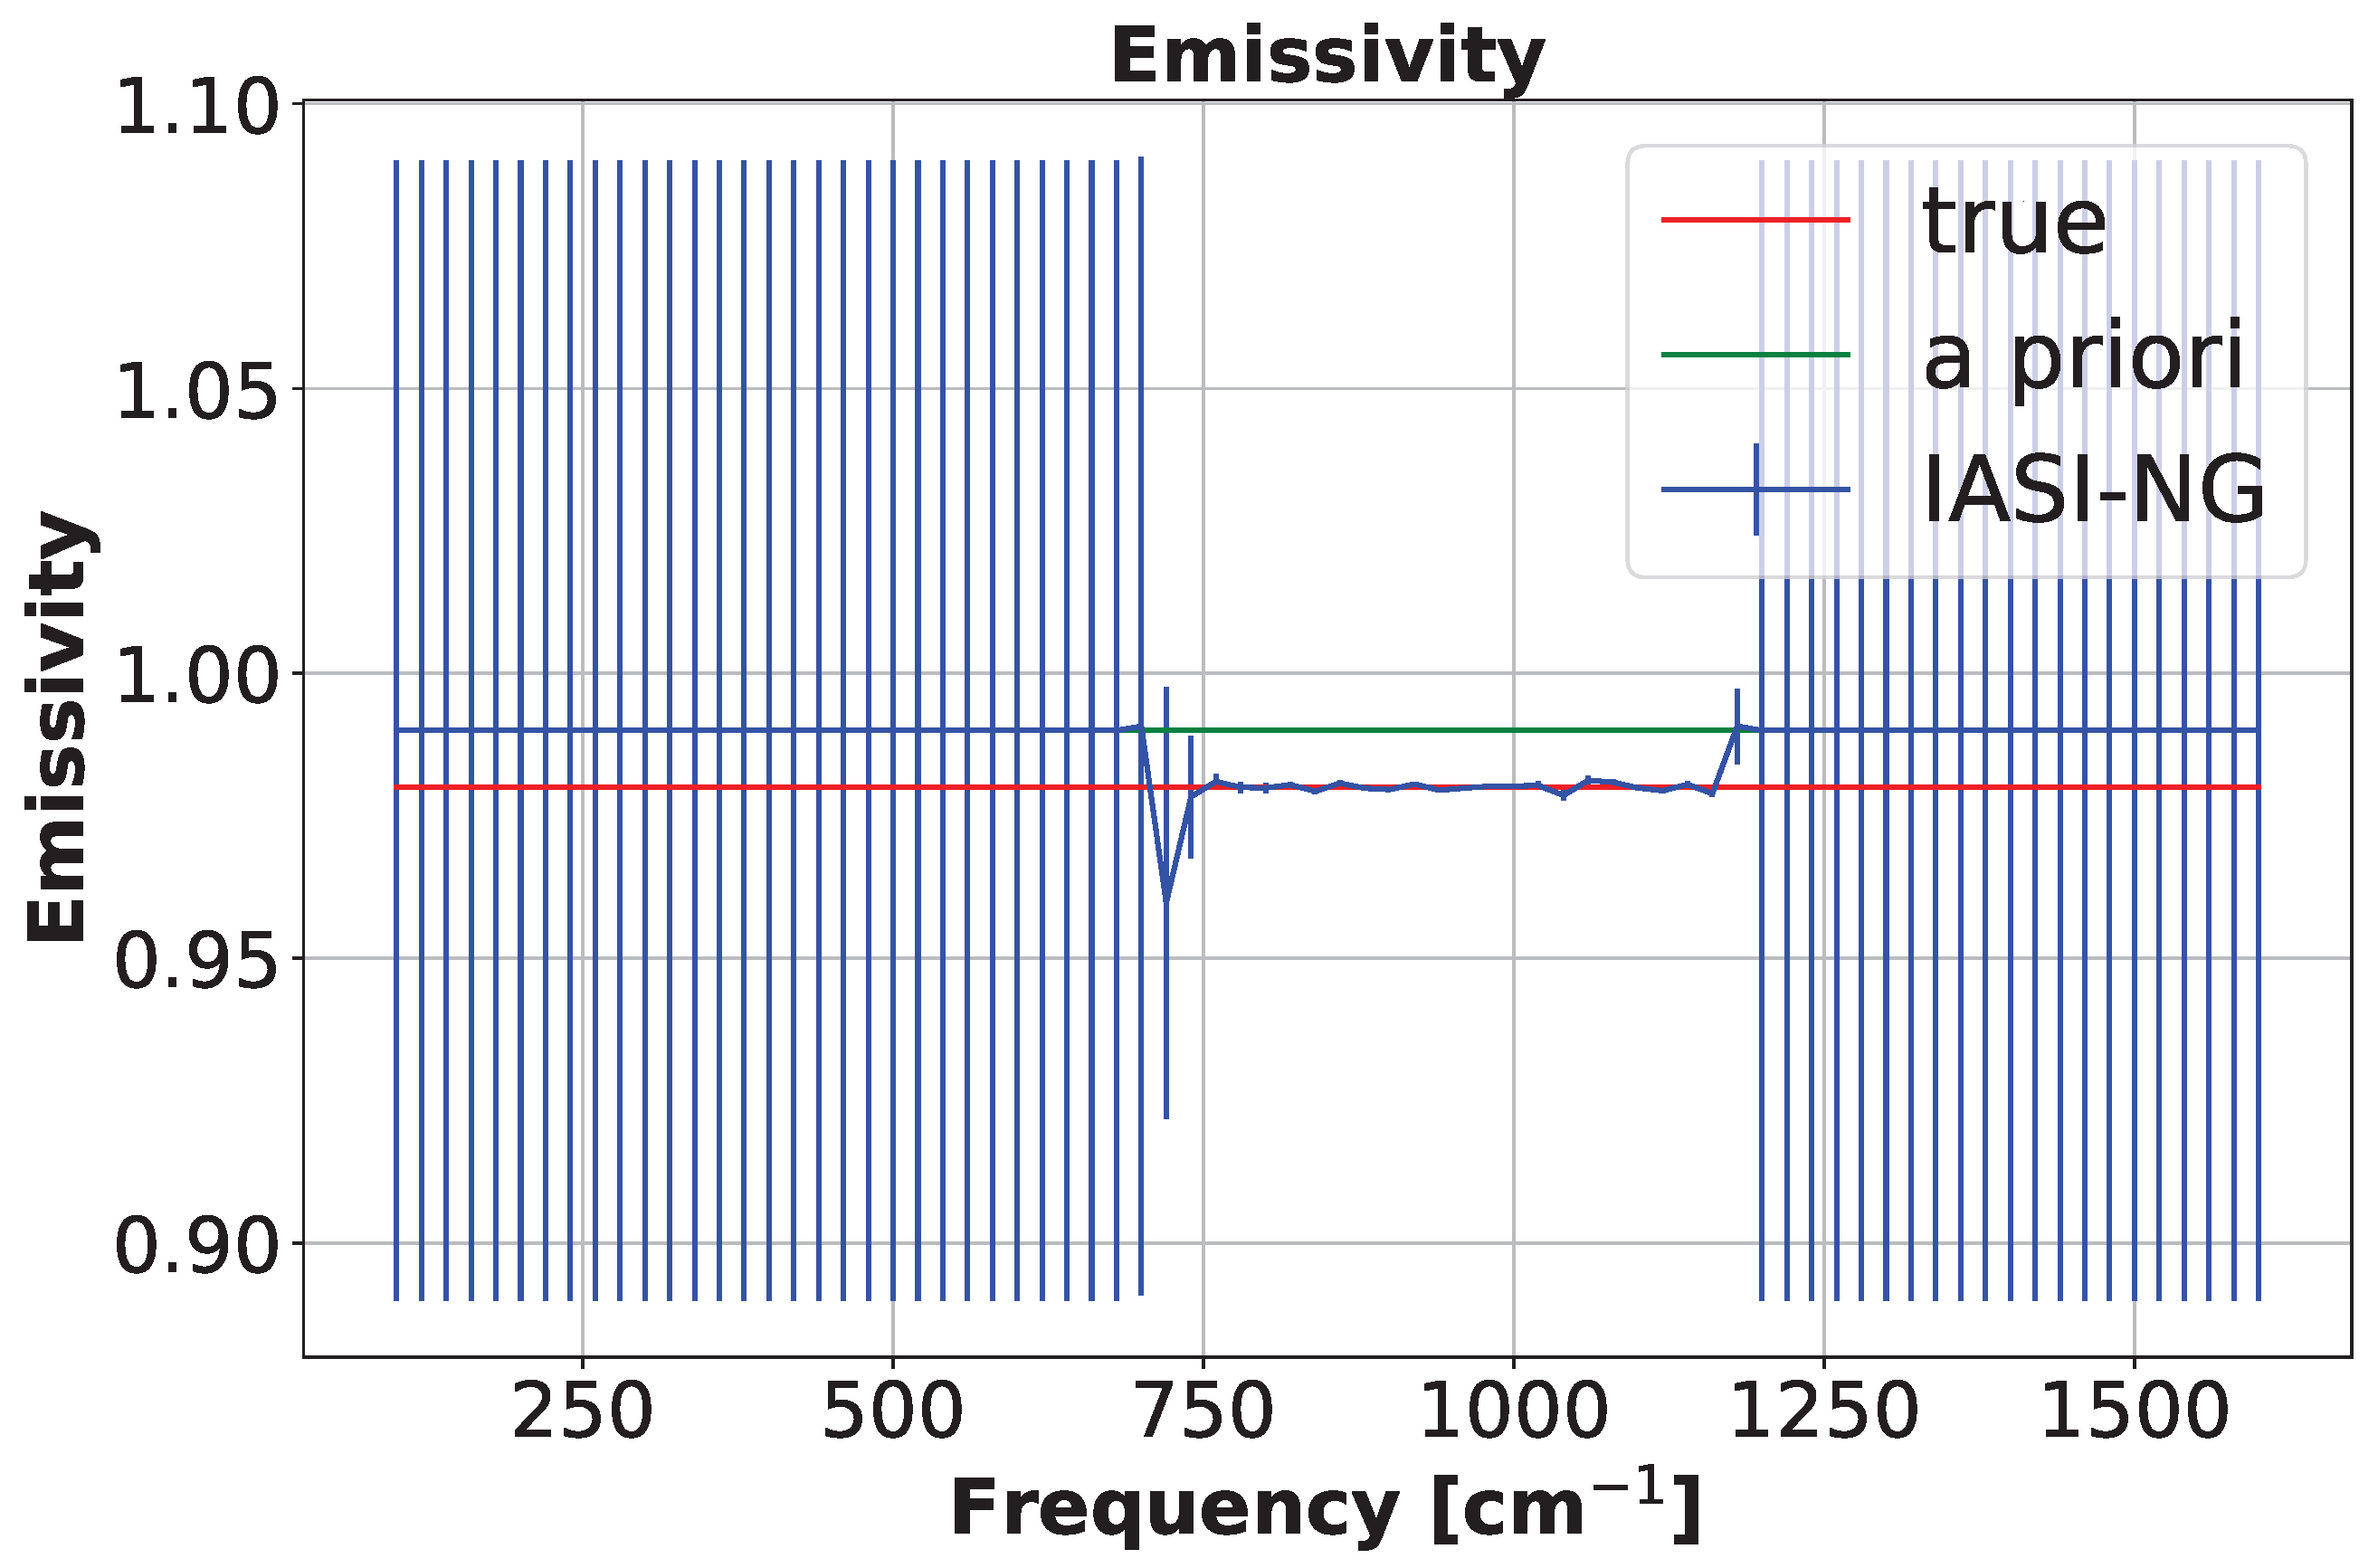
The surface emissivity retrieved from IASI-NG (Figure 14) shows sensitivity in the 700–1200 cm−1 range, slightly narrower than the 700–1300 cm−1 range observed for FORUM.

4. Discussion

4.1. Comparison Between FORUM and IASI-NG Retrieval

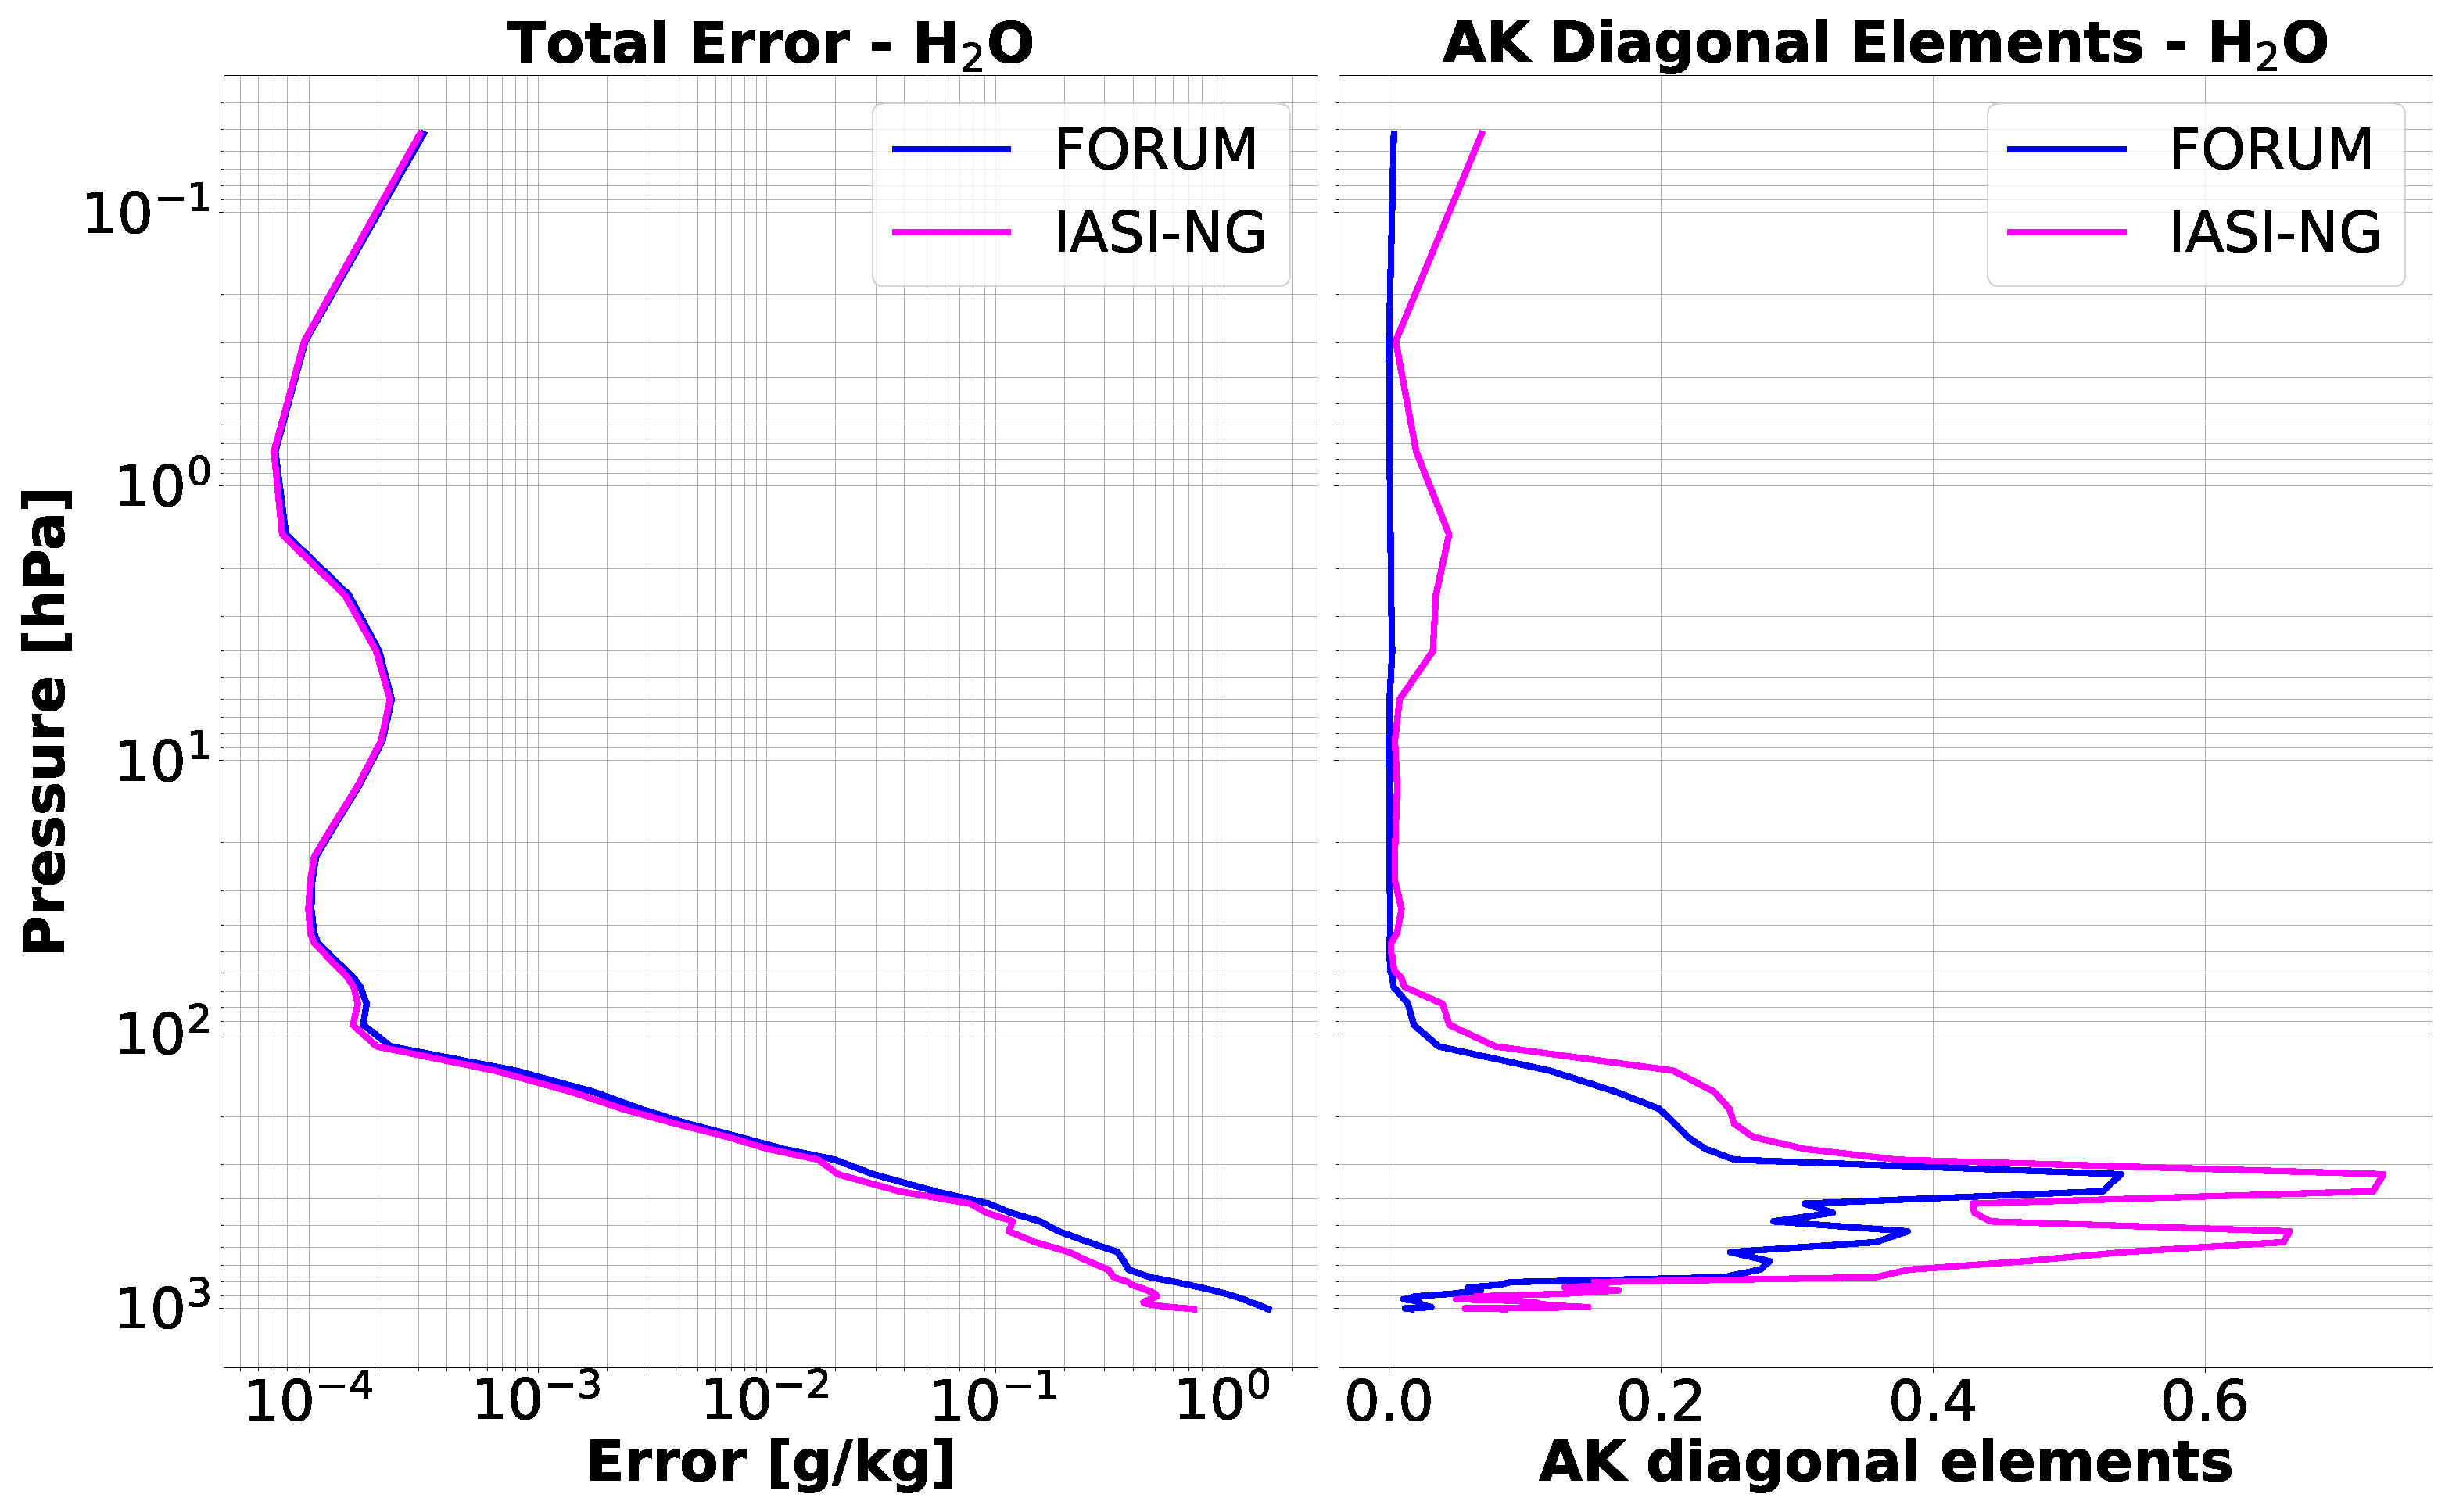
In order to evaluate the complementary capabilities of the two sensors, we carried out a comparison analysis based on the quantities shown in Section 3.1 and Section 3.2. Figure 15 and Figure 16 show a comparison of FORUM and IASI-NG performance for the retrieval of water vapor and temperature, evaluating the profile of the total errors and that of the diagonal elements of the AK matrices. For water vapor retrieval, IASI-NG shows higher sensitivity throughout the troposphere, with AKM diagonal elements reaching peak values of approximately 0.7 in the lower troposphere, while FORUM exhibits slightly lower but still appreciable sensitivity, with a peak of approximately 0.5 at around 300 hPa. Both instruments show negligible sensitivity above the tropopause, where water vapor concentrations become very low. The total retrieval error is larger for FORUM in the troposphere (up to 1.5 g/kg), whereas IASI-NG presents lower errors (0.5–0.8 g/kg) due to its higher sensitivity.
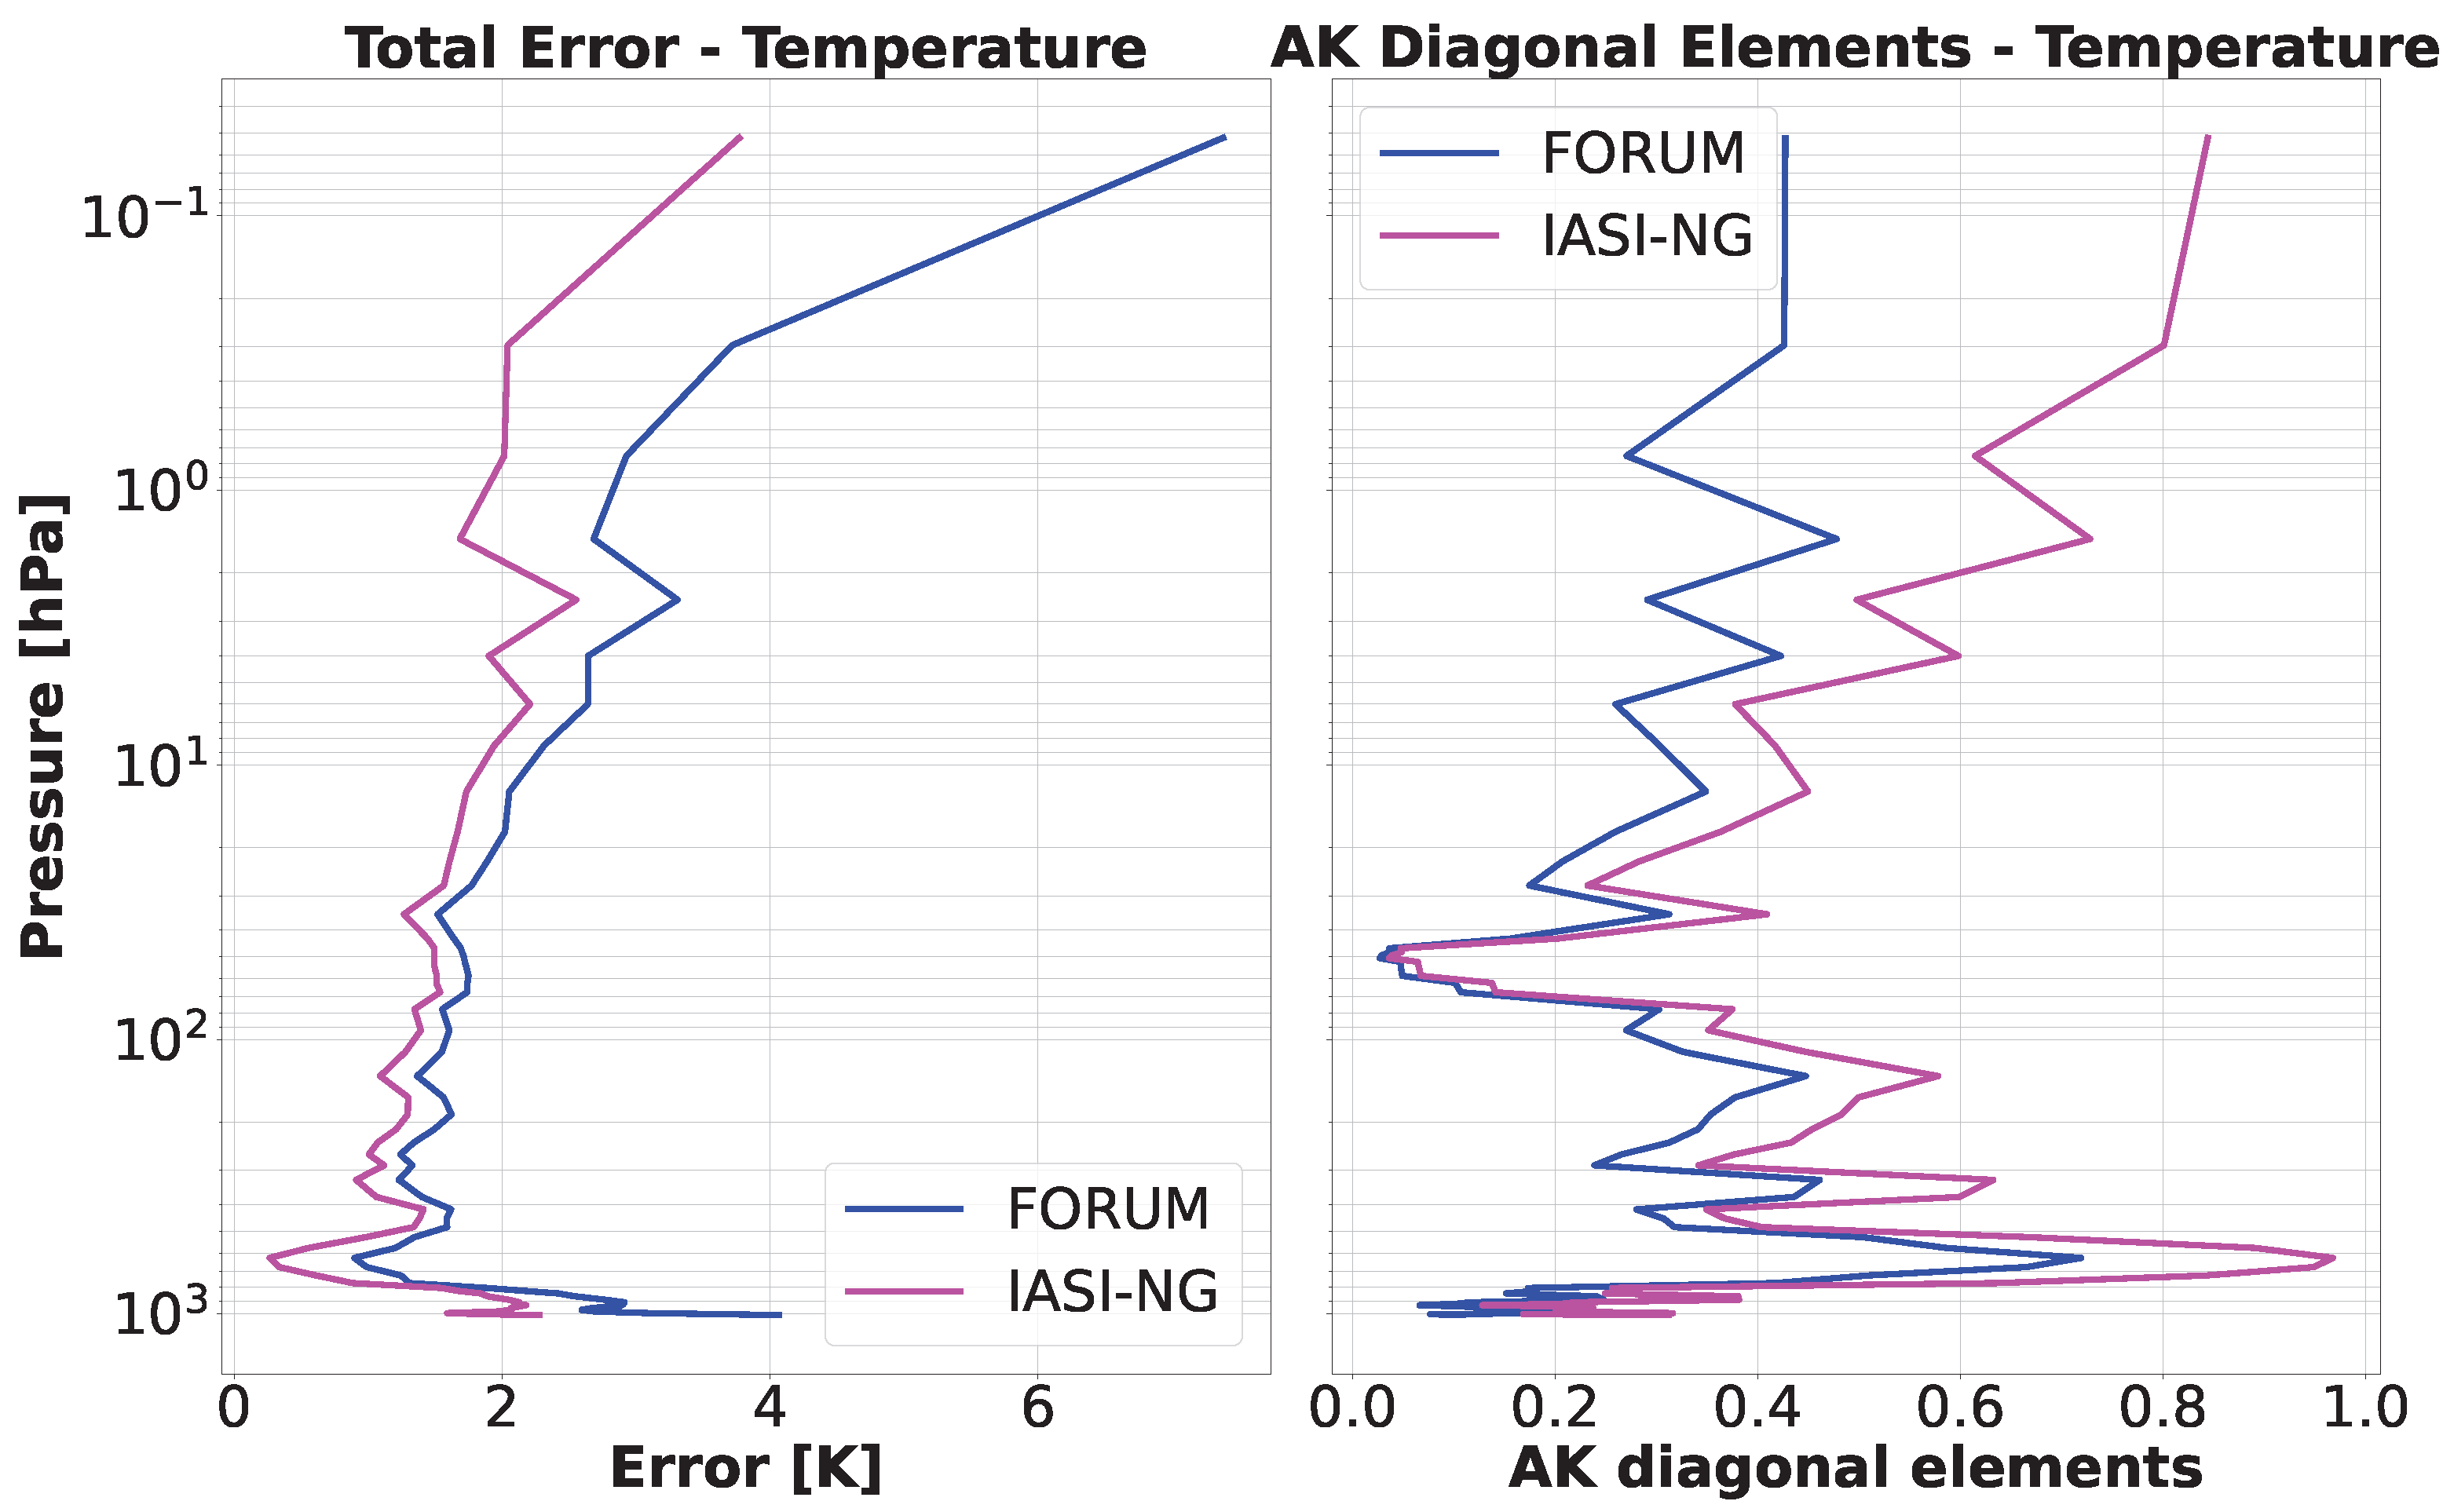
For temperature retrieval, the difference between the two instruments is more pronounced. IASI-NG demonstrates significantly higher sensitivity across the full atmospheric column, with AKM diagonal elements reaching values close to 1.0 both in the lower troposphere (around 5 km) and in the stratosphere above 40 km. FORUM shows reduced but still meaningful sensitivity (0.1–0.7), particularly in the troposphere. Total temperature errors remain within 1–2 K for IASI-NG throughout the profile, while FORUM presents somewhat larger errors (2–4 K), which can exceed 5 K above 50 km.
A quantitative summary of the information content for both instruments is provided in Table 7, which reports the number of DOFs partitioned between troposphere and stratosphere. For water vapor, IASI-NG provides 9.8 total DOFs (9.1 tropospheric, 0.7 stratospheric), compared to 5.8 for FORUM (5.6 tropospheric, 0.2 stratospheric). For temperature, the difference is even more striking: IASI-NG yields 22.9 total DOFs (13.6 tropospheric, 9.3 stratospheric), while FORUM provides 15.5 (9.3 tropospheric, 6.2 stratospheric). The substantial stratospheric DOFs for both instruments confirm meaningful vertical resolution capability at higher altitudes, which is particularly relevant for capturing stratospheric temperature structure.
In summary, IASI-NG offers superior performance for both variables, but FORUM still provides significant complementary information.

4.2. Comparison with Previous Studies

A previous study regarding FORUM retrieval performance [5], highlighted that the temperature retrieval has a limited performance, particularly above 4 km and near the surface. We find instead a significant sensitivity of FORUM to atmospheric temperature variability in the stratosphere see Table 7. The vertical distribution of information content obtained in this study can be understood in terms of the spectral sensitivity of the FIR and MIR regions to different atmospheric layers. As discussed in [2,40], the FIR spectral region (100–667 cm−1) is dominated by the rotational band of water vapor and is between 3 and 5 times more sensitive than the MIR to changes in upper-tropospheric water vapor content, with a sensitivity peak located between approximately 5 and 15 km altitude. This is consistent with the AKM diagonal elements obtained for FORUM water vapor retrieval in this study (Figure 8), which reach their maximum at around 300 hPa and drop rapidly to zero near 80 hPa, confirming that the FIR provides its largest water vapor information content in the upper troposphere, where the rotational band remains partially transparent and the Jacobians are largest in magnitude. The comparison with IASI-NG shown in Figure 15 further highlights this complementarity: while IASI-NG achieves higher sensitivity throughout the troposphere owing to its broader MIR spectral coverage, FORUM provides a distinct and independent contribution concentrated in the upper troposphere, consistent with the physical sensitivity of the FIR water vapor band. A comparison with the results reported by [13] for a mid-latitude scenario shows good quantitative agreement for water vapor: in that study, approximately 7 DOFs are reported for FORUM water vapor retrieval, with more than 90% concentrated in the lowest 25 km, while in our study we obtain 5.8 total DOFs with 97% (5.6 out of 5.8) located in the troposphere, which is fully consistent with this distribution.
For temperature, the physical interpretation is more nuanced. The FIR is primarily sensitive to lower and middle tropospheric temperature (3–10 km) through the water vapor rotational band continuum and window regions, while the 15 μm CO2 absorption band provides sensitivity to stratospheric temperature (25–40 km) in its core and to mid-to-upper tropospheric temperature (5–20 km) in its wings. The unexpected stratospheric sensitivity of FORUM found in this study (reflected in AKM diagonal values of approximately 0.4 in the stratosphere and 6.2 stratospheric DOFs (Figure 6, Table 7)) is therefore not attributable to the FIR water vapor band alone. Rather, it arises from the overlap of the FORUM spectral range (100–1600 cm−1) with the CO2 absorption band centered at 667 cm−1, whose low-frequency wing falls within the FORUM measurement range. This portion of the CO2 band provides sensitivity to stratospheric temperature that has not been fully characterized in previous FORUM retrieval studies. In this respect, the comparison with [13] is particularly informative: for a mid-latitude scenario, that study reports approximately 6 total DOFs for FORUM temperature retrieval, with 75% concentrated in the lowest 25 km, implying approximately 4.5 tropospheric DOFs. In our study, we obtain 15.5 total DOFs, with 9.3 tropospheric and 6.2 stratospheric, corresponding to only 60% of the total DOFs in the lowest 25 km. This proportionally larger stratospheric contribution (40% in our study versus 25% in [13]) provides further quantitative evidence of the enhanced stratospheric sensitivity identified in this work, and is consistent with the key finding of our analysis. The comparison with IASI-NG shown in Figure 16 confirms that, while IASI-NG achieves significantly higher AKM diagonal values throughout the atmospheric column (DOF = 22.9 versus 15.5 for FORUM), FORUM still provides meaningful and complementary stratospheric sensitivity that can contribute to the characterization of the upper atmospheric thermal structure. The different choice of a priori error covariance used in this work with respect to previous studies, such as [6,13], is likely a contributing factor to the quantitative differences observed in the absolute DOF values, as larger a priori errors allow the retrieval to draw more information from the measurements rather than from the prior, effectively amplifying the stratospheric sensitivity signal. These results suggest that the physical origin of FORUM’s stratospheric temperature sensitivity warrants further investigation, in particular through dedicated sensitivity studies using spectrally resolved Jacobians partitioned across the FIR and CO2 band contributions.

5. Conclusions

This study presents an assessment of the information content achievable from synthetic FORUM and IASI-NG measurements, with a focus on retrieved atmospheric temperature and water vapor profiles, surface temperature, and surface emissivity. By exploiting a linearized representation of the retrieval transfer function, we developed an efficient framework to generate realistic Level-2 products and to quantify their sensitivity and vertical resolution prior to mission launch.
The results confirm that IASI-NG provides superior overall performance for atmospheric profiling, with higher number of DOFs and lower retrieval errors for both temperature and water vapor throughout the troposphere and into the stratosphere. These characteristics are consistent with its higher spectral resolution and lower instrumental noise, and reinforce its central role in operational numerical weather prediction.
A key outcome of this work is the identification of a previously underappreciated sensitivity of FORUM to atmospheric temperature variability in the stratosphere. While FORUM was primarily designed to maximize information content in the lower troposphere, the simulated retrievals reveal meaningful averaging kernel values and a significant number of DOFs in the stratosphere. This result suggests that far-infrared observations can contribute to temperature sounding at higher altitudes than originally anticipated. Although FORUM provides fewer independent pieces of information compared to IASI-NG, it delivers complementary and independent sensitivity through its unique coverage of the far-infrared spectral region.
This work represents a first step toward evaluating the potential exploitation of FORUM Level-2 products in numerical weather prediction systems. It should be noted that the present analysis was carried out for a single scenario; therefore, the generality of the results should be further assessed in future studies. Therefore, we plan to extend the analysis to a broader range of atmospheric scenarios and investigate the impact of assimilating retrieved profiles, as opposed to radiance measurements, to fully assess the operational value of far-infrared satellite observations.


Author Contributions

Conceptualization, E.B., S.C. and C.T.; methodology, S.C.; software, C.T., E.B. and S.C.; validation, E.B., S.C. and C.T.; formal analysis, E.B., S.C., C.T., G.P., S.M. and L.R.; investigation, E.B., S.C. and C.T.; resources, A.O. and U.C.; data curation, C.T., S.M. and L.R.; writing—original draft preparation, E.B., S.C. and C.T.; writing—review and editing, all authors; visualization, C.T.; supervision, A.O. and U.C.; project administration, A.O.; funding acquisition, A.O. All authors have read and agreed to the published version of the manuscript.

Funding

The results reported in the article were obtained in the context of the Earth-Moon-Mars (EMM) project, led by INAF in partnership with ASI and CNR, funded under the National Recovery and Resilience Plan (NRRP), Mission 4, Component 2, Investment 3.1: “Fund for the realisation of an integrated system of research and innovation infrastructures”—Action 3.1.1 funded by the European Union—NextGenerationEU.

Institutional Review Board Statement

Not applicable.

Informed Consent Statement

Not applicable.

Data Availability Statement

The raw data supporting the conclusions of this article will be made available by the authors on request.

Acknowledgments

The authors are grateful to Marco Ridolfi for the fruitful discussions.

Conflicts of Interest

The authors declare no conflicts of interest.

References

  1. Turner, E.; Lee, H.T.; Tett, S. Using IASI to simulate the total spectrum of outgoing long-wave radiances. Atmos. Chem. Phys. 2015, 15, 6561–6575. [Google Scholar] [CrossRef] [Scilit]
  2. Palchetti, L.; Brindley, H.; Bantges, R.; Buehler, S.A.; Camy-Peyret, C.; Carli, B.; Cortesi, U.; Del Bianco, S.; Di Natale, G.; Dinelli, B.M.; et al. Unique far-infrared satellite observations to better understand how Earth radiates energy to space. Bull. Am. Meteorol. Soc. 2020, 101, E2030–E2046. [Google Scholar] [CrossRef] [Scilit]
  3. Dong, Y.; Proistosescu, C.; Armour, K.; Battisti, D. Attributing historical and future evolution of radiative feedbacks to regional warming patterns using a Green’s function approach: The preeminence of the western Pacific. J. Clim. 2019, 32, 5471–5491. [Google Scholar] [CrossRef] [Scilit]
  4. Dinelli, B.; Del Bianco, S.; Castelli, E.; Di Roma, A.; Lorenzi, G.; Premuda, M.; Barbara, F.; Gai, M.; Raspollini, P.; Di Natale, G. GBB-Nadir and KLIMA: Two Full Physics Codes for the Computation of the Infrared Spectrum of the Planetary Radiation Escaping to Space. Remote Sens. 2023, 15, 2532. [Google Scholar] [CrossRef] [Scilit]
  5. Panditharatne, S.; Brindley, H.; Cox, C.; Siddans, R.; Murray, J.; Warwick, L.; Fox, S. Retrievals of water vapour and temperature exploiting the far-infrared: Application to aircraft observations in preparation for the FORUM mission. Atmos. Meas. Tech. 2025, 18, 717–735. [Google Scholar] [CrossRef] [Scilit]
  6. Ridolfi, M.; Del Bianco, S.; Di Roma, A.; Castelli, E.; Belotti, C.; Dandini, P.; Di Natale, G.; Dinelli, B.M.; C.-Labonnote, L.; Palchetti, L. FORUM Earth Explorer 9: Characteristics of Level 2 Products and Synergies with IASI-NG. Remote Sens. 2020, 12, 1496. [Google Scholar] [CrossRef] [Scilit]
  7. Clough, S.; Shephard, M.; Mlawer, E.; Delamere, J.; Iacono, M.; Cady-Pereira, K.; Boukabara, S.; Brown, P. Atmospheric radiative transfer modeling: A summary of the AER codes. J. Quant. Spectrosc. Radiat. Transf. 2005, 91, 233–244. [Google Scholar] [CrossRef] [Scilit]
  8. Liuzzi, G.; Masiello, G.; Serio, C.; Venafra, S.; Camy-Peyret, C. Physical inversion of the full IASI spectra: Assessment of atmospheric parameters retrievals, consistency of spectroscopy and forward modelling. J. Quant. Spectrosc. Radiat. Transf. 2016, 182, 128–157. [Google Scholar] [CrossRef] [Scilit]
  9. Ceccherini, S. Optimal variables for retrieval products. Atmosphere 2024, 15, 506. [Google Scholar] [CrossRef] [Scilit]
  10. Oetjen, H. Report for Mission Selection: FORUM; Technical Report ESA-EOPSM-FORM-RP-3549; European Space Agency, ESA: Noordwijk, The Netherlands, 2019. [Google Scholar]
  11. Domínguez, B.C.; Pachot, C.; Oetjen, H.; Mariani, F.; Riel, S.; Tromba, A.; Lajas, D.; Schuettemeyer, D.; Sierk, B.; Leveque, N.; et al. The Far-Infrared Outgoing Radiation Understanding and Monitoring (Forum) Mission. ESA’s 9th Earth Explorer. In Proceedings of the IGARSS 2020—2020 IEEE International Geoscience and Remote Sensing Symposium, Waikoloa, HI, USA, 26 September–2 October 2020; pp. 6035–6038. [Google Scholar] [CrossRef] [Scilit]
  12. Pachot, C.; Dominguez, B.C.; Oetjen, H.; Sierk, B.; Mariani, F.; Riel, S.; Rodrigues, G.; Copano, M.; Carou, A.M.; Palchetti, L.; et al. The infrared Fourier transform spectrometer and the infrared imager instrument concepts for the FORUM mission, ESA’s 9th Earth Explorer. In Proceedings of the Sensors, Systems, and Next-Generation Satellites XXIV; Neeck, S.P., Hélière, A., Kimura, T., Eds.; International Society for Optics and Photonics, SPIE: Bellingham, WA, USA, 2020; Volume 11530, p. 115300D. [Google Scholar] [CrossRef] [Scilit]
  13. Sgheri, L.; Belotti, C.; Ben-Yami, M.; Bianchini, G.; Carnicero Dominguez, B.; Cortesi, U.; Cossich, W.; Del Bianco, S.; Di Natale, G.; Guardabrazo, T.; et al. The FORUM end-to-end simulator project: Architecture and results. Atmos. Meas. Tech. 2022, 15, 573–604. [Google Scholar] [CrossRef] [Scilit]
  14. European Space Agency. Far-Infrared-Outgoing-Radiation Understanding and Monitoring (FORUM)—Mission Requirements Document, Issue 2.0 (09.12.2020); Technical Report ESA-EOPSM-FORM-MRD-3305; ESA-ESTEC: Noordwijk, The Netherlands, 2020. [Google Scholar]
  15. EUMETSAT. IASI-NG Science Plan. 2025. Available online: https://www.eumetsat.int/media/43203 (accessed on 26 February 2026).
  16. Clerbaux, C.; Crevoisier, C. New Directions: Infrared remote sensing of the troposphere from satellite: Less, but better. Atmos. Environ. 2013, 72, 24–26. [Google Scholar] [CrossRef] [Scilit]
  17. Andrey-Andrés, J.; Fourrié, N.; Guidard, V.; Armante, R.; Brunel, P.; Crevoisier, C.; Tournier, B. A simulated observation database to assess the impact of the IASI-NG hyperspectral infrared sounder. Atmos. Meas. Tech. 2018, 11, 803–818. [Google Scholar] [CrossRef] [Scilit]
  18. Crevoisier, C.; Clerbaux, C.; Guidard, V.; Phulpin, T.; Armante, R.; Barret, B.; Camy-Peyret, C.; Chaboureau, J.P.; Coheur, P.F.; Crépeau, L.; et al. Towards IASI-New Generation (IASI-NG): Impact of improved spectral resolution and radiometric noise on the retrieval of thermodynamic, chemistry and climate variables. Atmos. Meas. Tech. 2014, 7, 4367–4385. [Google Scholar] [CrossRef] [Scilit]
  19. Bermudo, F.; Rousseau, S.; Pequignot, E.; Bernard, F. IASI-NG program: A new generation of Infrared Atmospheric Sounding Interferometer. In Proceedings of the 2014 IEEE Geoscience and Remote Sensing Symposium, Quebec City, QC, Canada, 13–18 July 2014; pp. 1373–1376. [Google Scholar] [CrossRef] [Scilit]
  20. Rodgers, C. Inverse Methods for Atmospheric Sounding: Theory and Practice; World Scientific: Singapore, 2000; Volume 2. [Google Scholar]
  21. Menke, W. Geophysical Data Analysis: Discrete Inverse Theory; Academic Press: San Diego, CA, USA, 1984. [Google Scholar]
  22. Twomey, S. Introduction to the Mathematics of Inversion in Remote Sensing and Indirect Measurements; Elsevier: New York, NY, USA, 1977. [Google Scholar]
  23. Doicu, A.; Trautmann, T.; Schreier, F. Numerical Regularization for Atmospheric Inverse Problems; Springer: Berlin/Heidelberg, Germany, 2010. [Google Scholar]
  24. Sivia, D.S.; Skilling, J. Data Analysis: A Bayesian Tutorial, 2nd ed.; Oxford University Press: Oxford, UK, 2006. [Google Scholar]
  25. EUMETSAT. Metop-SG IASI-NG L1c and L1d Data Guide. v1.4, 17.12.2025. Available online: https://user.eumetsat.int/resources/user-guides/metop-sg-iasi-ng-l1c-and-l1d-data-guide (accessed on 13 February 2026).
  26. European Space Agency. Earth Observation CFI Software. Last Updated 06.02.2026. Available online: https://eop-cfi.esa.int/index.php/mission-cfi-software/eocfi-software (accessed on 13 February 2026).
  27. European Space Agency. Earth Observation Mission Software File Format Specification, Issue 1.9 (13.12.2024); Technical Report PE-ID-ESA-GS-584; ESA-ESTEC: Noordwijk, The Netherlands, 2024. [Google Scholar]
  28. DEIMOS Space-European Space Agency. Earth Observation Mission CFI Software: EO_LIB SOFTWARE USER MANUAL, Issue: 4.30 (04.02.2026); Technical Report EO-MA-DMS-GS-0003; DEIMOS Space: Madrid, Spain, 2026. [Google Scholar]
  29. DEIMOS Space-European Space Agency. Earth Observation Mission CFI Software: EO_ORBIT SOFTWARE USER MANUAL, Issue: 4.30 (04.02.2026); Technical Report EO-MA-DMS-GS-0004; DEIMOS Space: Madrid, Spain, 2026. [Google Scholar]
  30. DEIMOS Space-European Space Agency. Earth Observation Mission CFI Software: CONVENTIONS DOCUMENT, Issue 4.30 (04.02.2026); Technical Report EO-MA-DMS-GS-0001; DEIMOS Space: Madrid, Spain, 2026. [Google Scholar]
  31. Skamarock, W.C.; Klemp, J.B.; Dudhia, J.; Gill, D.O.; Barker, D.M.; Duda, M.G.; Huang, X.Y.; Wang, W.; Powers, J.G. A Description of the Advanced Research WRF Version 4; Technical Report NCAR/TN-556+STR; National Center for Atmospheric Research: Boulder, CO, USA, 2019.
  32. Thompson, G.; Eidhammer, T. A Study of Aerosol Impacts on Clouds and Precipitation Development in a Large Winter Cyclone. J. Atmos. Sci. 2014, 71, 3636–3658. [Google Scholar] [CrossRef] [Scilit]
  33. Hong, S.Y.; Noh, Y.; Dudhia, J. A New Vertical Diffusion Package with an Explicit Treatment of Entrainment Processes. Mon. Weather Rev. 2006, 134, 2318–2341. [Google Scholar] [CrossRef] [Scilit]
  34. Chen, F.; Mitchell, K.; Schaake, J.; Xue, Y.; Pan, H.L.; Koren, V.; Duan, Q.; Ek, M.; Betts, A. Modeling of Land Surface Evaporation by Four Schemes and Comparison with FIFE Observations. J. Geophys. Res. Atmos. 1996, 101, 7251–7268. [Google Scholar] [CrossRef] [Scilit]
  35. Mlawer, E.J.; Taubman, S.J.; Brown, P.D.; Iacono, M.J.; Clough, S.A. Radiative Transfer for Inhomogeneous Atmospheres: RRTM, a Validated Correlated-k Model for the Longwave. J. Geophys. Res. Atmos. 1997, 102, 16663–16682. [Google Scholar] [CrossRef] [Scilit]
  36. Masiello, G.; Serio, C.; Maestri, T.; Martinazzo, M.; Masin, F.; Liuzzi, G.; Venafra, S. The new σ-IASI code for all sky radiative transfer calculations in the spectral range 10 to 2760 cm−1: σ-IASI/F2N. J. Quant. Spectrosc. Radiat. Transf. 2024, 312, 108814. [Google Scholar] [CrossRef] [Scilit]
  37. Chou, M.D.; Lee, K.T.; Tsay, S.C.; Fu, Q. Parameterization for cloud longwave scattering for use in atmospheric models. J. Clim. 1999, 12, 159–169. [Google Scholar] [CrossRef] [Scilit]
  38. Martinazzo, M.; Magurno, D.; Cossich, W.; Serio, C.; Masiello, G.; Maestri, T. Assessment of the accuracy of scaling methods for radiance simulations at far and mid infrared wavelengths. J. Quant. Spectrosc. Radiat. Transf. 2021, 271, 107739. [Google Scholar] [CrossRef] [Scilit]
  39. Errera, Q. Extended Reference Scenarios (ERS) File (Including Only the Temperature and Trace Species Climatology) [Data Set]. Zenodo. Technical Report, ESA, 2023. Available online: https://zenodo.org/records/10022129 (accessed on 17 March 2026).
  40. Della Fera, S.; Fabiano, F.; Raspollini, P.; Ridolfi, M.; Cortesi, U.; Barbara, F.; von Hardenberg, J. On the use of Infrared Atmospheric Sounding Interferometer (IASI) spectrally resolved radiances to test the EC-Earth climate model (v3.3.3) in clear-sky conditions. Geosci. Model Dev. 2023, 16, 1379–1394. [Google Scholar] [CrossRef] [Scilit]
Figure 3. Satellite ground tracks and footprints: FORUM Sounding Instrument (FSI) footprints (red), and IASI-NG footprints (blue) [2].
Atmosphere 17 00329 g003
Figure 4. Flow chart of the procedure used to simulate the FORUM and IASI-NG retrieved products.
Atmosphere 17 00329 g004
Figure 5. Temperature profiles as a function of pressure: the true profile ( T true ; red), the a priori profile ( T a ; green), and the retrieved (FORUM) profile ( T retr ; blue) are shown. Surface temperatures T s true T s a and T s retr are also shown.
Atmosphere 17 00329 g005
Figure 6. On the left: temperature (FORUM) retrieval errors as a function of pressure. The total retrieval error ( e r r t o t ) is compared to the a priori error ( e r r a ). On the right: profile of the diagonal elements of the AK matrix (the number of DOFs is also shown).
Atmosphere 17 00329 g006
Figure 7. Water vapor profiles as a function of pressure: the true profile ( T true ; red), the a priori profile ( T a ; green), and the retrieved (FORUM) profile ( T retr ; blue) are shown.
Atmosphere 17 00329 g007
Figure 8. On the left: water vapor (FORUM) retrieval errors as a function of pressure. The total retrieval error ( e r r t o t ) is compared to the a priori error ( e r r a ). On the right: profile diagonal elements of the AK matrix (the number of DOFs is also shown).
Atmosphere 17 00329 g008
Figure 9. FORUM Surface Emissivity as a function of frequency.
Atmosphere 17 00329 g009
Figure 10. Temperature profiles as a function of pressure: the true profile ( T true ; red), the a priori profile ( T a ; green), and the retrieved (IASI-NG) profile ( T retr ; blue) are shown. Surface temperatures T s true T s a and T s retr are also shown.
Atmosphere 17 00329 g010
Figure 11. On the left: temperature retrieval (IASI-NG) errors as a function of pressure. The total retrieval error ( e r r t o t ) is compared to the a priori error ( e r r a ). On the right: profile diagonal elements of the AK matrix (the number of DOFs is also shown).
Atmosphere 17 00329 g011
Figure 12. Water vapor profiles as a function of pressure: the true profile ( T true ; red), the a priori profile ( T a ; green), and the retrieved (IASI-NG) profile ( T retr ; blue) are shown.
Atmosphere 17 00329 g012
Figure 13. On the left: water vapor (IASI-NG) retrieval errors as a function of pressure. The total retrieval error ( e r r t o t ) is compared to the a priori error ( e r r a ). On the right: profile diagonal elements of the AK matrix (the number of DOFs is also shown).
Atmosphere 17 00329 g013
Figure 14. IASI-NG Surface Emissivity as a function of frequency.
Atmosphere 17 00329 g014
Figure 15. Comparison between FORUM and IASI-NG water vapour retrieval. Left: Total Error. Right: Diagonal elements of the AKM.
Atmosphere 17 00329 g015
Figure 16. Comparison between FORUM and IASI-NG temperature retrieval. Left: Total Error. Right: Diagonal elements of the AKM.
Atmosphere 17 00329 g016
Table 1. Main characteristics of the FORUM and IASI-NG missions.
ParameterFORUMIASI-NG
PlatformDedicated SSO satelliteMetOp-SG-1A
Orbit typeSun-synchronousSun-synchronous
Inclination98.7°98.7°
Local solar time09:30 (descending)09:30 (descending)
Altitude 830 km 830 km
Repeat cycle29 d29 d
Spectral range100– 1600 cm 1 645– 2760 cm 1
Spectral resolution (FWHM) 0.5 cm 1 (unapodized) 0.25 cm 1 (Gaussian)
Sampling step 0.36 cm 1 0.125 cm 1
NESR40– 100 nW ( cm 2 sr cm 1 ) 1 0.5 × current IASI
ARA requirement≪NESR< 0.25 K ( 2 σ at 280 K)
Spatial sampling 15 km (circular pixel) 4 × 4 pixels of 12 km
ScanningStep-and-stare (no across-track scan)Across-track scanning (7 FORs per side)
Along-track spacing 100 km Set by scanning pattern
Field of regard (FOR)Single pixel 4 × 4 pixels (16 total)
Table 2. FORUM orbital mission requirements MR-GEN-030 and MR-GEN-035, for coregistration with IASI-NG (MetOpSG-A orbit) [14].
Along-Track Temporal Coregistration with MetOpSG
MR-GEN-030The temporal co-registration between the FORUM observations and the IASI-NG (Nadir view) observations shall be less than 1 min.
Across-Track coregistration with MetOpSG
MR-GEN-035The FORUM sub-satellite point shall always remain within ±300 km (TBC) (T), ±100 km (G) across track from the MetOpSG ground track.
Table 3. FSI geometric requirements (observation geometry) MR-OBS-010 and MR-OBS-020 [14].
FSI Footprint
MR-OBS-010The FSI footprint shall have a diameter of 15 km.
FSI spatial sampling distance
MR-OBS-020The FSI spatial sampling distance shall be smaller than 100 km.
Table 4. Instrument parameters at 817 km satellite height for IASI-NG and FORUM.
ParameterIASI-NGFORUM
FOV shapeCircularCircular
FOV size at nadir12 km15 km
FOV aperture14.69 mrad18.36 mrad
Number of FOR per scan14
Scan period15.58 s
Number of pixels per FOR16 (4 × 4)1
FOR acquisition time820 ms
Swath46.5° (93° total)
FOV separation within FOR (nadir)23.83 km
FOV separation along track100 km
FOV period15.15 s
Table 5. Nominal and simulated geometrical parameters at 817 km.
ParameterNominal ValueSimulated Value
IASI-NG FOV size at nadir12 km12.1791 km (ALT), 12.0936 km (ACT)
IASI-NG FOV separation within FOR (Nadir)23.83 km 23.9945 km
IASI-NG FOR separation along track4.91 km
IASI-NG FOV separation across FOR (Nadir)32 km30.7557 km
FORUM FOV size at nadir15 km15.1862 km (ALT), 15.0946 km (ACT)
Table 7. Number of DOFs comparison.
H2OTemperature
N. of DOFsIASI-NGFORUMIASI-NGFORUM
Troposphere9.15.613.69.3
Stratosphere0.70.29.36.2
Total9.85.822.915.5
Disclaimer/Publisher’s Note: The statements, opinions and data contained in all publications are solely those of the individual author(s) and contributor(s) and not of MDPI and/or the editor(s). MDPI and/or the editor(s) disclaim responsibility for any injury to people or property resulting from any ideas, methods, instructions or products referred to in the content.