1. Introduction
Detecting thunderstorm gamma-ray emissions from the ground is a relatively novel frontier in atmospheric science and has opened up new avenues for research. In particular, ground-based observations of high-energy atmospheric phenomena have advanced significantly over the last fifteen years, providing a high-resolution perspective that complements satellite-borne data. Ref. [
1] reported ground-based observations in Japan, in the framework of the Gamma-Ray Observation of Winter Thunderclouds (GROWTH) project. Their findings provided conclusive evidence that lightning discharges trigger atmospheric photonuclear reactions, which generate neutrons and unstable radioactive isotopes. These reactions result in the creation of a positron-emitting cloud that produces a distinct 511 keV e
−-e
+ annihilation gamma-ray signal lasting for about a minute after the parent lightning strike. Ref. [
2] documented the ground-level detection of an intense neutron flash and a secondary gamma-ray glow following a lightning strike in Japan by the Gamma ray Observations During Overhead Thunderstorms (GODOT) experiment. Their study pointed out that these signatures were the result of photonuclear reactions triggered by a TGF, providing further evidence that atmospheric electricity can drive nuclear processes at low altitudes. Ref. [
3] reported the observations from the Telescope Array surface detector in Utah, which identified several bursts of gamma-rays coincident with the initial stages of downward lightning leaders. The findings suggest that these high-energy showers are produced by the stepping process of the leader breakdown within the first few milliseconds of a cloud-to-ground flash. Ref. [
4] presented the simultaneous ground-based detection of a minute-long gamma-ray glow and its abrupt termination by a downward TGF during a winter thunderstorm in Japan. Their findings provided further insights that the intense electric fields supporting a gamma-ray glow can also provide the environment necessary to trigger a TGF during a lightning discharge. At the Aragats Space Environmental Center, ref. [
5,
6] documented extensive ground-based observations of long-lasting Thunderstorm Ground Enhancements (TGEs), consisting of electrons, gamma-rays, and neutrons, providing some of the first energy spectra for these particle avalanches.
Also, the recent detection of a Terrestrial Gamma-ray Flash (TGF), produced during the massive Hunga Tonga–Hunga Ha’apai eruption [
7], pointed out the possibility that even volcanic lightning might produce gamma-ray emissions at MeV energies. In recent years, Italy has played an important role in investigating high-energy radiation from thunderstorms, especially with the detections from space carried out by the AGILE satellite [
8,
9] and with the observations from ground and aircraft performed in the framework of the Gamma-Flash program, which led to the detection of the first gamma-ray glow ever recorded in Italy [
10].
In this context, the Experiment to Study Thunderstorm High-Energy Radiation (ESTHER) is a small project of the National Institute for Astrophysics aimed at monitoring from the ground gamma-ray emissions produced during thunderstorms and, possibly, by volcanic lightning. The ESTHER setup consists of a portable gamma-ray and VLF/LF detection system installed on Mt. Etna volcano (Italy). Up to now, the selected installation sites have been two: firstly, the Citelli Refuge of the Italian Alpine Club (CAI) located at 1741 m a.s.l., and successively the “Pizzi Deneri” Etnean Observatory of the National Institute of Geophysics and Volcanology (INGV) located at 2818 m altitude, less than 2.7 km from the main craters. Two observational data take campaigns took place during summer 2024, overall covering more than 4 months, from 24 May 2024 to 4 October 2024.
2. The ESTHER Project
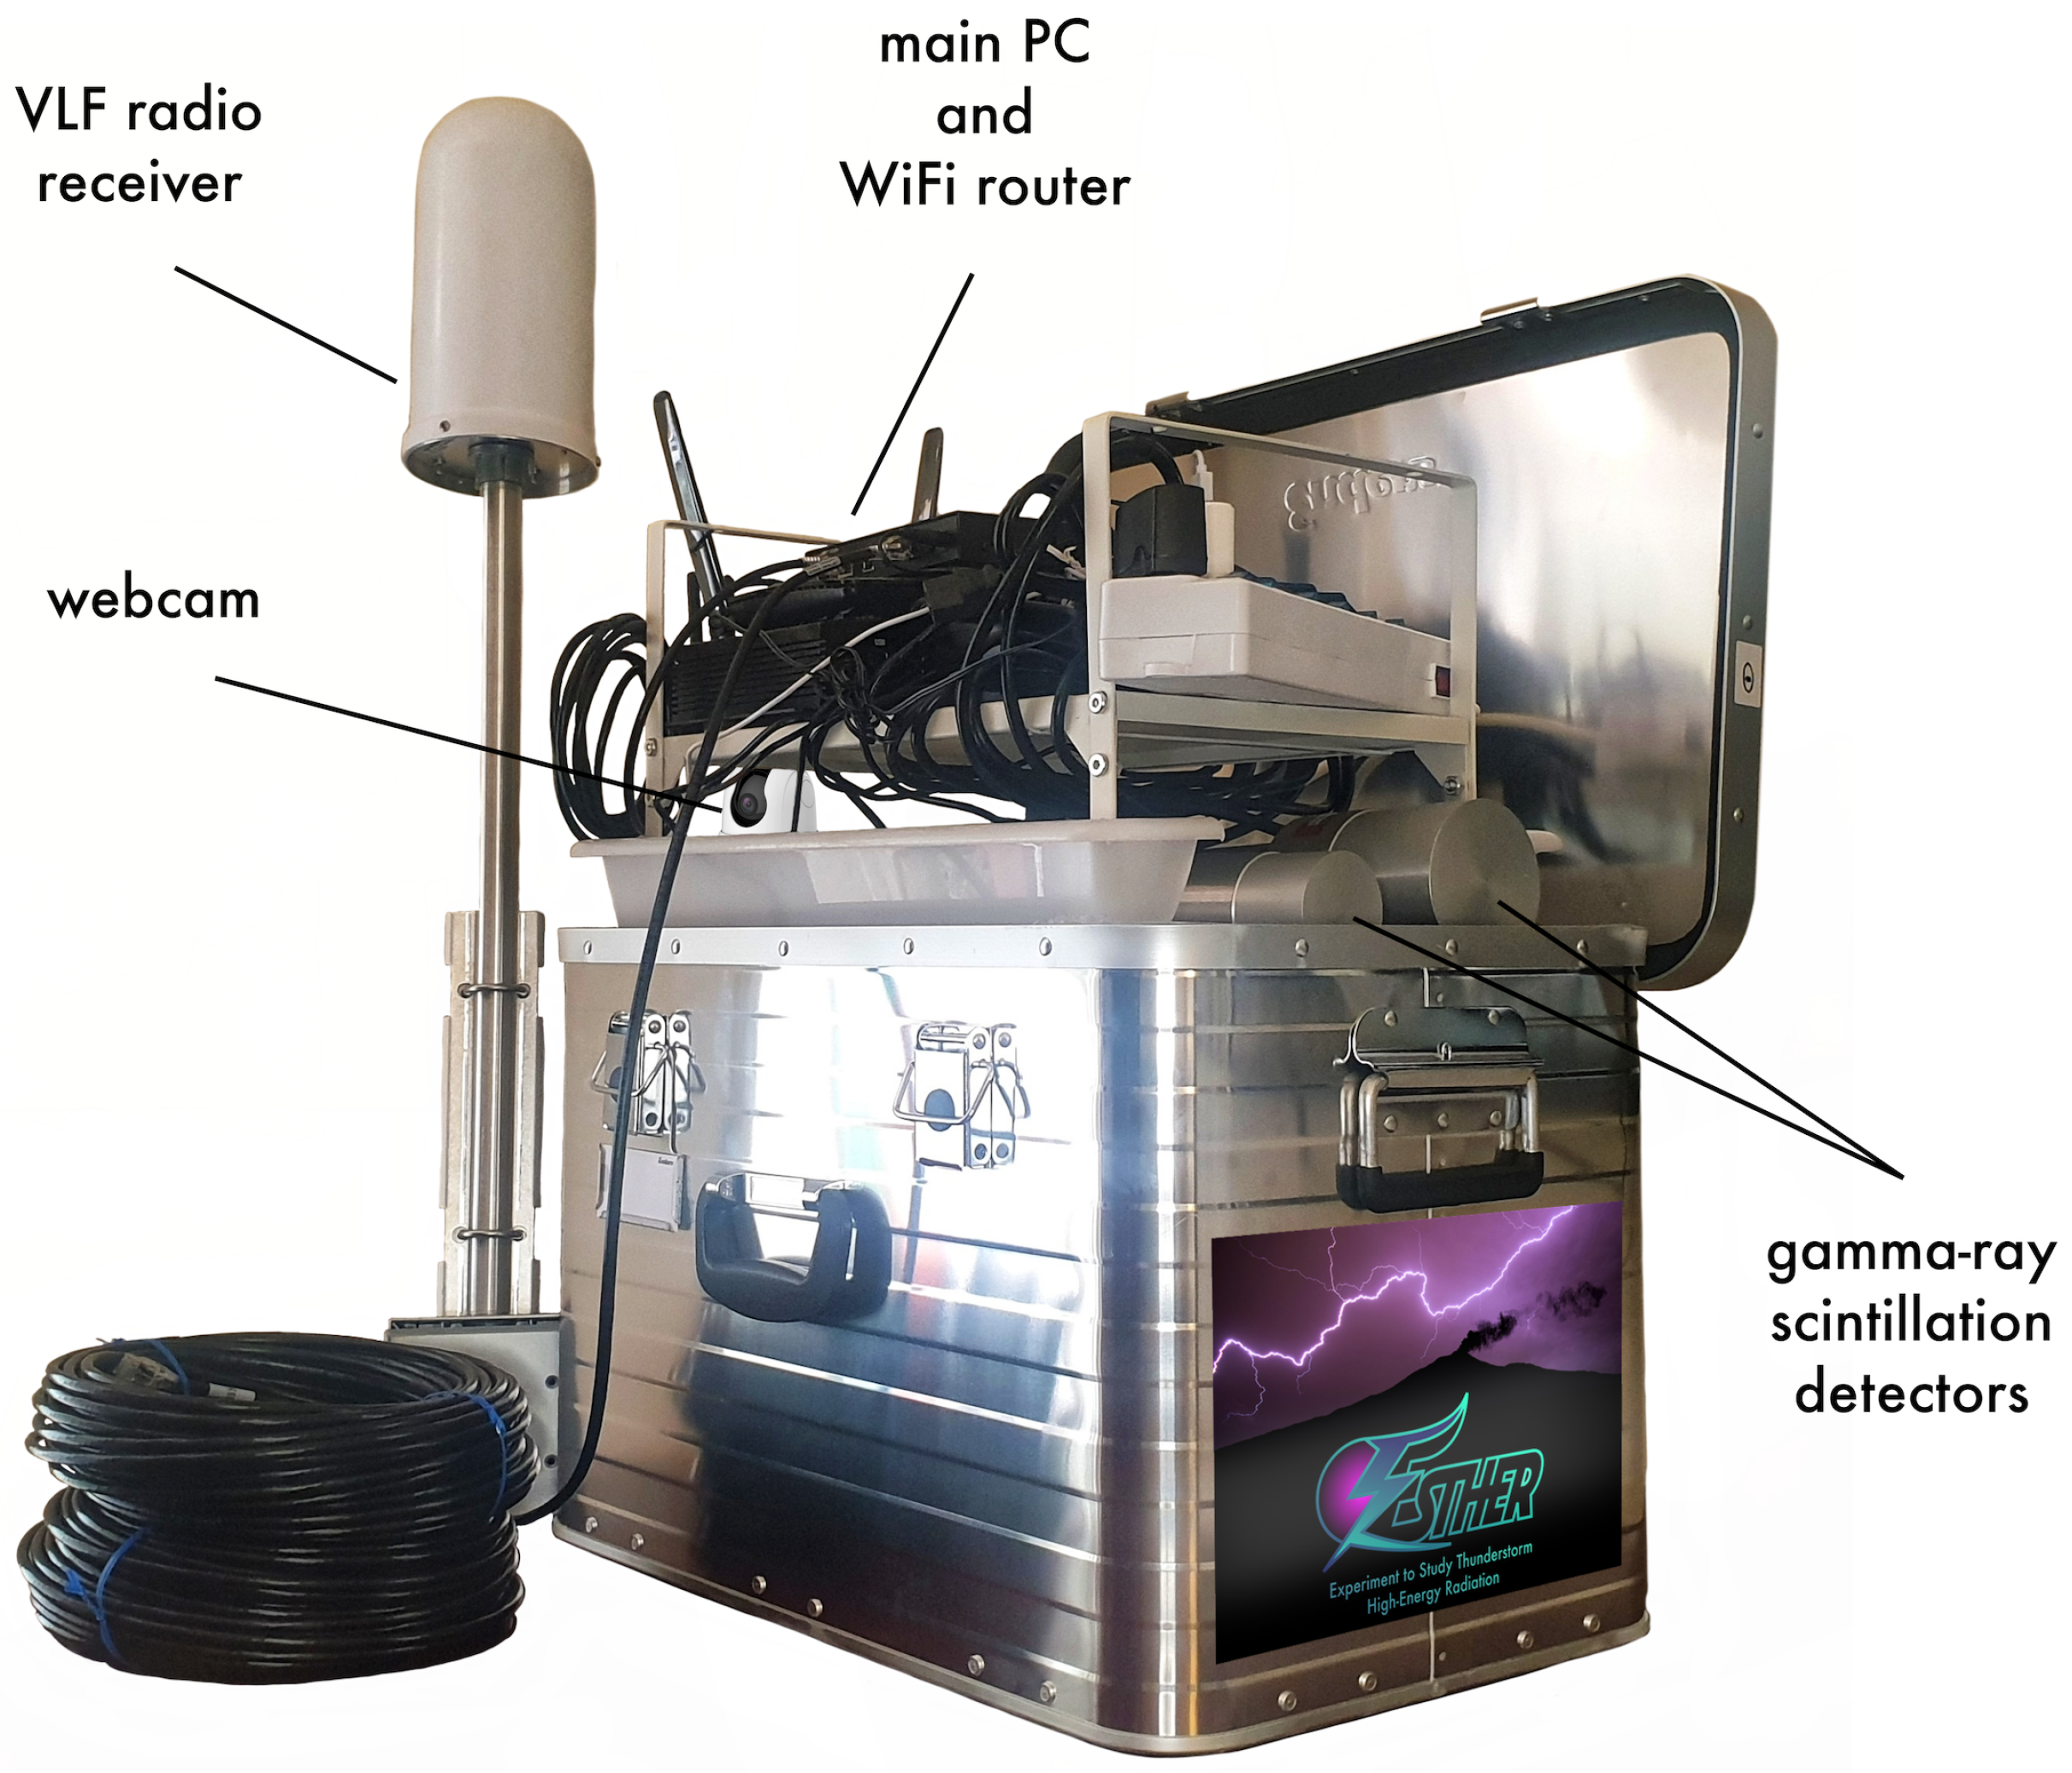
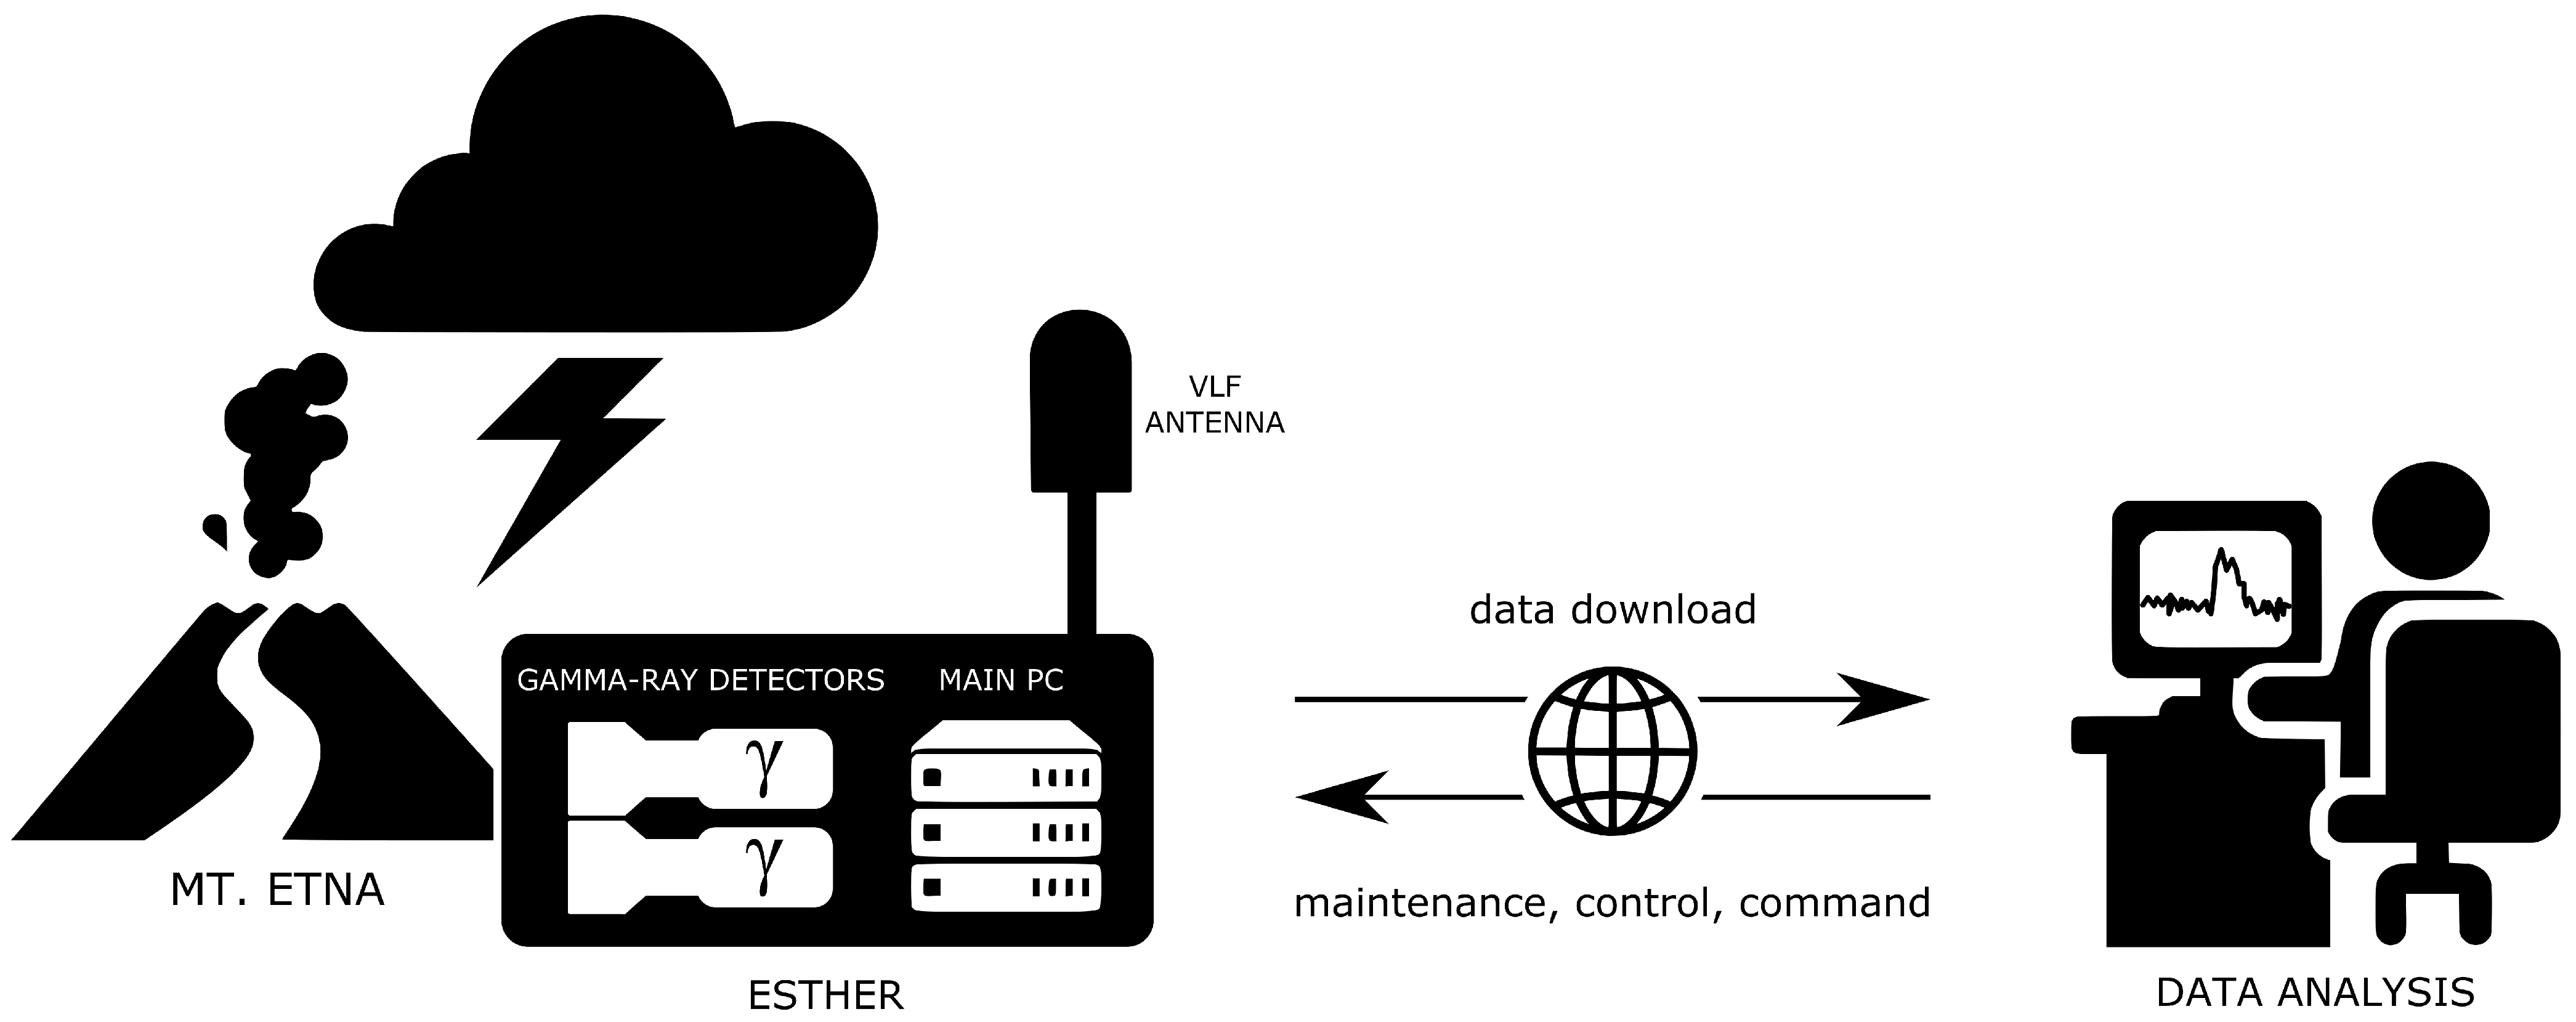
The ESTHER setup consists of a gamma-ray detection system and a VLF/LF radio receiver, both designed as portable instruments to be dismantled and relocated according to needs. An exploded view of the setup is shown in
Figure 1. The gamma-ray detection system is composed of two NaI(Tl) scintillators (2″ø and 3″ø) coupled to two standard PMTs, of CAEN S.p.A. (Viareggio, Italy). The 2″ø (GS20) and 3″ø (GS30) detectors are sensitive in the 200 keV–7 MeV and 300 keV–14 MeV energy ranges, respectively. The crystals have about 6% FWHM energy resolution at 662 keV. Monte Carlo simulations allowed us to build the effective area response matrices in the high-energy regime, pointing out an
cm
2 @ 1 MeV for the GS20 and
cm
2 @ 1 MeV for the GS30. Both detectors acquire high-energy photons with a 1 μs time resolution. The radio receiver is sensitive in the 20–250 kHz range (centered at 50 kHz), consisting of an antenna with 2 H-field channels (N-S and E-W) and 1 E-field channel (omni-directional). The acquired waveforms are digitized to 12 bits at 3.125 Msps, with GPS absolute time accuracy. A standard 24 fps camera acts as a sentinel webcam to monitor the surrounding weather conditions. All detectors are controlled by an internally installed main PC, connected to a 4G LTE router with 150 Mbps.
The main PC serves both as a command device, allowing the remote access and control of the detectors, and as local storage to save the daily acquired photon lists and radio signal streams, as shown in
Figure 2. The whole setup, with the exception of the radio receiver, is housed inside a 2 mm thick aluminum water-tight case, which protects the instruments from the elements and allows convenient transportation in case of the relocation of the experiment to other installation sites. The antenna is placed outside the case, connected through LAN and GPS cables. The ESTHER setup is modular and can be easily extended by installing other gamma-ray detectors or antennas.
The experiment takes advantage of external additional data, provided by ground-based facilities (e.g., local weather stations, lightning networks, national statements of seismic activity) and meteorological satellites (i.e., Meteosat-11, equipped with the Lightning Imager). These data provide a general overview on the surrounding scenario in which the gamma-ray and VLF/LF detection take place, providing a more comprehensive insight of the acquired datastreams.
3. Installation Sites
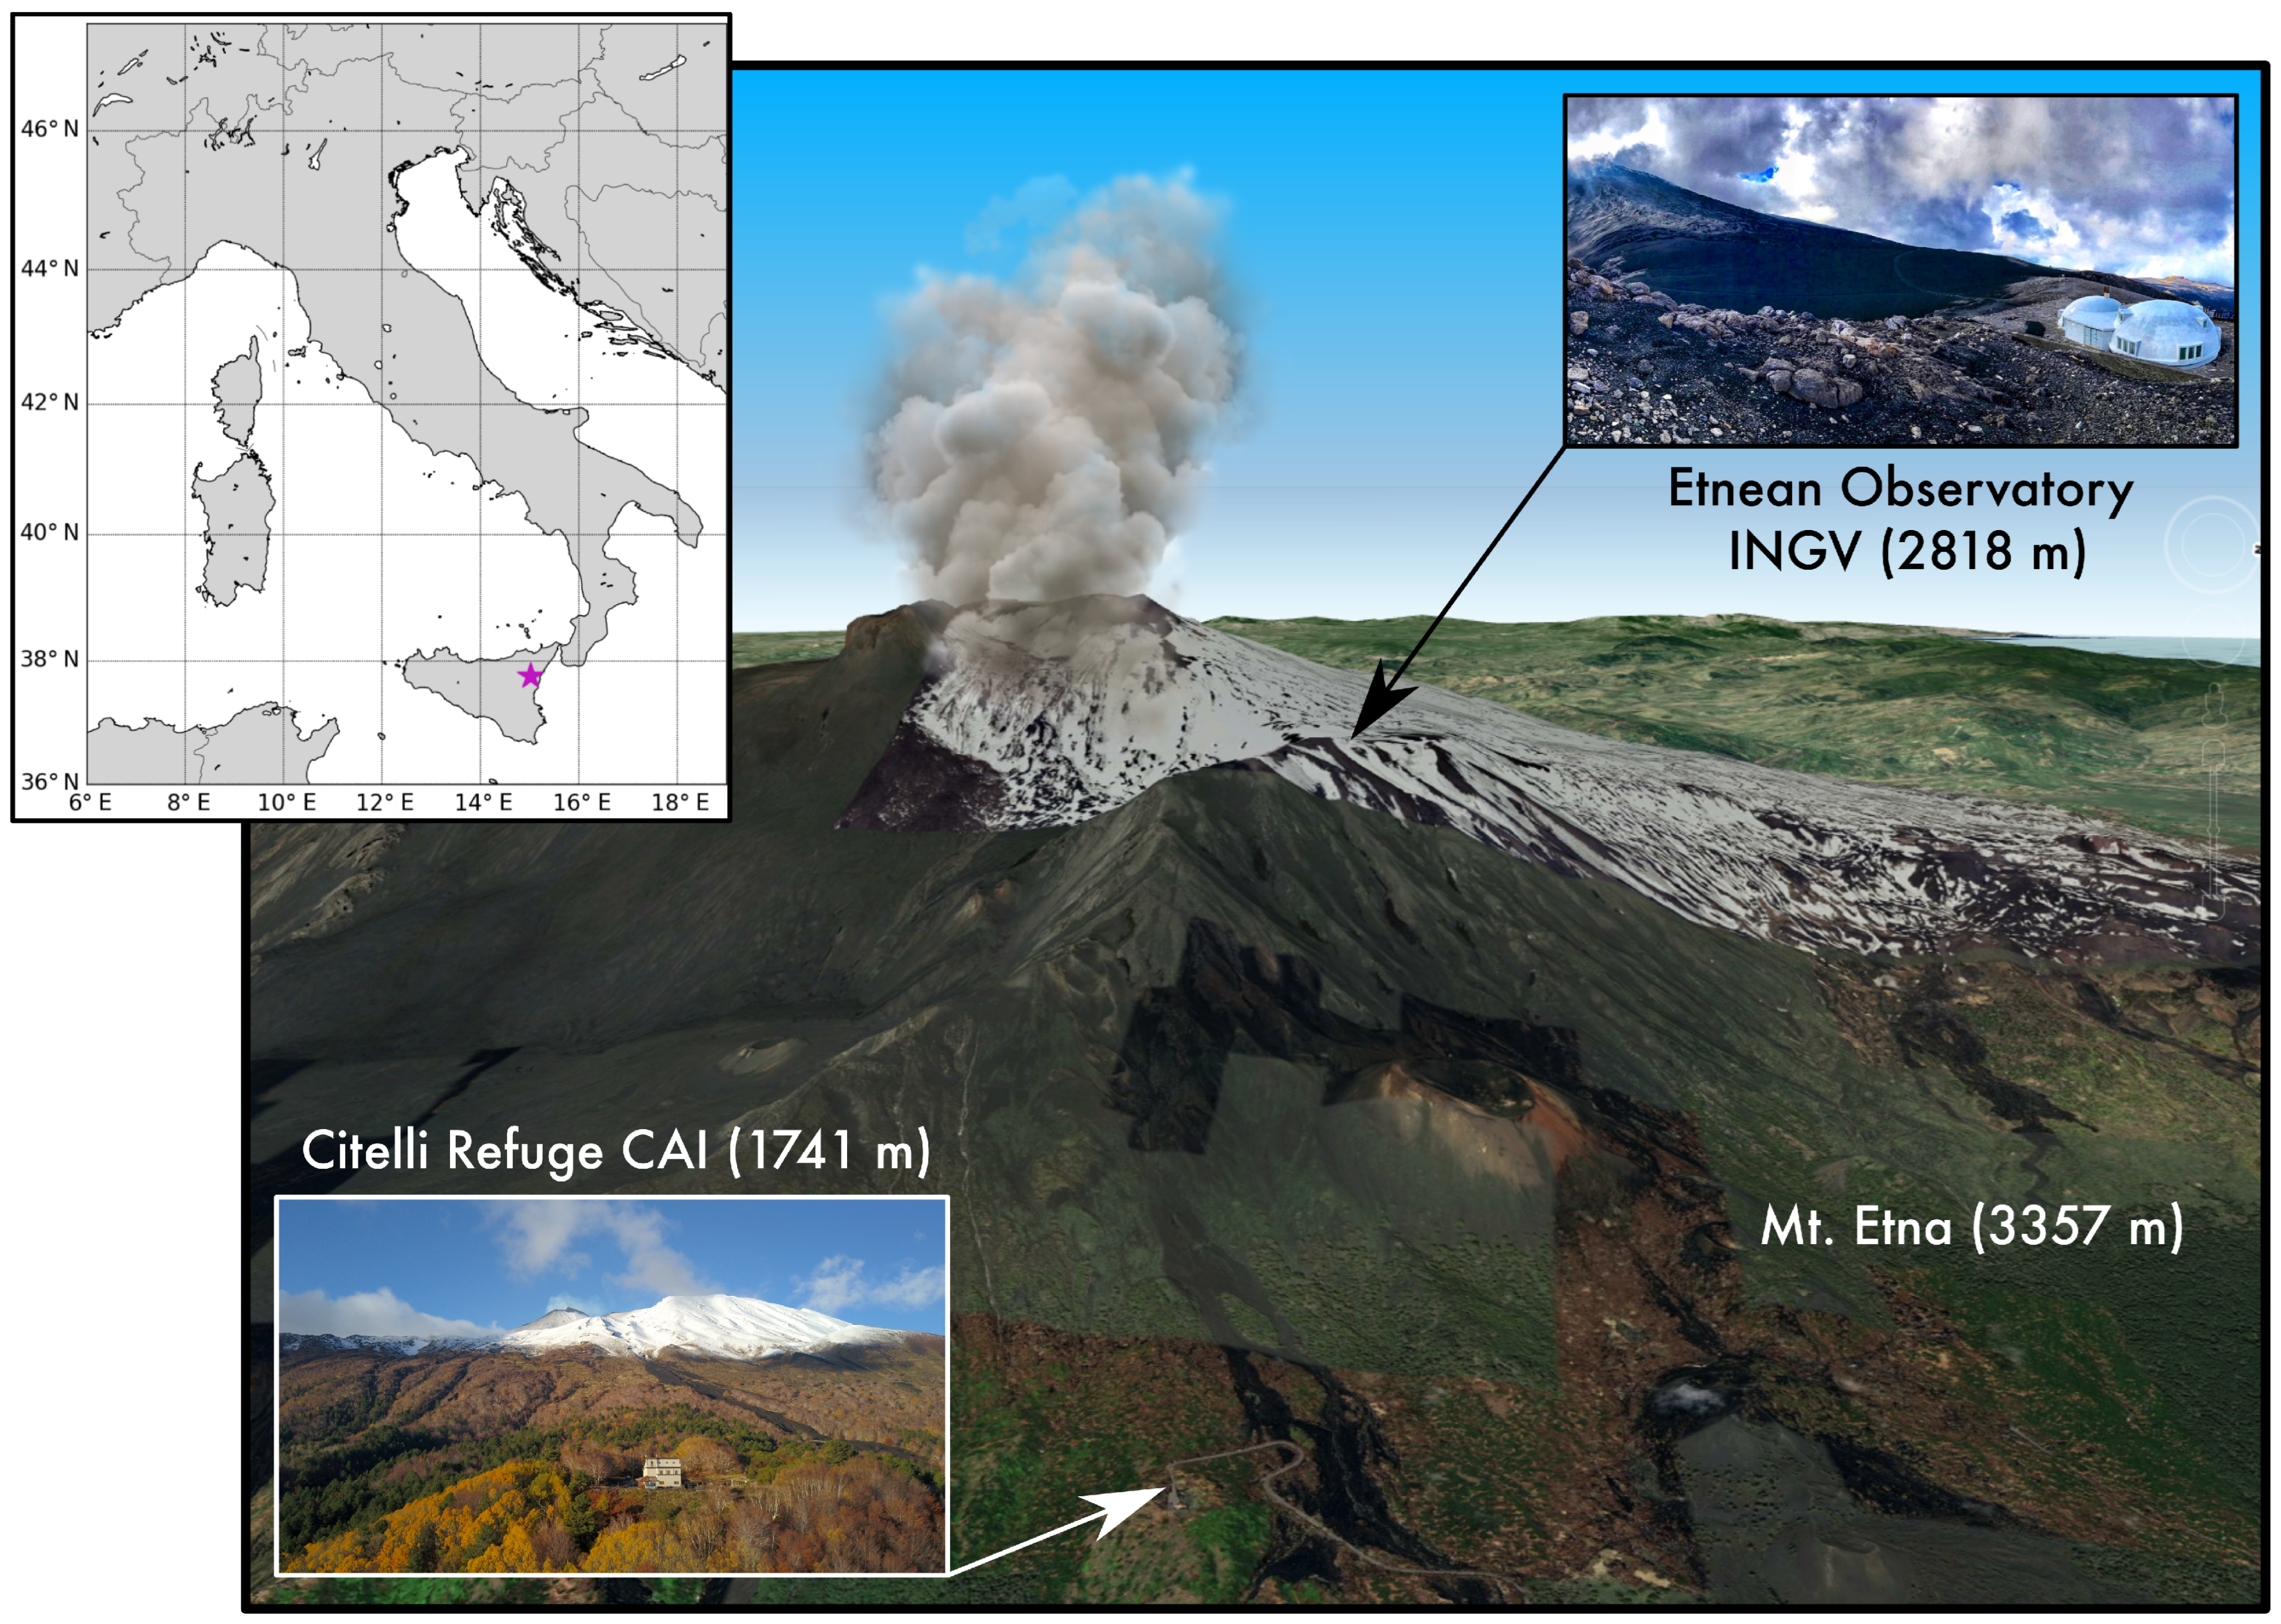
Two installation sites have been selected to place the experimental setup and investigate high-energy thunderstorm radiation. These are shown in
Figure 3 and described in the next sections.
3.1. The Citelli Refuge (CAI)
The first installation site is the Citelli Refuge of the Italian Alpine Club (CAI), located at 1741 m altitude. The setup was mounted on the external terrace of the mountain hut, directly facing Mt. Etna’s top. Being a staffed facility, this location was chosen to carry out a first test phase, as it allowed for the constant crewed monitoring of the proper functioning of all detectors, ensuring the safety of the whole setup. Also, the Citelli Refuge provided continuous and stable power for all the instruments. Although being located at a lower altitude with respect to the Etnean Observatory, therefore experiencing higher gamma-ray attenuation due to the lower-altitude, denser atmospheric layers, the Citelli Refuge offers the great advantage of additional external environmental data, collected by ground stations of the meteo hydro pluviometric monitoring network of the Sicilia Region and provided by the Dipartimento della Protezione Civile Nazionale (DPCN). These data are accessible via a public web portal (
https://meteohub.agenziaitaliameteo.it/, accessed on 31 October 2024) and provide concomitant measurements of temperature, precipitation rate, and relative humidity as recorded at the installation site, that allow us to better characterize the surrounding scenario and monitor the occurrence of rainfalls and temperature variations. According to the historical data collected on site by the meteo station, in the summer months this site typically experiences temperatures ranging from a few °C to ∼30 °C and several days of rain. Also, the refuge is frequently situated at the cloud base level, resulting in a high prevalence of persistent fog, making the use of a hermetically sealed enclosure necessary for the whole experimental setup.
Figure 3.
Geographic location (purple star) of the ESTHER experiment, installed on Mt. Etna, Sicily (Italy). Graphical representation of the two installation sites selected for the ESTHER setup: the Citelli Refuge of the Italian Alpine Club (1741 m a.s.l.) and “Pizzi Deneri” Etnean Observatory of the National Institute of Geophysics and Volcanology (2818 m a.s.l.), less than 2.7 km from the main volcano craters.
Figure 3.
Geographic location (purple star) of the ESTHER experiment, installed on Mt. Etna, Sicily (Italy). Graphical representation of the two installation sites selected for the ESTHER setup: the Citelli Refuge of the Italian Alpine Club (1741 m a.s.l.) and “Pizzi Deneri” Etnean Observatory of the National Institute of Geophysics and Volcanology (2818 m a.s.l.), less than 2.7 km from the main volcano craters.
3.2. The Etnean Observatory (INGV)
The second installation site is the “Pizzi Deneri” Etnean Observatory of the National Institute of Geophysics and Volcanology (INGV), located at 2818 m altitude. Such altitude provides a lower attenuation of gamma-ray emissions, due to the lower-density, higher-altitude atmospheric layers, almost compatible with the height of other ground-based detection systems (e.g., the Aragats Cosmic Ray Research Station at 3200 m [
11]). It also offers a shorter distance to the volcano’s main craters, which are located less than 2.7 km away. On the other hand, given the absence of a continuous power supply, the experimental setup required being integrated with an external battery, which was periodically recharged using the solar panels installed on the observatory terrace. A preliminary extensive analysis of the flash rate recorded at Mt. Etna over 8 years (2012–2020) pointed out that Mt. Etna’s top experiences strong lightning activity, especially in summer: in particular, the largest fraction of discharges seems to cluster right above the main volcano craters, where the frequent presence of volcanic ash locally increases the electrical conductivity, under conditions of humid air typical of thunderstorms, making that region a natural trigger for lightning [
12]. Moreover, as for other volcanoes in the world, Etna has been documented to produce volcanic lightning (last occurrences in 2015, 2022, and 2024). As a consequence, this second installation site provides either a higher probability of detecting gamma-ray emissions produced by thunderstorms, due to the higher lightning discharge occurrence on the mountain top, and a closer proximity to the main volcanic craters, where possible gamma-ray signatures from volcanic lightning could take place. According to the historical data collected on site, during summer months this site typically experiences temperatures ranging from a few °C to ∼20 °C. The location is often subject to high winds laden with volcanic ash, resulting in highly abrasive conditions, which require a perfectly sealed container for the experimental setup. Rainy days are few, but the formation of vertical clouds in the early afternoon is very frequent during July and August, with the possibility of lightning and hail. The presence of low clouds or fog is much more frequent than actual rain. This usually results in 100% relative humidity, which also requires a perfectly water-proof case to house the detectors.
4. Data Calibration
Once downloaded, the acquired data are calibrated by using the main peaks of the environmental gamma-ray background constantly present in the data acquisitions. The emission peaks used for the calibration are those produced by 214Pb (352 keV), 214Bi (609 keV), 40K (1460 keV), 214Bi (1764 keV), and 208Tl (2614 keV).
Energy calibration is performed constantly and continuously for every hour of acquired data. This is performed because the change in environmental conditions over time (especially, temperature and humidity) has a non-negligible effect on the relative position of the peaks in the energy spectrum, not allowing for a unique ever-valid calibration procedure. For each of the two detectors, GS20 and GS30, data packages containing one hour of collected data are routinely created. The one-hour interval is chosen to gather sufficient statistics and to easily distinguish the environmental radioactivity peaks in the background. Once the position of the peaks is identified, a best-fit is performed for each of them using a Gaussian function, to determine their respective centers and Full Width at Half Maximum (FWHM). A second-order polynomial energy calibration is then performed to retrieve the best-fit parameters that allow us to convert counts from channels to energy. This is performed independently for the two detectors, for every hour of acquired data, allowing us to build up a complete calibrated datastream.
Calibration is fundamental for retrieving the actual energy release and to better evaluate the variations of the environmental background with respect to weather conditions (e.g., due to 222Rn daughters washout/rainout processes), as well as to highlight possible spectral signatures involving specific energy ranges (e.g., enhancements in the 511 keV emission line due to positron annihilation, or increases in the high-energy regime above 2.6 MeV).
5. Spectral Ratios
The calibrated data are then analyzed to evaluate the gamma-ray counts released within specific energy intervals, such as within keV (due to 214Pb emission line), within keV (due to positron annihilation), within keV (due to 214Bi emission line), within keV (due to 40K emission line), within keV (due to another 214Bi emission line), within keV (due to 208Tl emission line), and above 2.6 MeV (due to engines involving the production of high-energy photons, as those of the MOS mechanism in gamma-ray glows). The “±” intervals are chosen on the basis of the FWHM of the best-fit Gaussian calculated for each emission line.
Considering that 40K is one of the stablest emission lines in the environmental decay rate, we use it as a reference to evaluate the variations of the other emission lines with respect to it. For instance, with 214Bi and 214Pb being the main daughters of 222Rn, whose concentration is heavily enhanced during rainfall due to rainout/washout processes, the (Bi+Pb)/K ratio (where all contributions due to 214Bi and 214Pb emission lines are summed together) allows us to characterize the environmental gamma-ray background enhancement during precipitations, avoiding other sources of high-energy photons. We will refer to this ratio as the “Radon Washout (RN) ratio”. On the other hand, the (511 keV)/K ratio allows us to highlight the production of 511 keV photons released during positron annihilation processes, possibly occurring during thunderstorms. We will refer to this ratio as the “e+ ratio”. Finally, the (>2.6 MeV)/K ratio allows us to point out enhancements in the high-energy range, typically ascribable to gamma-ray glows produced via the MOS mechanism. We will refer to this ratio as the “High-Energy (HE) ratio”.
6. Observational Campaigns
Up to now, ESTHER collected data during two different observational campaigns that took place during summer 2024:
The first data take (DT1) took place from 24 May 2024 to 23 September 2024, providing a continuous datastream of 114 days acquired at the first installation site (Citelli Refuge, 1741 m a.s.l.). In this time interval, ESTHER experienced a total of 22 days with thunderstorms taking place nearby or right above the experimental setup. It is interesting to notice that during DT1, Mt. Etna was also affected by several paroxysmal explosive eruptions, which produced a noteworthy amount of ash that reached the installation site and the experimental setup;
The second data take (DT2) took place from 27 September 2024 to 3 October 2024 at the second installation site (Etnean Observatory, 2818 m a.s.l.) and it was affected by severe data losses. The absence of constantly present staff at the facility, the absence of a both continuous power supply and stable internet connection, and the presence of prohibitive weather conditions (i.e., strong winds and ashes) has effectively complicated the maintenance of the instrumentation installed at the Etnean Observatory. In fact, about one week after the installation, strong winds at high altitude uprooted the case containing all the instrumentation, interrupting the data acquisition. The instruments were then recovered several weeks later, during a routine survey. The gamma-ray detectors acquired data for only about 6 days. In this time interval, no thunderstorms took place on site and no noteworthy paroxysmal events were reported. Although this initial survey did not produce relevant data, it was useful for understanding instrumentation needs and the limitations of the installation site (e.g., the absence of a continuous power supply, the lack of a stable internet connection, the presence of extreme weather conditions that require the use of more protective containers), providing hints to improve the future setup.
Due to the massive presence of ice, snow, and strong winds at the mountain top during winter months, the experimental setup was dismounted in winter 2024.
7. Results of the Data Takes
When investigating gamma-ray radiation produced during thunderstorms and lightning, it is important to evaluate the spectral signatures of possible high-energy emissions occurring during these phenomena. For this reason, we used the calibrated data, exploiting the RW ratio, the e+ ratio, and the HE ratio to characterize the gamma-ray fluctuations in the background rate.
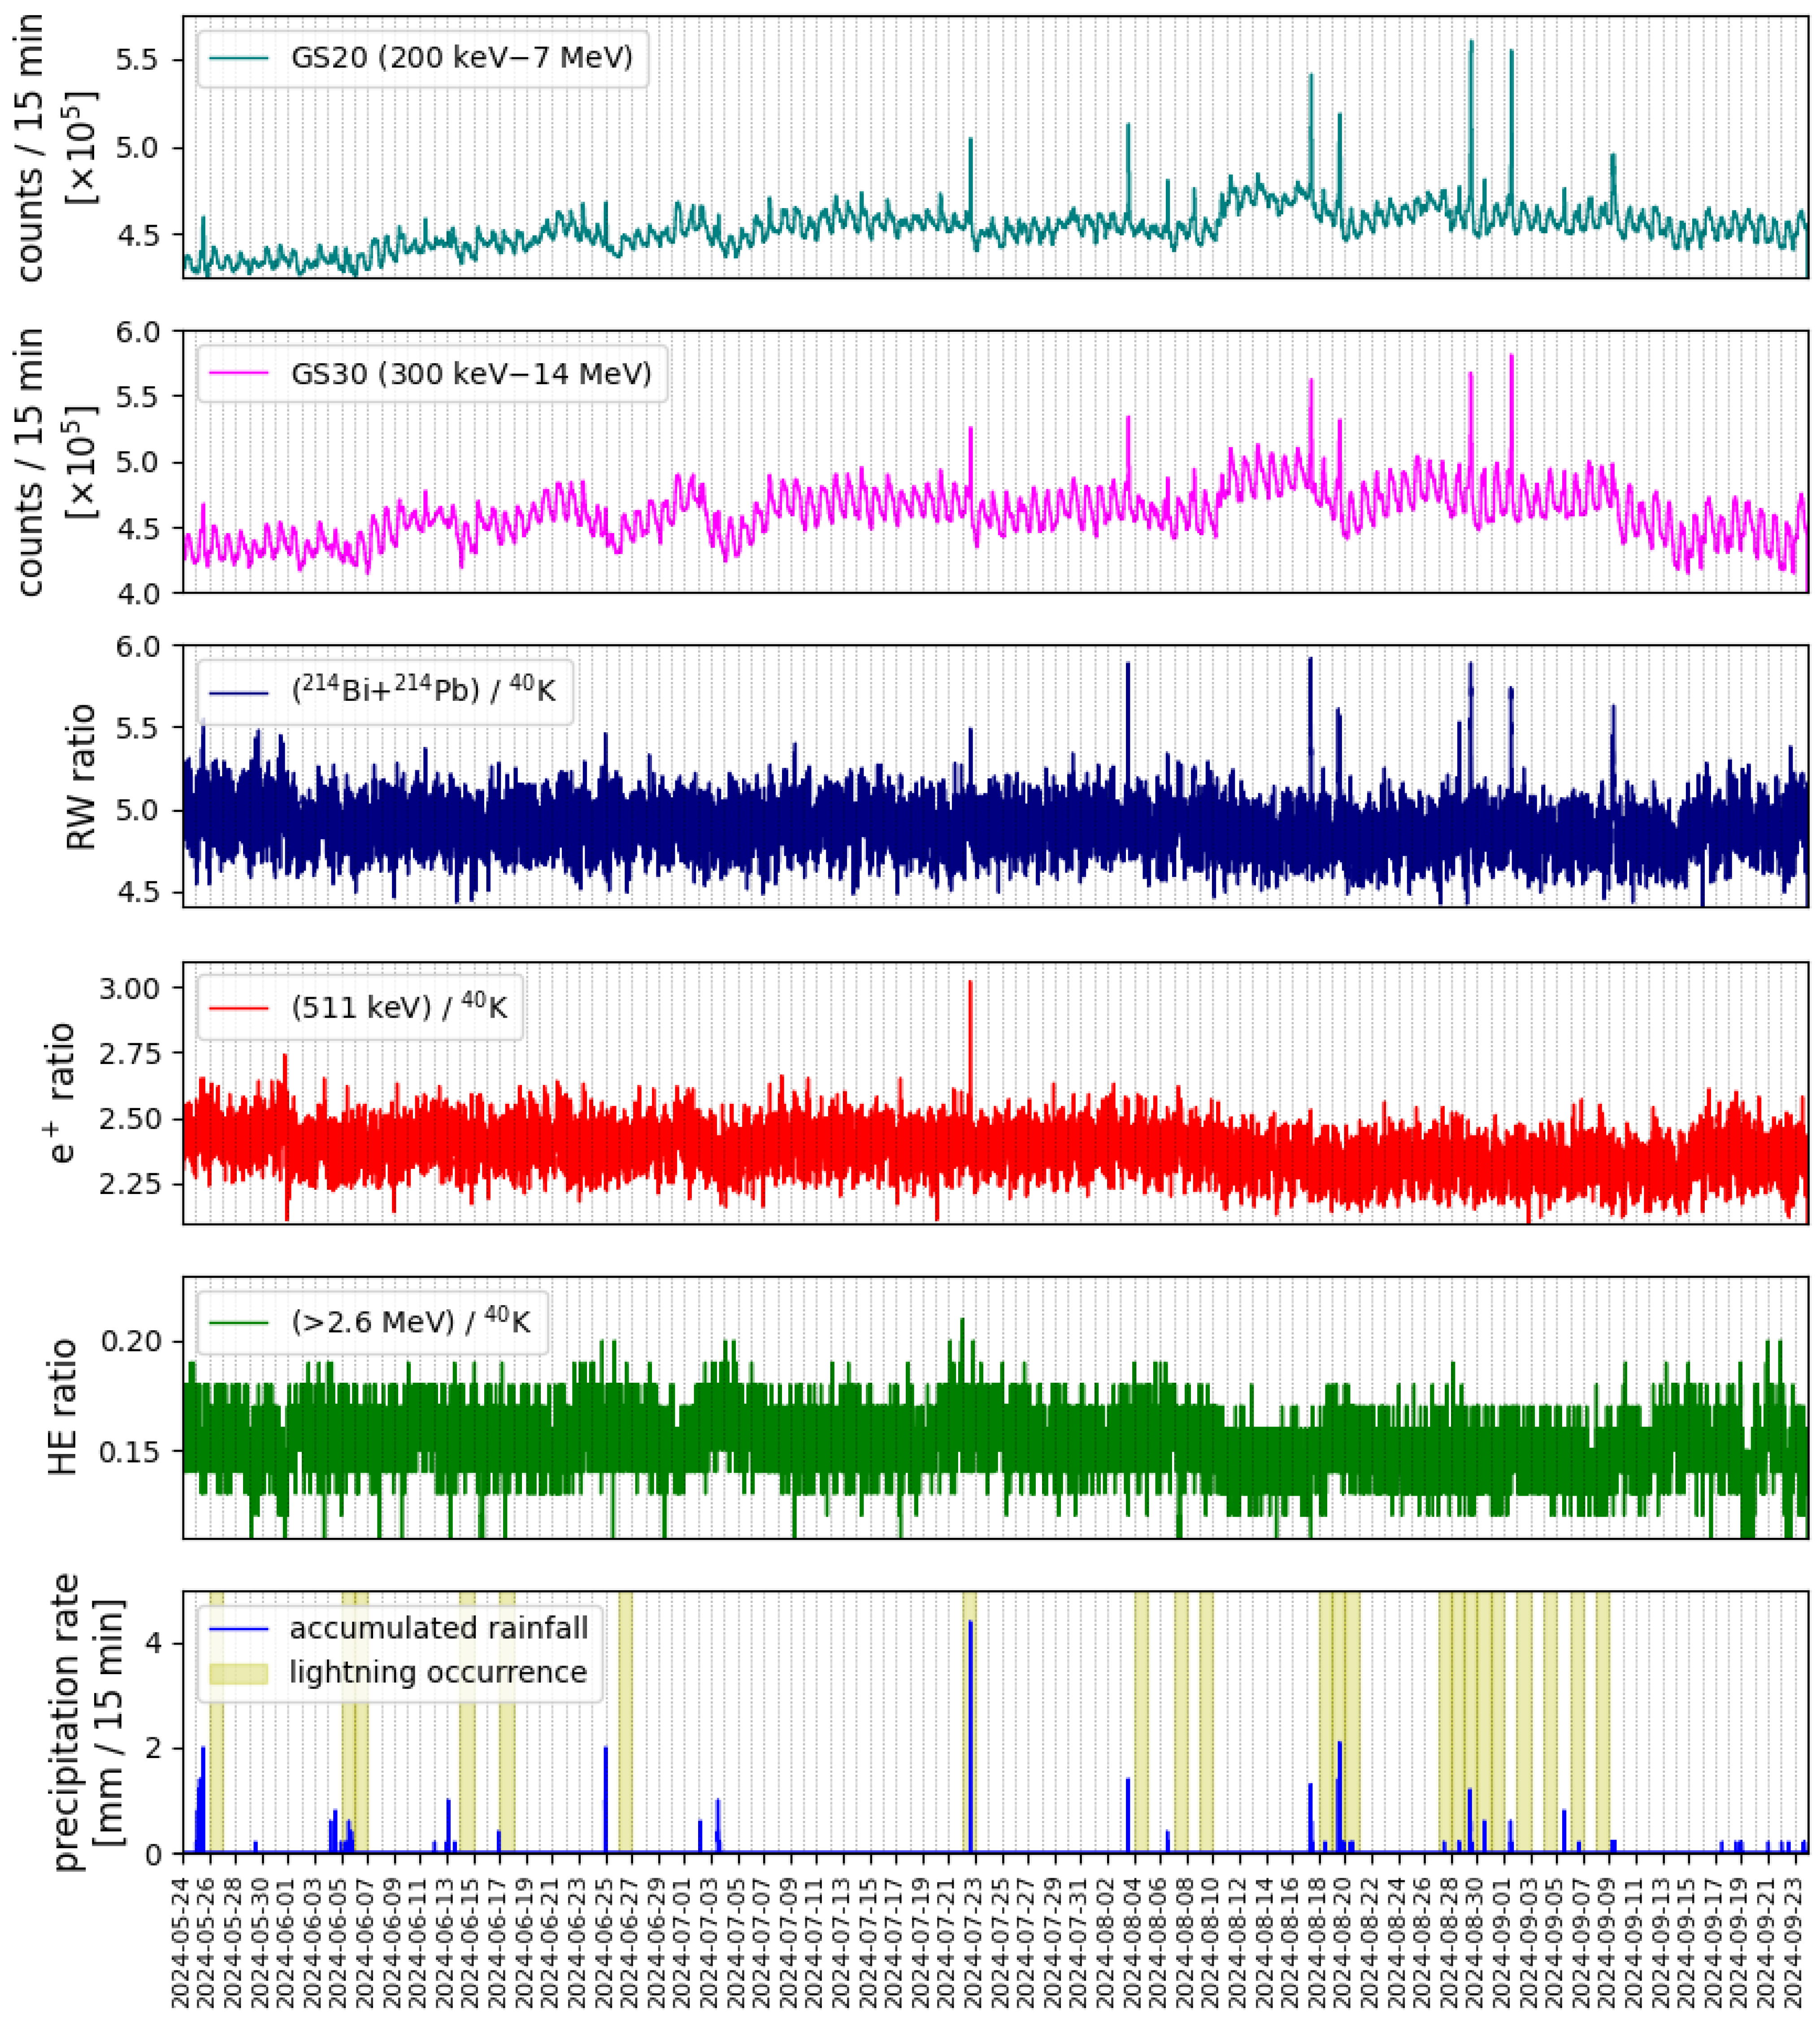
Figure 4 reports an overall view of the ESTHER DT1, taken from 24 May 2024 to 23 September 2024 at the Citelli Refuge. The first two panels show the gamma-ray counts recorded by the GS20 detector (200 keV–7 MeV) and the GS30 detector (300 keV–14 MeV), respectively. The third, fourth, and fifth panels report the calibrated data ratios evaluated for highlighting radon washout processes (Bi+Pb)/K (RW ratio), positron annihilation 511 keV/K (e+ ratio), and other high-energy processes (>2.6 MeV)/K (HE ratio). These data contain both the GS20 and GS30 counts summed together. The sixth panel shows the precipitation rate measured by the meteo station nearby to the installation site, as reported by the local lightning station. Yellow strips mark days affected by lightning activity occurring within 10 km from the installation site, as reported by the LIghtning NETwork (LINET) [
13]. These data provide a qualitative view of the overall scenario that affected the ESTHER site during the DT1 time interval, highlighting the most intense precipitation and thunderstorm events.
The gamma-ray data of both GS20 and GS30 detectors show three main emission features: (1) a general enhancement of the average background rate in July and August, with respect to May and September, due to seasonal variations: in the hottest months, the ground typically experiences a period of dry soil, with radon gas escaping more easily to the air, enhancing the gamma-ray emission; (2) an oscillatory trend on a daily timescale, due to the typical radon cycle, which builds up near the ground during stable nighttime conditions (leading to a peak) and is dispersed by atmospheric mixing during the day (leading to a minimum); (3) sporadic sharp peaks, occurring during precipitation events and produced by temporary radon washout/rainout processes: some of these rainfall events are also accompanied by the presence of lightning, as can be noticed from the last panel of
Figure 4. Concerning the ratios reported in the other panels, the RW ratio allows us to confirm that most of the sporadic emission peaks observed in the gamma-ray light curves and occurring during rainfall episodes are actually ascribed to radon washout/rainout processes. On the other hand, the e+ and HE ratios show a more stable profile throughout the data stream, suggesting that the different gamma-ray enhancements occurring during lightning activity are unlikely to involve the production of positrons and/or high-energy photons. The only exception is represented by the episode taking place on 22 July 2024, which exhibits lightning activity and an intense peak in the e+ ratio light curve and which will be discussed in
Section 8.
A search for lightning-correlated high-energy transient events (i.e., TGFs and gamma-ray glows) has been carried out on the whole datastream. The adopted algorithm searched for significant (i.e., >3 above the background rate) enhancements in the light curves above the average background rate, on timescales of 1–2 ms (for TGFs) and 1–2 min (for gamma-ray glows). The background is calculated on a dynamic window of 10 min. Such an interval was chosen to gather enough statistics to characterize the background rate and easily identify possible transient emissions.
In the collected data, this routine identified no enhancements ascribable to TGFs in the analyzed dataset, whereas it found two events on minute timescales, which occurred on 22 July 2024, during the same episode mentioned before that will be addressed later in the text, accompanied by a non-negligible 511 keV emission.
Correlation Between Precipitation and Gamma-Ray Activity
We selected the 15 most intense rainfall events that occurred during the DT1, between 24 May 2024 and 23 September 2024, and for each of them, we retrieved the associated accumulated total amount of precipitation recorded by the nearby installed meteo station. For each event, we also evaluated the value of the RW, e+, and HE ratios, calculated over the background-subtracted counts acquired by both the gamma-ray detectors.
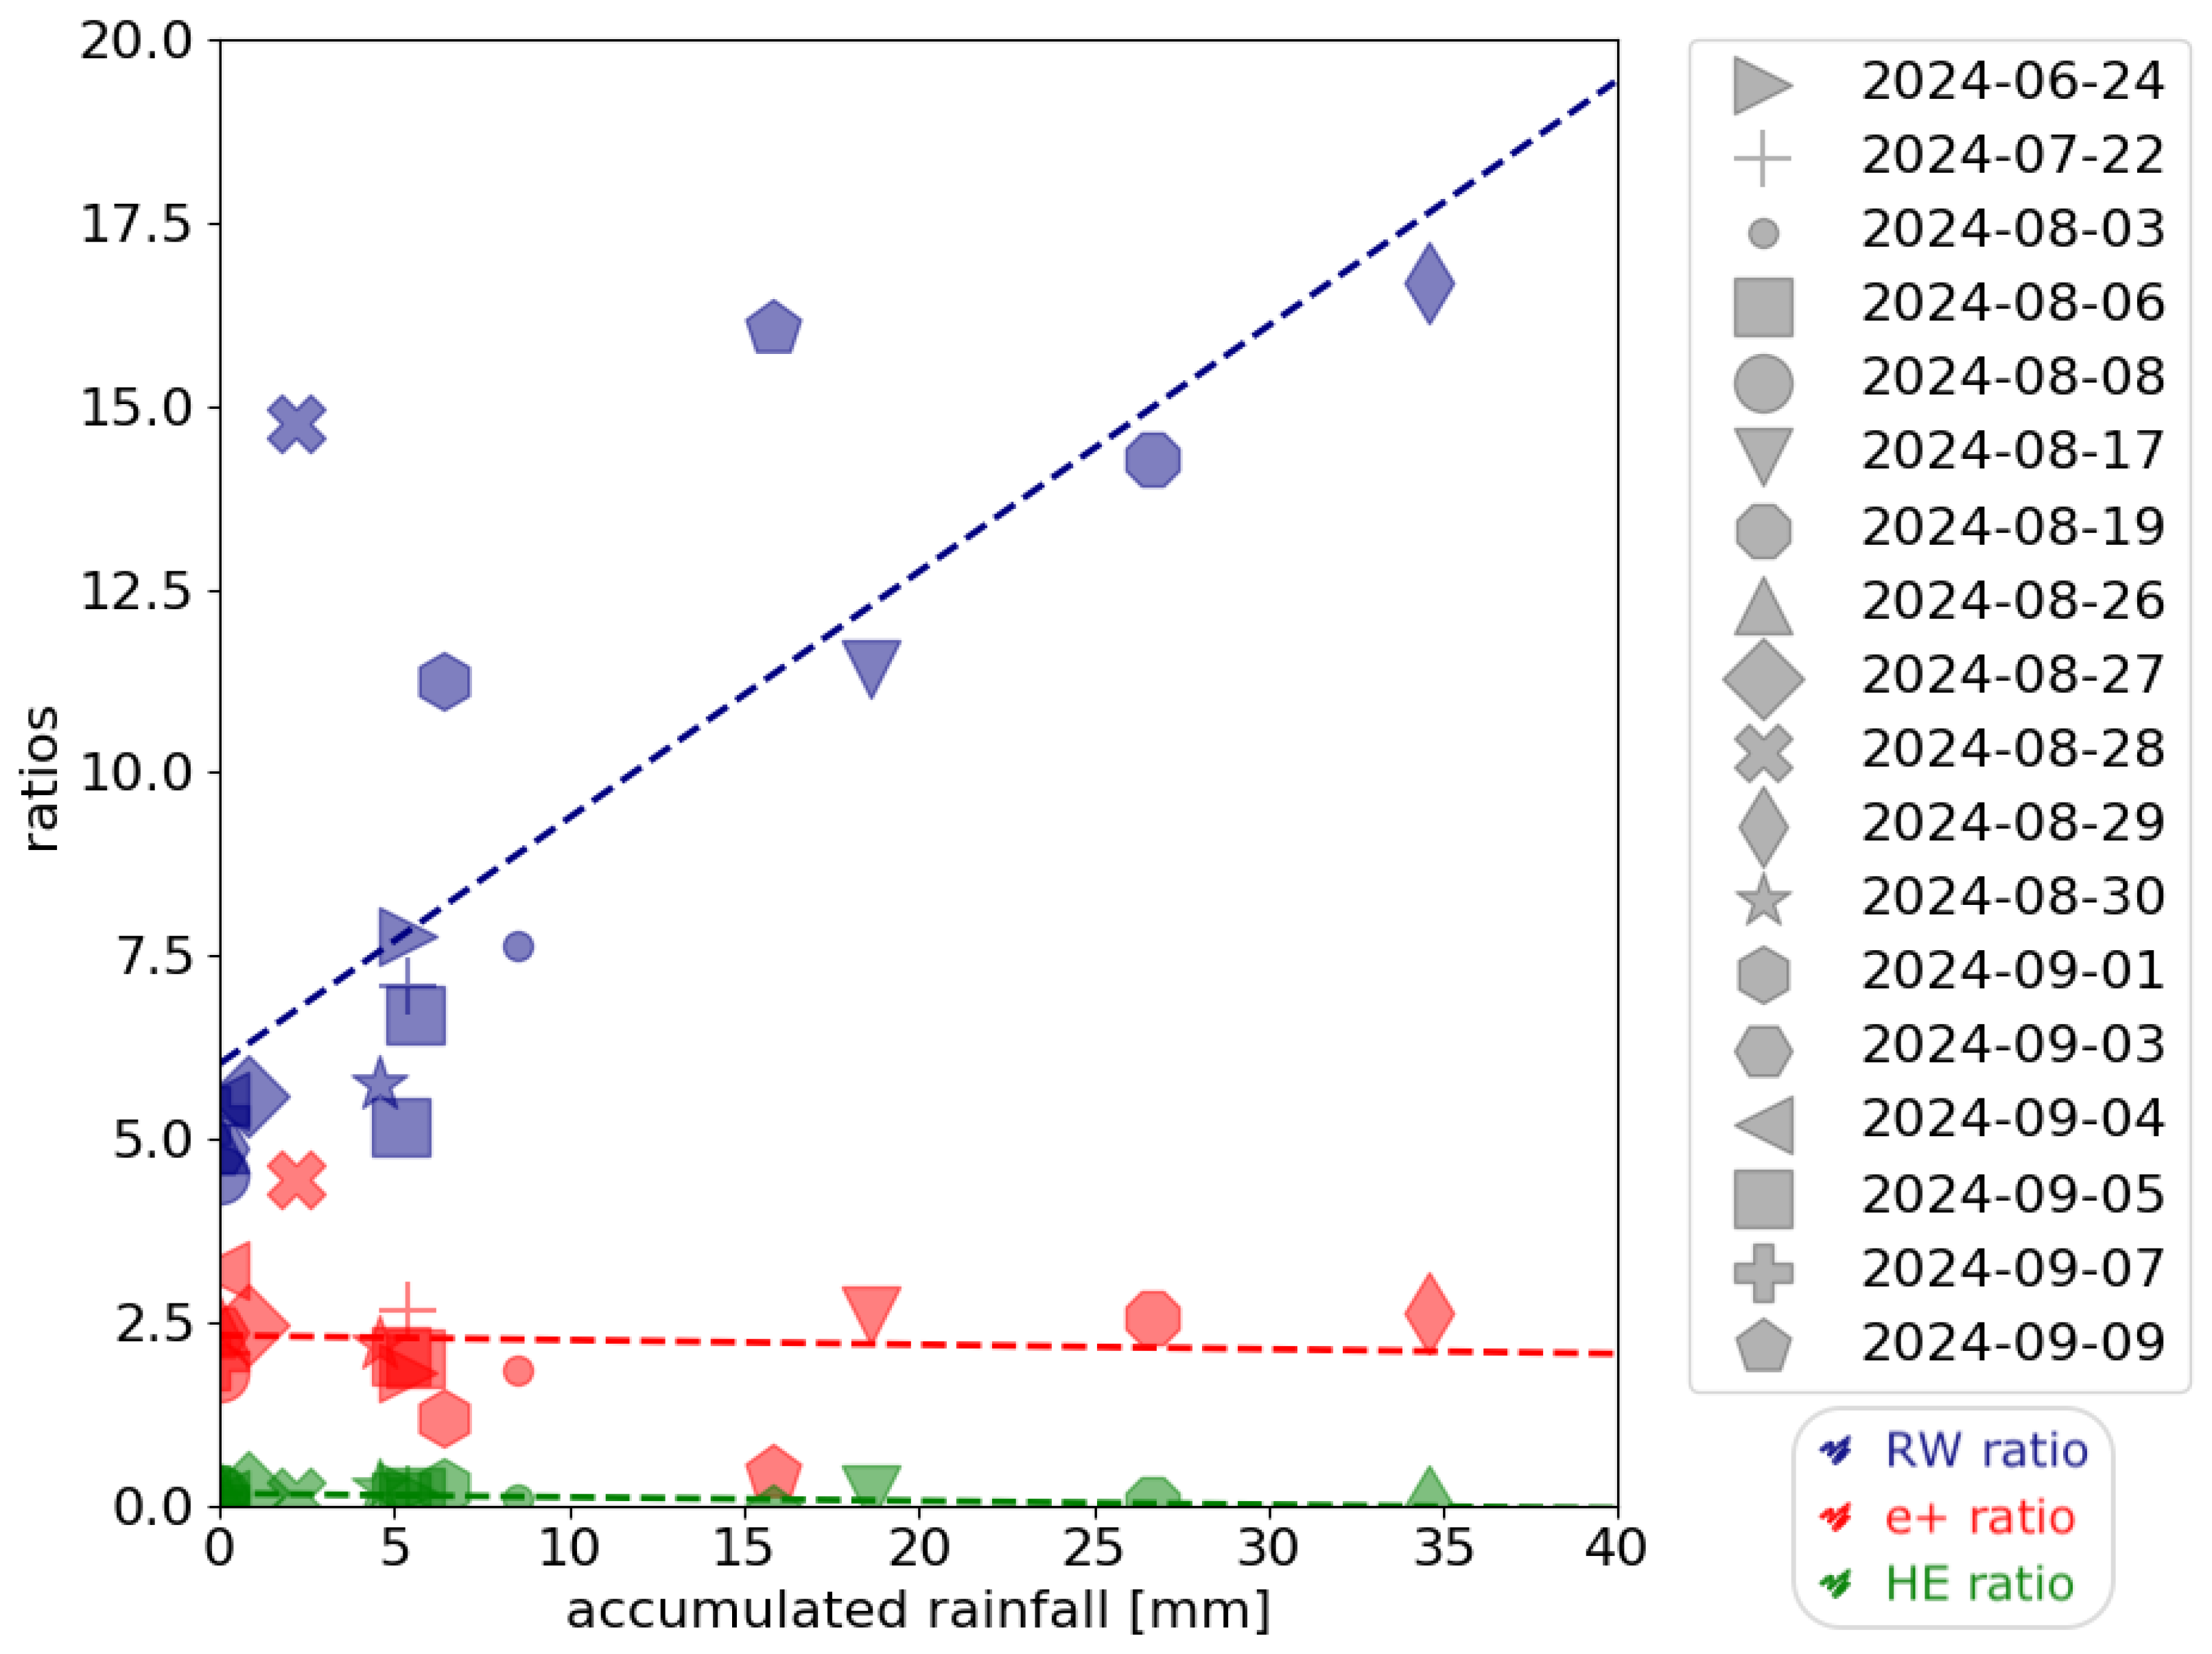
Figure 5 shows a scatter plot of the precipitation amount versus those ratios, for each precipitation event (represented with different marker types). The RW ratio is plotted in blue, the e+ ratio in red, and the HE ratio in green. Among the different ratios under analysis, the only one showing hints of a correlation with the amount of precipitation is the RW ratio, exhibiting a linear correlation coefficient
, for a best-fit trend line with linear coefficient
. On the other hand, the other two ratios show quite stable behavior, regardless of the associated collected rainfall amount. It is interesting to notice that all the precipitation events that released a noteworthy rainfall amount (i.e., >10 mm) showed a clear RW ratio signature in the gamma-ray data, leaving the bottom-right corner of the plot unpopulated. Some events with a rather moderate rainfall amount exhibit moderate variation in the RW ratio, preventing us from obtaining a clear linear correlation between the two parameters. This is true as the intensity of the RW signal does not only depend on the amount of water precipitated and accumulated nearby the detectors, but also on the previous radon washout and rainout processes, which themselves depend on other features, such as the precipitation rate and the intensity of winds.
We also point out that the ESTHER detectors are not lead-shielded spectrometers and are not intended for detailed spectroscopic analysis. The calculation of these ratios only provide a qualitative description of the gamma-ray spectral signature associated with the experienced rainfall episodes.
8. Detection of an Intense Positron Burst During the 22 July 2024 Thunderstorm
In the early afternoon of 22 July 2024, an intense thunderstorm took place within 10 km from the Citelli Refuge, approximately from 14:30 to 17:30 UTC.
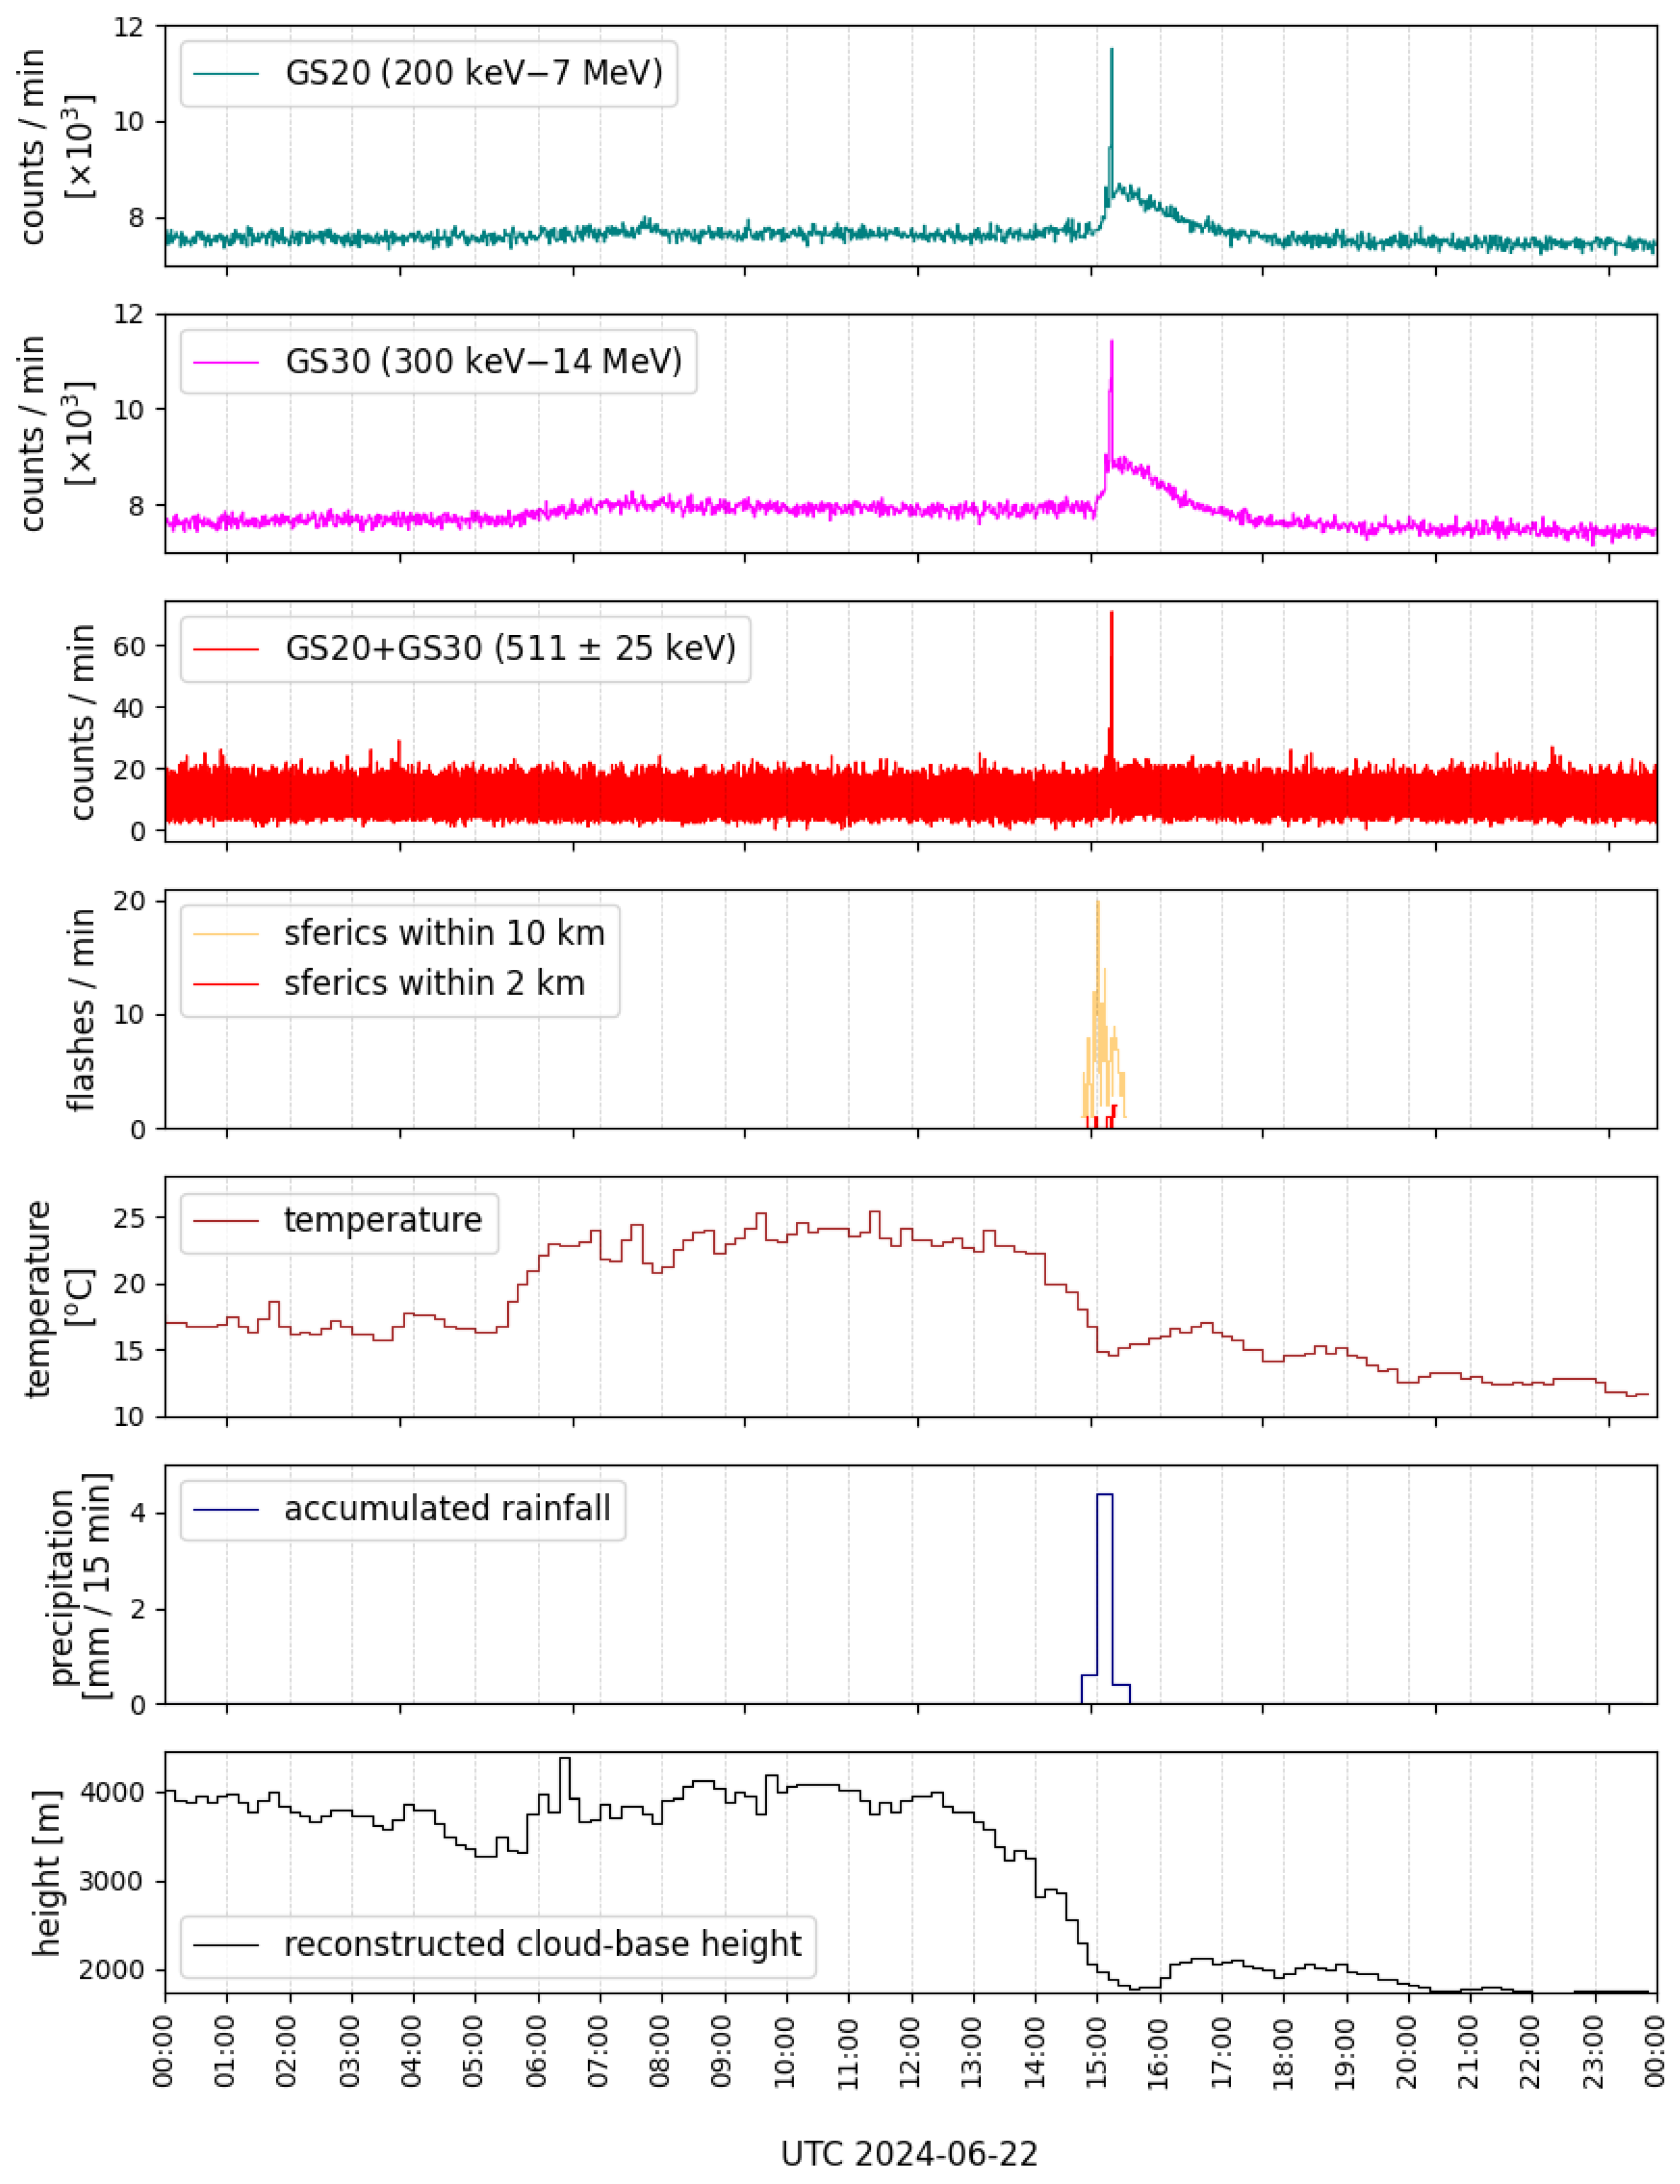
Figure 6 offers a general overview of the whole day, in terms of gamma-ray activity, emission in the 511 ± 25 keV energy range, lightning occurrence, temperature, precipitation, and reconstructed cloudbase height. The first two panels report 1 min light curves acquired by the ESTHER gamma-ray detectors, in the 200 keV–7 MeV and 300 keV–14 MeV energy ranges, respectively. An intense peak can be spotted, around 15:10, which consists of a 6.3 min event composed of several shorter sub-episodes. This sharp emission takes place just at the initial stages of a longer-lasting emission, from around 15:00 to 17:30, produced by typical radon washout processes due to rainfall. The third panel reports the GS20 and GS30 counts summed together, just referring to the
keV energy range. It is interesting to notice that the peak emission at 511 keV is completely associated with the 6.3 min gamma-ray event and does not show any noteworthy contribution during the radon washout’s long-lasting tail. The fourth panel reports the lightning activity recorded by LINET within 10 (red) and 2 km (blue) from the ESTHER installation site: a strong concentration of discharges can be noticed around the time interval of the gamma-ray enhancement, and the presence of events within 2 km at the time the main peak emission took place. The fifth panel of
Figure 6 shows the temperature variation during the day, where a clear lowering can be noticed at the onset of the thunderstorm activity and continuing to the nighttime. The sixth panel reports the rainfall amount, which strongly peaks between 15:00 and 15:15, reaching a total of more than 4 mm released within 15 min. The last panel reports the estimated cloud base height, as reconstructed by using an empirical relation involving temperature, relative humidity, and evaluated dew point with the Magnus formula. It can be noticed that, exactly at the onset of the thunderstorm, the cloud base height drastically drops from an average height of ∼4000 m to ∼1700 m (average altitude of the Citelli Refuge), meaning that the site was affected by the presence of surrounding condensed water.
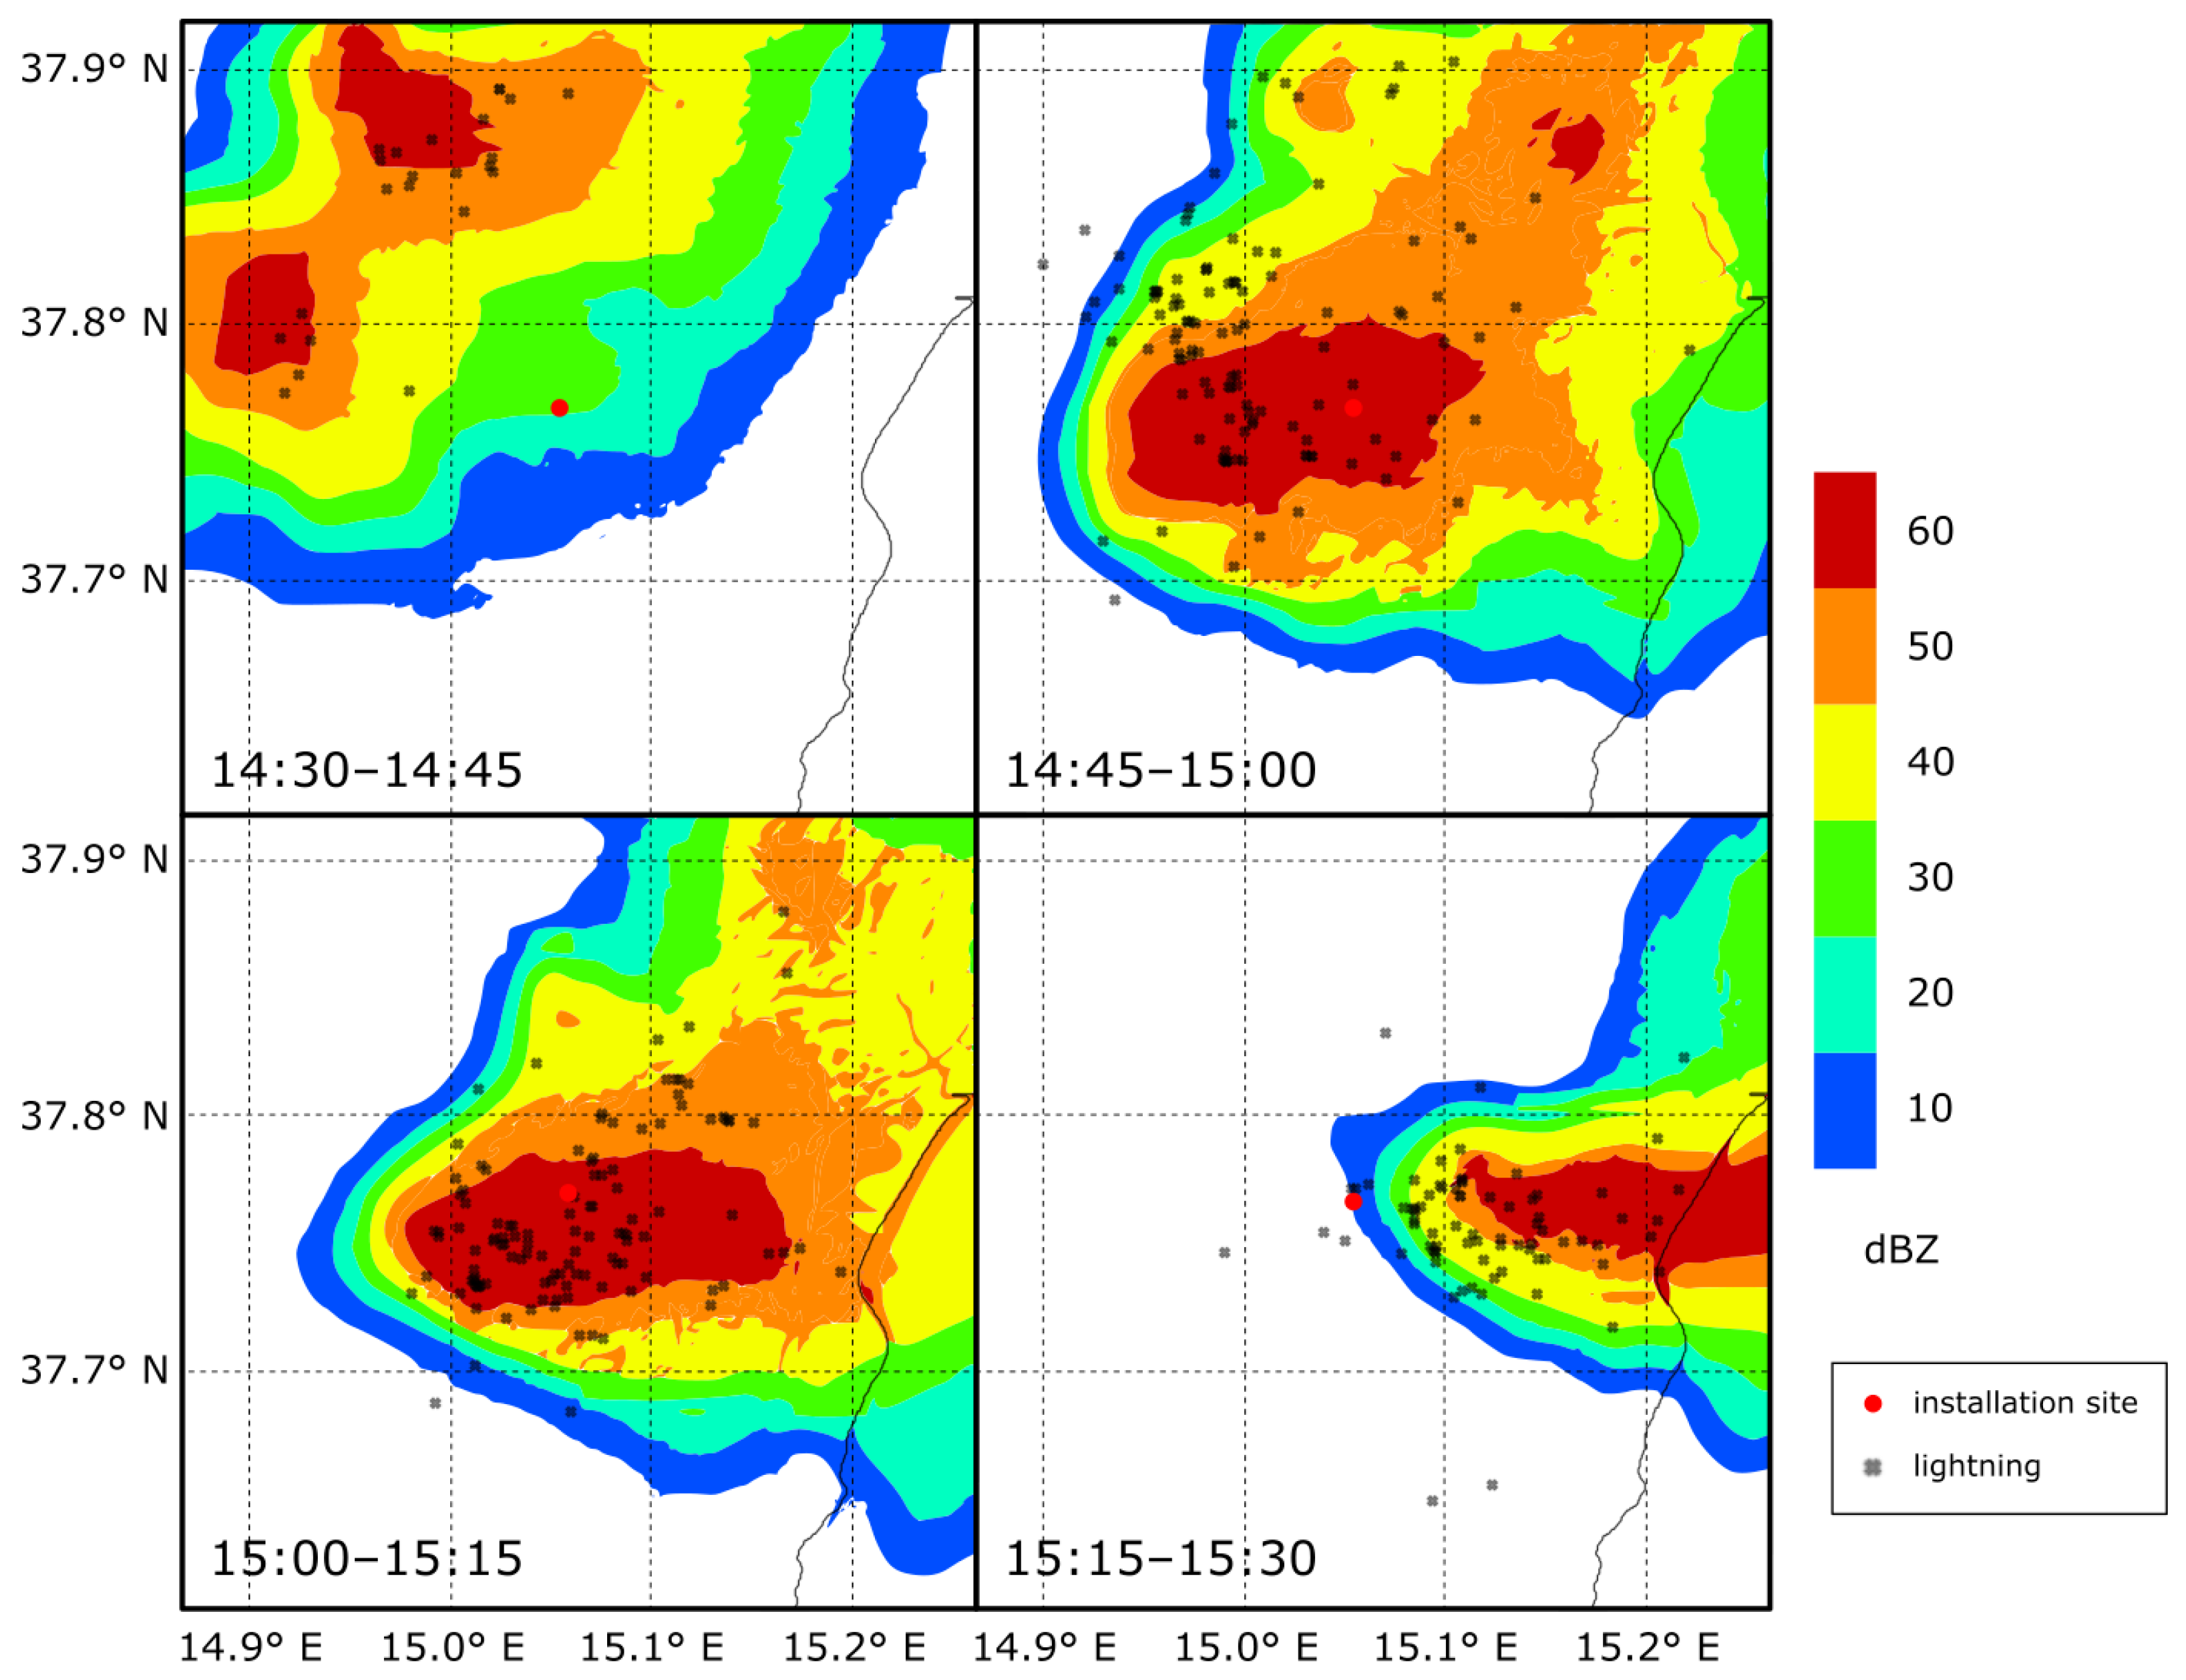
Figure 7 shows radar reflectivity maps in the time interval between 14:45 and 15:30, when the installation site (marked with the central red dot) was mostly affected by the passage of the thunderstorm and its associated rainfall. We also report the lightning flashes (black crosses) recorded by LINET in the same time interval, which offer a qualitative view of how the electrical activity was moving along with the storm cell. Each plot reports the flashes collected within
min. We point out that, since the installation at the Citelli Refuge was thought as an initial test phase of the whole setup, the ESTHER VLF/LF antenna was still not operational on 22 July 2024. As a consequence, no locally acquired VLF/LF data for this event are available and all lightning information rely on the LINET network.
8.1. Temporal Analysis
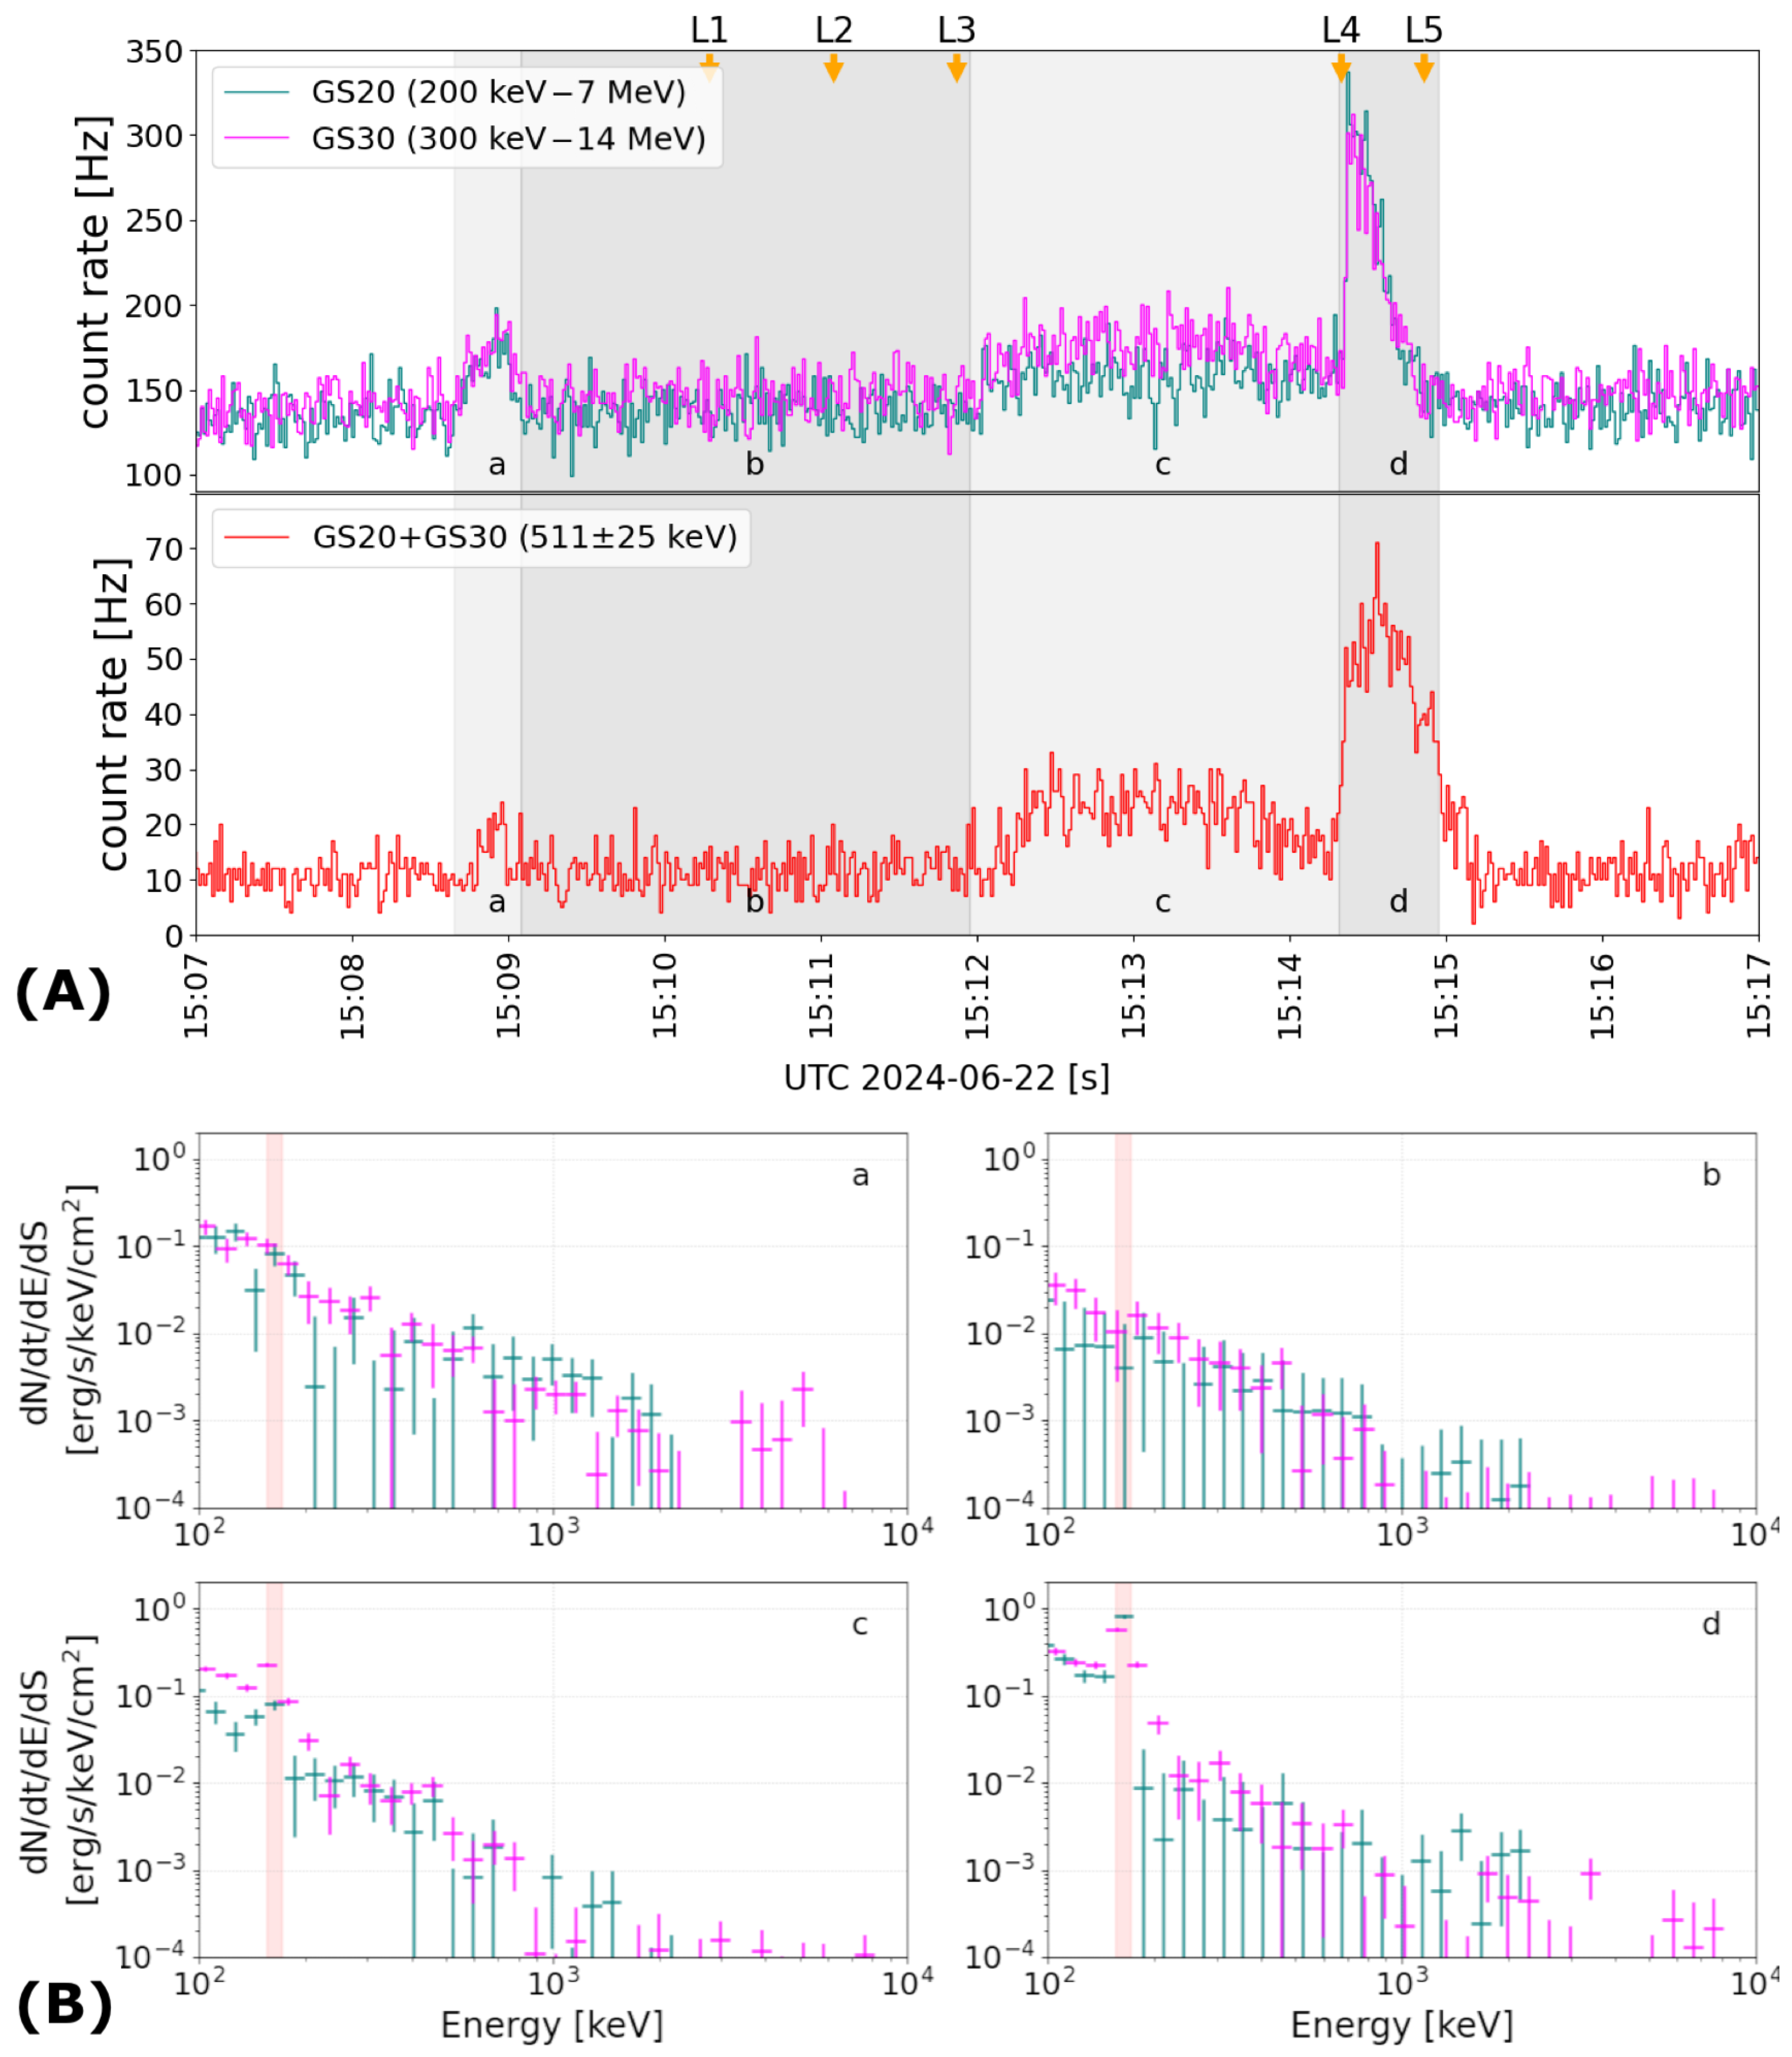
Figure 8a offers a detailed view of the event detected by ESTHER on 22 July 2024. The overall emission started at T0 = 22 July 2024 15:08:39 ± 0.5 s UT and lasted about 6.3 min (378 s). It is characterized by four main intervals, where both GS20 and GS30 detectors show the same trend and revealed consistent emission time profiles.
In
Table 1, some parameters related to the four time intervals are reported, such as duration and significance expressed in
. In particular, the fourth column reports, for each interval, the fraction of counts released in the
keV, with respect to the total counts. This parameter allows us to highlight how much the 511 keV component weights in the overall emission of each time interval. Finally, the last column reports the ratio of the count rate in the
keV band detected during the interval, with respect to that typically encountered in the background. This parameter allows for the assessment of how much the
keV count rate fluctuates across different intervals.
We point out that, for the study of this event, the background rate was calculated independently for each GS detector, on a 30 min time interval, going from T0-31 min to T0-1 min (with T0 beginning at interval-a). Such a window was the result of a compromise: a larger time interval would have been affected by rapid weather variation (the thunderstorm onset) and would have exhibited a non-negligible standard deviation, causing the background to deviate from Poisson’s statistics; conversely, a shorter timescale would not have provided sufficient statistics to accurately perform the background subtraction.
8.2. Concomitant Lightning Discharges
It is interesting to notice that, in the 6.3 min time interval constituting this gamma-ray event, five lightning strokes took place within
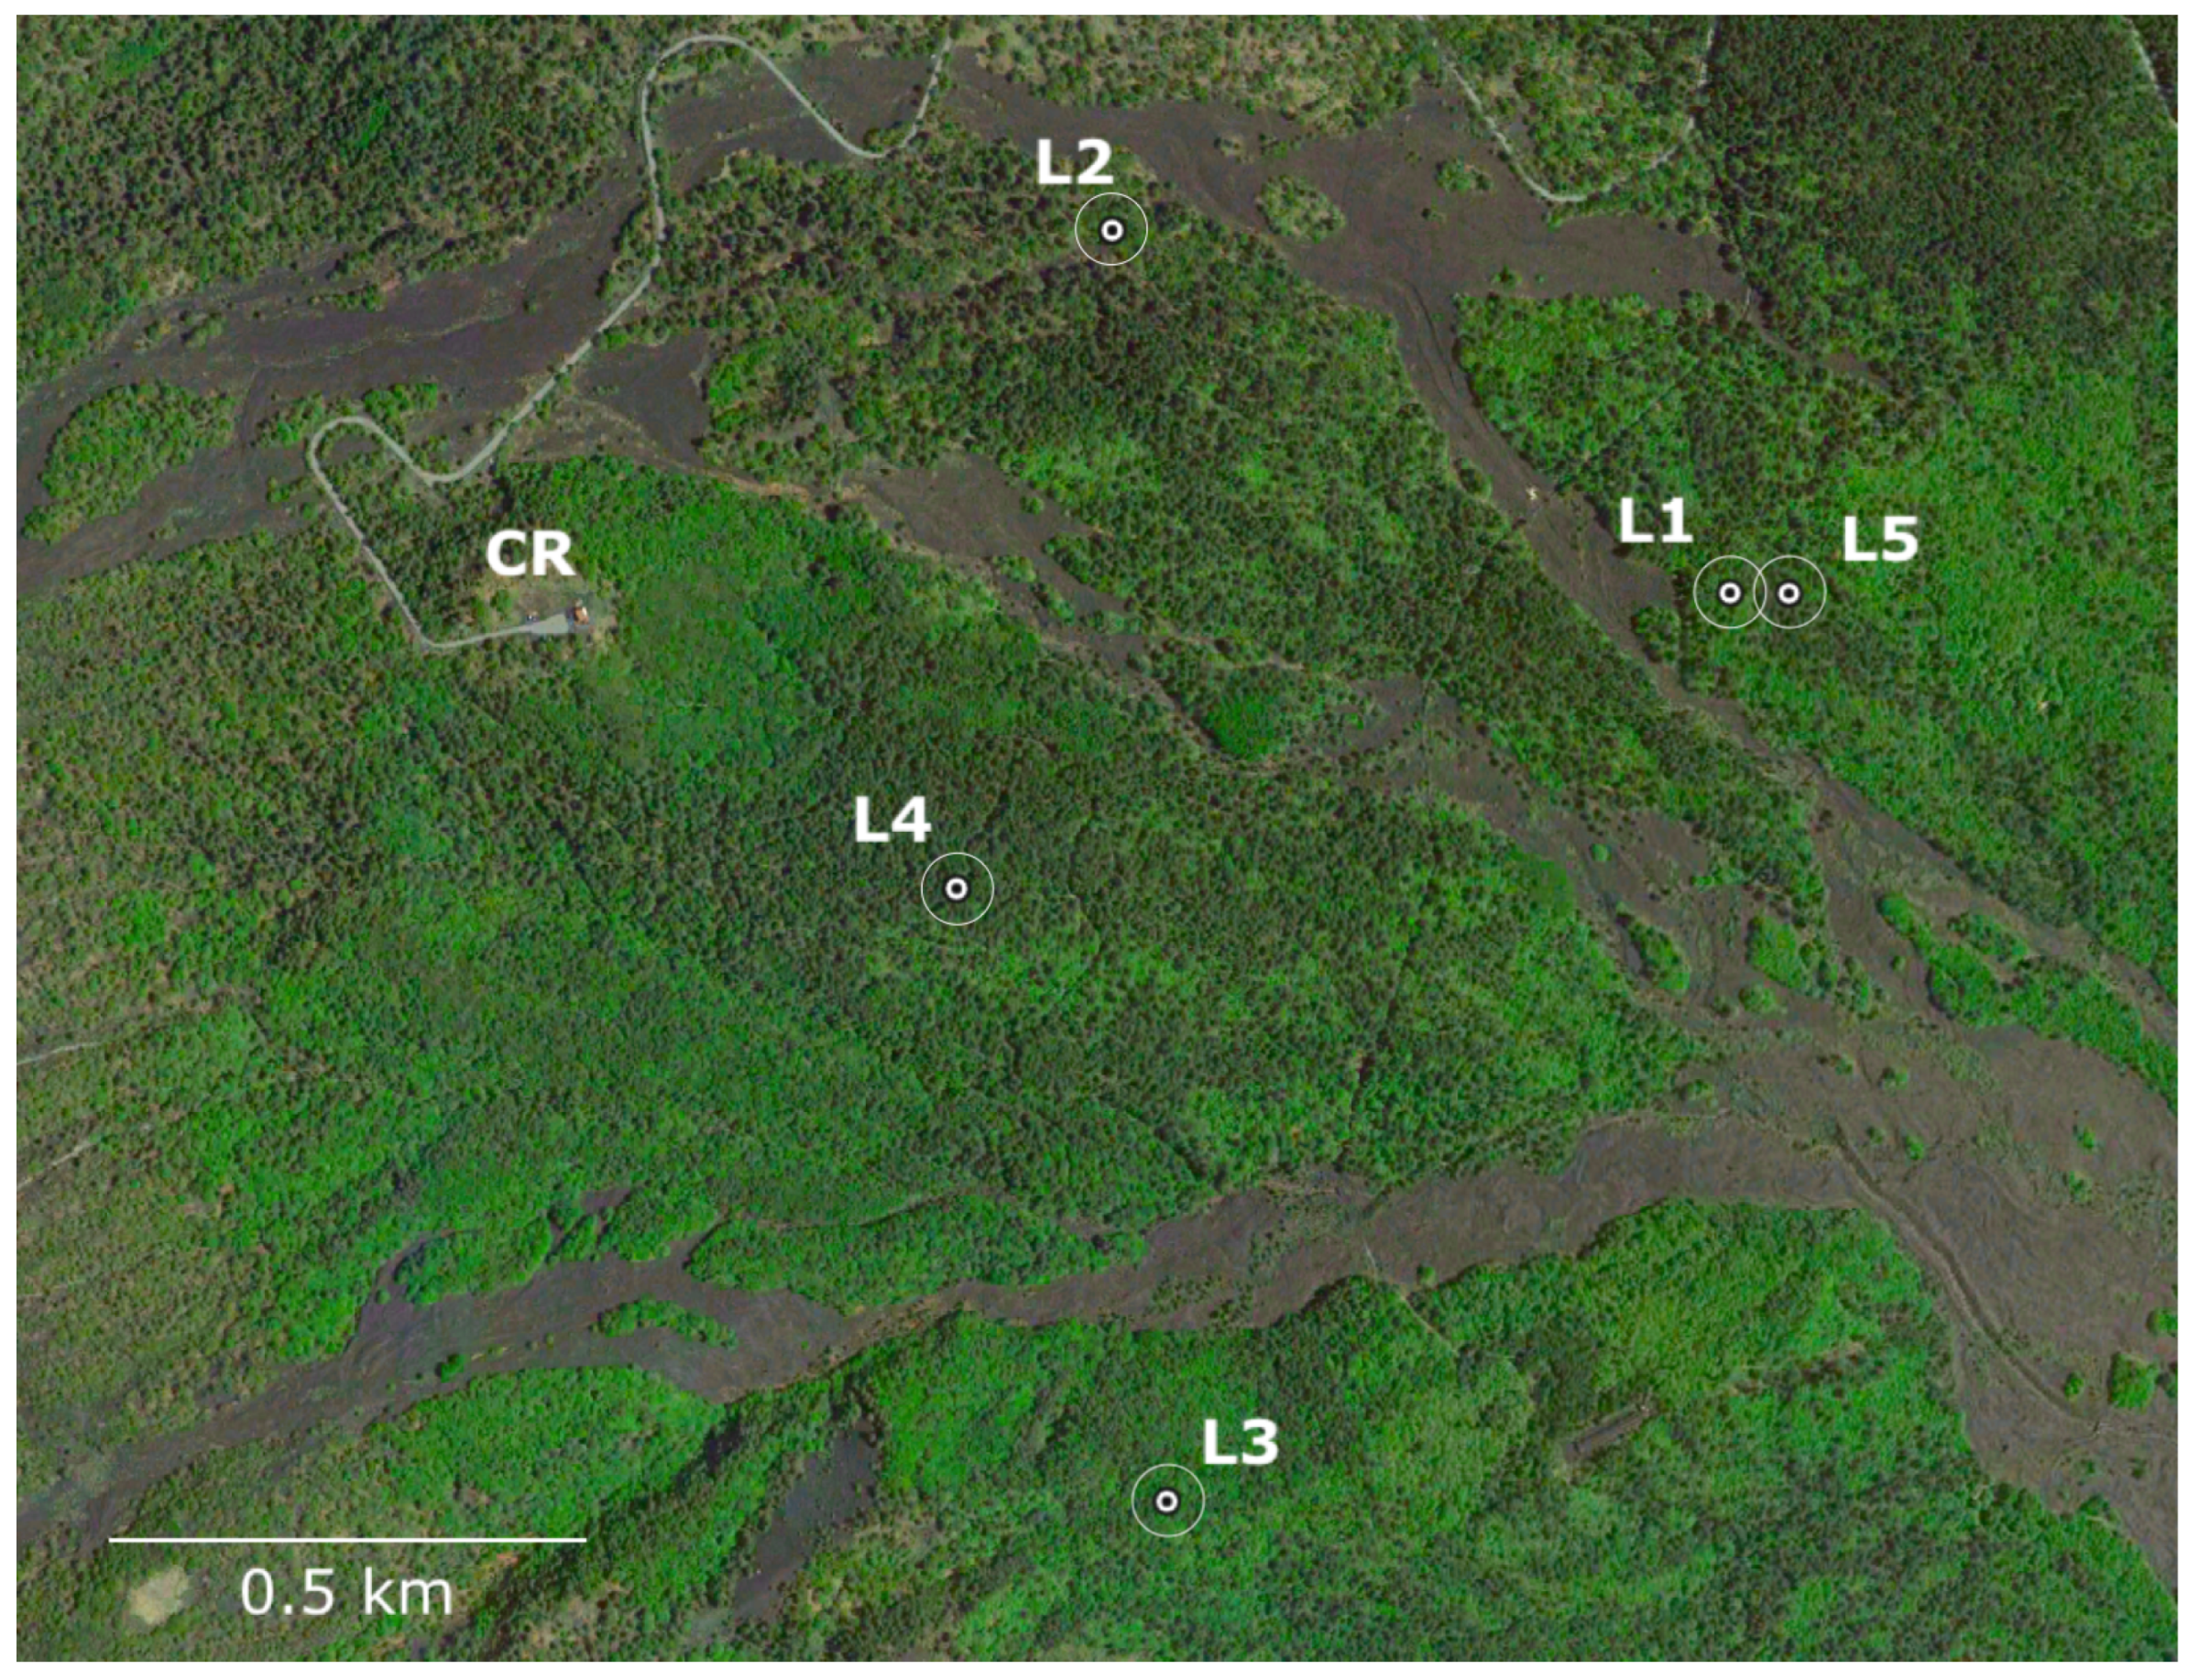
km from the installation site. In the plot, we report the closest (from the installation site marked as CR) lightning flashes that occurred within the duration of the event, flagged as L1–L5, and whose position is reported in
Figure 9, with a related mean error of 75 m. Not all these lightning flashes are directly correlated to the gamma-ray events, given their distance from the installation site and their temporal occurrence, but it is interesting to notice that the closest stroke (L4, 0.49 km from the experimental setup) takes place right before the onset of the most intense gamma-ray peak at UT 15:14:19. We point out that the L3 lightning stroke that takes place right before the onset of the shallow
interval-c emission was reconstructed by LINET as a CG-flash with a −12.6 kA peak current, whereas the L4, at the onset of the intense
interval-d burst was an IC flash with 6 kA intensity and 9.3 km reconstructed height.
8.3. Spectral Analysis
A detailed spectral analysis of the gamma-ray event was carried out. The reference background spectrum evaluated over the 30 min preceding the onset of
interval-a was subtracted from the spectra of each event time interval to retrieve the true net signals. Also, in order to pass from detector counts to physical units, Monte Carlo simulations have been carried out to reconstruct the effective area response matrices for the GS20 and GS30 detectors, allowing us to retrieve the flux emitted during each time interval. This spectral analysis allowed us to reveal an interesting temporal evolution, as shown in
Figure 8b, where background-subtracted spectra of GS20 and GS30 data, for each
a–
d time interval, are reported. Generally, GS20 counts exhibit larger error bars with respect to GS30, due to the lower number of counts collected by the smaller collecting area. In each panel, the red vertical band represents the
keV energy range, which corresponds to the positron annihilation emission line and the FWHM of the associated best-fit Gaussian, calculated on the acquired data. We point out that, with the typical environmental background rate, the fraction of counts released within
keV represent about 4% of the total detected counts. A brief description of the spectral evolution in the various intervals is reported below.
Interval-a exhibits a slight gamma-ray emission above 2.6 MeV in the GS30 detector, the one with the largest energy range, which might be the signature of a weak gamma-ray glow producing photons via a MOS mechanism; however, no sharp termination was observed for this event, as well as no lightning strokes occurring at the end of this burst, as for other detected gamma-ray glows terminating with a discharge at the end [
4,
10,
14]. Although weak, the overall emission has a significance of about
. On the other hand, no noteworthy enhancements in the 511 keV band are exhibited, as shown in
Table 1, where the count rate within
keV is only 1.2 times that typically encountered in the background. Also, the fraction of counts released within
keV represent about 5% of the total counts detected in this time interval, in agreement with the 4% typically encountered in the background.
Interval-b shows no considerable emission in the light curves, as well as in its background-subtracted correlated spectra, where the count rate in each channel significantly drops down. This interval constitutes a pause between the emissions, although a subtle gamma-ray emission is present and exhibits a significance of
. There is no enhancement in the 511 keV emission rate, as shown in
Table 1, where the count rate in that energy range is 1.1 times that encountered in the background. The fraction of counts released in the 511 keV band is about 4% of the total counts detected in this time interval, as encountered in the background.
Interval-c shows a shallow enhancement in the count rate, with some hints of a high-energy component above 2.6 MeV, as with
interval-a. However, what is more noticeable is the slight increase in the
keV energy range clearly observable in both detectors. As reported in
Table 1, the count rate in this band is twice that typically encountered in the background rate, whereas the overall count rate is about 1.3 times that of the background. In this case, the fraction of counts released within
keV raises to 6%.
Interval-d exhibits an intense emission peak, reaching about 2.3 times the background rate. Such episode is characterized by no significant gamma-ray emission above 2.6 MeV, but by an even larger release of counts in the keV range. The count rate in that energy range raises to 4.9 times that encountered in the typical background, with the fraction of counts released in the 511 keV band raising to 12% of the total counts released in this time interval. A non-negligible emission below the keV band could be spotted, presumably due to Compton scattering inside the detector.
8.4. Discussion
The massive emission at 511 keV, encountered firstly in
interval-c and then, more intensely, in
interval-d, could be the result of the annihilation of positrons produced in the parent thundercloud, either during relativistic runaway processes (RREAs), as already revealed by [
15], or by photonuclear reactions in the atmospheric lower layers, as observed in [
1]. The proximity of the CG- L3 to the onset of
interval-c and of the IC L4 to the onset of the final
interval-d could suggest that these strokes acted as a trigger for the production of photonuclear reactions, involving the production of unstable
13N, followed by positrons, and 511 keV photons from their annihilation with electrons in matter.
The rather smooth time evolution of interval-c, which, especially in GS30 data, shows a Gaussian-like profile, suggests nevertheless that this could be the result of a positron cloud moving above the experimental setup, together with the storm cell. Between 15:00 and 17:00 UT, the ground stations nearby the experimental setup recorded a wind speed on the ground (i.e., ∼1500–2000 m) ranging within 25–30 km/h. Considering that interval-c lasts about 142 s, this would translate into a crossed distance of about 80–100 m, at an altitude of 60–70 m above the detectors, which is reasonable in terms of the survival of gamma-rays produced by pair annihilation in the atmosphere.
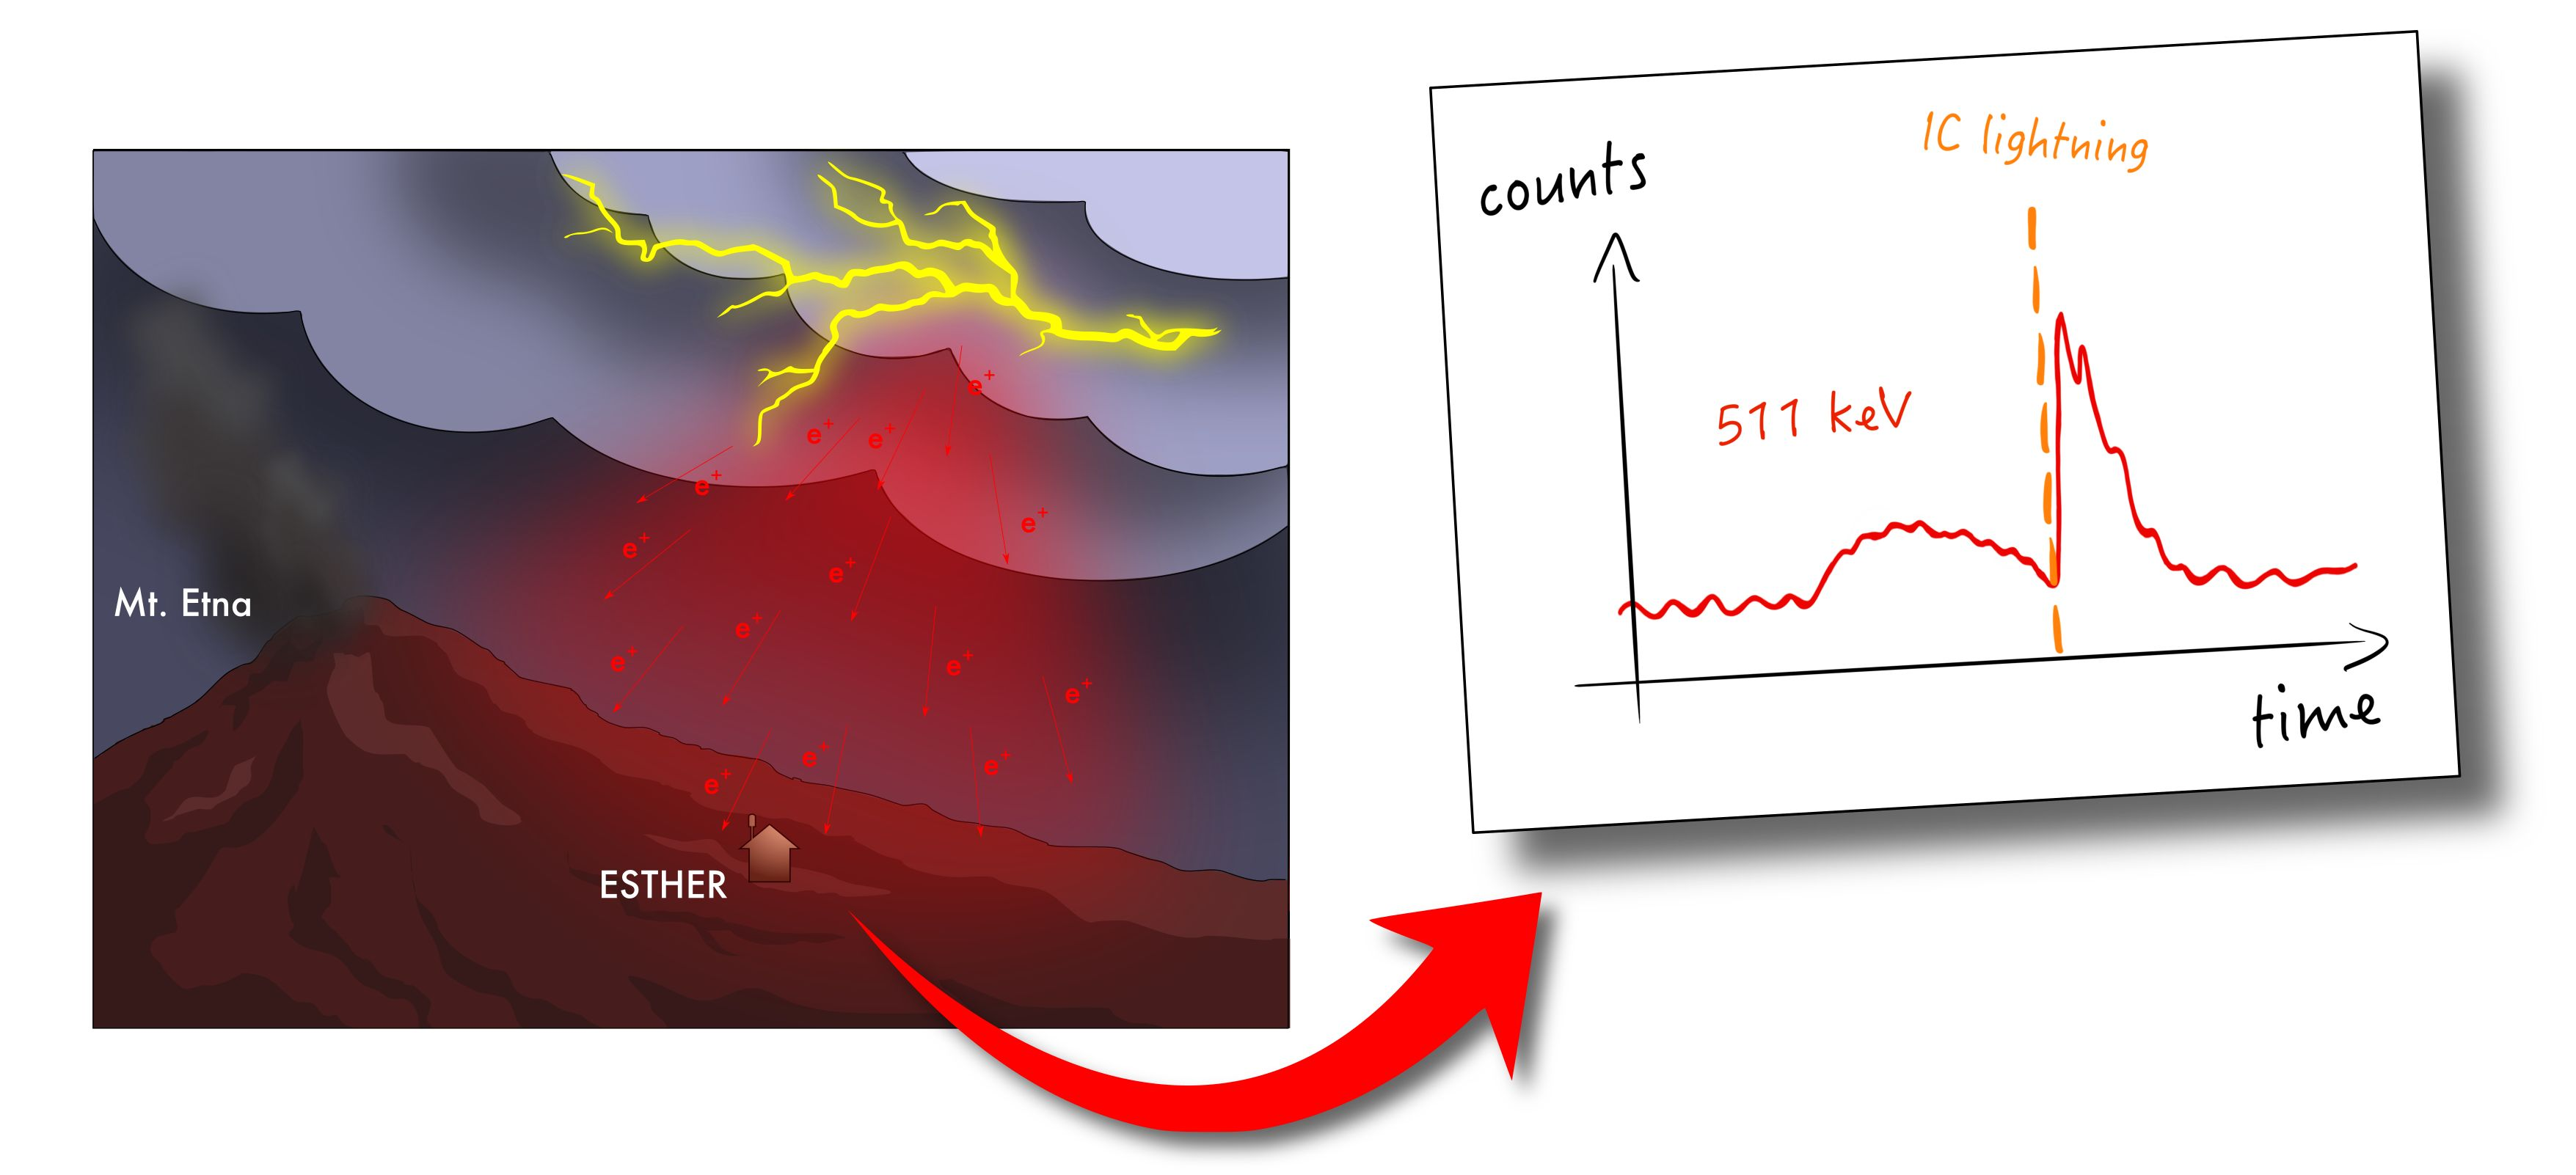
Applying the same reasoning to interval-d, lasting only 38 s, this translates into an estimated crossed distance of 20–25 m at an altitude of about 14–17 m over the experimental setup. However, this would imply a very low thunderstorm base populated with positrons passing above the detectors. The temporal structure of this interval, with a fast rise and a slower decay, together with the occurrence of the IC lightning L4 (the closest to the installation site, with a reconstructed height of 9.3 km) just at the onset of the episode, mostly suggests that this emission could be the result of positrons annihilating in the atmosphere after some photonuclear reactions triggered by gamma-rays produced in the initial lightning. However, a close-up at high time resolution on the onset of interval-d shows no evidence of TGF-like events occurring at the beginning of the episode. A more detailed analysis of this event is still ongoing and will be the object of a more focused forthcoming study.
A detailed analysis of the LINET data recorded in this site between 2010 and 2024 shows that very close lightning (≤1 km) is not extremely rare, but tends to be concentrated in a few intense episodes. The Citelli site registers an average of 15 lightning strikes/year within 1 km, distributed over approximately 6 active days. In particular, 2024 was one of the most electrically active years since 2010, with 23 lightning strikes and 11 days with activity within 1 km, mostly concentrated in the summer season.
9. Lesson Learnts and Future Perspectives
This first effort in summer 2024 was a critical proof-of-concept. We successfully used it to assess whether the installation sites were viable, establish a baseline for potential environmental risks and instrumentation requirements, and fully understand the practical strengths and weaknesses of our setup. This successful benchmarking effort provides a robust starting point. The knowledge gained during these first test phases allowed us to devise future improvements, in view of more effective observational campaigns in the summers to come. For the next phases of the project, we plan to reproduce the observational campaign at the Etnean Observatory for a longer time interval (i.e., a whole summer). In order to achieve that, we plan to make the experimental setup better performing and more suitable to the location by addressing all the issues encountered during the first surveys in terms of power supply, internet connection, and containment. Also, the possibility of expanding the setup, by adding further gamma-ray detectors sensitive to different energy ranges, is currently under evaluation.
10. Reproducibility
The adopted setup is totally reproducible, portable, and modular. From a technical point of view, all detectors could be powered by standard single-phase 220V AC @ 50 Hz (as achieved at the Citelli Refuge), as well as by low-voltage DC sources, such as batteries or solar power systems (as completed at the Etnean Observatory). If there is network coverage in the installation area, a modem can be useful to remotely connect to the experimental setup and download data (as completed at the Citelli Refuge); otherwise, it is fundamental to provide the setup with local storage to ensure complete data collection (as demonstrated at the Etnean Observatory). Concerning installation and maintenance, the setup is intended to study thunderstorm-related high-energy events, so it should be installed at high altitudes, to reduce atmospheric absorption, and placed outdoors, where it will experience conditions of intense humidity, wind, and rain. It is important that the detectors are not excessively shielded by nearby concrete structures, which may limit their field-of-view and detection efficiency. Also, it is fundamental to protect the instrumentation from rainwater damage, by housing the detectors inside a water-proof case (in our case, for both installations, a 2 mm thick aluminium container was sufficient). Lastly, the container must be securely bolted to the ground to avoid displacement caused by high winds typically encountered at high altitudes. Concerning the environmental conditions under which the instrumentation operates, the experimental setup worked well throughout the whole data take at the Citelli Refuge, during which it encountered temperatures ranging from a few °C to 30 °C and relative humidity from 0% to 100%. These changes in the weather conditions only affected the calibration procedure, which had to be carried out continuously and updated for each hour of data acquisition. For energy reconstruction, we used environmental radioactivity peaks as calibrators and performed Monte Carlo simulations to build the detectors’ effective area response matrices to pass from counts to physical units.
11. Conclusions
We report the first results of the ESTHER experiment, installed on Mt. Etna (Italy) to investigate high-energy emissions in thunderstorms. Up to now, the experiment carried out two data takes during summer 2024, covering more than 4 months, from 24 May 2024 to 4 October 2024. The detectors were installed firstly at the Citelli Refuge of the Italian Alpine Club, at 1741 m altitude, and successively at the Etnean Observatory “Pizzi Deneri” of the National Institute for Geophysics and Volcanology, at 2818 m altitude. During these first surveys, the experimental setup experienced a total of 22 days affected by nearby thunderstorms.
Most of these days exhibited a typical signature in the gamma-ray background, due to radon washout/rainout processes, occurring during heavy precipitation events. For all these days affected by stormy weather and rain, we evaluated the contribution to the gamma-ray spectrum by 222Rn daughters (i.e., 214Bi and 214Pb), as well as the contribution of photons in the 511 keV energy range, to highlight possible pair annihilation mechanisms, and the contribution of photons above 2.6 MeV, to identify possible gamma-ray glow or TGF events, releasing photons in the highest energy regime. With the exception of the event that occurred on 22 July 2024, no noteworthy 511 keV or >2.6 MeV signatures were found in the acquired data. An analysis of 15 rainfall events pointed out that only the Bi and Pb products exhibit a dependence on the precipitation amount, releasing a larger number of photons during rainfall, whereas the 511 keV and >2.6 MeV count rate show no variations with respect to their typical rate in the gamma-ray background.
The most interesting result from these first data takes is the detection of a 6.3 min gamma-ray event, which occurred at the Citelli Refuge on 22 July 2024 during an intense thunderstorm at the installation site that saw the occurrence of several lightning strokes within 500 m from the instruments. A detailed analysis of the detected event allowed us to identify four distinct intervals, whose spectral signatures show interesting features and time evolution: an initial 26 s likely of gamma-ray glow, followed by about a 3 min gap then a shallow 142 s enhancement and a 38 s intense burst. Both of the last episodes show a remarkable emission in the
keV energy range, presumably produced by the annihilation of positrons in the surrounding atmosphere. In particular, the final burst released more than
of its total counts in the
keV energy range, exhibiting a count rate in this band about five times higher than that encountered in the typical environmental background rate. We point out that this emission could be the result of the annihilation in the atmosphere of positrons produced either by RREA processes and photonuclear reactions triggered by short bursts of gamma-rays (e.g., TGFs), and the passage of such positron-populated cloud cells over the experimental setup. Similar events have been documented so far by both airborne campaigns and on-ground facilities [
15,
16,
17]. Based on the wind speed recorded at the installation site, the third episode (i.e., the shallow prolonged emission) is compatible with a group of positrons passing over the detectors at an altitude of about 60–70 m. On the other hand, the temporal profile of the final 38 s burst, exhibiting a fast rise and slower decay, suggests it could be the result of positron annihilation in the atmosphere, produced by unstable
13N after some photonuclear reactions triggered by lightning and high-energy associated emission. Indeed, the closest lightning strike, an IC lightning event with a reconstructed height of 9.3 km and position within
m from the installation site, occurred right at the onset of this final burst, although no clear signatures of a TGF event were detected.
These first results seem promising for investigating thunderstorm-related high-energy emissions at Mt. Etna, with the summer 2024 campaign representing a good starting point. The lessons learned regarding the installation sites’ features, environmental challenges, and equipment performance will be directly applied to refine and improve the overall experimental setup, in view of future installations. This iterative process paves the way for better-optimized systems and more comprehensive observational campaigns to be carried out in future summer seasons.




 ,
,