Abstract
A farm-specific early warning system has been developed to mitigate agricultural damage caused by climate change. This system utilizes weather data at the farm level to predict crop growth, forecast weather disaster risks, and provide risk alerts to farmers and local governments. For effective implementation, local governments must lead operating early warning services that reflect regional agricultural characteristics and farmers’ needs, while the central government provides foundational data. The system connects data from each region to the cloud, enabling the establishment of a nationwide integrated service operation framework that includes the central government, metropolitan cities, municipalities, and farmers.
1. Introduction
Climate change is increasing both the frequency of meteorological disasters and the severity of agricultural damage worldwide. In response to these challenges, research on various early warning technologies for addressing climate change is being conducted around the world [1,2,3,4,5,6]. UNDTR, WMO, and others have established the EW4All (Early Warnings for All) initiative to protect lives through early warning systems for climate-related events and enhance resilience [7]. WMO, the World Bank, and others are also expanding early warning systems through the CREWS (Climate Risk and Early Warning Systems) program [8]. Agriculture is a highly vulnerable industry to climate change, and weather events including extreme temperatures, droughts, and floods are the major hazards causing losses in agriculture [9]. Weather anomalies manifest across diverse spatial scales, yet an early warning system for climate change adaptation in the agriculture sector proves its effectiveness when rooted in a specific location with its local farming attributes [10]. The Early Warning Service for Agrometeorological Disasters in Korea (EWS) has been developed as an integrated system that provides its service to individual farmers and the Local Government Unit (LGU) with various ICT technologies for predicting agrometeorological disasters [11]. Built on the meteorological data precision process as a core technology, EWS estimates the growth stage of crops cultivated in the specific farm and the risk of agrometeorological disaster according to the crop and its estimated growth stage. The predicted risk information is not only delivered timely to individual farms with guidelines to prevent crop damage, but also provided as distribution maps that enable monitoring of regional risk prediction statuses.
EWS was initially piloted in specific areas, but as the service area has expanded, pilot system at a metropolitan scale, led by LGUs, has been implemented to ensure efficient operation of the system and support agricultural activities tailored to regional characteristics [12]. EWS should not function solely as an emergency response mechanism but should also contribute to daily agricultural activities by supporting disaster risk reduction, sustainable agriculture, and farming guidance [13]. Accordingly, for municipalities where technology development and demonstrations have been completed at the metropolitan level, a dissemination project led by LGU should be conducted. This project would regularly provide farmers with updates on their farm conditions and enable local agricultural extension officers to monitor and guide farmers effectively within their jurisdictions. The metropolitan-level operating system aims to transition into a practical system for ongoing operationalization, continuous investment, and maintenance even after research and development are completed. It targets providing customized services tailored to users and regional needs, specifically designed to meet the practical needs of farmers. For example, building an EWS dashboard tailored for rural extension officers could include functions for the comprehensive monitoring of local weather and weather disaster situations. Additionally, to enhance the effectiveness of information provided to farmers, region-specific agricultural big data could be internally developed. These data would allow for the delivery of differentiated information tailored to local characteristics to farmers. In this way, the metropolitan-led system differs by being tailored to the specific needs of various users according to regional characteristics. This allows for operational efficiency and the ability to differentiate services based on regional needs. Furthermore, at the national level, it is essential to integrate regional metropolitan-scale systems into a comprehensive framework that connects EWS for farmers, municipalities, metropolitan areas, and the entire country (Figure 1).
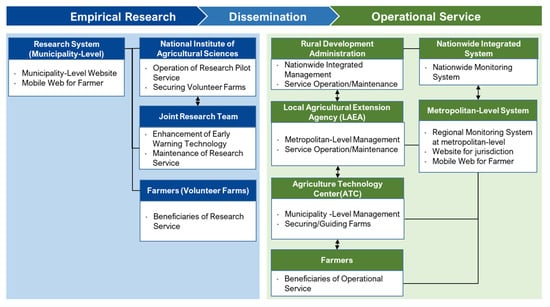
Figure 1.
Management hierarchy of EWS. The central government and research institute are responsible for researching and developing the core technologies of EWS with volunteer farmhouses. An operational service should be implemented for where studies are completed at the metropolitan level.
2. Data and Structure of EWS in South Korea
2.1. Data Processing Stream
EWS uses dynamic and static data, obtained through a data synchronization process, as the source data. It undergoes processes such as importer, publisher, estimator, and postprocessor to translate data in the form of distribution maps and databases. This information is then communicated and delivered to end-users through a real-time stream (Figure 2, Table 1). Due to its operation on servers with limited computational power, features such as resource allocation and data generation order within the workflow have been implemented [14].
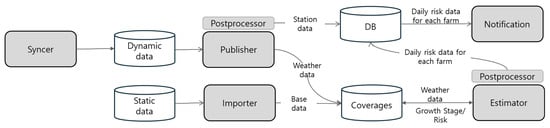
Figure 2.
Data processing diagram.

Table 1.
Details for each process.
2.2. Data Processing Procedures and Content
EWS has developed technology to automatically process a series of information generation processes for EWS utilizing meteorological data from the NMA (Figure 3).
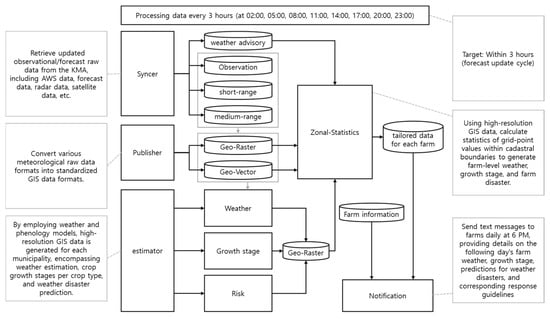
Figure 3.
Data processing procedures of EWS.
This includes the refinement of weather data, estimation of crop growth stages, and prediction of meteorological risks. Basic meteorological data provided by NMA, including observational data, short-term forecasts, and medium-term forecasts, is acquired and stored in a meteorological database. Subsequently, preprocessing tasks are performed to convert meteorological source data from different formats into GIS data of a uniform standard. Utilizing developed climate models [15,16,17,18,19,20,21,22,23] and crop growth models applied to processed meteorological data, high-resolution (spatial resolution of 30m) weather maps, growth stage maps, and meteorological disaster prediction maps are generated for individual municipalities. From the high-resolution prediction maps, statistics for grid points within cadastral boundaries are computed to generate farm-level weather, growth stage, and farm disaster information. This information is then stored in the database. The computed results are sent to users via text message at a scheduled time each day. The goal of the entire process, from acquiring meteorological data from the NMA to sending notifications to users, is to complete it within 3 h, in alignment with the NMA’s forecast update cycle [24].
3. Structure of Metropolitan-Scale EWS in South Korea
3.1. Cloud-Based Infrastructure Architecture
Operating EWS at a metropolitan level involves more than just transferring operational responsibility from the central government to regional authorities. It serves as an intermediary role aimed at integrating the systems of the nine metropolitan regions nationwide in the future. As the EWS integrates at the municipality, metropolitan, and national levels, leveraging a cloud infrastructure offers comprehensive management of data across all the regional systems considering factors such as data processing efficiency, availability of computing resources, scalability, and security. The currently established metropolitan-scale EWSs are built on the G-Cloud platform, a public sector dedicated service provided by Naver Cloud in Korea (Figure 4).
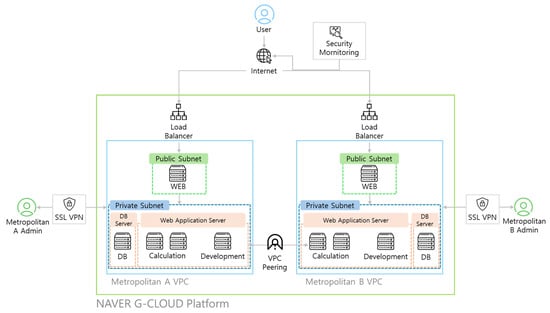
Figure 4.
Cloud-based infrastructure architecture of EWS. Each metropolitan system has its own virtual private cloud (VPC) and VPCs are connected via VPC peering for data sharing.
Individual EWS systems, including the newly implemented metropolitan EWS system, are built in a separate virtual private cloud (VPC) allowing them to operate independently, but still enabling communication between each system by deploying those within the same cloud zone. Users such as farmers and Agricultural Technology Center officers can access the system via a public subnet connected to the internet. Regional administrators manage their respective EWS via SSL VPN. Data sharing between regional systems is facilitated through VPC Peering, which uses the internal network within the same cloud zone instead of the public internet, ensuring secure communication.
3.2. The System Architecture
EWS at a metropolitan scale consists of modules: the agrometeorological disaster database construction module, the municipality-scale EWS module, the individual EWS module, and the monitoring and control at the metropolitan-level module (Figure 5).
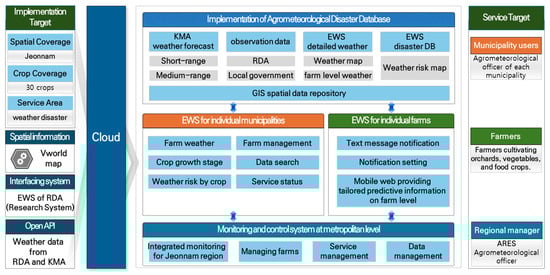
Figure 5.
The system architecture diagram.
The agrometeorological disaster database construction module utilizes forecasts from the NMA, weather observations installed within the region, and detailed weather maps provided by RDA’s EWS. It generates disaster distribution maps for EWS and compiles meteorological disaster information for each land plot which is then managed in a database. The municipality-scale EWS module provides functionalities to view farm weather, crop growth stages, and crop weather risks as distribution maps by the municipality. It also allows the retrieval of farm management and EWS data status for each municipality. The EWS for individuals retrieves unique information for each land plot from the database of meteorological disaster information and provides it through mobile web platforms, text notifications, and other means. The monitoring and control at the metropolitan-level module manages monitoring and operational data for municipalities and entire land plots within the region. Target users of the EWS at the metropolitan scale include agricultural meteorological officers of municipalities within the region, farmers, and agricultural technology institute personnel. They access and utilize respective modules based on their authorization levels. For the construction and service of the system, spatial information and open weather data are regularly integrated and utilized for building each module.
3.3. Metropolitan-Scale Monitoring Service
The monitoring feature of EWS at the metropolitan scale includes the real-time weather, distribution of weather-related disasters, enrollment status of farmers by municipality, statistics of cultivated crops in the fields of jurisdiction, and overall status of the representative farms. These monitoring services are available both at the metropolitan level and municipality level.
3.3.1. Real-Time Weather Information
Weather forecast data from the NMA for each district within the metropolitan is acquired through an open data portal. These data are stored in a database and utilized to provide local weather information at the district level within the municipality (Figure 6).
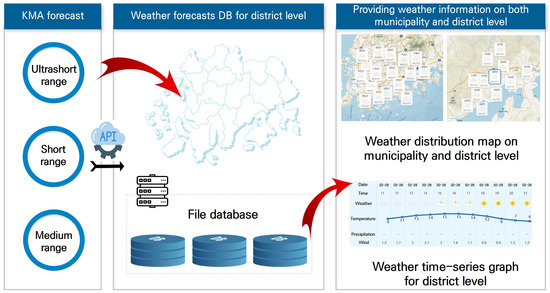
Figure 6.
Method of providing real-time weather information at a metropolitan level. The weather information for each municipality/district is displayed in a box on the map along with the region name.
3.3.2. Distribution of Agricultural Weather Disasters
The system retrieves farm-level detailed weather, crop growth stage, and disaster predictions generated for each individual municipality within the region in the form of distribution maps. To visualize the distribution map using color visualization, grid data pixel values are classified into a range from a minimum of 4 levels to a maximum of 20 levels based on types such as maximum temperature, minimum temperature, growth stage, and weather hazards. Each legend color is specified to generate tiled maps converted through the Map Server engine (version 7.6.4) and provided using the Web Map Service (WMS) method. In web browsers, the OpenLayers (version 4.1.1) library is utilized to effectively visualize the distribution map of the entire region through layer overlay (Figure 7).
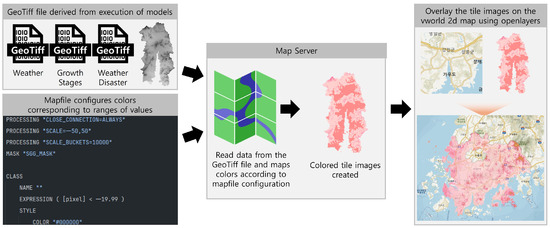
Figure 7.
Method of providing predictive information at metropolitan level. The colored tile image is overlayed on the base map with region names.
3.3.3. Monitoring at Metropolitan Level
For a metropolitan-level system, a situation room has been established to monitor and control agrometeorological status. It provides continuous real-time weather forecasts in large digital signage environments (Figure 8A). It also offers the status of the major seasonal agricultural weather disaster distribution (Figure 8B), service farms and crop status within the metropolitan area (Figure 8C), and disaster forecast for tomorrow of major monitoring farms (Figure 8D) [25].
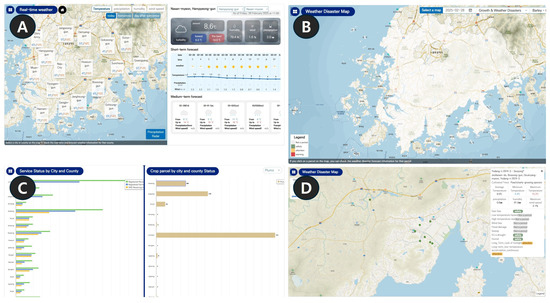
Figure 8.
Control screen of metropolitan-level system. (A) Real-time weather information, (B) Weather distribution map, (C) Farm statistics of each municipality, (D) Status of major monitoring farms.
3.4. Service for Individual Farm Households
3.4.1. Mobile Service
For EWS on the metropolitan level, individual farmers need to complete a registration process, including the verification of their mobile phone number for identity confirmation. Each farmer can register up to three farms, providing their addresses, cultivated crops, and varieties during the registration process. The entered addresses will be validated using the API provided by the Ministry of Land, Infrastructure, and Transport (MOLIT) to confirm their validity, and the cadastral unique number will be verified for registration. After the farms are registered, EWS data through weather and disaster prediction modules will accumulate for each individual farm. Farmers can access daily data on unique weather information, crop growth stages, and farm disaster risk levels for each registered farm via a mobile web interface [26]. Users can set notification preferences through the mobile app, and it allows receiving text notifications accordingly based on their chosen criteria (Figure 9).
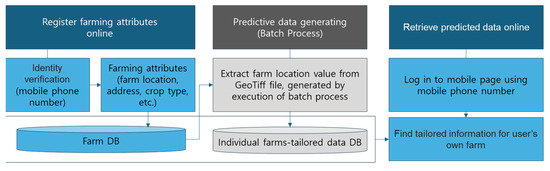
Figure 9.
Method and procedure for providing service for individual farmers.
3.4.2. Notification Service
The notification service is provided to each registered farm every Monday and Thursday at 8 a.m. In case of disaster risk, the risk within the next 3 days from the current day is predicted and classified into caution, alert, or warning levels, and the information will be sent via mobile text message through the Naver Cloud Notification service (Figure 10).
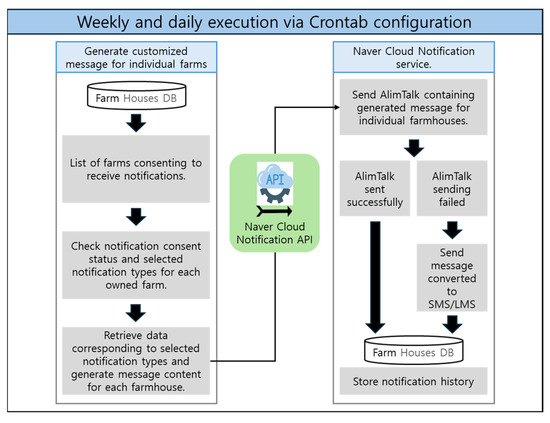
Figure 10.
Method and procedure of sending notifications to farmers.
3.5. Service for Metropolitan Administrators
3.5.1. Management of Farms and Farmhouses
Municipality and metropolitan administrators can manage individual farmhouses and farms eligible for EWS services. Administrators compile a list of farms on an Excel template with information that includes farm names, mobile phone numbers, farm addresses, crops being cultivated, variety, notification preference for text messages, and whether they are major monitoring farm-based. Once they attach the Excel file, the system validates the entries to bulk registered farm and farmhouse information (Figure 11).
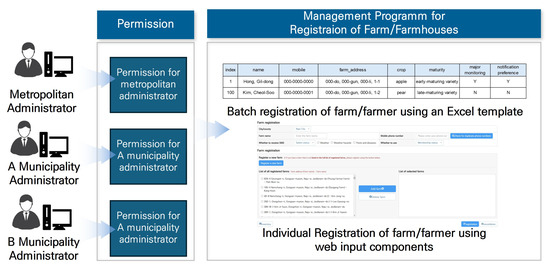
Figure 11.
Farm/farmhouse data input method of metropolitan and municipality officials.
3.5.2. Notification Dispatch History and Utilization Status of Farmers
Dispatch records for notifications are stored in the database. Detailed searches can be conducted for each dispatch, including the farmer’s municipality, dispatch date, receiving farm, and dispatched disaster elements. Information such as dispatch failures, sending status, and conversion to long messages can also be checked. To verify the farmers’ actual utilization of EWS services, access history is saved and analyzed each time they log into the mobile web. Searches based on the municipality where the farmers reside or the date of access can be used to review usage patterns on the mobile web (Figure 12).
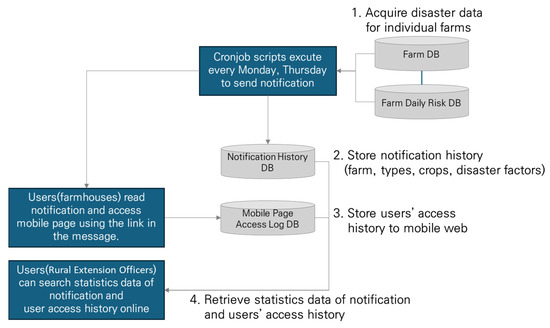
Figure 12.
Process of retrieving notification history and users’ access records.
3.5.3. EWS Data Statistics
Each farm’s basic information includes an address attribute that identifies the corresponding municipality and district. Based on this, combining the farm’s basic information with predictive data allows the aggregation of registered farm data by specific municipalities and districts. This enables the verification of weather disaster elements expected during a specific date range and the corresponding predictive statistical data by risk level.
4. Result
The first EWS at a metropolitan scale in Korea, operated by LGU, has been established in Jeonnam state. This system provides detailed weather information and predictive information on agrometeorological disasters at the district level for municipalities within Jeonnam jurisdiction.
The weather information in EWS provides real-time weather such as sky conditions, temperature, humidity, wind, and precipitation acquired from ultrashort-range forecasts. Additionally, hourly time-series graphs also present sky conditions, temperature, precipitation, humidity, and wind speed for the next 3 days, obtained from short-range forecasts. Medium-range forecast information is also presented, including sky conditions, temperature, and precipitation up to 9 days ahead (Figure 13).
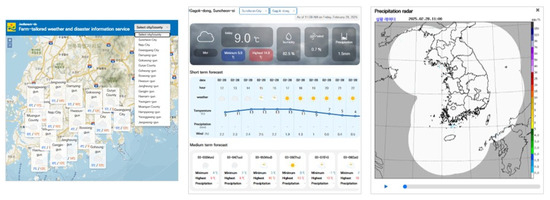
Figure 13.
Real-time weather information screen of EWS at metropolitan scale. Current weather information at district level in jurisdictions (left), time-series information for specific districts (middle), and real-time rainfall radar (right).
Users can find the weather information for all the districts in the form of a distribution map within a specific municipality which users choose among the municipalities. The weather information is simply visualized with an image presenting sky conditions, with the blue- and red-colored fonts indicating the daily minimum and maximum temperature of that district. Upon the users’ choice of a specific district with click actions on the map, the detailed information is designed to be presented on the right side of the map with its detailed real-time weather and time-series graph of short- and medium-range forecasts.
Agrometeorological disaster information integrates disaster data from municipalities, providing color-coded distribution maps of detailed farm weather, growth stages, and risk levels for each crop type. The type of distribution maps consist of a growth stage map, agrometeorological disaster map, and detailed farm weather map (Figure 14).
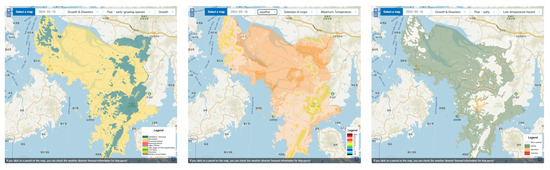
Figure 14.
Various types of distribution maps are provided in EWS. Users can select the map type to find information on the daily value of each weather factor and the risk of disasters. Growth stage map for pear (left), agrometeorological disaster (heat damage) risk map for pear (middle), and weather map (rainfall) (right).
When users select a growth stage map or an agrometeorological disaster map, they are required to choose a crop, as the growth stages and the agrometeorological disasters affecting crops vary by crop. Currently, EWS provides its services for 30 types of crops with a maximum of 11 types of disasters and plans to gradually expand its offerings (Table 2).
Table 2.
Target crops and meteorological disaster factors for metropolitan-level EWS.
It is easy for users to obtain information intuitionally on regions having high risk predicted with color-coded maps provided by EWS. Also, it provides detailed information on specific locations which can be selected by users by inputting addresses to find or just clicking the location on the map. EWS classifies the risk levels into four steps which are non-period, safe, caution, and warning. Each step is mapped to a corresponding color to be presented on the map and tables for effective visualizing of the risk information (Figure 15).
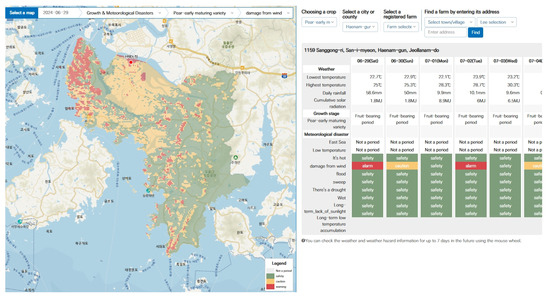
Figure 15.
Farm-specific information is on the right side of the screen. The tailored information on farm weather, growth stage of crops cultivated, and predicted risk of disasters is presented on the right side of the screen once users click on the map.
To provide customized information to farmers, EWS offers a mobile web service tailored for them. Individual farmers can access farm-specific weather information, growth stages, disaster information, and response guidelines through the mobile web. They can find farm-specific meteorological disaster information online on a daily basis, along with pre-disaster, post-disaster, and immediate response guidelines for each type of disaster. Also, notification messages are sent via mobile phone every Monday and Thursday at 8 AM, providing weather information including the maximum and minimum temperatures, precipitation, wind speed, and potential disaster risks for registered farms (Figure 16).
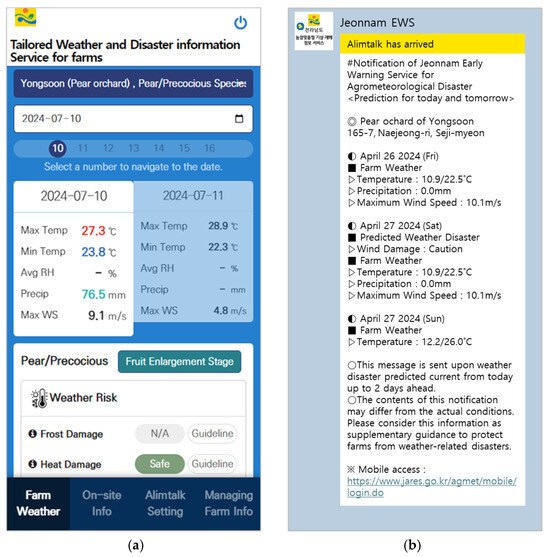
Figure 16.
(a) User interface of mobile EWS for farmers providing daily weather and risk prediction information. (b) Notification messages sent regularly and upon risk prediction to farmers containing weather forecasts and predicted disasters with corresponding response guidelines.
It is required for farmers to register their farms to obtain tailored information. Once they register the farm location and crops that are cultivated, customized predictive information for its location and crops are automatically produced and provided to farmers from the day after the registration. Farmers can obtain information about the methods they can apply to prevent predicted disasters accordingly. The guidelines to respond to disasters are arranged by crop type, growth stage, and response timing by RDA and managed in a database (Table 3).
Table 3.
Response guidelines provided to farmers (sweet potato).
User satisfaction was evaluated 6 months after the first EWS at a metropolitan scale in Korea started its services. The result says 48.5% of the respondents of farmers visited the EWS website daily, and 85.7% of the respondents of farmers visited the EWS website at least once a week. The satisfaction with helpfulness for farming activities was 4.18 points out of 5 points and the satisfaction with helpfulness for preventing crop disasters was 4.15 points out of 5 (Figure 17).
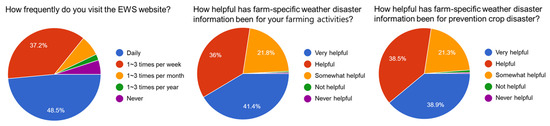
Figure 17.
Result chart of user satisfaction survey.
5. Discussion and Conclusions
This technical note examined the research system for the development and validation of core technologies for EWS in South Korea, and the detailed structure and service contents of a metropolitan-scale system that provides weather disaster forecasts and response guidelines to local farmers and advisors in each jurisdiction. EWS designed for managing weather risks in the agricultural sector integrates technologies from various fields. Implementing this system in the field requires appropriately scaled empirical studies. The current overseas EWSs have primarily concentrated on developing research-level systems that offer disaster warning services by applying partial technological elements to specific crops. EWS in South Korea has been developed to align with the characteristics of Korean agriculture, which involves cultivating a variety of crops on small-scale farms in complex terrains. By integrating advanced location-based agricultural, meteorological, and ICT technologies, the system automates and combines various technological elements, including the refinement of weather forecasts, prediction of growth stages by crop, establishment of disaster risk criteria and risk assessment by crop, formulation of pre-, immediate, and post-disaster response strategies, implementation of farming attributes database, customized disaster warning services by crop type, and on-site guidance systems. This approach has led to the development of validated technologies that can be effectively utilized by various users from individual farmers to regional advisory organizations. Utilizing the developed technologies, central and local government can participate in the operation to provide EWS services including detailed weather and disaster information tailored to the specific location and crop characteristics of individual farms, along with response guidelines to local farmers. Additionally, local conditions can be monitored and managed at the municipal level. EWS in South Korea represents the first attempt to transition such technologies into practical services, aiming to expand disseminating agricultural decision-support services through weather disaster prediction to farms nationwide and establish an agricultural on-site guidance system. In the future, integrating regional systems at a metropolitan scale under central government management will enable the completion of a nationwide integrated EWS service operation system. By recognizing EWS as a foundation for climate change adaptation in the agricultural sector and by continuously improving and disseminating it, national support for climate-smart agriculture can be effectively realized. This approach is expected to maximize the reduction in disaster-related costs originally anticipated from the service.
Author Contributions
Conceptualization, Y.-S.S. and Y.-K.H.; methodology, Y.-S.S. and K.-M.S.; software, Y.-S.S., H.-A.L., S.-H.P. and S.-J.H.; validation, Y.-S.S.; formal analysis, H.-A.L., S.-H.P., K.-M.S. and S.-J.H.; investigation, Y.-S.S., H.-A.L., S.-H.P., Y.-K.H. and S.-J.H.; resources, Y.-S.S., H.-A.L., S.-H.P., Y.-K.H. and S.-J.H.; data curation, H.-A.L.; writing—original draft preparation, Y.-S.S., H.-A.L., S.-H.P., Y.-K.H. and S.-J.H.; writing—review and editing, Y.-S.S., K.-M.S. and S.-J.H.; visualization, Y.-S.S., H.-A.L. and S.-J.H.; supervision, Y.-K.H. and K.-M.S.; project administration, Y.-S.S.; funding acquisition, Y.-K.H. All authors have read and agreed to the published version of the manuscript.
Funding
This study was funded by the Rural Development Administration (RS-2024-00334511) in the Republic of Korea.
Institutional Review Board Statement
Not applicable.
Informed Consent Statement
Not applicable.
Data Availability Statement
The EWS at a metropolitan scale, described in this technical note, is available online: https://jares.go.kr/agmet (accessed on 9 July 2024).
Acknowledgments
The authors thank the collaborating research team for their intellectual contributions.
Conflicts of Interest
Y.-S.S., H.-A.L., S.-H.P., Y.-K.H. and S.-J.H. are empolyees of EPINET Co., Ltd. The paper reflects the view of the scientists and not the company.
References
- Ebnehejazi, S.M.; Yazdanpanah, H. Early Warning of Late Spring Frost in Apple Orchards of Northwest of Iran. Theor. Appl. Climatol. 2024, 155, 6461–6471. [Google Scholar] [CrossRef]
- Li, S.; Fang, W.; Liu, T.; Ma, Z.; Noor, M.A.; Liang, L.; Ma, W.; Xue, C. Meteorological Pre-warning Grade of High Temperature During Flowering Stage for Summer Maize in North China Plain. Int. J. Plant Prod. 2023, 17, 193–203. [Google Scholar] [CrossRef]
- Yoshida, R.; Fukui, S.; Yamazaki, T. Applicability of meteorological ensemble forecasting to predict summer cold damage in rice growth. J. Agric. Meteorol. 2020, 76, 128–139. [Google Scholar] [CrossRef]
- Technological Support for Preventing Agricultural Damage: Crop Disaster Early Warning System. Available online: https://akmp.cpc.org.tw/en/post/contents/1784 (accessed on 9 July 2024).
- Yao, M.-H.; Hsu, Y.-H.; Li, T.-Y.; Chen, Y.-M.; Lu, C.-T.; Chen, C.-L.; Shih, P.-Y. Agricultural Disaster Prevention System: Insights from Taiwan’s Adaptation Strategies. Atmosphere 2024, 15, 526. [Google Scholar] [CrossRef]
- Elsayed, A.; Moawad, N. Framework for Intelligent Early Warning Systems of Crop Diseases. Int. J. Adv. Trends Comput. Sci. Eng. 2022, 11, 191–195. [Google Scholar] [CrossRef]
- Early Warnings for All. Available online: https://earlywarningsforall.org/site/early-warnings-all (accessed on 28 November 2024).
- CREWS Climate Risk and Early Warning Systems. Available online: https://crews-initiative.org/ (accessed on 28 November 2024).
- FAO. The Impact of Disasters on Agriculture and Food Security 2023; FAO: Rome, Italy, 2023; pp. 11–16. [Google Scholar]
- Yun, J.I. Agrometeorological Early Warning System: A Service Infrastructure for Climate-Smart Agriculture. Korean J. Agric. For. Meteorol. 2014, 16, 403–417. [Google Scholar] [CrossRef]
- Shin, Y.S.; Park, J.H.; Kim, S.K.; Kang, W.S.; Shim, K.M.; Park, E.W. An Operational Site-specific Early Warning of Weather Hazards for Farmers and Extension Workers in a Mountainous Watershed. Korean J. Agric. For. Meteorol. 2015, 17, 290–305. [Google Scholar] [CrossRef]
- Shin, Y.S.; Park, J.H.; Kim, S.K.; Han, Y.K.; Park, S.H.; Shim, K.M.; Kim, H.J.; Kim, S.O.; Kim, D.J. Design of the Agro-meteorological Early-warning System on Metropolitan-scale. In Proceedings of the Korean Society of Agricultural and Forest Meteorology Conference; Korean Society of Agricultural and Forest Meteorology: Seoul, Republic of Korea, 2019; pp. 307–308. [Google Scholar]
- Kelman, I.; Glantz, M.H. Early Warning Systems Defined. In Reducing Disaster: Early Warning Systems For Climate Change; Singh, A., Zommers, Z., Eds.; Springer: Dordrecht, The Netherlands, 2014. [Google Scholar] [CrossRef]
- Jeon, W.; Heo, D.; Hwang, S. Priority Data Handling in Pipeline-based Workflow. KIISE Trans. Comput. Practices. Korean Inst. Inf. Sci. Eng. 2017, 23, 691–697. [Google Scholar] [CrossRef]
- Kim, D.J.; Yun, J.I. Improving Usage of the Korea Meteorological Administration’s Digital Forecasts in Agriculture: 2. Refining the Distribution of Precipitation Amount. Korean J. Agric. For. Meteorol. 2013, 15, 171–177. [Google Scholar] [CrossRef]
- Kim, S.O.; Yun, J.I. Distribution of Midday Air Temperature and the Solar Irradiance Over Sloping Surfaces under Cloudless Condition. Korean J. Agric. For. Meteorol. 2013, 15, 291–297. [Google Scholar] [CrossRef]
- Kim, S.O.; Yun, J.I. Improving the Usage of the Korea Meteorological Administration’s Digital Forecasts in Agriculture: IV. Estimation of Daily Sunshine Duration and Solar Radiation Based on “Sky Condition” Product. Korean J. Agric. For. Meteorol. 2015, 17, 281–289. [Google Scholar] [CrossRef]
- Kim, S.O.; Yun, J.I. Feasibility of the Lapse Rate Prediction at an Hourly Time Interval. Korean J. Agric. For. Meteorol. 2016, 18, 55–63. [Google Scholar] [CrossRef]
- Kim, S.; Hwang, K.H.; Hong, K.Y.; Seo, H.C.; Bang, H.N. An Analysis of Water Vapor Pressure to Simulate the Relative Humidity in Rural and Mountainous Regions. Korean J. Agric. For. Meteorol. 2020, 22, 299–311. [Google Scholar] [CrossRef]
- Yun, E.; Kim, S. Estimation of hourly daytime air temperature on slope in complex terrain corrected by hourly solar radiation. Korean J. Agric. For. Meteorol. 2018, 20, 376–385. [Google Scholar] [CrossRef]
- Kim, S.H.; Yun, J.I. Downscaling of Sunshine Duration for a Complex Terrain Based on the Shaded Relief Image and the Sky Condition. Korean J. Agric. For. Meteorol. 2016, 18, 233–241. [Google Scholar] [CrossRef]
- Kim, S.O.; Yun, J.I. Improving the Usage of the Korea Meteorological Administration’s Digital Forecasts in Agriculture: V. Field Validation of the Sky-condition based Lapse Rate Estimation Scheme. Korean J. Agric. For. Meteorol. 2016, 18, 135–142. [Google Scholar] [CrossRef]
- Yun, E.; Kim, S. Improving Usage of the Korea Meteorological Administration’s Digital Forecasts in Agriculture: Correction Method for Daytime Hourly Air Temperature over Complex Terrain. Korean J. Agric. For. Meteorol. 2019, 21, 221–228. [Google Scholar] [CrossRef]
- Park, J.H.; Shin, Y.S.; Kim, S.K.; Kang, W.S.; Han, Y.K.; Kim, J.H.; Park, E.W. Speed-up Techniques for High-Resolution Grid Data Processing in the Early Warning System for Agrometeorological Disaster. Korean J. Agric. For. Meteorol. 2017, 19, 153–163. [Google Scholar] [CrossRef]
- EWS Dashboard for Monitoring for Metropolitan. Available online: https://www.jares.go.kr/agmet/dashboard/dashboard.do (accessed on 9 July 2024).
- A Mobile Page for EWS Information Tailored to Individual Farms. Available online: https://m.agmet.kr (accessed on 9 July 2024).
Disclaimer/Publisher’s Note: The statements, opinions and data contained in all publications are solely those of the individual author(s) and contributor(s) and not of MDPI and/or the editor(s). MDPI and/or the editor(s) disclaim responsibility for any injury to people or property resulting from any ideas, methods, instructions or products referred to in the content. |
© 2025 by the authors. Licensee MDPI, Basel, Switzerland. This article is an open access article distributed under the terms and conditions of the Creative Commons Attribution (CC BY) license (https://creativecommons.org/licenses/by/4.0/).