Article

Ambient Particulate Air Pollution and Daily Hospital Admissions in 31 Cities in Poland

by
Łukasz Adamkiewicz
1,*,
Katarzyna Maciejewska
2,
Daniel Rabczenko
3 and
Anetta Drzeniecka-Osiadacz
4
1
European Clean Air Centre, 31-104 Cracow, Poland
2
Faculty of Building Services, Hydro and Environmental Engineering, Warsaw University of Technology, 00-653 Warsaw, Poland
3
National Institute of Public Health-National Institute of Hygiene, 00-791 Warsaw, Poland
4
Department of Climatology and Atmosphere Protection, Institute of Geography and Regional Development, University of Wrocław, 51-621 Wrocław, Poland
*
Author to whom correspondence should be addressed.
Atmosphere 2022, 13(2), 345; https://doi.org/10.3390/atmos13020345
Submission received: 7 January 2022 / Revised: 3 February 2022 / Accepted: 15 February 2022 / Published: 18 February 2022
(This article belongs to the Special Issue Air Pollution, Air Quality and Human Health)

Abstract

:
A strong and consistent association has been observed between morbidity or mortality rates and PM concentration, and is well documented in many countries. In Poland, despite poor air quality, studies concerning the evaluation of acute health effects of ambient air pollution on morbidity from respiratory or cardiovascular diseases are rare. We examined the short-term impact of PMx concentration on hospital admission in 31 Polish cities based on the daily PM10, PM2.5 concentration, meteorological variables, and hospital data. The generalized additive model (GAM) and a random-effects meta-analysis were used to assess the impact of air pollution on morbidity within the exposed population. Almost 1.6 million cardiovascular admissions and 600 thousand respiratory disorders were analyzed. The RR values for PM10-related cardiovascular and respiratory hospital admissions in Poland are equal to 1.0077 (95% confidence interval, 1.0062 to 1.0092) and 1.0218 (95% confidence interval, 1.0182 to 1.0253), respectively, while for PM2.5 1.0088 (95% confidence interval, 1.0072 to 1.0103) and 1.0289 (95% confidence interval, 1.0244 to 1.0335), respectively. Moreover, a moderate heterogeneity of RR estimates was observed between the analyzed cities (I2 values from 27% to 45%). The presented analysis confirms the significant association between hospital admission and PMx concentration, especially during heating seasons.

1. Introduction

Associations between ambient air pollution and adverse health effects are well documented, with both long-term [1,2,3] and short-term health impacts [4,5,6]. Studies concerning exposure influence focus on outdoor air pollutants such as particulate matter (PM) [1,2,3,4,5,6], ozone (O3) [7,8,9] and nitrogen dioxide (NO2) [10,11]. The health effects of air pollution include cardiovascular diseases and symptoms [6,9,12,13], and respiratory problems [9,13,14], as well as premature mortality [1,2,3,5,7,9,10,11,12]. Each of these health effects can be represented by a need for hospitalization, and many studies have examined the relationship between short-term changes in air pollution and the hospital admission rates in the exposed population [4,6,12,15]. Such studies consider either a single pollutant [10] or investigate a multi-pollution model [10,11]. The short-term perspective allows for an investigation of effects of severe air pollution episodes, whereas the long-term approach can reveal the impacts related to the different aerosanitary conditions in various living areas. The choice of timespan, type of pollutant and single- or multi-pollution model depends on many parameters, e.g., studies can focus on pollutants whose concentrations exceed air quality standards. In a given area, most air pollutants can be associated with their characteristic, predominant emission sources. In Europe PMs typically originate from solid fuel combustion (primarily in the household sector), while nitrogen dioxide mainly comes from road transport [16].
In Poland, poor air quality (AQ) is mainly associated with high concentrations of particulate matter (PM) during the winter season. For many years, exceedances of the EU limit values for daily PM10 concentrations, as well as annual mean levels of PM2.5, have been reported. For these reasons, Poland is placed among the regions with the poorest air quality in the European Union [16]. Details on the general AQ in Poland, according to the latest available data, are presented in Table 1.
In Poland, the levels of both monitored fractions of PM frequently exceed the standards, but PM2.5 seems to be more problematic, as its annual mean concentrations were higher than 20 µg/m3 in 40% of all stations. Numerous days with high levels of PM10, occurring mainly in the heating season, result in exceedances of the 24-h standard in 31% of monitoring stations, even though the annual limit value is usually below 40 µg/m3 (only 3% of stations noted exceedances of this standard in 2019).
The short-term impacts of air pollution on human health are usually investigated by means of “time-series analysis” [4,5,6]. This group of methods requires a sequence of datapoints with regular time intervals, which, in an analysis of particulate matter health impacts, usually refers to one day (24 h) [18]. The outcome (dependent variable) of the analysis is a count of cases (patients) with certain health effects (e.g., urgent need of hospitalization) on a given day. The dynamics of the population size are not considered in this type of study, since this is approximately constant in one-day intervals. For the same reason, other confounders, such as age, sex, body mass index, smoking, allergies, socio-economy status, physical activity, etc., are not taken into account. On the other hand, certain independent variables with a typical day-to-day variability are commonly investigated in time-series studies, and these include [4,5,6]: meteorological parameters, air pollution concentrations, indicators of the day of the week, indicators of the months (including indicators of holiday periods). Another aspect that is considered in short-term air-pollution health-impact studies is the delay in the health effect. This means that the health response to the exposure to air pollution is not necessarily instant: it can be revealed on a subsequent day or days in a smog episode. This type of determinant in the time-series analysis is called a “lag”. The result of the time-series regression is commonly presented as “relative risk” (RR), which shows the risk (ratio) of health effects due to an increase in air-pollution concentration of (usually) 10 µg/m3 per day. If the relative (ratio) risk is higher than 1, this means that the increase in the concentration of a given pollutant (e.g., PM10) is associated with an increased number of health outcomes (e.g., cardiovascular hospitalizations) within the studied population.
The aim of this study was to determine the impact of PM10 and PM2.5 24h mean concentrations on the daily hospitalization count due to cardiovascular and respiratory symptoms in the biggest Polish cities.

2. Material and Methods
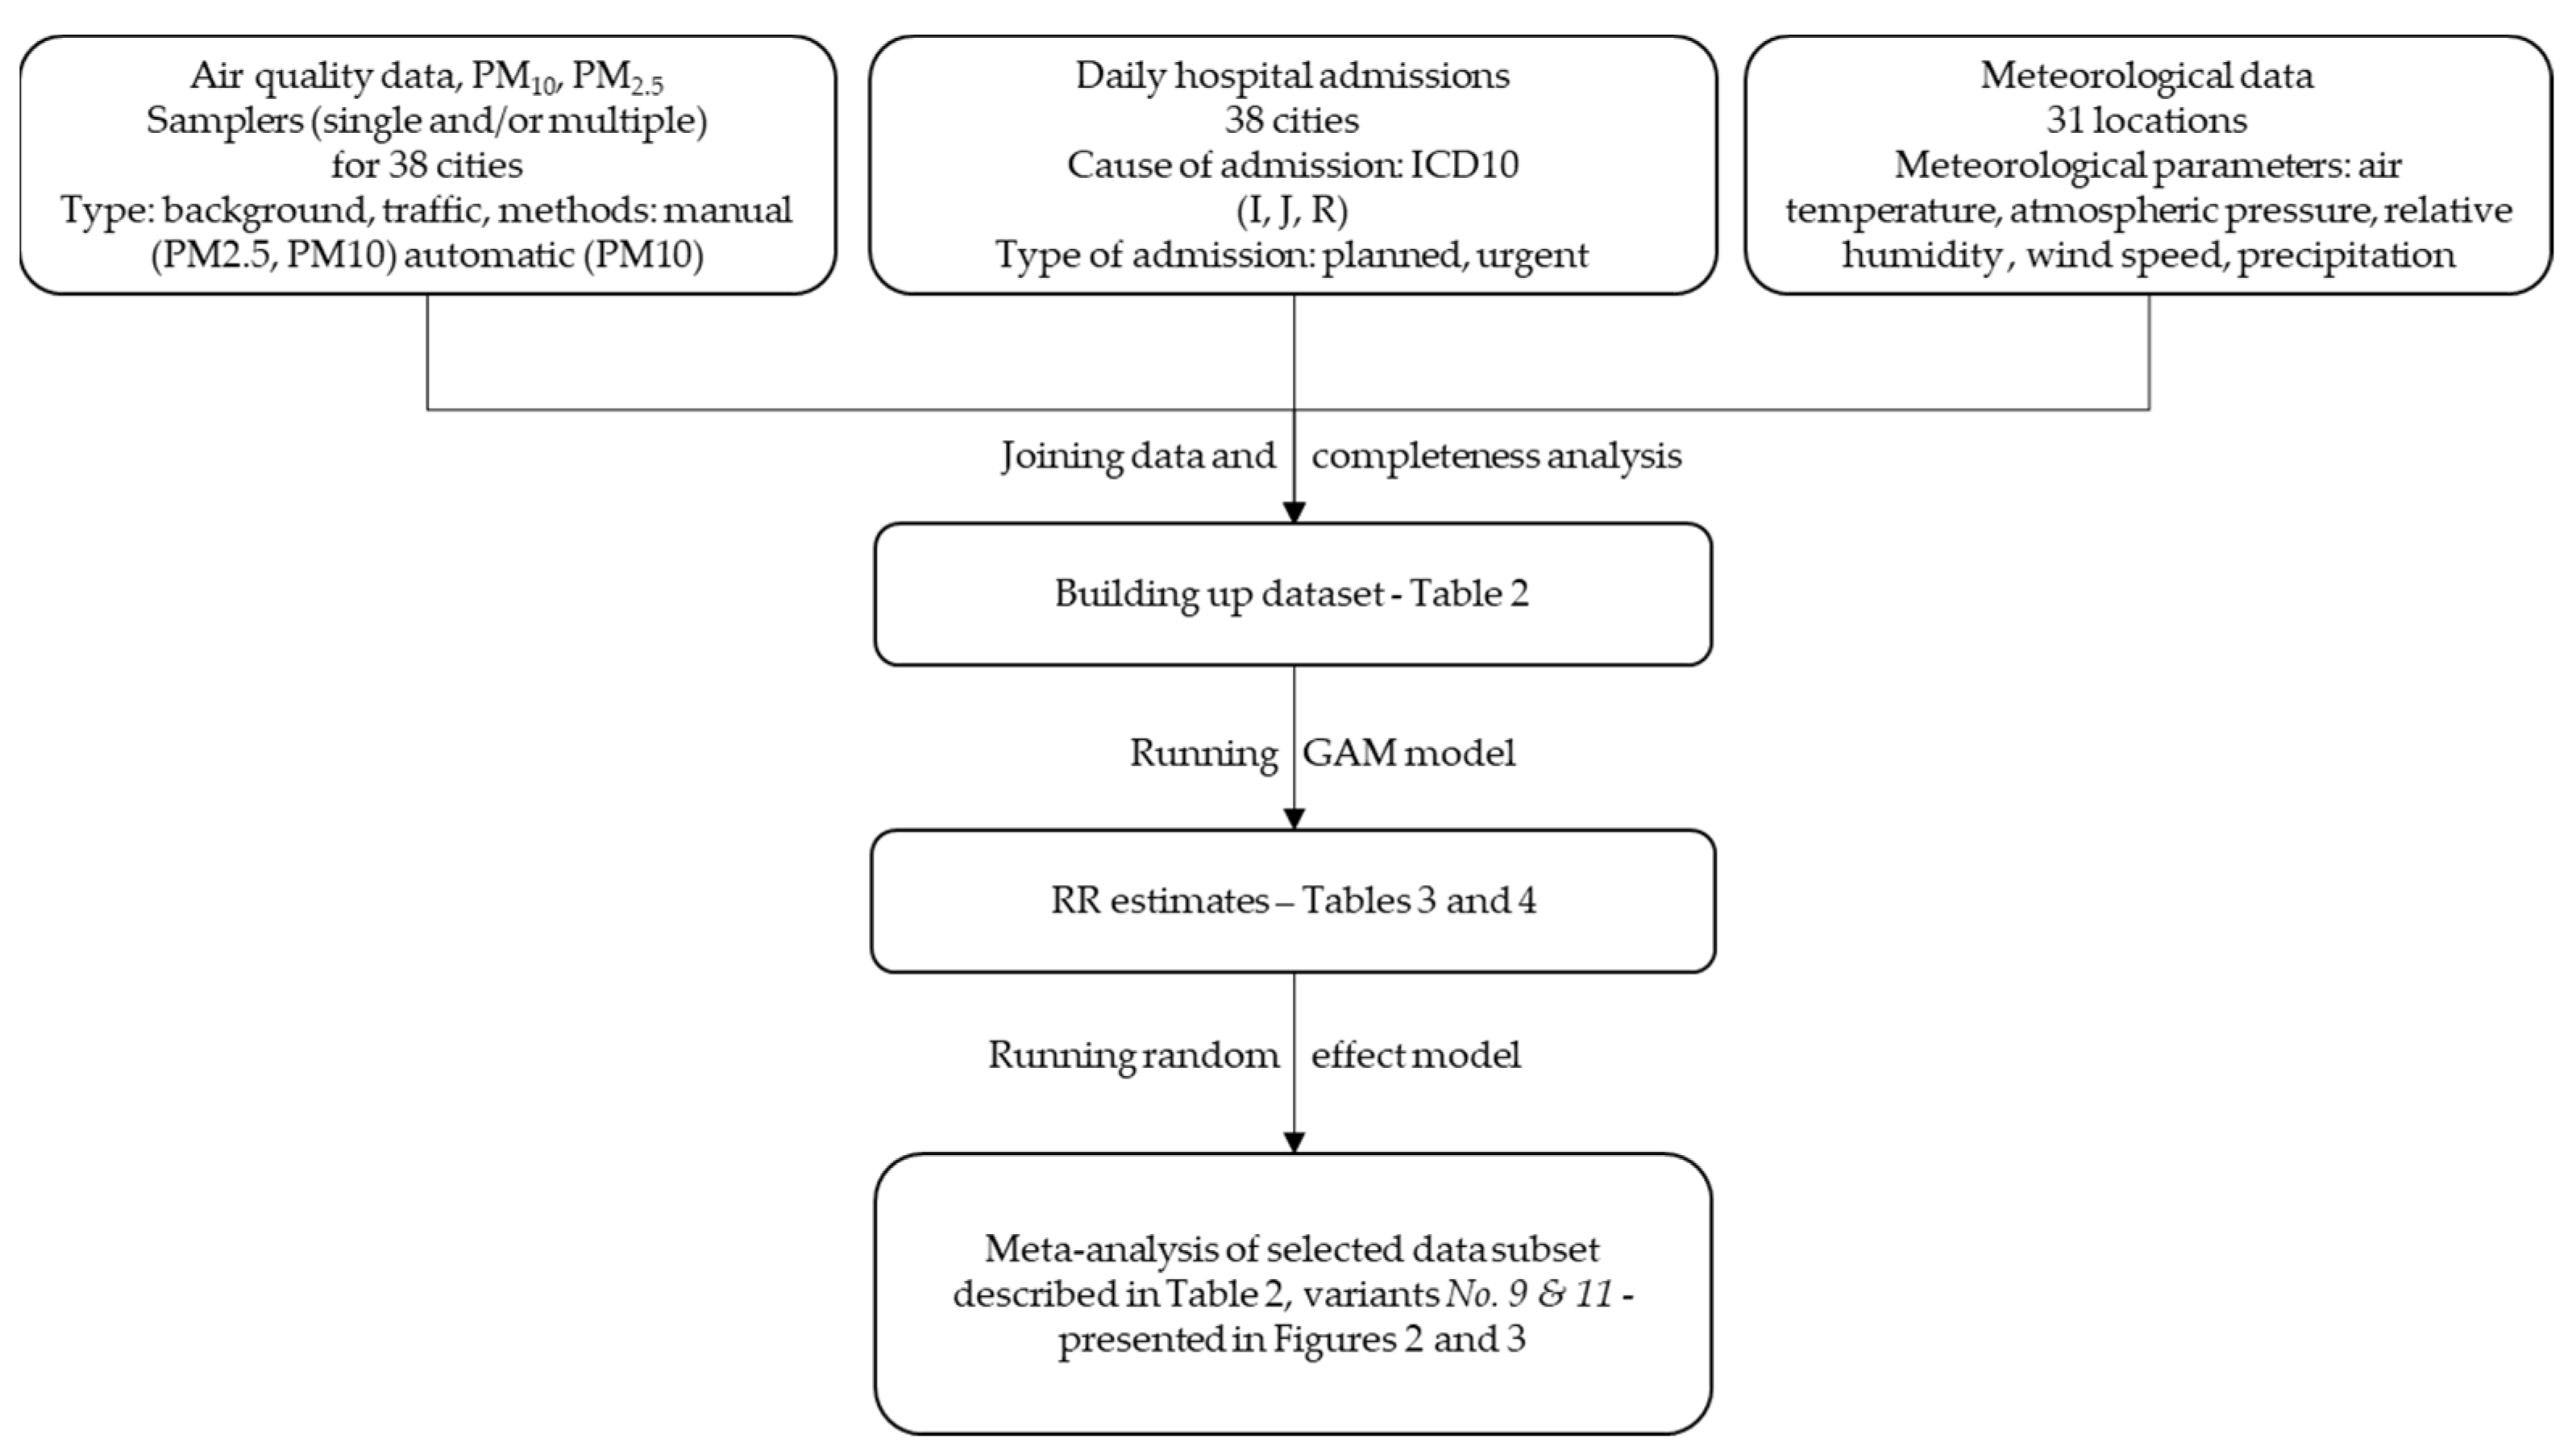
2.1. Dataset

All analyses were performed on environmental, meteorological, and public health data obtained from several Polish national institutes. The timespan of the research covered seven years, from 2011 to 2017, and the time resolution of the dataset was 24 h. The criteria for choosing locations were based on the completeness of concentration measurements, hospitalization data, and meteorological parameters. A complete dataset including all necessary information was available for 31 Polish cities.
Air quality data were downloaded from the website of the Polish Chief Inspectorate of Environmental Protection [17] and included daily concentrations of PM2.5 and PM10 measured at the urban background, traffic, and industrial monitoring stations by both manual (PM2.5 and PM10) and automatic (only PM10) samplers. Several calculation variants were performed (see Section 2.3), which included different subsets of air quality data (only background stations, only manual stations, etc.).
Meteorological data were downloaded from the website of the Polish National Institute of Meteorology and Water Management [19] and included daily mean air temperature (T), atmospheric pressure (P), relative humidity (RH), and wind speed (WS), as well as the daily sum of precipitation (R). The number of meteorological stations is limited., and not all the analyzed 31 cities have a station situated within their boundaries. In these cases, meteorological data from the nearest station were used.
Public health data included daily hospital admissions due to cardiovascular (CV) and respiratory (RS) symptoms and diseases (ICD-10 codes I00-I99, J00-J99, R00-R09, [20]) and were obtained thanks to the courtesy of the Polish National Health Fund. All hospitals located in the cities chosen for analysis were taken into account, and the total number of raw data records was almost 3.8 million in the 2011–2017 period. For the purposes of this research, planned admissions were excluded from analysis; hence, only sudden or emergency admissions were taken into consideration.

2.2. Statistical Model

To investigate the city-specific associations of PM concentrations and meteorological conditions with public health outcomes (hospital admissions due to cardiovascular and respiratory disorders), time-series analyses were performed for each city. For this purpose, the generalized additive model (GAM) was used [21]. GAM is a Poisson regression model that allows for an estimation of the relative risk of selected health outcomes associated with ambient PM levels. For each city, explanatory variables included smooth functions of day-of-year to adjust to seasonal and long-term variability and meteorological variables to reduce the confounding effect of weather conditions, as well as the linear term of PM2.5 or PM10 concentrations. Lag 0 day, lag 1 day, and lag 5 day, as well as moving averages of 2- and 6-day PM concentrations, were tested in various calculation variants (see Section 2.3).
In the second stage of analysis, random-effect models were used to calculate pooled effects across the analyzed cities. City-specific and national average effects were estimated with 95% confidence intervals.
All calculations were performed with R software version 3.6.2, using mgcv and rmeta packages for main models fitting and meta-analysis, respectively. We performed the calculations according to the flowchart presented in Figure 1.

2.3. Calculation Variants

One of the aims of this study was to test the sensitivity of GAM model to minor changes in the input dataset, e.g., establishing whether the initial objectives of the choosing PM concentration from only manual stations versus data from both manual and automatic samplers have any significant impact on the final results of the analysis. Moreover, we decided to apply the GAM formulation protocols of two large multi-city time-series studies: Air Pollution and Health: A European Approach (APHEA) [22,23] and The National Morbidity, Mortality, and Air Pollution Study (NMMAPS) [24], and to compare the results of these two approaches. In total, nine calculation variants for PM10 and three variants for PM2.5 were tested (Table 2).
Within the APHEA protocol, we considered: (a) air quality data from all types of stations (urban background, traffic, and industrial) vs. urban background only; (b) air quality data measured by only manual samplers vs. both manual and automatic ones; (c) hospital admissions due to any type of cardiovascular or respiratory disorders vs. only selected symptoms and diseases; (d) patients of all ages together vs. patients divided into three age groups. Following the APHEA methodology, confounding meteorological variables included air temperature, relative humidity, air pressure, wind speed, and precipitation. In this approach, model fitting was always performed with the use of penalized cubic splines, and the number of knots was dependent on the number of degrees of freedom, which were calculated separately for each model by minimizing the partial autocorrelation function (PACF). We tested the models for different time lags: 0 day lag, meaning that the number of hospital admissions on a given day is related to air quality on that day; 1 day and 5 day lags, meaning that health effects occur one or five days after exposure; 0–1 day and 0–5 day lags, meaning that the health outcomes are dependent on the two- or six-day moving averages of PM concentrations, respectively.
Within the NMMAPS approach, we only used PM data from urban background stations, which were measured manually. Hospital admissions included all types of cardiovascular or respiratory disorders for all age groups, while meteorological confounders were limited to air temperature and relative humidity. Model fitting was based either on penalized cubic splines or natural splines, with a fixed number of degrees of freedom applied in each case, following previous studies performed with NMMAPS protocol [15]. Only a lag of 0–1 days (2-day moving average of PM concentrations) was used in this case. The details of all calculation variants are presented in Table 2.

3. Results

3.1. Meteorological Conditions and Air Quality in 31 Analyzed Cities in 2011–2017

Poland has a temperate climate, which is transitional between maritime and continental types. The landforms are diverse, with lowlands in the north and mountains in the south. Therefore, weather conditions are variable throughout the country. As only air temperature and relative humidity (RH) were included in the final version of calculations, the description of meteorological conditions within the study are limited to these two variables.
During the study period, the average air temperature reached 9.3 °C across all 31 cities. The lowest annual mean value in the analyzed areas was observed in 2013 (8.7 °C) and the highest in 2015 (10.0 °C). In the non-heating season (April to September), average temperature reached 15.5 °C (from the minimum of 15.1 °C to the maximum of 15.8 °C in particular years of the study period), while in the heating season (January–March and October–December), the mean value was 3.1 °C (from the minimum of 1.8 °C to the maximum of 4.3 °C). The highest daily mean temperature in the analyzed cities reached 29.8 °C, while the lowest was −23.9 °C.
Mean RH observed in the 2011–2017 period was 77.8%, with the lowest value in 2015 (73.8%) and the highest in 2013 (79.5%). Heating seasons were characterized by more humid air—83.3% (from a minimum of 80.8% to maximum of 84.5% in particular years of the study period), while RH in non-heating seasons reached 72.3% (from a minimum of 66.9% to a maximum of 74.6%). The lowest daily mean RH was 27.3% and the highest was 100%.
Particulate matter concentrations, due to emission rate, meteorological and landform characteristics, were also highly variable throughout the country. The seven-year (2011–2017) PM10 average ranged across all analyzed cities from 21.8 µg/m3 to 46.2 µg/m3, with a mean value of 32.0 µg/m3, and for PM2.5 the mean of all cities was 23.1 µg/m3, ranging from 13.0 µg/m3 to 34.4 µg/m3 in individual locations. The mean PM2.5 to PM10 ratio varied across the cities, from 0.59 to 0.84, with an average value of 0.72. There were also significant differences in these ratios between heating (0.60–0.96, with an average value of 0.77) and non-heating seasons (0.51–0.72, with an average value of 0.63).

3.2. Urgent Hospital Admissions Due to Cardiovascular and Respiratory Disorders

Within the study period, the sum of all urgent cardiovascular admissions in 31 cities reached almost 1.6 million, while due to respiratory disorders reached almost 600 thousand. On a yearly basis, the average annual numbers of CV and RS admissions equaled around 260 thousand and 85 thousand, respectively.
On average, cardiovascular disorders led to 0.68 daily hospitalizations per 10,000 inhabitants, with the lowest rate in Bialystok (0.42) and the highest in Lublin (0.92). Heating seasons were characterized by higher daily numbers of hospital admissions: 0.70 per 10,000 inhabitants (from 0.42 in Bialystok to 0.96 in Lublin). In the non-heating seasons, this rate dropped to 0.66 (from 0.41 in Bialystok to 0.89 in Lublin) (Table 3).
The average daily number of respiratory patients hospitalized from 2011 to 2017 equaled 0.25 per 10,000 inhabitants. The lowest rate (0.13) was observed in Sosnowiec, Tychy, and Zabrze, while the highest (0.41) was observed in Kielce. In the heating season, a daily number of RS hospitalizations was equal, on average, to 0.28 per 10,000 inhabitants (from 0.14 in Sosnowiec, Tychy, and Zabrze to 0.47 in Opole). In the non-heating season, this value was 0.22 (from 0.11 in Sosnowiec, Tychy, and Zabrze to 0.38 in Kielce) (Table 3). The obtained rates were around three times lower than the numbers reported for the United States [13]; however, in that study, all types of admissions were included, while the present study only considered urgent (not planned) hospitalizations. As indicated by the report of the National Institute of Public Health [25], in 2016, daily rates of all types of hospitalization per 10,000 inhabitants of the urban population of Poland equaled 0.85 and 0.41 for CV and RS disorders, respectively.
Statistically significant differences in the hospitalization rates between heating and non-heating seasons confirmed the influence of ambient conditions on the emergence of acute cardiovascular and respiratory symptoms. These were severe enough to require hospitalization. However, such a simple analysis does not discern the impacts of weather conditions due to exposure to air pollutants. The GAM procedure, when simultaneously applied to the time series of ambient PM concentrations and meteorological variables, allows an assessment of health risk related primarily to air pollution, with a control for weather confounders. The results of such calculations are presented in further chapters.

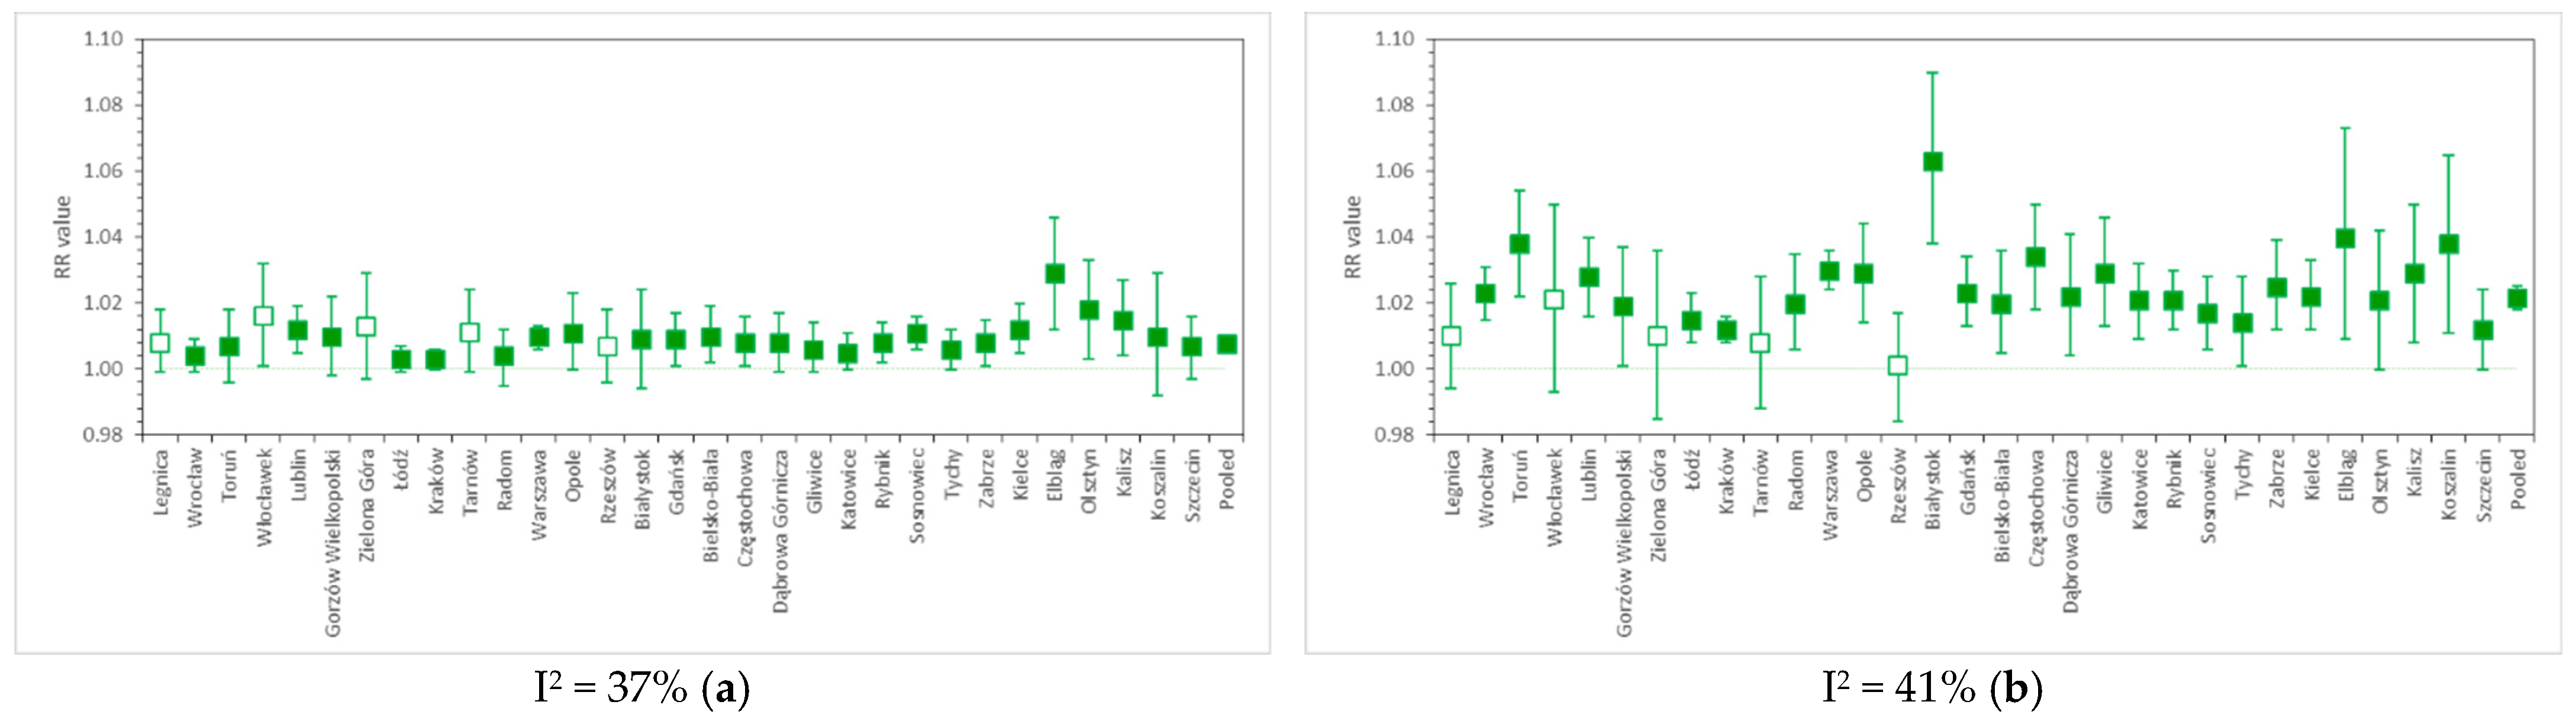
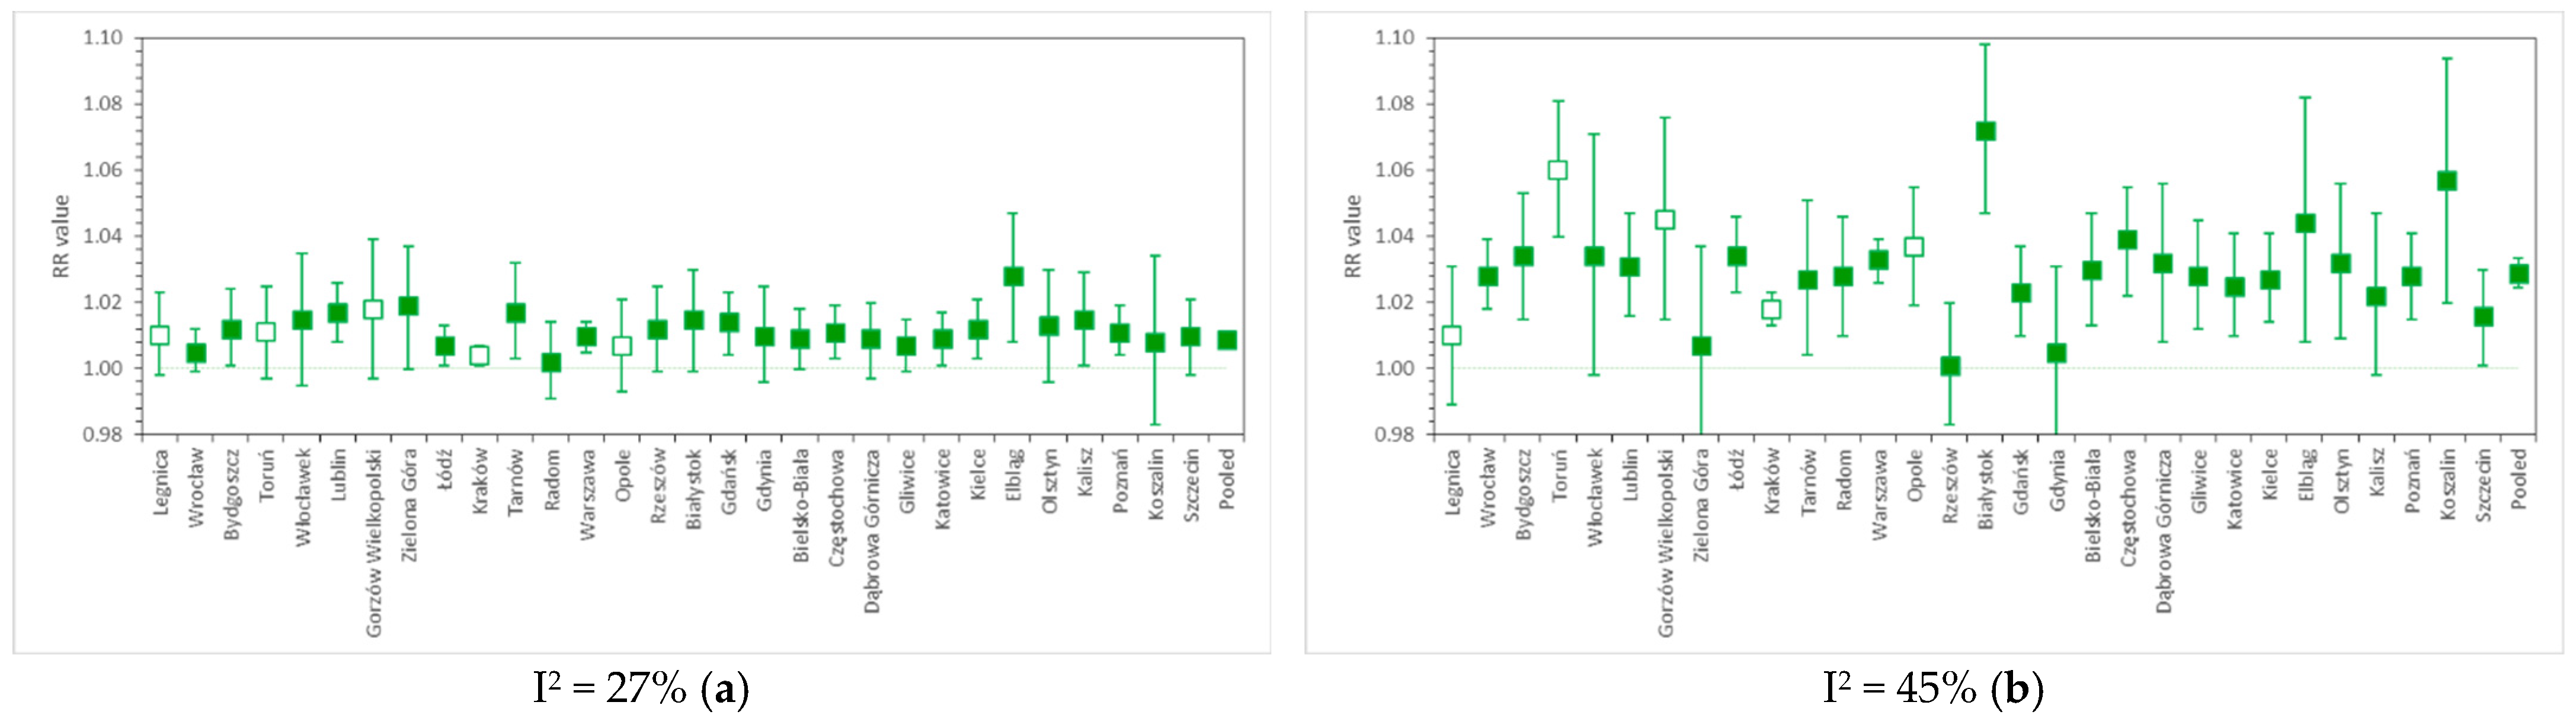
3.3. Pooled RR Results in Various Calculation Variants

Table 4 and Table 5 present RR results (with 95% C.I.) for cardiovascular and respiratory hospital admissions, respectively, pooled across 31 cities, obtained for all calculation variants for all analyzed time lags. Regarding PM10 effect on CV disorders, calculations within the APHEA protocol (1st–7th variants) resulted in an RR of approximately 1.006 for a 0-day lag. This health effect seems to be the strongest on the same day and to decrease on the following days; for lags of 1 and 5 days, as well as 0–1 and 0–5 days, the value of RR drops to around 1.001–1.003, remaining statistically significant. In variants 1−7, the pooled RRs for RS admissions due to PM10 exposure is slightly higher than that for CV causes, and reaches approximately 1.008 with a 0-day lag, decreasing to 1.004−1.005 with a 5-day lag. Using a 3- or 6-day PM moving average (lags 0–1 and 0–5 days) results in even weaker effects, at the level of around 1.002−1.004, which are still statistically significant.
The short-term effects of PM2.5 analyzed within APHEA protocol (8th variant) results in RRs of 1.005 and 1.007 with a lag of 0 for CV and RS hospital admissions, respectively.
Variants 9–12 present the results obtained following the NMMAPS protocol. For the PM10 effect on CV hospitalizations, the RR reaches 1.0077 and 1.0078 in variants 9 and 10, respectively (Table 4), while for RS admissions, the RR reached 1.0218 and 1.0202, respectively (Table 5). In the case of PM2.5, the RR for cardiovascular diseases is 1.0088 and 1.0087 in variants 11 and 12, respectively, and for respiratory symptoms it is 1.0289 and 1.0263, respectively.

4. Discussion

4.1. Influence of Input Data Modifications on the Results of Different Calculation Variants in Both Protocols

As seen in Table 4 and Table 5, the modifications applied to calculation variants within the APHEA project methodology did not result in large differences between the estimated RR values. In particular, comparable RR values for the health effects of PM2.5 and PM10 could be surprising; however, this is typical for Poland. The PM2.5 to PM10 ratio is quite high (0.72 on average), and rises during winter seasons when concentrations of PMx are high due to the combustion of solid fuels in the household sector and mean PM2.5/PM10 ratio reaches 0.77 in the study period. Therefore, the observed health effects of PM10 are, to a large extent, caused by PM2.5, which is a dominant part of PM10, especially during heating seasons. Moreover, the most frequently exceeded AQ standard in Poland is the annual mean level of benzo(a)pyrene, as nearly all monitoring stations reported an annual average above the limit value in 2019. Interestingly, in Poland, a high level of PM10 24 h-values (above 50 µg/m3) relates to high levels of B(a)P. Therefore, the assessment of the short-term health effects of PM10 also include the impact of high levels of polycyclic aromatic hydrocarbons, with B(a)P being a part of this group of pollutants. On the other hand, when the NMMAPS protocol was applied, the results for PM2.5 and PM10 differed considerably (Table 4 and Table 5). This may suggest that the GAM-fitting method used within the APHEA protocol (with an alternating number of knots chosen by PACF minimization) might have been too constrained and/or caused model overfitting, which led to unsatisfactory results.
Interesting results were obtained in variants 5 and 6, in which hospital admissions were analyzed separately for three age groups. In terms of cardiovascular disorders (Table 4), the effect of short-term PM10 exposure was the strongest for kids of 0−14 years of age: RR for a 0-day lag equals 1.013 (in both variant 5 and 6), while in the two other age groups this was 1.006, i.e., the same as for the whole population, regardless of age (variants 5 and 6 are analogous to unstratified variants 2 and 3, respectively). However, the analysis of RS disorders (Table 5) revealed the opposite results: people in the 0−14 and 15−64 age groups have the same risk of hospitalization as the general population (1.007−1.008), while the RR for the oldest group (above 65 yr) increases to 1.010 for a 0-day lag.
In addition to the analysis of the impact of patient age stratification, seven calculation variants (1st–7th) considered for PM10 under the APHEA protocol aimed to examine how some modifications in the preliminary options regarding input data would influence the final results of the analysis, i.e., the obtained RR value. The first option checked was the inclusion of PM measurements averaged across all types of stations within each city, versus PM from urban background stations only (variants 1 vs. 2, and 3 vs. 4). This alteration did not make any significant difference to pooled RR, most likely due to the fact that the number of stations other than urban background is small, and therefore their measurements had little impact on exposure assessment. However, research shows that living near streets with heavy traffic [26,27,28] or in the vicinity of some industrial facilities [29,30] elevates health risk in local populations. Such particular conditions were not included in our multi-city study.
Secondly, we considered the use of PM data from manual samplers only versus combined manual and automatic measurements (variant 1 vs. 4, 2 vs. 3, and 5 vs. 6). In this case, no significant differences were observed. Indeed, manual and automatic measurements are usually strongly correlated and in particular time trends of concentrations are preserved in both types of measurements. Moreover, automatic samplers undergo periodic calibration against manual gravimetric measurements, therefore–as expected–the inclusion of automatic PM data did not change the final results.
We also checked whether the use of selected CV and RS ICD-10 admission codes would influence the results in comparison with consideration of all cardiovascular and respiratory patients (variant 2 vs. 7). This alteration was used to test whether including only patients with CV/RS disorders, which have a confirmed strong association with exposure to air pollutants, would provide a stronger signal in the data and, therefore, a higher RR score. Such an effect was not observed, and the two compared variants produced the same effect. This could be because the ICD-10 code attribution for urgent hospital admissions might not be very precise, as the scope of diagnosis in an emergency room is limited.
Within NMMAPS protocol, the considered variants differed in terms of GAM-fitting method: no. 9 and no. 11 used natural splines, while no. 10 and no. 12 used penalized cubic splines. The use of different types of spline functions was proven to have some influence on final results, but the differences were minor. More importantly, in this case, the estimated effects of PM2.5 were much stronger than those of PM10 for both CV and RS admissions. Such results are more aligned with other studies that compared the short-term impacts of these two PM fractions [15,31,32,33]. Moreover, RRs calculated within the NMMAPS protocol were higher than those obtained following the APHEA methodology. The main difference between these two approaches is the method of choosing the number of degrees of freedom for the model fitting. The APHEA method requires separately calculating the df number for each GAM model run (by minimizing the partial autocorrelation function), while in the NMMAPS method this number is constant and arbitrarily fixed. The APHEA method is much more laborious and intuitively should produce “better” results, i.e., it should provide more precisely depicted time trends, weather conditions, etc. However, the downside of such an approach is the risk of model overfitting, which can result in various errors. Very stable results, insensitive to input data modifications (as is the case in the present study), can be one of the consequences of model overfitting. As seen in Table 4 and Table 5, the NMMAPS method provides more consistent results across cities than the APHEA method, as CI ranges have a larger spread for RRs obtained with the APHEA protocol than in the cases when the NMMAPS protocol was applied. Bearing this in mind, we chose the RRs obtained within NMMAPS protocol with natural spline fitting (variants 9 and 11) as our final results, which will be discussed further. This approach is in line with the methodology used in a recent, large, multi-city analysis [15] which focused on the short-term impact of PM on premature mortality. The application of the same protocol to hospital admission analysis aims to produce useful results for comparisons with further studies that would follow this methodology.

4.2. Relative Risk of Cardiovascular and Respiratory Hospital Admissions in 31 Polish Cities

Figure 2a,b present the PM10-related risk factors for CV and RS urgent hospital admissions, respectively, calculated separately for 31 Polish cities, along with pooled results obtained by applying a random effect model. Figure 3a,b show the analogous outcomes obtained for PM2.5. The detailed results are presented in Table S1.
PM10-related relative risk of CV admissions is estimated at 1.0077 (95% CI, from 1.0062 to 1.0092) per 10 µg/m3, with moderate between-city heterogeneity: I2 = 37%. This result is comparable with the numbers estimated by the U.S. NMMAPS study [24], i.e., RR = 1.0107 (95% CI, from 1.0067 to 1.0146) for cardiovascular hospitalizations in the 65+ age group. A worldwide meta-analysis from 2013 [32] reports the PM10-related RR of hospital admission due to heart failure in all age groups at the level of 1.0163 (95% CI, from 1.0120 to 1.0207). For comparison, the multicity meta-analysis by Liu et al. (2019) [15] reported cardiovascular mortality risk due to short-term PM10 exposure at 1.0036 (95% CI, from 1.0030 to 1.0043).
The relative risk of respiratory hospital admissions in Polish cities is 1.0218 (1.0182–1.0253) with I2 = 41%. In NMMAPS study [24], RR values were estimated for hospitalizations due to COPD and pneumonia in the 65+ age group, and reached 1.0288 (95% CI, from 1.0019 to 1.0564) and 1.0207 (95% CI, from 1.0094 to 1.0322), respectively. The WHO HRAPIE report [33] indicates PM10-related RR only for the incidence of asthma symptoms in asthmatic children aged 5–19 years, and this is 1.028 (95% CI, from 1.006 to 1.051). A recent meta-analysis by Yee et al. (2021) [34] for hospitalization due to pneumonia reports RR at the level of 1.004 (95% CI, from 1.002 to 1.006) per 10 µg/m3 of PM10. RS mortality due to PM10 exposure was associated with RR = 1.0047 (95% CI, from 1.0035 to 1.0058) in the study of Liu et al. (2019) [15].
For PM2.5-related cardiovascular hospitalizations, we found RR = 1.0088 (95% CI, from 1.0072 to 1.0103), I2 = 27%. This falls within the range of the results of many studies, e.g., HRAPIE [35], which reported RR = 1.0091 (95% CI, from 1.0017 to 1.0166), or the meta-analysis by Atkinson et al. (2014) [4], where RR = 1.0090 (95% CI, from 1.0026 to 1.0153) for CV admissions in all age groups, and 1.0178 (95% CI, from 1.0048 to 1.0310) in the 65+ age group. Dominici et al. (2006) [13] and Shah et al. (2013) [32] reported RRs for hospitalizations due to heart failure, reaching 1.0128 (95% CI, from 1.0078 to 1.0780) and 1.0212 (95% CI, from 1.0142 to 1.0282), respectively. Estimates obtained by Tian et al. (2019) [6] for CV hospital admissions in a meta-analysis of Chinese cities were lower, as RR = 1.0026 (95% CI, from 1.0017 to 1.0035) per 10 µg/m3 PM2.5. In comparison, the PM2.5-related RR for cardiovascular mortality was equal to 1.0055 (95% CI, from 1.0045 to 1.0066) in the study of Liu et al. (2019) [15].
The pooled relative risk of respiratory hospitalization due to a 10 µg/m3 increase in daily PM2.5 concentration in Polish cities was 1.0289 (95% CI, from 1.0244 to 1.0335), I2 = 45%. This is comparable with HRAPIE [35] results (1.0190, 95% CI: from 0.9982 to 1.0402), but higher than the estimates given by Atkinson et al. (2014) [4] (1.0096, 95% CI: from 0.9937 to 1.0258 in all age groups and 1.0091, 95% CI: from 1.0043 to 1.0140 in the 65+ age group). Dominici et al. (2006) [13] report PM2.5-related RR for hospital admissions due to COPD at the level of 1.0091 (95% CI, from 1.0018 to 1.0164), while, in the review by DeVries et al. (2016) [36], the RR of COPD hospitalization ranged from 1.014 to 1.025 per 10 µg/m3 of PM2.5. The RR value obtained in a worldwide meta-analysis [34] for admissions due to pneumonia (all ages) equaled 1.010 (95% CI, from 1.005 to 1.015). In the study of Liu et al. (2019) [15], RS mortality due to PM2.5 exposure was associated with RR = 1.0074 (95% CI, from 1.0053 to 1.0095).
The levels of RR obtained in the present meta-analysis were generally within the range of the results of similar studies conducted worldwide; however, the variability of RR estimates across studies is a phenomenon that still has not been definitely explained. There could be many reasons for this, including the use of different time series models or different assumptions applied within the same class of models (as shown in our study); hospitalization data uncertainties or differences in the ways of classifying the causes of hospital admissions; unknown differences (e.g., socio-economic) between populations, which modify the impacts of air pollution on the occurrence of investigated health end-points; differences in PM characteristics and particle composition (e.g., levels of heavy metals or B(a)P and other PAHs), which result in different toxicity levels for the same PM concentrations observed in locations where the main emission sources differ to a large extent, etc. The advantage of the GAM model is that it makes it relatively easy to conduct epidemiological studies, as it requires data that are routinely collected in most countries. Thanks to this, there is a wide range of reference material from similar studies worldwide. However, the choice of the number and type of confounder variables included in the model must be decided by the authors of each analysis, which might influence the final results. For this reason, it is advisable to follow the previously elaborated standard protocols, which ensure the comparability of results.

5. Conclusions

Time-series analyses of PM-related morbidity in Poland are still rare and, to the authors’ knowledge, until the end of 2021, no paper was published that included an analysis of the risk of hospitalizations with the use of GAM models. Several studies have applied other time-series methods to calculate air-pollution-related morbidity risks in individual cities [37,38,39], single voivodeships [40] or several selected locations [41,42,43,44,45], but none of them included a multi-city meta-analysis.
The present study reports RR values for cardiovascular and respiratory hospital admissions related to exposure to PM2.5 and PM10, which were separately calculated for 31 Polish cities over the period of seven years (2011−2017), as well as pooled risk estimates obtained with a random-effects model. We performed a useful comparison of two calculation protocols (APHEA method and NMMAPS method), with several calculation variants (total of 12), to test the sensitivity of GAM models to some changes in the input dataset. The results of these modifications show that using air quality data from all types of stations (urban background, traffic, and industrial) vs. urban background only; using air quality data measured by only manual samplers vs. both manual and automatic ones; or including hospital admissions due to any type of cardiovascular or respiratory disorders vs. only selected symptoms and diseases have no significant influence on final, pooled RR values. Only age stratification of the patients led to more heterogeneous results (i.e., we obtained noticeably higher RR values for CV hospitalizations in the 0−14 age group and for RS hospitalizations in 65+ age group). Moreover, we concluded that the APHEA method seems to produce more uniform results, probably due to a complicated method of selecting the number of knots, which may cause model overfitting.
The final estimates of RR values for PM10-related CV and RS hospital admissions in Poland equal 1.0077 (95% CI, 1.0062 to 1.0092) and 1.0218 (95% CI, 1.0182 to 1.0253), respectively, while, for PM2.5, these values reached 1.0088 (95% CI, 1.0072 to 1.0103) and 1.0289 (95% CI, 1.0244 to 1.0335), respectively. These results are generally comparable to the conclusions of several other multi-city analyses regarding the short-term impact of PM on cardiovascular and respiratory morbidity. A moderate heterogeneity of RR estimates was observed between the analyzed cities (I2 values from 27% to 45%), which is an expected result, considering the diversity of PM characteristics in different regions of Poland [46]; however, other environmental, geographical, meteorological and socioeconomic factors may also have a significant (if not crucial) impact on the obtained differences in the estimated RR indices. Further research should consider these conditions, along with applying multi-pollutant investigation schemes to account for the large variability in the levels of other pollutants across Poland.

Supplementary Materials

The following are available online at https://www.mdpi.com/article/10.3390/atmos13020345/s1, Table S1: RR values for cardiovascular and respiratory hospital admissions due to short-term PM10 and PM2.5 exposure in 31 cities of Poland.

Author Contributions

Conceptualization, Ł.A., K.M., D.R.; Methodology, K.M., D.R.; Formal Analysis, Ł.A., K.M.; Resources, Ł.A., A.D.-O.; Data Curation, Ł.A.; Writing—Original Draft Preparation, Ł.A., K.M., D.R., A.D.-O.; Writing—Review and Editing, Ł.A., K.M., D.R., A.D.-O.; Visualization, K.M.; A.D.-O. All authors have read and agreed to the published version of the manuscript.

Funding

The study was conducted under the grant “Integrated support system for policies and programs Limiting Low Emissions—ZONE” and co-financed by the National Center for Research and Development under the strategic and R&D work “Social and economic development of Poland in the conditions of globalizing markets” GOSPOSTRATEG with the number Gospostrateg1/385807/4/2018/NCBR. The publication stage was co-financed by LIFE-MAPPINGAIR/PL Project (No. LIFE17 GIE/PL/000631).

Institutional Review Board Statement

Not applicable.

Informed Consent Statement

Not applicable.

Data Availability Statement

Not applicable.

Acknowledgments

We thank Polish National Health Fund for providing hospitalization dataset.

Conflicts of Interest

The authors declare no conflict of interest.

References

  1. Brauer, M.; Brook, J.R.; Christidis, T.; Chu, Y.; Crouse, D.L.; Erickson, A.; Hystad, P.; Li, C.; Martin, R.V.; Meng, J.; et al. Mortality–Air Pollution Associations in Low-Exposure Environments (MAPLE), Phase 1; Research Reports; Health Effects Institute: Boston, MA, USA, 2019; p. 203. [Google Scholar]
  2. Dominici, F.; Schwartz, J.; Di, Q.; Braun, D.; Choirat, C.; Zanobetti, A. Assessing Adverse Health Effects of Long-Term Exposure to Low Levels of Ambient Air Pollution: Phase 1; Research Reports; Health Effects Institute: Boston, MA, USA, 2019; p. 200. [Google Scholar]
  3. Wolf, K.; Hoffmann, B.; Andersen, Z.J.; Atkinson, R.W.; Bauwelinck, M.; Bellander, T.; Brandt, J.; Brunekreef, B.; Cesaroni, G.; Chen, J.; et al. Long-term exposure to low-level ambient air pollution and incidence of stroke and coronary heart disease: A pooled analysis of six European cohorts within the ELAPSE project. Lancet Planet. Health 2021, 5, e620–e632. [Google Scholar] [CrossRef]
  4. Atkinson, R.W.; Kang, S.; Anderson, H.R.; Mills, I.C.; Walton, H.A. Epidemiological time series studies of PM2.5 and daily mortality and hospital admissions: A systematic review and meta-analysis. Thorax 2014, 69, 660–665. [Google Scholar] [CrossRef] [PubMed] [Green Version]
  5. Kloog, I.; Ridgway, B.; Koutrakis, P.; Coull, B.A.; Schwartz, J.D. Long-and short-term exposure to PM2. 5 and mortality: Using novel exposure models. Epidemiology 2013, 24, 555. [Google Scholar] [CrossRef]
  6. Tian, Y.; Liu, H.; Wu, Y.; Si, Y.; Song, J.; Cao, Y.; Li, M.; Wu, Y.; Wang, X.; Chen, L.; et al. Association between ambient fine particulate pollution and hospital admissions for cause specific cardiovascular disease: Time series study in 184 major Chinese cities. BMJ 2019, 367, l6572. [Google Scholar] [CrossRef] [Green Version]
  7. Chen, C.; Zhao, B.; Weschler, C.J. Assessing the influence of indoor exposure to “outdoor ozone”on the relationship between ozone and short-term mortality in U.S. communities. Environ. Health Perspect. 2012, 120, 235–240. [Google Scholar] [CrossRef] [PubMed] [Green Version]
  8. Hwang, S.H.; Choi, Y.; Paik, H.J.; Wee, W.R.; Kim, M.K.; Kim, D.H. Potential Importance of Ozone in the Association Between Outdoor Air Pollution and Dry Eye Disease in South Korea. JAMA Ophthalmol. 2016, 134, 503–510. [Google Scholar] [CrossRef] [Green Version]
  9. Goudarzi, G.; Geravandi, S.; Foruozandeh, H.; Babaei, A.A.; Alavi, N.; Niri, M.V.; Khodayar, M.J.; Salmanzadeh, S.; Mohammadi, M.J. Cardiovascular and respiratory mortality attributed to ground-level ozone in Ahvaz, Iran. Environ. Monit. Assess. 2015, 187, 1–9. [Google Scholar] [CrossRef]
  10. Beelen, R.; Raaschou-Nielsen, O.; Stafoggia, M.; Andersen, Z.J.; Weinmayr, G.; Hoffmann, B.; Wolf, K.; Samoli, E.; Fischer, P.; Nieuwenhuijsen, M.; et al. Effects of long-term exposure to air pollution on natural-cause mortality: An analysis of 22 European cohorts within the multicentre ESCAPE project. Lancet 2017, 383, 785–795. [Google Scholar] [CrossRef]
  11. Crouse, D.L.; Peters, P.A.; Hystad, P.; Brook, J.R.; van Donkelaar, A.; Martin, R.V.; Villeneuve, P.J.; Jerrett, M.; Goldberg, M.S.; Pope, C.A., 3rd; et al. Ambient PM2.5, O3, and NO2 Exposures and Associations with Mortality over 16 Years of Follow-Up in the Canadian Census Health and Environment Cohort (CanCHEC). Environ. Health Perspect. 2015, 123, 1180–1186. [Google Scholar] [CrossRef] [Green Version]
  12. Zanobetti, A.; Schwartz, J.; Dockery, D.W. Airborne particles are a risk factor for hospital admissions for heart and lung disease. Environ Health Perspect. 2000, 108, 1071–1077. [Google Scholar] [CrossRef] [PubMed]
  13. Dominici, F.; Peng, R.D.; Bell, M.L.; Pham, L.; McDermott, A.; Zeger, S.L.; Samet, J.M. Fine particulate air pollution and hospital admission for cardiovascular and respiratory diseases. JAMA 2006, 295, 1127–1134. [Google Scholar] [CrossRef] [Green Version]
  14. Sunyer, J.; Basagaña, X. Particles, and not gases, are associated with the risk of death in patients with chronic obstructive pulmonary disease. Int. J. Epidemiol. 2001, 30, 1138–1140. [Google Scholar] [CrossRef] [PubMed] [Green Version]
  15. Liu, C.; Chen, R.; Sera, F.; Vicedo-Cabrera, A.M.; Guo, Y.; Tong, S.; Coelho, M.S.Z.S.; Saldiva, P.H.N.; Lavigne, E.; Matus, P.; et al. Ambient Particulate Air Pollution and Daily Mortality in 652 Cities. N. Engl. J. Med. 2019, 381, 705–715. [Google Scholar] [CrossRef]
  16. European Environment Agency. Air Quality in Europe—2019 Report, EEA 2019. p. 99. Available online: https://www.eea.europa.eu/publications/air-quality-in-europe-2019 (accessed on 8 November 2021).
  17. Air Pollutant Measurement Database in Poland/Główny Inspektorat Środowiska (Chief Inspectorate of Environmental Protection). Available online: https://powietrze.gios.gov.pl/pjp/archives (accessed on 13 September 2021).
  18. Bhaskaran, K.; Gasparrini, A.; Hajat, S.; Smeeth, L.; Armstrong, B. Time series regression studies in environmental epidemiology. Int. J. Epidemiol. 2013, 42, 1187–1195. [Google Scholar] [CrossRef] [PubMed]
  19. Available online: https://danepubliczne.imgw.pl/ (accessed on 13 September 2021).
  20. Available online: https://icd.who.int/browse10/2019/en (accessed on 13 September 2021).
  21. Hastie, T.; Tibshirani, R. Generalized additive models. Stat. Sci. 1986, 1, 297–318. [Google Scholar] [CrossRef]
  22. Katsouyanni, K.; Zmirou, D.; Spix, C.; Sunyer, J.; Schouten, J.P.; Pönkä, A.; Anderson, H.R.; Le Moullec, Y.; Wojtyniak, B.; Vigotti, M.A.; et al. Short-term effects of air pollution on health: A European approach using epidemiological time-series data. The APHEA project: Background, objectives, design. Eur. Respir. J. 1995, 8, 1030–1038. [Google Scholar]
  23. Katsouyanni, K.; Schwartz, J.; Spix, C.; Touloumi, G.; Zmirou, D.; Zanobetti, A.; Wojtyniak, B.; Vonk, J.M.; Tobias, A.; Pönkä, A.; et al. Short term effects of air pollution on health: A European approach using epidemiologic time series data: The APHEA protocol. J. Epidemiol. Community Health 1996, 50 (Suppl. 1), S12–S18. [Google Scholar] [CrossRef] [Green Version]
  24. Samet, J.M.; Zeger, S.L.; Dominici, F.; Curriero, F.C.; Coursac, I.; Dockery, D.W.; Schwartz, J.; Zanobetti, A. The National Morbidity, Mortality, and Air Pollution Study Part II: Morbidity and Mortality from Air Pollution in the United States; Research Report 94; Health Effects Institute: Cambridge, MA, USA, 2000. [Google Scholar]
  25. Wojtyniak, B.; Goryński, P. (Eds.) Health Status of Polish Population and Its Determinants; National Institute of Public Health—National Institute of Hygiene: Warsaw, Poland, 2018; p. 492. [Google Scholar]
  26. Bayer-Oglesby, L.; Schindler, C.; Hazenkamp-von Arx, M.E.; Braun-Fahrländer, C.; Keidel, D.; Rapp, R.; Künzli, N.; Braendli, O.; Burdet, L.; Sally, L.L.J.; et al. Living near main streets and respiratory symptoms in adults: The Swiss Cohort Study on Air Pollution and Lung Diseases in Adults. Am. J. Epidemiol. 2006, 164, 1190–1198. [Google Scholar] [CrossRef] [Green Version]
  27. McConnell, R.; Islam, T.; Shankardass, K.; Jerrett, M.; Lurmann, F.; Gilliland, F.; Gauderman, J.; Avol, E.; Künzli, N.; Yao, L.; et al. Childhood incident asthma and traffic-related air pollution at home and school. Environ. Health Perspect. 2010, 118, 1021–1026. [Google Scholar] [CrossRef] [Green Version]
  28. Badyda, A.J.; Dabrowiecki, P.; Lubinski, W.; Czechowski, P.O.; Majewski, G.; Chcialowski, A.; Kraszewski, A. Influence of traffic-related air pollutants on lung function. Adv. Exp. Med. Biol. 2013, 788, 229–235. [Google Scholar] [CrossRef]
  29. Cakmak, S.; Dales, R.E.; Vida, C.B. Components of particulate air pollution and mortality in Chile. Int. J. Occup. Environ. Health. 2009, 15, 152–158. [Google Scholar] [CrossRef]
  30. Sarnat, J.A.; Marmur, A.; Klein, M.; Kim, E.; Russell, A.G.; Sarnat, S.E.; Mulholland, J.A.; Hopke, P.K.; Tolbert, P.E. Fine particle sources and cardiorespiratory morbidity: An application of chemical mass balance and factor analytical source-apportionment methods. Environ. Health Perspect. 2008, 116, 459–466. [Google Scholar] [CrossRef]
  31. Kelly, F.J.; Fussell, J.C. Size, source and chemical composition as determinants of toxicity attributable to ambient particulate matter. Atmos. Environ. 2012, 60, 504–526. [Google Scholar] [CrossRef]
  32. Shah, A.S.; Langrish, J.P.; Nair, H.; McAllister, D.A.; Hunter, A.L.; Donaldson, K.; Newby, D.E.; Mills, N.L. Global association of air pollution and heart failure: A systematic review and meta-analysis. Lancet 2013, 382, 1039–1048. [Google Scholar] [CrossRef] [Green Version]
  33. Maciejewska, K. Short-term impact of PM2.5, PM10, and PMc on mortality and morbidity in the agglomeration of Warsaw, Poland. Air Qual. Atmos. Health 2020, 13, 659–672. [Google Scholar] [CrossRef]
  34. Yee, J.; Cho, Y.A.; Yoo, H.J.; Yun, H.; Gwak, H.S. Short-term exposure to air pollution and hospital admission for pneumonia: A systematic review and meta-analysis. Environ. Health. 2021, 20, 6. [Google Scholar] [CrossRef] [PubMed]
  35. WHO Health Risks of air Pollution in Europe—HRAPIE Project. Recommendations for Concentration–Response Functions for Cost–Benefit Analysis of Particulate Matter, Ozone and Nitrogen Dioxide; World Health Organization; Regional Office for Europe, European Centre for Environment and Health: Bonn, Germany, 2013. [Google Scholar]
  36. DeVries, R.; Kriebel, D.; Sama, S. Outdoor Air Pollution and COPD-Related Emergency Department Visits, Hospital Admissions, and Mortality: A Meta-Analysis. J. Chronic Obstr. Pulm. Dis. 2017, 14, 113–121. [Google Scholar] [CrossRef] [PubMed]
  37. Kuźma, Ł.; Pogorzelski, S.; Struniawski, K.; Bachórzewska-Gajewska, H.; Dobrzycki, S. Exposure to air pollution-a trigger for myocardial infarction? A nine-year study in Bialystok-the capital of the Green Lungs of Poland (BIA-ACS registry). Int. J. Hyg. Environ. Health 2020, 229, 113578. [Google Scholar] [CrossRef]
  38. Kuźma, Ł.; Pogorzelski, S.; Struniawski, K.; Dobrzycki, S.; Bachórzewska-Gajewska, H. Effect of air pollution on the number of hospital admissions for acute coronary syndrome in elderly patients. Pol. Arch. Intern. Med. 2020, 130, 38–46. [Google Scholar] [CrossRef] [Green Version]
  39. Konduracka, E.; Niewiara, Ł.; Guzik, B.; Kotynia, M.; Szolc, P.; Gajos, G.; Nessler, J.; Podolec, P.; Żmudka, K. Effect of short-term fluctuations in outdoor air pollution on the number of hospital admissions due to acute myocardial infarction among inhabitants of Kraków, Poland. Pol. Arch. Intern. Med. 2019, 129, 88–96. [Google Scholar] [CrossRef] [PubMed] [Green Version]
  40. Niewiadomska, E.; Kowalska, M.; Niewiadomski, A.; Skrzypek, M.; Kowalski, M.A. Assessment of Risk Hospitalization due to Acute Respiratory Incidents Related to Ozone Exposure in Silesian Voivodeship (Poland). Int. J. Environ. Res. Public Health 2020, 17, 3591. [Google Scholar] [CrossRef] [PubMed]
  41. Wrotek, A.; Badyda, A.; Czechowski, P.O.; Owczarek, T.; Dąbrowiecki, P.; Jackowska, T. Air Pollutants’ Concentrations Are Associated with Increased Number of RSV Hospitalizations in Polish Children. J. Clin. Med. 2021, 10, 3224. [Google Scholar] [CrossRef] [PubMed]
  42. Kuźma, Ł.; Wańha, W.; Kralisz, P.; Kazmierski, M.; Bachórzewska-Gajewska, H.; Wojakowski, W.; Dobrzycki, S. Impact of short-term air pollution exposure on acute coronary syndrome in two cohorts of industrial and non-industrial areas: A time series regression with 6,000,000 person-years of follow-up (ACS—Air Pollution Study). Environ. Res. 2021, 19, 111154. [Google Scholar] [CrossRef]
  43. Slama, A.; Śliwczyński, A.; Woźnica-Pyzikiewicz, J.; Zdrolik, M.; Wiśnicki, B.; Kubajek, J.; Turżańska-Wieczorek, O.; Studnicki, M.; Wierzba, W.; Franek, E. The short-term effects of air pollution on respiratory disease hospitalizations in 5 cities in Poland: Comparison of time-series and case-crossover analyses. Environ. Sci. Pollut. Res. Int. 2020, 27, 24582–24590. [Google Scholar] [CrossRef]
  44. Buszman, P.E.; Derbisz, K.; Kwasiborski, P.; Chrząszcz, P.; Mularska, M.; Baron, D.; Sobieszek, A.; Mendyk, A.; Skoczylas, P.; Cisowski, M.; et al. Impact of air pollution on hospital patients admitted with ST- and non-ST-segment elevation myocardial infarction in heavily polluted cities within the European Union. Cardiol. J. 2020, 27, 541–547. [Google Scholar] [CrossRef] [PubMed] [Green Version]
  45. Slama, A.; Śliwczyński, A.; Woźnica, J.; Zdrolik, M.; Wiśnicki, B.; Kubajek, J.; Turżańska-Wieczorek, O.; Gozdowski, D.; Wierzba, W.; Franek, E. Impact of air pollution on hospital admissions with a focus on respiratory diseases: A time-series multi-city analysis. Environ. Sci. Pollut. Res. Int. 2019, 26, 16998–17009. [Google Scholar] [CrossRef] [Green Version]
  46. Balun, M.; Białoskórska, U.; Bruszewski, H.; Burzyński, J.; Błaszczyk, J.; Cenowski, M.; Degórska, A.; Dyduch, B.; Greger, J.; Hławiczka, S.; et al. Analiza Stanu Zanieczyszczenia Powietrza Pyłem PM10 i PM2,5 z Uwzględnieniem Składu Chemicznego Pyłu Oraz Wpływu źródeł Naturalnych—Raport Końcowy; Report of the Chief Inspectorate of Environmental Protection; Instytut Podstaw Inżynierii Środowiska PAN; Instytut Ekologii Terenów Uprzemysłowionych; Instytut Meteorologii i Gospodarki Wodnej PIB; Instytut Ochrony Środowiska PIB: Zabrze, Poland, 2011; p. 297. (In Polish) [Google Scholar]
Figure 1. Flowchart of the study method.
Atmosphere 13 00345 g001
Figure 2. RR values for (a) cardiovascular and (b) respiratory hospital admissions due to short-term PM10 exposure in 31 cities of Poland, as well as the nationwide pooled results. The whiskers denote lower and upper ends of 95% confidence intervals, respectively, while the colored box indicates statistical significance of a particular result. Relative risk calculated per 10 µg/m3 PM10.
Atmosphere 13 00345 g002
Figure 3. RR values for (a) cardiovascular and (b) respiratory hospital admissions due to short-term PM2.5 exposure in 31 cities of Poland, as well as the nationwide pooled results. The whiskers denote lower and upper ends of 95% confidence intervals, respectively, while colored box indicates statistical significance of a particular result. Relative risk calculated per 10 µg/m3 PM2.5.
Atmosphere 13 00345 g003
Table 1. Characteristics of main ambient air pollutants’ concentrations in Poland in 2019 *.
PollutantLimit ValueShare of Monitoring Stations with ExceedancesQ1 [µg/m3]Q3 [µg/m3]Mean [µg/m3]
PM1050 µg/m3, not to be exceeded daily more than 35 times per year31%13.3 a45.0 a29.8 a
PM1040 µg/m3, annual mean3%22.529.826.6
PM2.520 µg/m3 annual mean40%16.021.419.1
* Own calculation based on Chief Inspectorate of Environmental Protection Poland database for 2019 [17]. a–characteristics presented in the number of daily exceedance of 50 µg/m3.
Table 2. Details of calculation variants applied within present study.
Input DataStatistical Model
No.PMXType of Monitoring StationsMeasurement ModeMeteo Var.ICD-10 CodesPatient Age GroupsLagsMethod of Choosing the Number of dfSpline Type
1PM10UB, traf, indmanualT,
RH,
p,
WS,
R
I00-I99, J00-J99, R00-R09all ages together0, 1, 5, 0–1, 0–5min PACFpenalized cubic splinesAPHEA protocol
2PM10UBmanualI00-I99, J00-J99, R00-R09all ages together0, 1, 5, 0–1, 0–5
3PM10UBmanual + automaticI00-I99, J00-J99, R00-R09all ages together0, 1, 5, 0–1, 0–5
4PM10UB, traf, indmanual + automaticI00-I99, J00-J99, R00-R09all ages together0, 0–1, 0–5
5PM10UBmanualI00-I99, J00-J99, R00-R090–14, 15–64, >650, 0–1, 0–5
6PM10UBmanual + automaticI00-I99, J00-J99, R00-R090–14, 15–64, >650, 0–1, 0–5
7PM10UBmanualI20-I25, I46-I52, I63-I69, J00-J47, R00, R05-R07all ages together0, 0–1, 0–5
8PM2.5UBmanualI00-I99, J00-J99, R00-R09all ages together0, 0–1, 0–5
9PM10UBmanualT, RHI00-I99, J00-J99, R00-R09all ages together0–1fixednatural splinesNMMAPS protocol
10PM10UBmanualI00-I99, J00-J99, R00-R10all ages together0–1penalized cubic splines
11PM2.5UBmanualI00-I99, J00-J99, R00-R11all ages together0–1natural splines
12PM2.5UBmanualI00-I99, J00-J99, R00-R12all ages together0–1penalized cubic splines
UB–urban background, traf—traffic, ind—industrial, T—air temperature, RH—relative humidity, p—air pressure, WS—wind speed, R—precipitation; df—degrees of freedom.
Table 3. Average daily number of urgent hospital admissions per 10,000 inhabitants in all analyzed cities in the period of 2011–2017.
CV DisordersRS Disorders
CityAll YearHeating SeasonNon-Heating SeasonAll YearHeating SeasonNon-Heating Season
Bialystok0.420.420.410.160.180.14
Bielsko-Biala0.550.560.540.150.170.13
Czestochowa0.750.760.730.180.210.15
Dabrowa Gornicza0.680.700.670.160.180.14
Elblag0.650.670.620.180.210.16
Gdansk0.720.740.700.390.430.34
Gliwice0.660.670.640.140.160.13
Gorzow Wielkopolski0.640.670.610.310.340.27
Kalisz0.710.740.670.230.250.20
Katowice0.710.730.690.170.190.14
Kielce0.870.890.840.410.450.38
Koszalin0.770.800.740.390.430.35
Kraków0.740.750.730.340.380.29
Legnica0.820.840.810.280.310.25
Lublin0.920.960.890.310.350.27
Lodz0.800.820.780.190.210.16
Olsztyn0.620.640.590.320.360.29
Opole0.680.710.650.400.470.34
Radom0.770.790.740.290.330.25
Rybnik0.650.670.620.260.300.22
Rzeszów0.580.600.550.260.290.23
Sosnowiec0.680.690.660.130.140.11
Szczecin0.640.660.610.380.420.33
Tarnow0.700.720.680.270.300.23
Torun0.620.640.610.300.340.26
Tychy0.650.670.640.130.140.11
Warszawa0.660.670.640.250.290.22
Wloclawek0.640.650.620.190.220.16
Wroclaw0.640.660.630.230.260.20
Zabrze0.460.460.450.130.140.11
Zielona Gora0.630.650.600.240.270.22
MEAN0.680.700.660.250.280.22
Table 4. RR estimates for cardiovascular disorders obtained in all calculation variants.
No.Age GroupRR Lag 0C.I.RR Lag 1C.I.RR Lag 5C.I.RR Lag 0_1 C.I.RR Lag 0_5 C.I.
1all1.0061.005–1.0071.0021.001–1.0041.0011.001–1.0021.0031.002–1.0041.0021.001–1.002APHEA protocol
21.0061.004–1.0071.0021.001–1.0031.0011.000–1.0021.0031.002–1.0031.0021.001–1.002
31.0061.004–1.0071.0031.002–1.0041.0021.001–1.0031.0031.002–1.0041.0021.001–1.002
41.0061.005–1.007----1.0031.002–1.0041.0021.002–1.003
50–141.0131.002–1.024----1.0111.001–1.0211.0111.004–1.019
15–641.0061.004–1.008----1.0031.001–1.0041.0011.000–1.003
>651.0061.004–1.007----1.0031.002–1.0041.0011.001–1.002
60–141.0131.004–1.023----1.0091.001–1.0181.0101.003–1.017
15–641.0061.005–1.008----1.0031.002–1.0041.0021.001–1.003
>651.0061.005–1.007----1.0031.002–1.0041.0021.001–1.002
7all1.0061.004–1.007----1.0031.002–1.0041.0011.001–1.002
8all1.0051.003–1.006----1.0021.001–1.0031.0021.001–1.002
9all------1.00771.0062–1.0092--NMMAPS protocol
10------1.00781.0062–1.0093--
11------1.00881.0072–1.0103--
12------1.00871.0071–1.0103--
Table 5. RR estimates for respiratory disorders obtained in all calculation variants.
No.Age GroupRR Lag 0C.I.RR Lag 1C.I.RR Lag 5C.I.RR Lag 0_1C.I.RR Lag 0_5C.I.
1all1.0081.006–1.0101.0051.003–1.0081.0051.003–1.0061.0041.002–1.0061.0031.001–1.004APHEA protocol
21.0081.005–1.0101.0051.003–1.0071.0041.003–1.0061.0041.002–1.0051.0031.001–1.004
31.0071.005–1.0091.0051.003–1.0061.0051.003–1.0061.0031.002–1.0041.0031.002–1.004
41.0071.005–1.009----1.0031.002–1.0041.0021.001–1.002
50–141.0081.004–1.012----1.0041.000–1.0081.0010.998–1.004
15–641.0081.005–1.011----1.0041.002–1.0061.0031.001–1.004
>651.0101.007–1.014----1.0051.003–1.0071.0041.002–1.006
60–141.0071.003–1.011----1.0031.000–1.0061.0010.998–1.003
15–641.0081.005–1.010----1.0041.002–1.0051.0031.002–1.004
>651.0101.007–1.013----1.0051.004–1.0071.0041.003–1.006
7all1.0081.005–1.010----1.0041.002–1.0061.0031.001–1.004
8all1.0071.004–1.010----1.0031.002–1.0051.0031.001–1.004
9all------1.02181.0182–1.0253--NMMAPS protocol
10------1.02021.0168–1.0236--
11------1.02891.0244–1.0335--
12------1.02631.0219–1.0307--
Publisher’s Note: MDPI stays neutral with regard to jurisdictional claims in published maps and institutional affiliations.

