Next Article in Journal
Daily Atmospheric Circulation Patterns and Their Influence on Dry/Wet Events in Iran
Next Article in Special Issue
Spatiotemporal Variation of Air Quality (PM and NO2) in Southern Paris during COVID-19 Lockdown Periods
Previous Article in Journal
The Controlling of the Subtropical High Leading Modes on the Spatial Pattern of Tropical Cyclone Genesis in the Western North Pacific and Tracks Landing on the East Coast of China
Previous Article in Special Issue
Electrification of Road Transport and the Impacts on Air Quality and Health in the UK
 
 
Correction published on 21 April 2022, see Atmosphere 2022, 13(5), 655.
Article

A Characterization and Cell Toxicity Assessment of Particulate Pollutants from Road Traffic Sites in Kano State, Nigeria

by
Aishatu Abubakar Sadiq
1,2,*,
Salah Khardi
1,2,
Adina-Nicoleta Lazar
1,
Imam Wada Bello
3,
Samson Polycarp Salam
4,
Aisha Faruk
3,
Mitchell A. Alao
4,
Mickaël Catinon
5,
Michel Vincent
5 and
Ana-Maria Trunfio-Sfarghiu
1
1
Laboratory of Contact and Structural Mechanics, University of Lyon, CNRS, INSA Lyon, UMR5259, Villeurbanne, 69100 Lyon, France
2
EASE Laboratories, Universitie Gustave Eiffel (UGE), Lyon-Campus, 25 Avenue Francois Mitterand, 69500 Lyon, France
3
Department of Public Health, Ministry of Health, Kano 700282, Nigeria
4
Nigeria Field Epidemiology and Laboratory Training Programme (NFELTP), Abuja 900231, Nigeria
5
Minapath Development, 56 Boulevard Niels Bohr, Villeurbanne, 69100 Lyon, France
*
Author to whom correspondence should be addressed.
Atmosphere 2022, 13(1), 80; https://doi.org/10.3390/atmos13010080
Submission received: 9 November 2021 / Revised: 22 December 2021 / Accepted: 29 December 2021 / Published: 4 January 2022 / Corrected: 21 April 2022
(This article belongs to the Special Issue Impacts of Transport Systems on Air Pollution and Human Health)

Abstract

:
Emerging African countries are characterized by explosive population growth and urbanization, which threaten environmental sustainability. This study comparatively characterized ambient aerosols and assessed cytotoxicity to facilitate improving health and environmental policy. Twenty-four air samples were collected at high and low-density traffic sites in Kano State using polysulfone and stainless steel filters attached to an automated pump. The physico-chemical properties of particulate matter were determined using scanning electron microscopy and energy dispersive X-ray analysis (SEM-EDX). In vitro, their potential toxicity was assessed using macrophages and cell fixation with staining. Results showed 51.7% of particles as PM2.5, with the highest particle concentration in mixed sites (urban and industrial). Particle classification into four groups by elemental composition and structure showed: sand particles (Si, Al, Fe, Ca, Mg, K, Na, Mo, Sr, Zr) 30–51%; other fibers 0–3%; other particles (Si, Fe, S, Mo, Zn, and other metals) 22–40%; and silicone-based fibres 23–34%. The abundant elements are: Si, Al, Ca, Ce, Ti, Fe, Cl, Pb, and Mn. The lowest viability on cytotoxicity assessment was recorded in mixed site M2. The majority of households were located within 50 m of air sampling sites. Proximity to traffic sites worsens health, as evidenced in cytotoxicity findings. We recommend improved urban planning and intensification of emissions control.

1. Introduction

Global population growth and industrialization have resulted in an increased demand for resources and transportation. This urbanization, rapid population growth, and increase in industrial activity all contribute to environmental pollution [1,2]. This growth in urban areas is attributed to easy access to amenities and job opportunities, with increased consumption of resources among the inhabitants of cities [3]. For transportation, the negative effects it exerts and the consumption of resources are related to its contribution to sustainability [4]. Developing countries seeking to improve industrialization and commercialization are experiencing a greater need for effective transportation [5]. The majority of goods and passengers in Africa (80–90%) are transported by road [6]. Despite slower industrialization in Africa compared to developed countries, there has been a recorded increase in emissions [7]. Metropolitan African cities have grown exponentially [8], with associated technical and data issues affecting transportation and its management [9]. A limitation in the availability of pollution monitoring stations, equipment, funds, and human resources creates difficulty in the impact assessment of air pollution [10]. Industrial air pollution, in addition to affecting human health, also results in negative impacts on agricultural resources [11]. Studies show vehicle emissions as the main source of volatile organic compounds (VOCs) in large cities [12,13]. The increase in the number of vehicles in African countries has been linked to an increase in purchasing power and population size [14]. Various other contaminants contribute to the urban atmosphere, including industries, thermal power stations, waste incinerators, and dust [15]. The common sources of emissions vary from urban to rural areas; in urban settings, most sources are vehicular and industrial [16].
In addition to industrial and vehicular pollution contributing to air pollution, urban environments, particularly in North African and West African countries, are subject to the impact of dust storms that worsen pollution [17,18]. Transported dust, mainly from Northern Africa, is shown to be predominant for months in the atmosphere and is deposited in some countries, like Nigeria and Ghana [19,20]. Small solid and liquid particles suspended in the air constitute ambient particulate matter, known as PMs. Various sources of air pollutants have been identified globally and vary depending on the natural environment and prevailing human activities in any given location. PMs are produced from several sources, including those emitted by traffic, carbon combustion, gas, diesel, and other types of fuels [21]. Particulate matter (PM) with a diameter less than 10 μm (PM10), inhalable fine particulates with a diameter of less than 2.5 μm (PM2.5), and Ultrafine particles (UFPs) with a diameter of less than 0.1 μm [22].
The chemical composition of PM includes substances correlated to toxicity and health; water soluble ions, metallic elements, and organic compounds such as dioxin [23]. Various parameters affect PM concentrations in the air, including local geographic conditions, meteorological conditions, and urbanization [24,25,26]. A study showed an 18% rise in asthma admissions correlated with a 10 µg/m3 increase in coarse particles on an admission day [27]. The World Health Organization (WHO) estimates 3.8 million annual premature deaths are as a consequence of environmental pollution, especially PM pollution [28]. There are multiple long-term and short-term effects of exposure to air pollution. Short-term effects include decreases in pulmonary function [29], increases in inflammatory markers [30] and respiratory symptoms, exacerbations of chronic obstructive pulmonary disease (COPD) and infections [31], and increased respiratory mortality [32]. Particulate pollution has been linked to lung and cardiovascular disease, and cognitive dysfunction in the elderly [33,34]. In children, long-term exposure to PM has been linked to low birth weight, a risk of respiratory infections, and wheezing [35,36]. Studies have linked air pollution exposure to systemic oxidative stress, which has an important role in neuronal system development [37,38,39,40]. Exposure to air pollutants has also been linked to diabetes, cancer, and allergies [41,42,43]. Particles with diameters of <10 µm (PM10) and <2.5 µm (PM2.5) have been shown to have a negative impact on health [44,45]. Diesel engine particles (DEP) induce the release of cytokines and chemokines involved in both innate and adaptive immune inflammatory responses [46].
Based on composition, two types of pollutants exist; gaseous compounds and particulate matter (PM). The gaseous compounds are ozone, nitrogen oxides (NOx), carbon monoxide (CO), carbon dioxide (CO2), VOCs, polyaromatic hydrocarbons (PAH) and heavy metals [47,48,49]. The Air Quality Index (AQI) is frequently used to express the state of air pollution and is used for assessment and management of air pollution [50]. An elevated AQI indicates high levels of pollution and the possibility of adverse effects on organisms [51]. Globally, most countries have set up emission standards regulated by national, regional, and state-level coordinating bodies. Acceptable interim targets for concentrations of PM10 and PM2.5 are provided by the World Health Organization (WHO) in air quality guidelines [28]. Elevated exposures occur in the near-field environment and the people most affected are pedestrians, people in nearby buildings, cyclists, and vehicle passengers [52]. Due to conflicting health and economic priorities, developing countries have made insufficient progress in controlling air pollution. Measurable health effects of unexpectedly low concentrations of particulate air pollution have been reported [53]. In developed countries, a constant effort to reduce air pollution to acceptable, safe levels is ongoing [47]. Internationally, different limits are set and enforced to ensure compliance with set limits of air pollutants. Even at low levels below current standards, air pollution may still have a negative impact on health [54]. Therefore, reductions in exposure to very low levels can still be expected to provide benefits [55]. Long-term studies in large cities have documented the characteristics of aerosols in relation to seasonal changes. A study in central China on aerosol characteristics and related radiative effects showed high relative humidity (RH), significant optical and microphysical characteristics, tropospheric wind circulation and aerosol radiative effect (ARE) varying between summer and winter and also with different haze conditions [56].
This study aimed to identify and comparatively characterize ambient air particles from sites adjacent to road vehicular traffic sites proximal to residential communities within Kano State. This facilitated a comparative evaluation of the nature, possible additional pollution sources, and direct cellular cytotoxicity in vitro. Therefore, generating country-level and region-specific information on emissions, air pollution, and health of communities in a population plagued by a paucity of data that affects evidence-based policy making and implementation. To the best of our knowledge, this is the first study that comparatively characterizes ambient aerosols and assesses their direct toxicity to cells in vitro in the study area. This study was conducted as part of a larger study on the effect of particulate emissions from transportation sources on the health of communities. Ethical approval was obtained from the Scientific Ethics Research Committee on Health and related research, Kano State Ministry of health, Nigeria (Ref No: MOH/797/T.1:1700) 30 September 2019.

2. Materials and Method

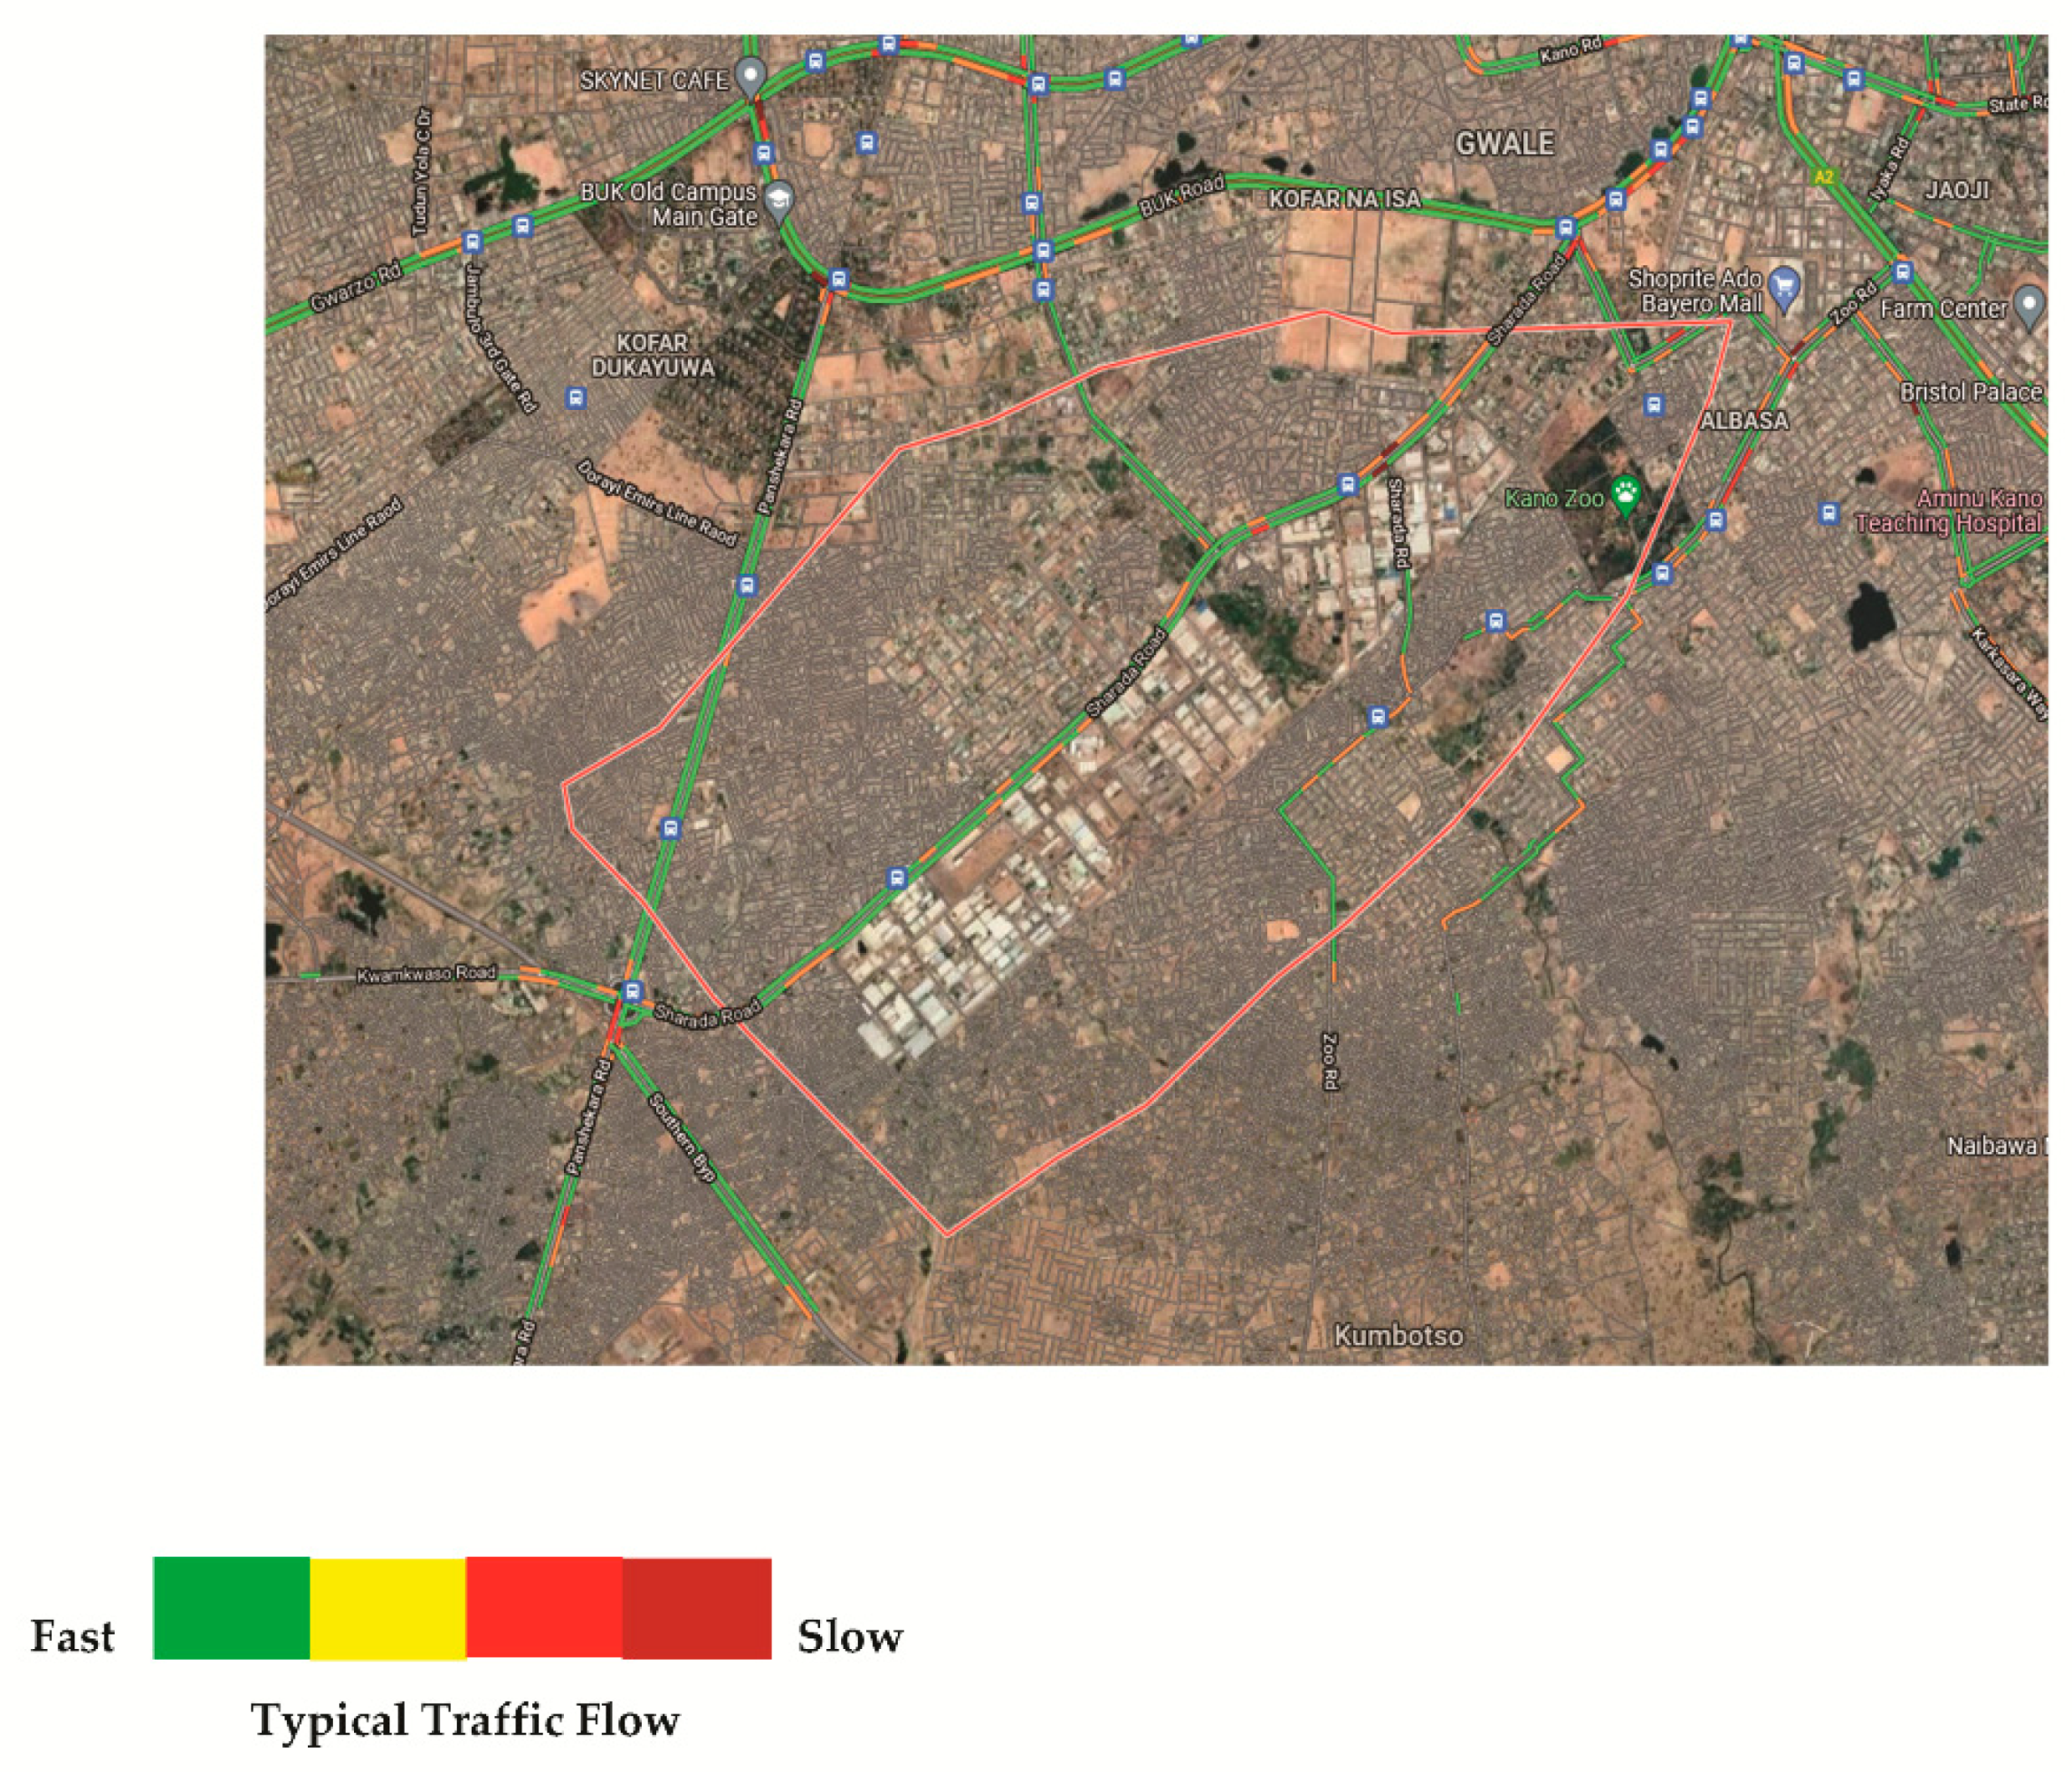
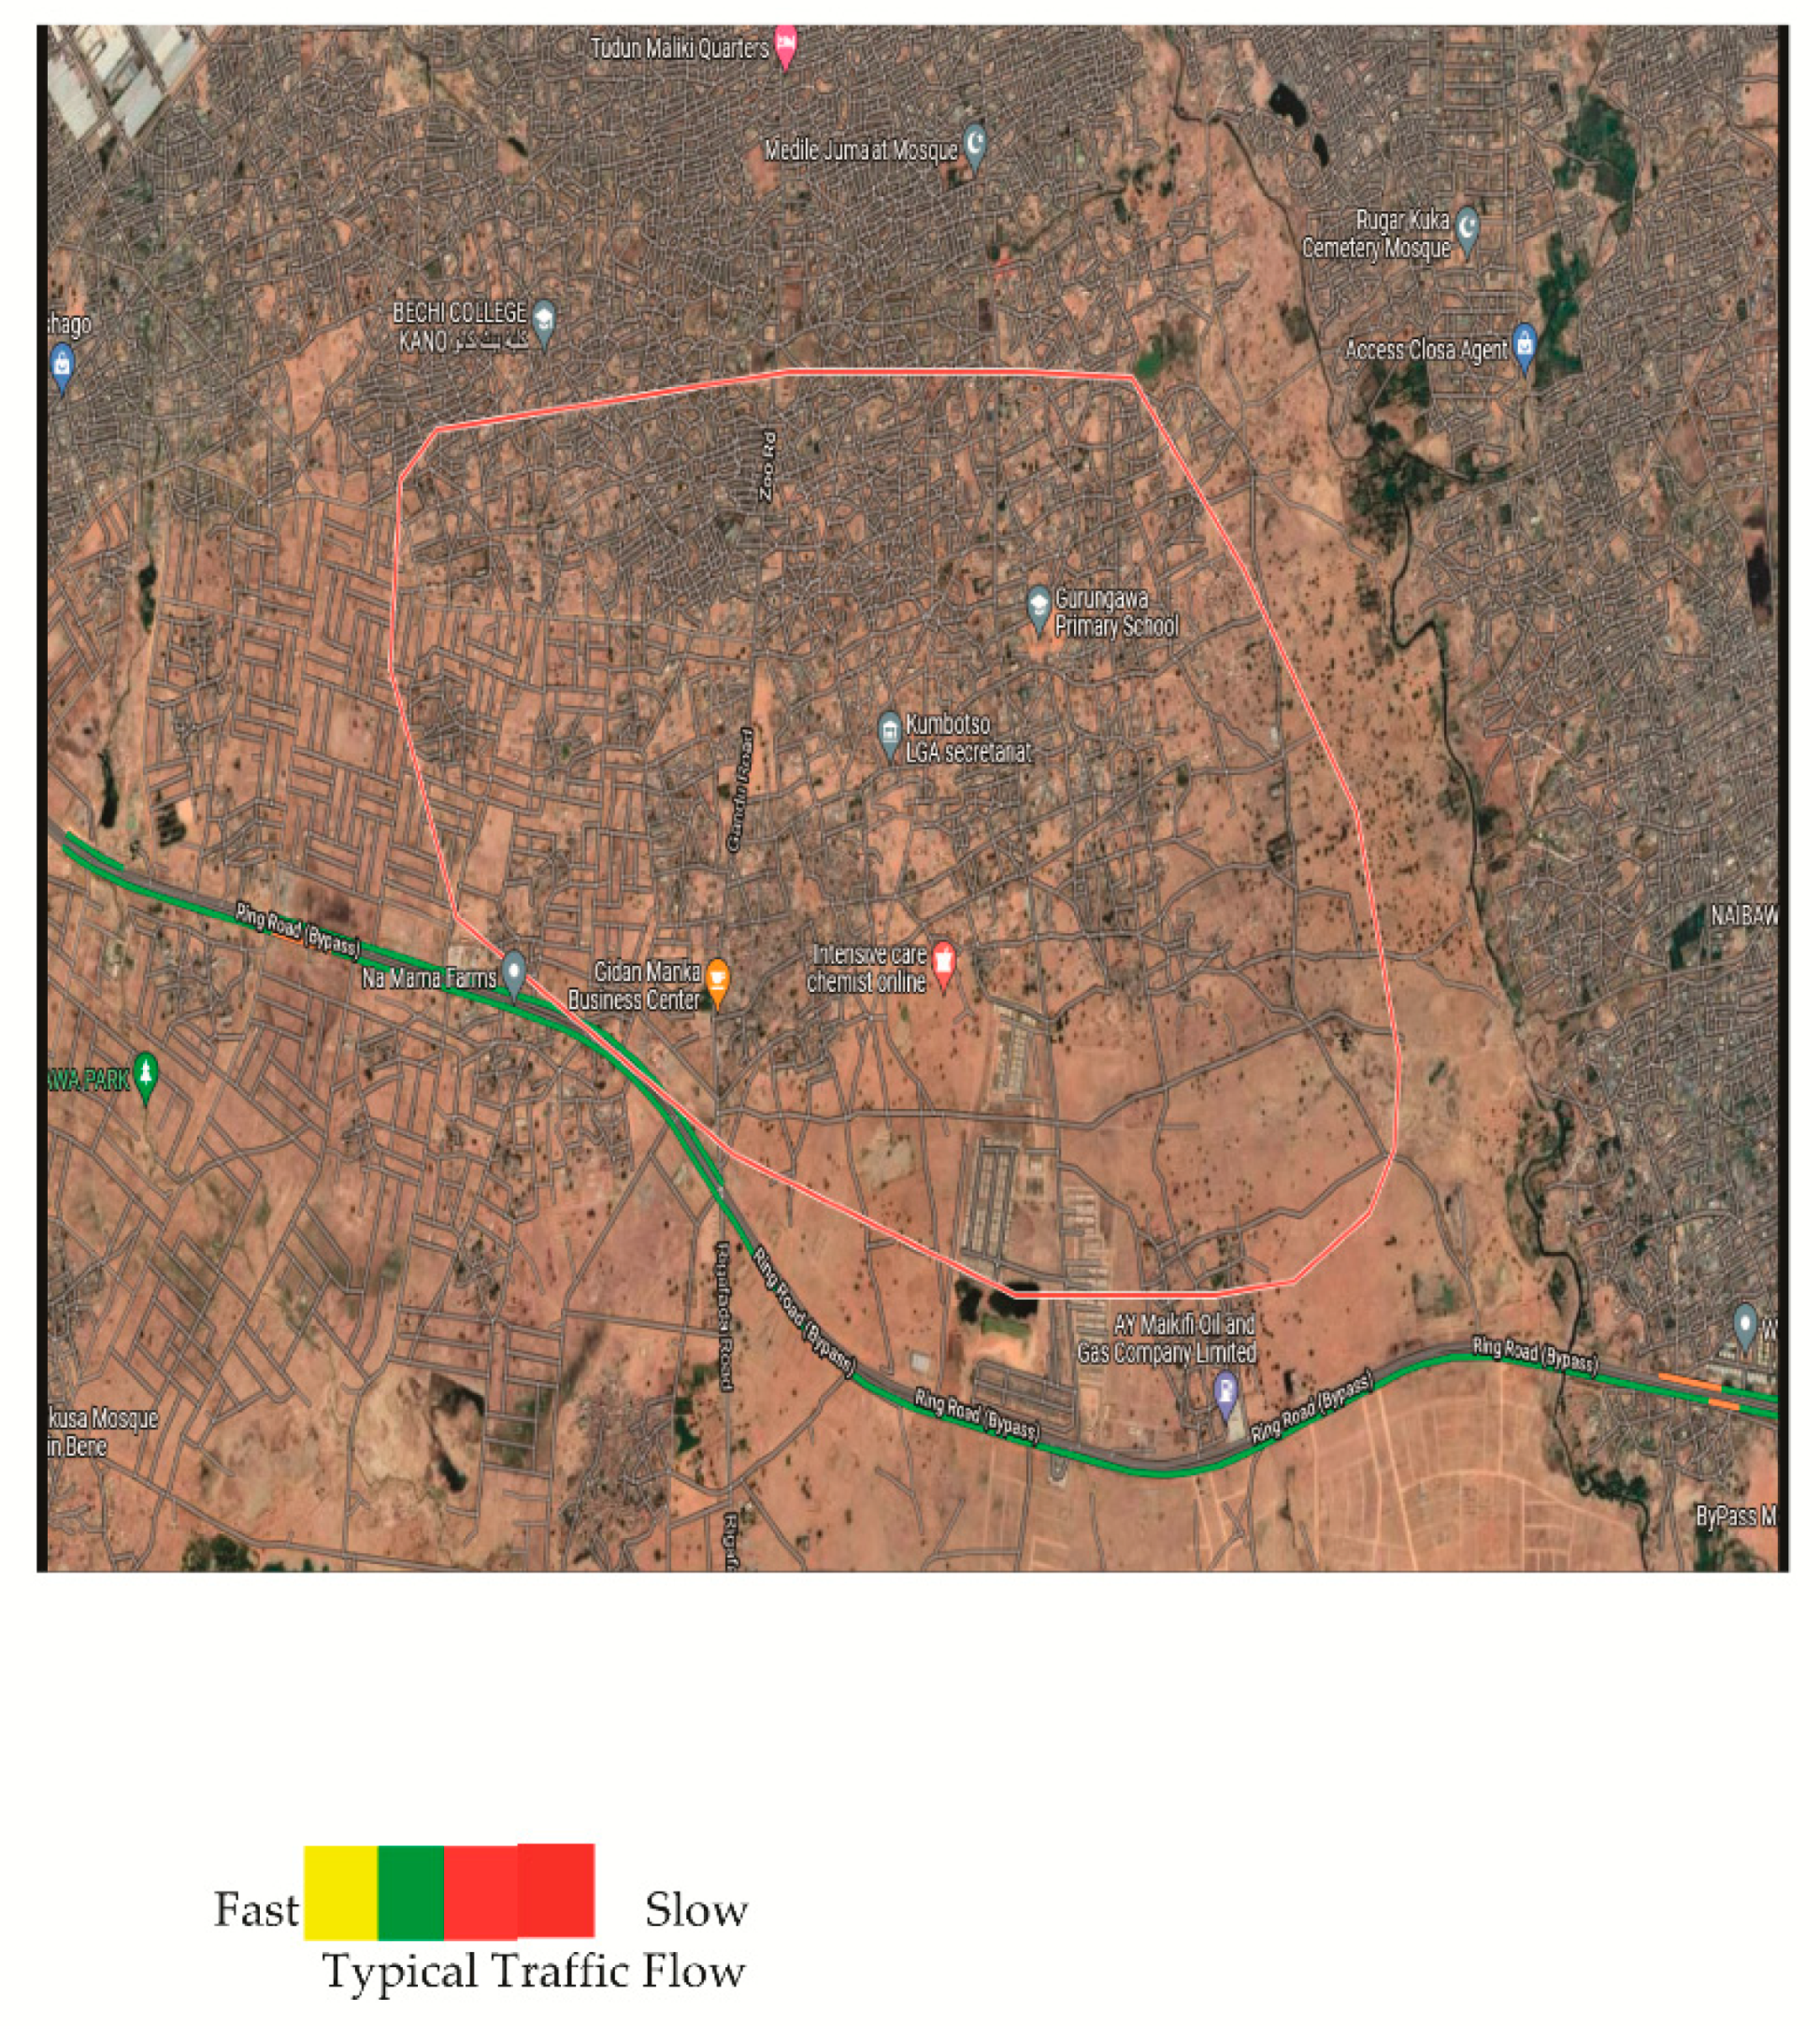
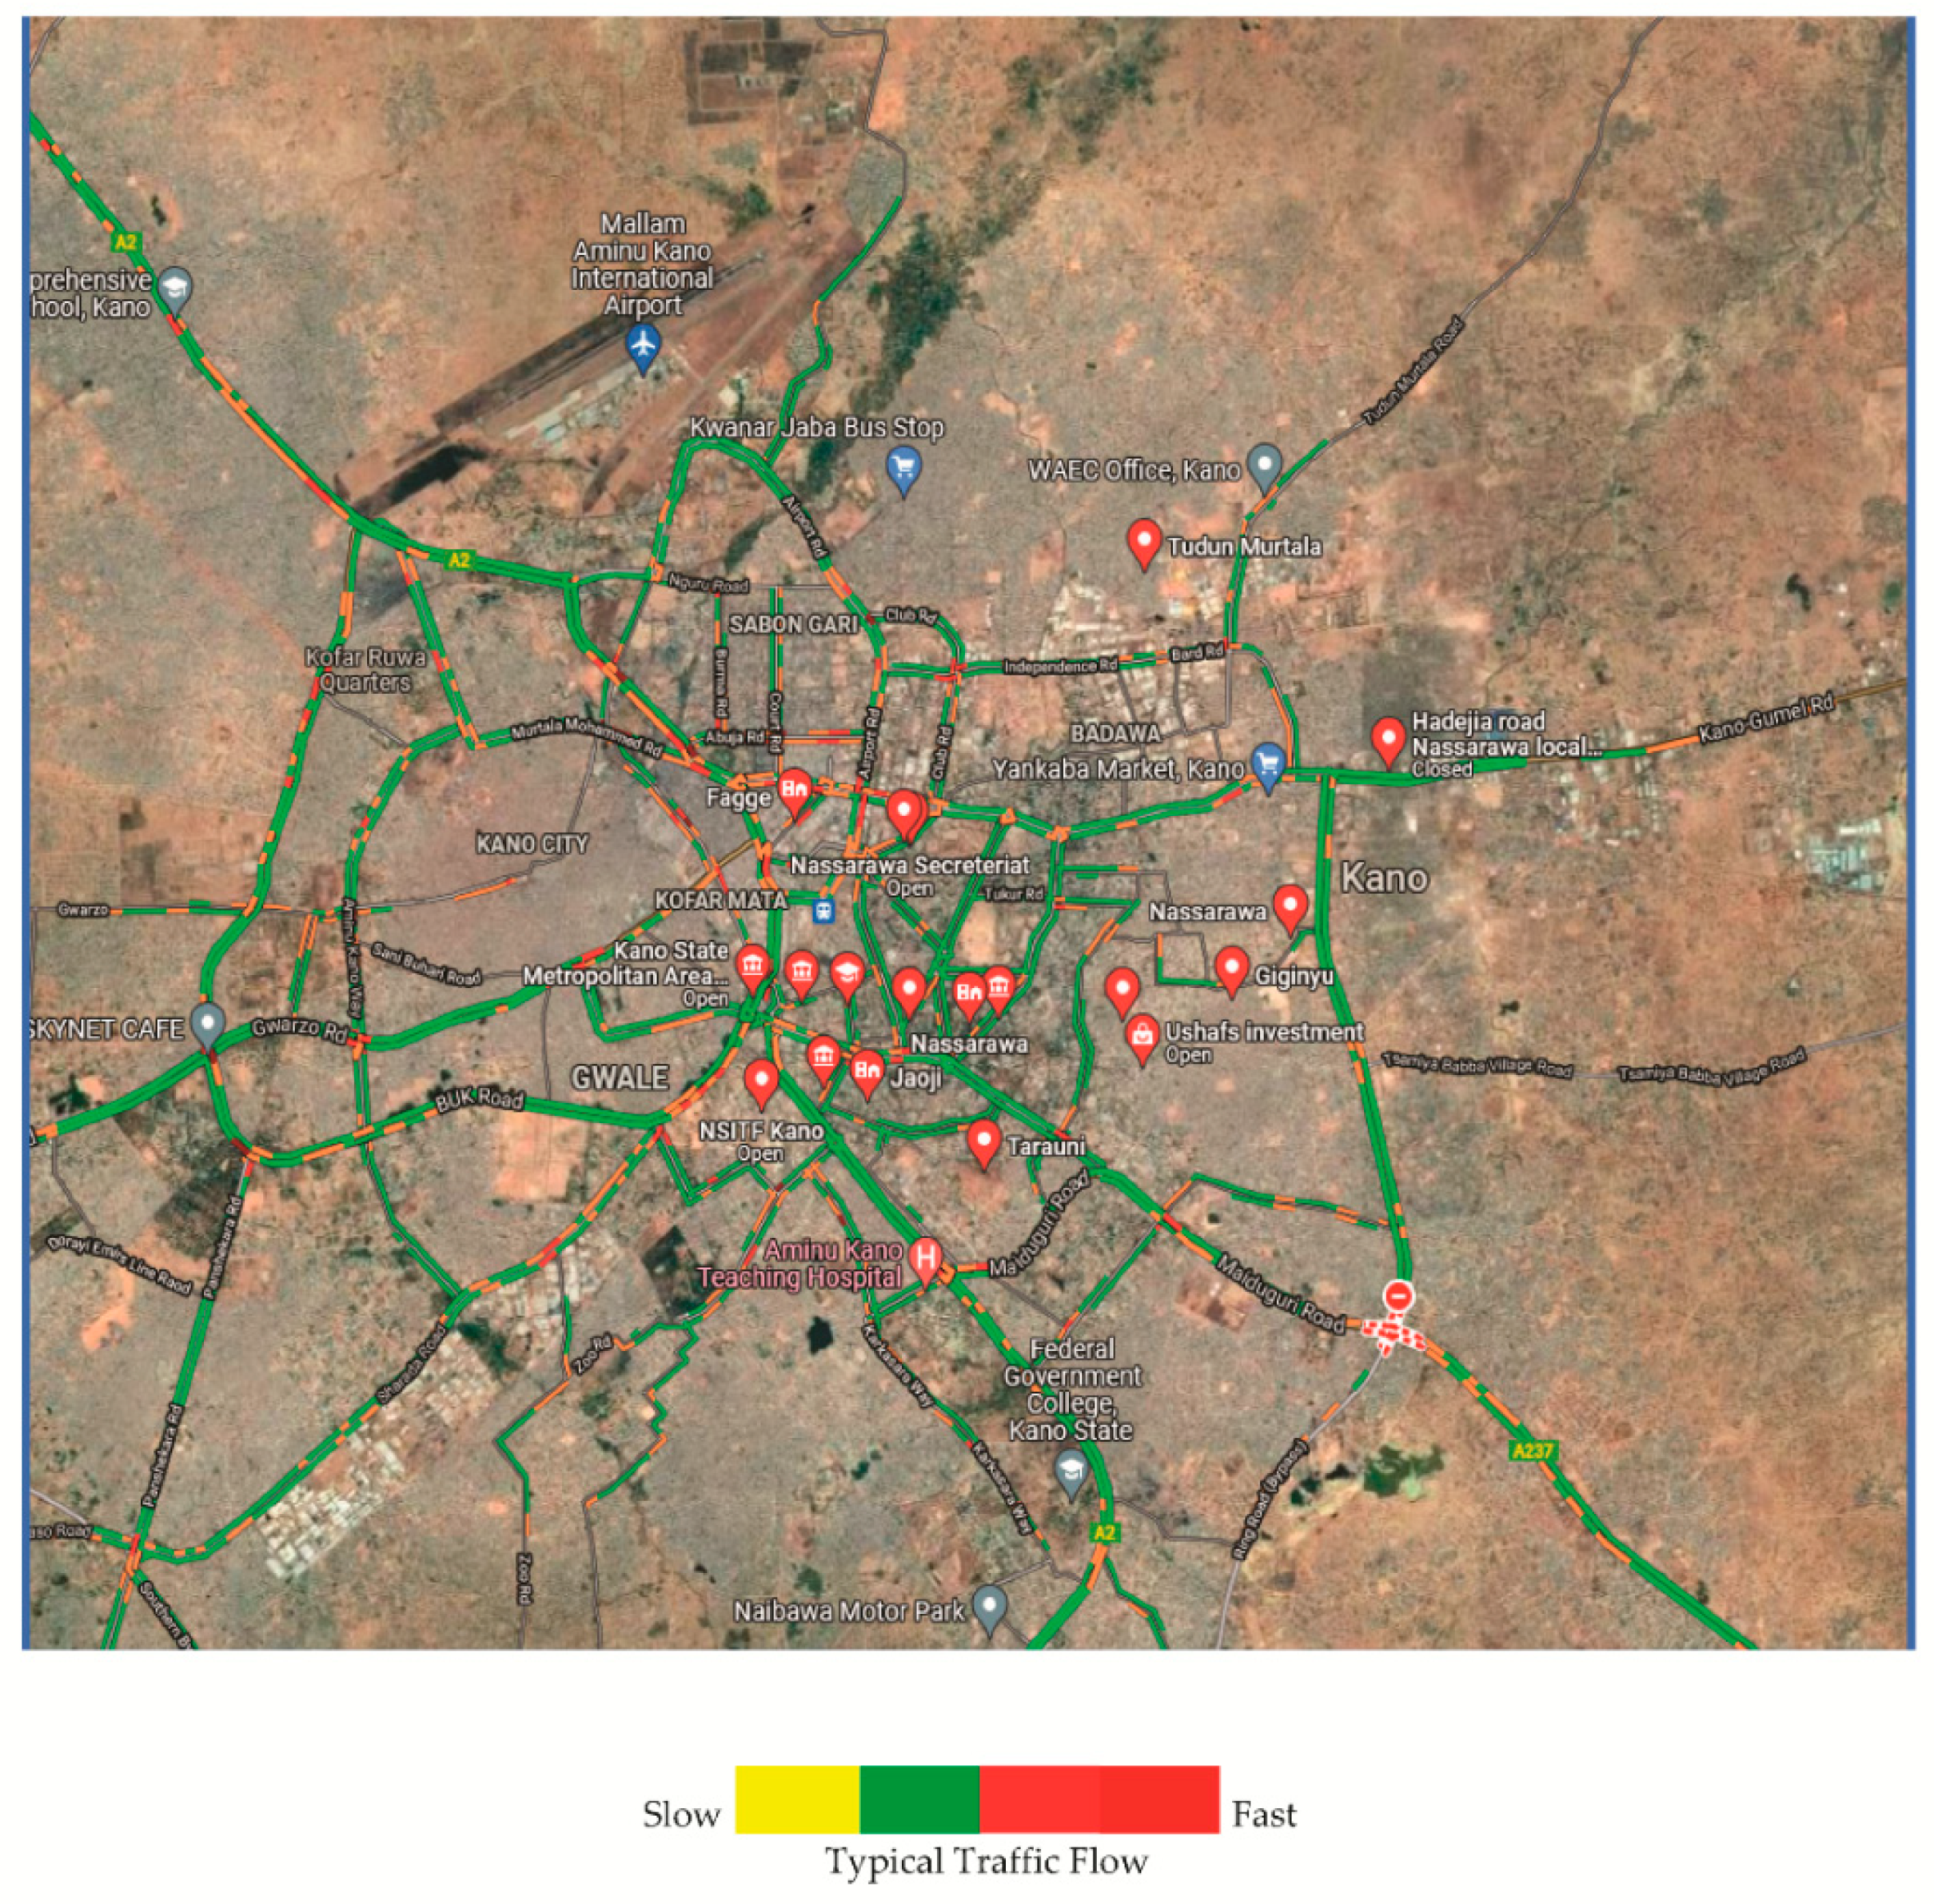
2.1. Background of Study

Kano State (Current Projected: 14,311,246) has served as the seat of an ancient empire (caliphate) and a center of commercial activities for centuries. Administrative distributions are into Local Government Areas (LGAs) classified mainly as rural or urban, with “mixed” used to describe a mixture of settlement types. It is located in north-west Nigeria, West Africa, and covers 20,131 km2. It is situated at 484 meters above sea level within the Sahel savannah region and experiences a typical savannah climate with an average of approximately 980 mm (38.6 inches) of precipitation annually. Frequent heat waves with average temperatures of 26.3 degrees centigrade (79.4F) and low humidity occur throughout the year. Variations in wind speed are significant and occur frequently, compounded by frequent sudden gusts of sub-Saharan dust from Northern Africa, known locally as the “Harmattan”. Typical average wind speeds are greater than 5.3 miles per hour between November and July each year, with higher values obtained during the dry season. The study LGAs vary in size and distribution of households; urban areas show clustered housing, while rural communities are characterized by widely separated households. The LGA sizes are Kano Municipal (17 km2), Nassarawa (5704 km2), and Kumbotso (158 km2). The selection of this study area is based on its population size, recorded vehicular density, and strategic location as a center for commercial activities and international trade. The study area is shown in Figure 1 below.

2.2. Air Sampling

Twenty-four (24) air samples were collected at 12 sites between February and March 2020, four (4) within each Local Government Area (LGA). The sites were identified using federal road safety corps (FRSC) traffic density records, which were classified as high traffic density (>50 vehicles/km/hr.) and low traffic density (≤50 vehicles/km/hr.) with associated residential areas sited close to roads. Appendix A Figure A1, Figure A2 and Figure A3 shows typical traffic flow in the LGAs. Sampling sites were selected based on differences in traffic density, nature of settlements, and the presence of emission sources such as road transportation vehicles, which may lead to the exceeding of air quality standards for safety. The location of specific sites, nature of traffic and identified pollution sources are shown in Table 1 below. Sample collection in all sites occurred during peak road traffic hours; mornings (8:00–10:00 am) and evenings (4:30–7:30 pm). The nature of the roads ranged from 4-Lane dual carriageways in high traffic density sites such as; the highway near Kumbotso village, Yankaba car park road, Kofar Mata area road, Central Mosque Area road, and Masalacin Alhaji Abba Road. Other sites sampled were characterized by 2-lane dual carriageways. The typology of road transport vehicles present at the sites varied from rural to urban sites. Figure 2 shows the distribution in the state. The majority of road transportation vehicles in the urban sites were commercial tricycles, followed by commercial buses. In rural communities, however, the predominant type of vehicle in use was motorcycles. The distance from collection points to the homes of residents in the nearby communities was measured in meters (m) for all settlements to ascertain proximity to the point of exposure to road transportation vehicles.
Sampling occurred over a 3 day period in all LGAs. Samples were collected using a self-assembled set-up based on a Peristaltic Electric Volumetric Pump, 3.4L/min, 24 V.c.c (Verderflex AU M380240 15), which is controlled by a mobile electronic system loaded with Bosch, 18V Li-ion battery carried in a backpack. This pump enables suction of airborne particles through the bifurcated tubing attached to the types of filter holders for syringes from Whatman (stainless steel and poly-sulfone, diameter 30 mm, height 26 mm, CarlRoth CC23.1 and CC19.1). In one of the filter holders, we included carbon adhesive discs (12mm in diameter, Agar AGG3347N) compatible with SEM-EDX analysis for use in microscopy. In the second filter holder we included a Millipore polycarbonate 0.2 µm pore size, hydrophilic polycarbonate membrane, 25 mm diameter (Merck Millipore TETP02500) compatible with culture cells.
Air samples were collected at a height of 3 m (due to the average height of the population and the need to avoid contamination by constant dust resuspension from unpaved side-walks) above ground level and at a flow rate of 2 L/min over 2 h. These collection parameters were chosen by calibration based on outdoor air sample collection in the city of Lyon, France, where enough particles were obtained with no recorded saturation of filters.
An RS-90 anemometer (Manufacturer RS 155-8899) allowed monitoring of temperature and wind speed at the time of collection. The temperature ranged from 26.2 to 45.3 °C at the time of sample collection and the wind speed was 1.02–9.40 m/s. For each collection site, we established possible emission sources in the communities, which included: agricultural activities (grain thrashing), plastic and bottling plants (in mixed settlements), cement dust, soil dust, motorcycle exhaust, petroleum exhaust, and vulcanizing stations in all LGAs (Table 1).

2.3. Scanning Electron Microscopy and Energy Dispersive X-ray Analysis

Scanning electron microscopy and energy dispersive X-ray analysis (SEM-EDX) were performed using environmental scanning and tungsten filament, with EDX coupled analysis (Oxford instrument, INCA software version 5.1. Two types of images were recorded on each sample “carbon adhesive discs” using low vacuum (LV) mode (30Pa pressure in the SEM chamber), the back scattered electron detector (BSE) set to a Z-contrast mode and working distance (WD) set at 10mm. A first image was taken at a magnification of ×80 to have an overall view of the quantity of particles. A second image was taken at 1200× magnification in the central collection area-the most heavily loaded with particles in order to perform an overall EDX analysis and identify the most prevalent chemical elements in each sample. An individual analysis of 1000 particles was conducted in the peripheral zone. This individual and automatic analysis was developed by Minapath using a microscope JE0L JSM-6010LV plus coupled with EDX spectrometry (EDS Oxford Aztec-DDI detector X MAXN 50. This analysis consisted of a pre-adjustment of the contrast images, so particles appeared clearly on a black background subsequently followed by several automatic images taken at a magnification ×10,000. For each particle, automatic detection of the contours and average automatic EDX analysis over the entire surface of each particle was done. The automatic analysis stopped when the particle counter reached 1000 and a table containing morphological and chemical parameters was generated.
An initial comparative analysis of the particles present on the same surface of the ESEM collect support was conducted. As a measure of size the equivalent circle diameter (ECD), which is the equivalent diameter of a circle with an equal aggregate sectional area used in the image processor, was obtained. To calculate the equivalent surface ratio (ESR) [58] the following formula was used to analyze particle elongation:
w = ( P [ p 2 4 π A ] 1 2 ) π
l = ( P w π ) / 2 + w
E S R = l / w
where the following parameters obtained from the output of SEM-EDX represent; P: Perimeter, A: Surface area and calculated values are interpreted as: Elongated particles [1.5 ≤ ESR ≤ 3], round particles [ESR < 1.5] and fibrillar particles [>3 ESR].
On complete analysis of particles in terms of size (ECD) and morphology (ESR) parameters using the software Kaleidagraph® v4.5.4 we obtained specific distributions at each site.

2.4. Particle Extraction for Cytotoxicity Studies

The polysulfone filter holders sealed with paraffin tape were opened under sterile conditions and placed entirely into 60 ml of 95% pure ethanol contained in separate labeled containers by site; site 1–12. The sealed containers with the contents were sonicated twice for 15 min, partially immersed in a pure rose water bath. The ethanol was further completely evaporated under nitrogen flow. The quantity of particles thus extracted was precisely measured using a precision balance (0.0001 gram). A minimum volume of ethanol (to assure their complete re-solubilization) as well as Dulbecco’s Phosphate Buffered Saline (DBPS) containing 1% Penicillin/Streptomycin in order to obtain a final particle percentage concentration of 1µg/µl of particles in DPBS containing 1% EtOH.

2.4.1. Cell Culture

In order to evaluate the effect of air particles on cellular viability, raw 264 macrophage cell lines (1 mL) from ATCC were used. The cells were seeded in culture plates with 96 wells (depending on the study) in Dulbecco’s modified Eagle’s medium (DMEM high Glucose), enriched with 10% of heat activated Fetal Bovine Serum (FBS) and 1% Penicillin + Streptomycin. These were then placed in an incubator with controlled temperature and CO2 (37 °C, 5% CO2). On reaching 80% confluence, the cell medium was replaced by a fresh one containing extracted particle pollutants. The final concentration of the particles was 100 µg/ml (mass/volume), with appropriate controls (cell media containing 10% DPBS and 0.1% EtOH). Further MTT and DAPI staining were used to assess the effect of air particles on cellular viability after 24 h of incubation.

2.4.2. 3-(4,5-Dimethythiazol-2-yl)-2,5-Diphenyltetrazolium Bromide Testing

ThermoFisher® (Thermo Fisher Scientific, Waltham MA, USA) 3-(4, 5-dimethythiazol-2-yl)-2, 5-diphenyltetrazolium bromide (MTT) testing (ref V13154) was used to assess cell viability, which is based on the conversion of tetrazolium salt into a purple Formazin product [59] For this, the cells were seeded into a 96-well plate and allowed to reach 80% confluence. After 24 hours of incubation with 100 µg/mL particles, the media was removed from the particle inoculated cultured cells and replaced with 100 µL of fresh media. Then 10 ml of 12 mM MTT stock solution was prepared by adding 1ml of sterile PBS to one 5 mg vial of MTT and mixed by vortexing, added to each well. The cells were then incubated at 37 °C for 4 h; subsequently, 100 µL of the SDS6HCL solution was added to each well, and then mixed thoroughly with a pipette. A humidified chamber was used to incubate the microplate at 370 °C for 4 h. The absorbance was recorded in triplicate at 570 nm using a Biotek® (BioTek Instruments, Inc., Winooski VT, USA) Micro-plate reader after automatic gentle shaking. The experiment was performed in triplicate and site-specific means and confidence intervals were compared at a 95% confidence interval.

2.4.3. Cell Fixation and Staining using 4′, 6-Diamino-2-Phenylindole

Cellular viability was also estimated by using membrane integrity based on 4’,6-diamino-2-phenylindole (DAPI) staining, a cell permeable nucleic acid stain [60]. Cells were seeded into 24 wells as previously described. After a 24 h incubation with air particles (a concentration of 100 µg/mL), the cells were washed three times with DPBS and fixed with 4% paraformaldehyde in PBS for 10 min. The cells were further abundantly washed with DPBS and stained using DAPI 1/1000 in PBS for 15 min; coverslips were then used to seal the slides with flouromount media. Slides were kept in the dark for 30 min before image acquisition using fluorescent microscopy using a Zeiss confocal microscope® (ZEISS, Jena, Germany).

2.4.4. Fluorescence Microscopy

A Zeiss microscope equipped with an LSM700 confocal head and a 405nm laser at objective W N-Achroplan 63×/0.9 M27 (df = 2.4 mm). Three to five images were recorded for each sample, maintaining the same acquisition settings. The images were further treated using the Image J program® 1.8.0_172. Approximately 40 cells/image were analyzed for DAPI intensity. The percentage of non-viable cells was determined by the ratio of highly intense DAPI-labeled cells (saturated fluorescence).

3. Results

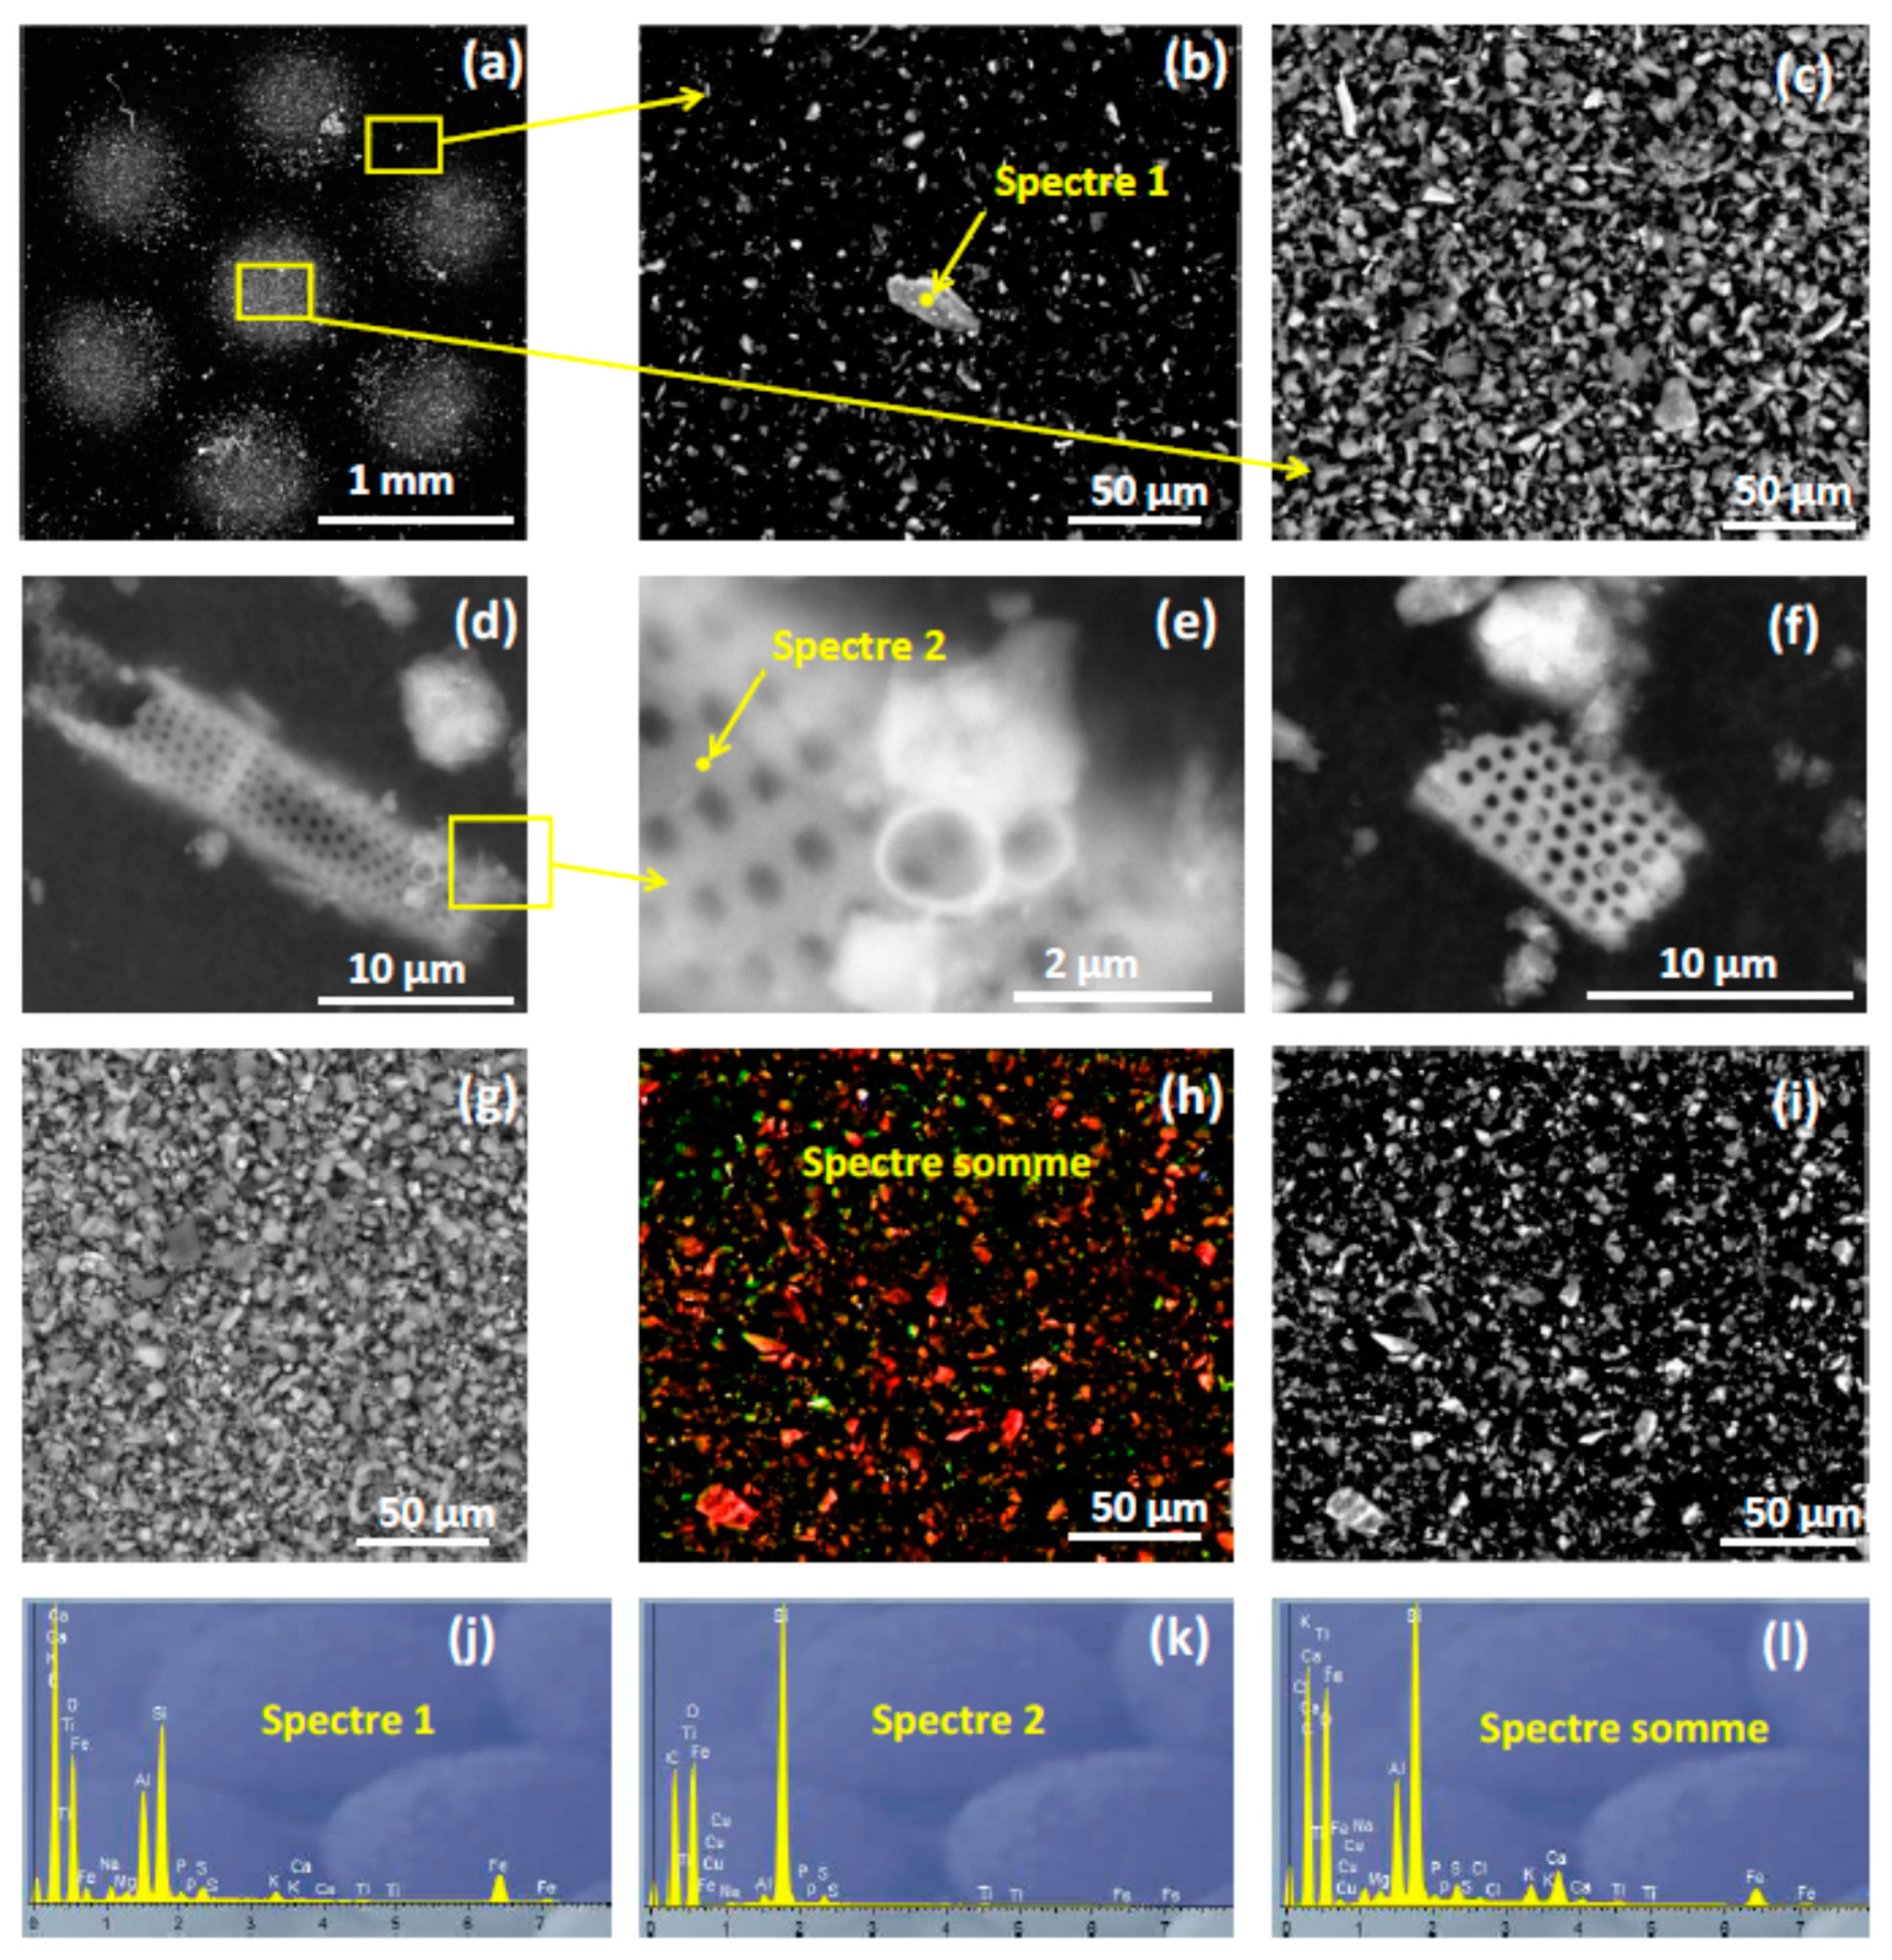
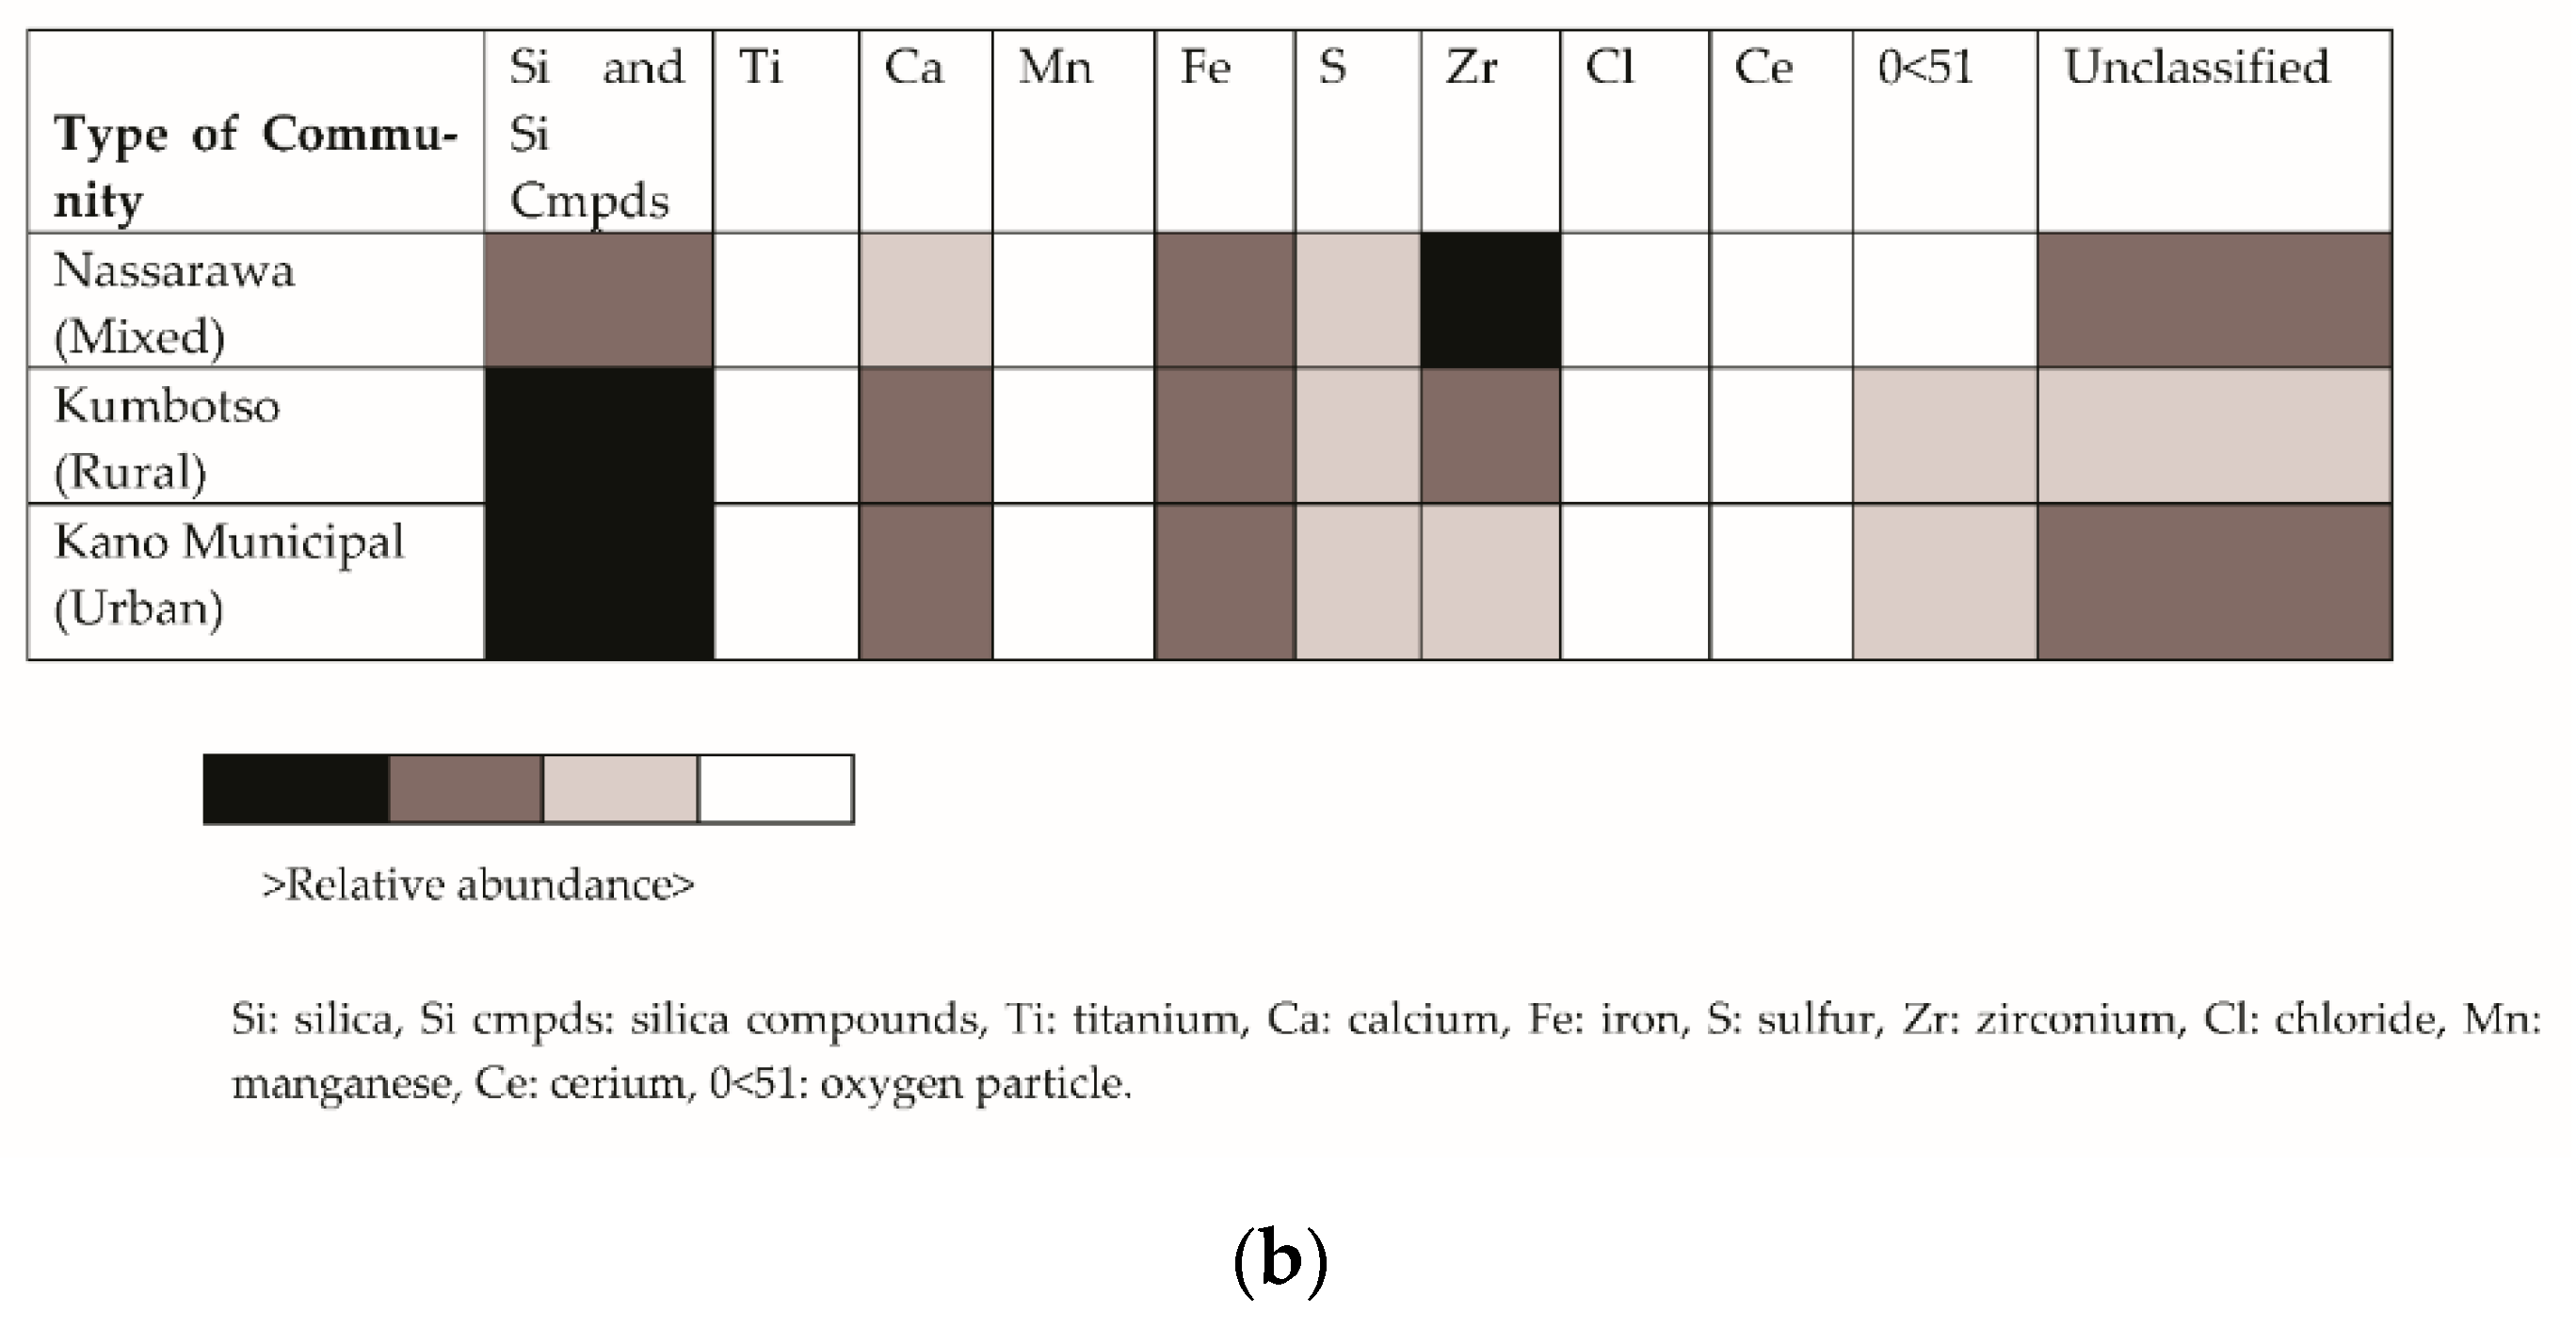
3.1. Scanning Electron Microscopy and EDX Results

Figure 3a shows the SEM overall appearance of the carbon adhesive discs. A large particle in the peripheral zone is highlighted in Figure 3b. The central areas are seen in Figure 3c,g,i with high particle saturation. Figure 3d–f show multiple views of Si wicks which are common in construction sites (used for insulation). At urban roadside sampling sites, larger silicone wicks were identified, with a reduction in size (Figure 3f) seen in rural sites. The images SEM-EDX of the central areas (concentrated with particles) of the carbon collecting discs show similar aspects in urban and rural areas, while mixed areas (Figure 3h) show a predominance of Si-based mineral elements (in red) over organic elements (carbon sand). The EDX sum spectrum (Figure 3l) consists mainly of inorganic particles, particularly silicone (Si), aluminum (Al), and calcium (Ca). These elements can come from sand particles (spectrum 1—Figure 3j) or silicon fibers (spectrum 2—Figure 3k). Saharan sand particles are known [61] to consist of calcite, quartz, and iron-rich particles. Therefore, these sand particles can have sizes ranging between a few hundred nanometers and can contain Si, Al, Fe, Ca, Mg, K, Na, Mo, Sr, Zr and it will therefore be difficult to differentiate them from particles like silicon fiber. In order to be able to differentiate these two compounds, we carried out a more complete size and morphology analysis by analyzing 1000 particles on each peripheral zone of each carbon adhesive discs. For this we used the individual SEM-EDX analysis and automatic which allowed us to go back for each site to the parameters of: size (equivalent circle diameter ECD), shape (equivalent surface ratio ESR) and EDX elementary composition for each particle. Thanks to the automatic recording of the position of each particle, we were also able to obtain the scanned surface in order to obtain 1000 particles. This allowed us to plot Figure 4 which gives us in addition to the particle size distribution, a rough estimate of the particle concentration per mm2 for each type of site.
A total of 12,313 particles were seen on scanning electron microscopy from all sites, with the highest number of particles, 33.4%, in mixed settlements. Figure 4 below illustrates a Gaussian showing the main size of particles as 0.5 µm to 3.0 µm. Notably, larger-sized particles were scarce in all sites, with a marked reduction in particle number at ≥5 µm.
In Figure 5 and Figure 6 below, site-specific histograms are shown, illustrating the size distribution using ECD and morphology using ESR. The distributions show a peak number of particles between 1.5 μm to 2.5 μm (ECD median value of the histogram), with more guaranteed values present more or less often in the sites.
A review of the total particle structure from all sites (rural: sites R1–R4, mixed: sites M1–M4 and urban: sites U1–U4) in Figure 7 depicts a predominance of non-fibrillar particles of up to 75%, despite the prevalence of a high number of fibrillar particles in all sites.
In order to more precisely classify the particles according to their chemical nature, we have grouped the particles according to their own basic chemical composition into 4 categories: silicone (Si) based fibers (particles with an ESR value greater than 3 and containing Si), other fibers (particles with an ESR value greater than 3 and without Si), sand: (particles with an ESR value smaller than 3, ECD greater than 1, and containing Si, Al, Fe, Ca, Mg, K, Na, Mo, Sr, Zr) and lastly, non-sand non-fibres. This enabled the confirmation of strata-specific differences between settlement types. The findings shown in Figure 8 revealed higher values of non-sand non-fibres. This is why we have looked more closely at the elementary chemical composition of these particles and we have found that the majority contain sulfur, a chemical element which may be linked to the combustion of transport. This is why we have transformed this class of particles into an applied class of “other particles” (S, Si, Fe, Mo, Zn, and other metals). The values encountered for sand are largely attributable to the north-easterly Harmattan winds, characterized by dust storms that occur in the region during the dry season.
High percentages of sand particles were recorded in all sites sampled near roads, in both high and low traffic density locations (see Figure 8a). In the urban sites, the bulk of the identified particles have values ranging from 34 to 51%. Mixed sites showed values of 30–41% and rural settlements 41–51%.
Differing values for this category are attributable to vegetation cover, building heights, and wind speed, which affect particle dispersion over land areas. The major identified source of this particle group is the dust-laden Harmattan winds, which characterize the dry season in Northern Nigeria. Re-suspension of road dust has also been linked to calcium (Ca) levels at roadsides. Additionally, elements in this group have been identified in tyre pavement generated particles and non-exhaust emissions. Non-exhaust emissions originate from abrasion and re-suspension sources. Re-suspension includes corrosion of vehicle components, mechanical processes of driving, brake and tyre wear, and re-suspension of road dust from road wear [62].
Silicone-based fibers: In samples analyzed by SEM-EDX at all sites 23–34 percent of fibrillar particles with a silicone base were identified. Although silicone parti-cles are usually non-fibrillar, our results indicate the possibility of meteorological conditions prevalent in the study area, including high temperatures and low humidity, resulting in the formation of such secondary particles. An additional source of these particles is industrial emissions. A cement factory, a bottling plant, a plastics factory, and a wood processing plant were located in the mixed settlement. The distance between these industries was greater than 100 m from the air sampling sites. In the urban site, values ranged from 25–34%, in the mixed site, 23–34%, and in the rural site, 24–31%.
Other fiber particles: Iron (Fe), sulfur (S), molybdenum (Mo) and zinc (Zn) very low percentage (0–3%) in all sites. Fibres grouped here have been linked globally to transportation origins in source apportionment studies.
Non-sand and non-fiber particles: these particles contain S, Si, Fe, Mo, Zn, and Zr with an ECD of <1 µm. Heavy minerals like zircon have been identified as sources of aerosolized zirconium particles [63], but these particles have an ECD greater than 1µm and we have counted them in the sand particle category. High levels are recorded in areas associated with open quarry activities and ongoing construction, which characterize the urban landscape of metropolitan areas in Kano State. The brake parts of old and expended vehicles commonly used for public transportation [57] also release zirconia powder, which is used to modify the friction coefficient and reduce brake pad wear [64]. Particles from road transportation vehicles, exhaust and non-exhaust, are also contained in this category. Values obtained ranged from 22–37% in urban areas, 29–40% in mixed areas, and 22–29% in rural areas.
On precise analysis of 1000 particles per collection site for PM < 2.5 µm Figure 9a, silicone compounds, predominantly aluminum silicate and zirconium (Zr), are the highest in mixed settlements. Urban settlements revealed a higher abundance of silicone compounds and calcium (Ca). Zirconium was most abundant in PM 2.5–10 µm in mixed settlement, while Si and silicone compounds were more abundant in rural and urban areas. Other identified elements, Ca, Ce, Cl, Fe, Mn, and Ti, showed moderate to minimal abundance in all sites. At lower particle sizes of <2.5 µm unclassified particles were higher in rural sites, while larger sizes of 2.5 µm–≤10 µm showed more unclassified particles in urban and mixed sites.
In Table 2 below, the distance from roadside air sampling sites in all settlements showed a mean value of less than 50 m. The lowest values were recorded in the mixed settlement, where in the commercial car park also residents were living in direct contact with road transportation vehicles.

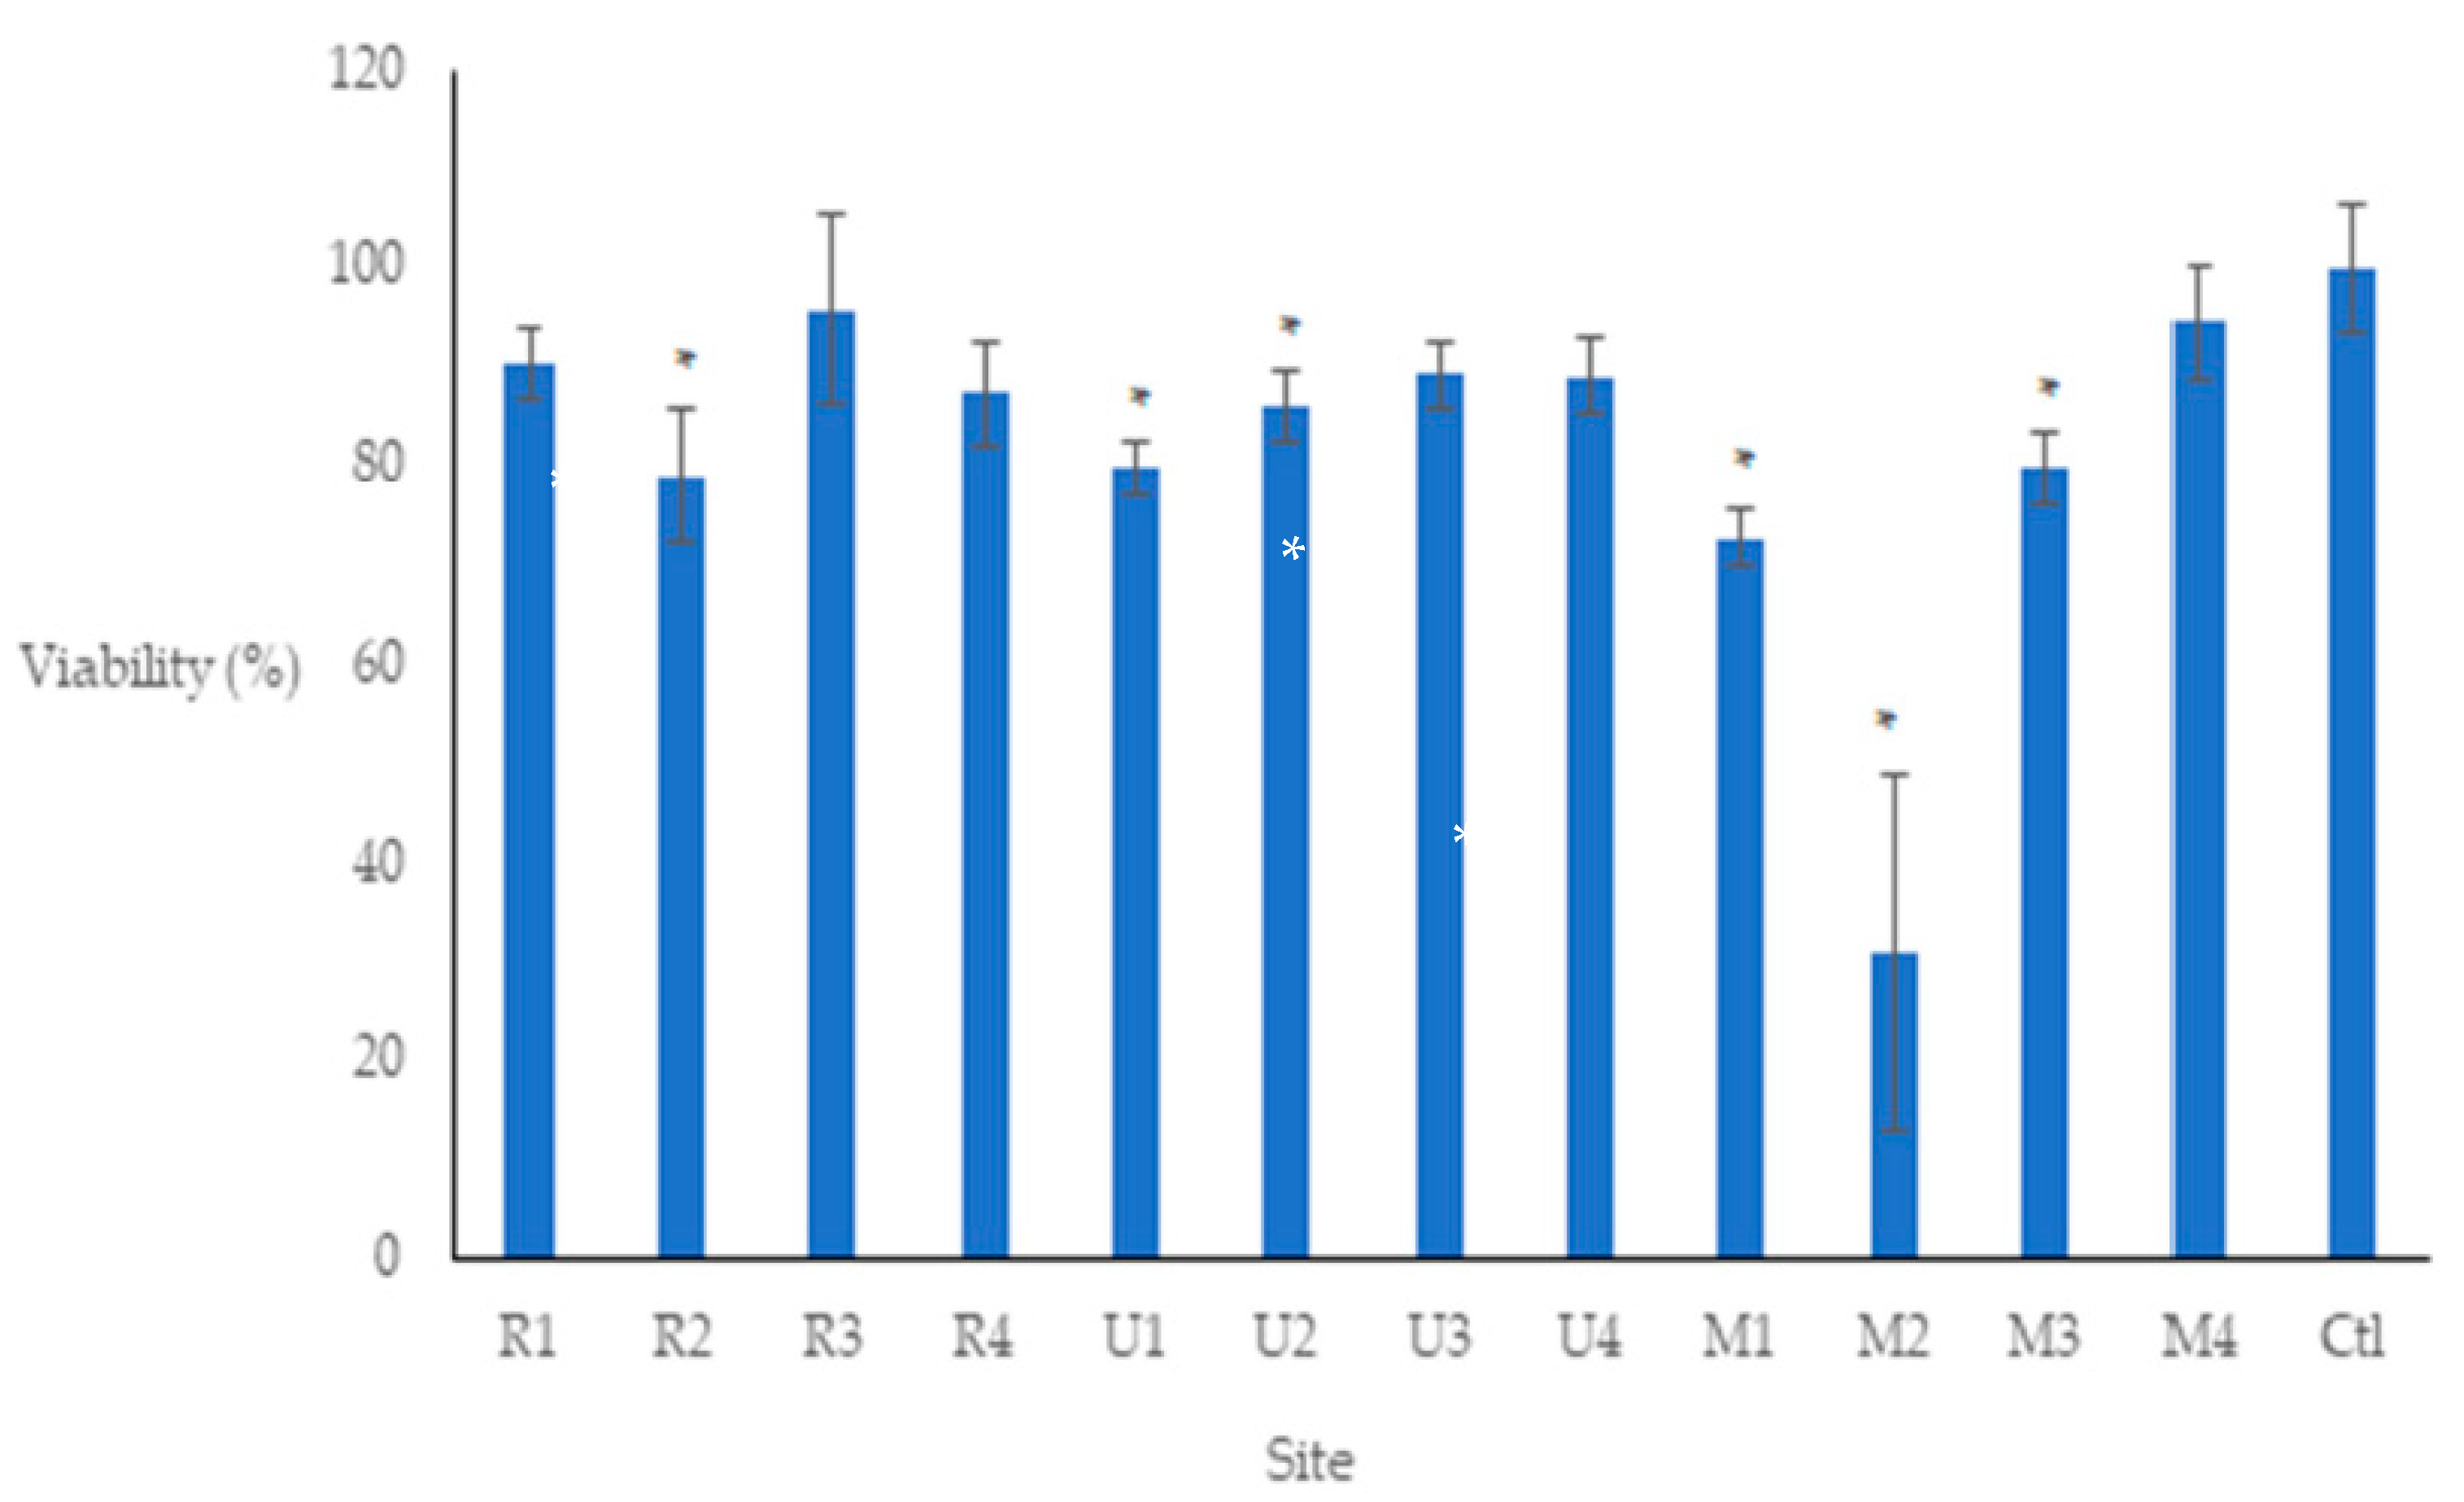
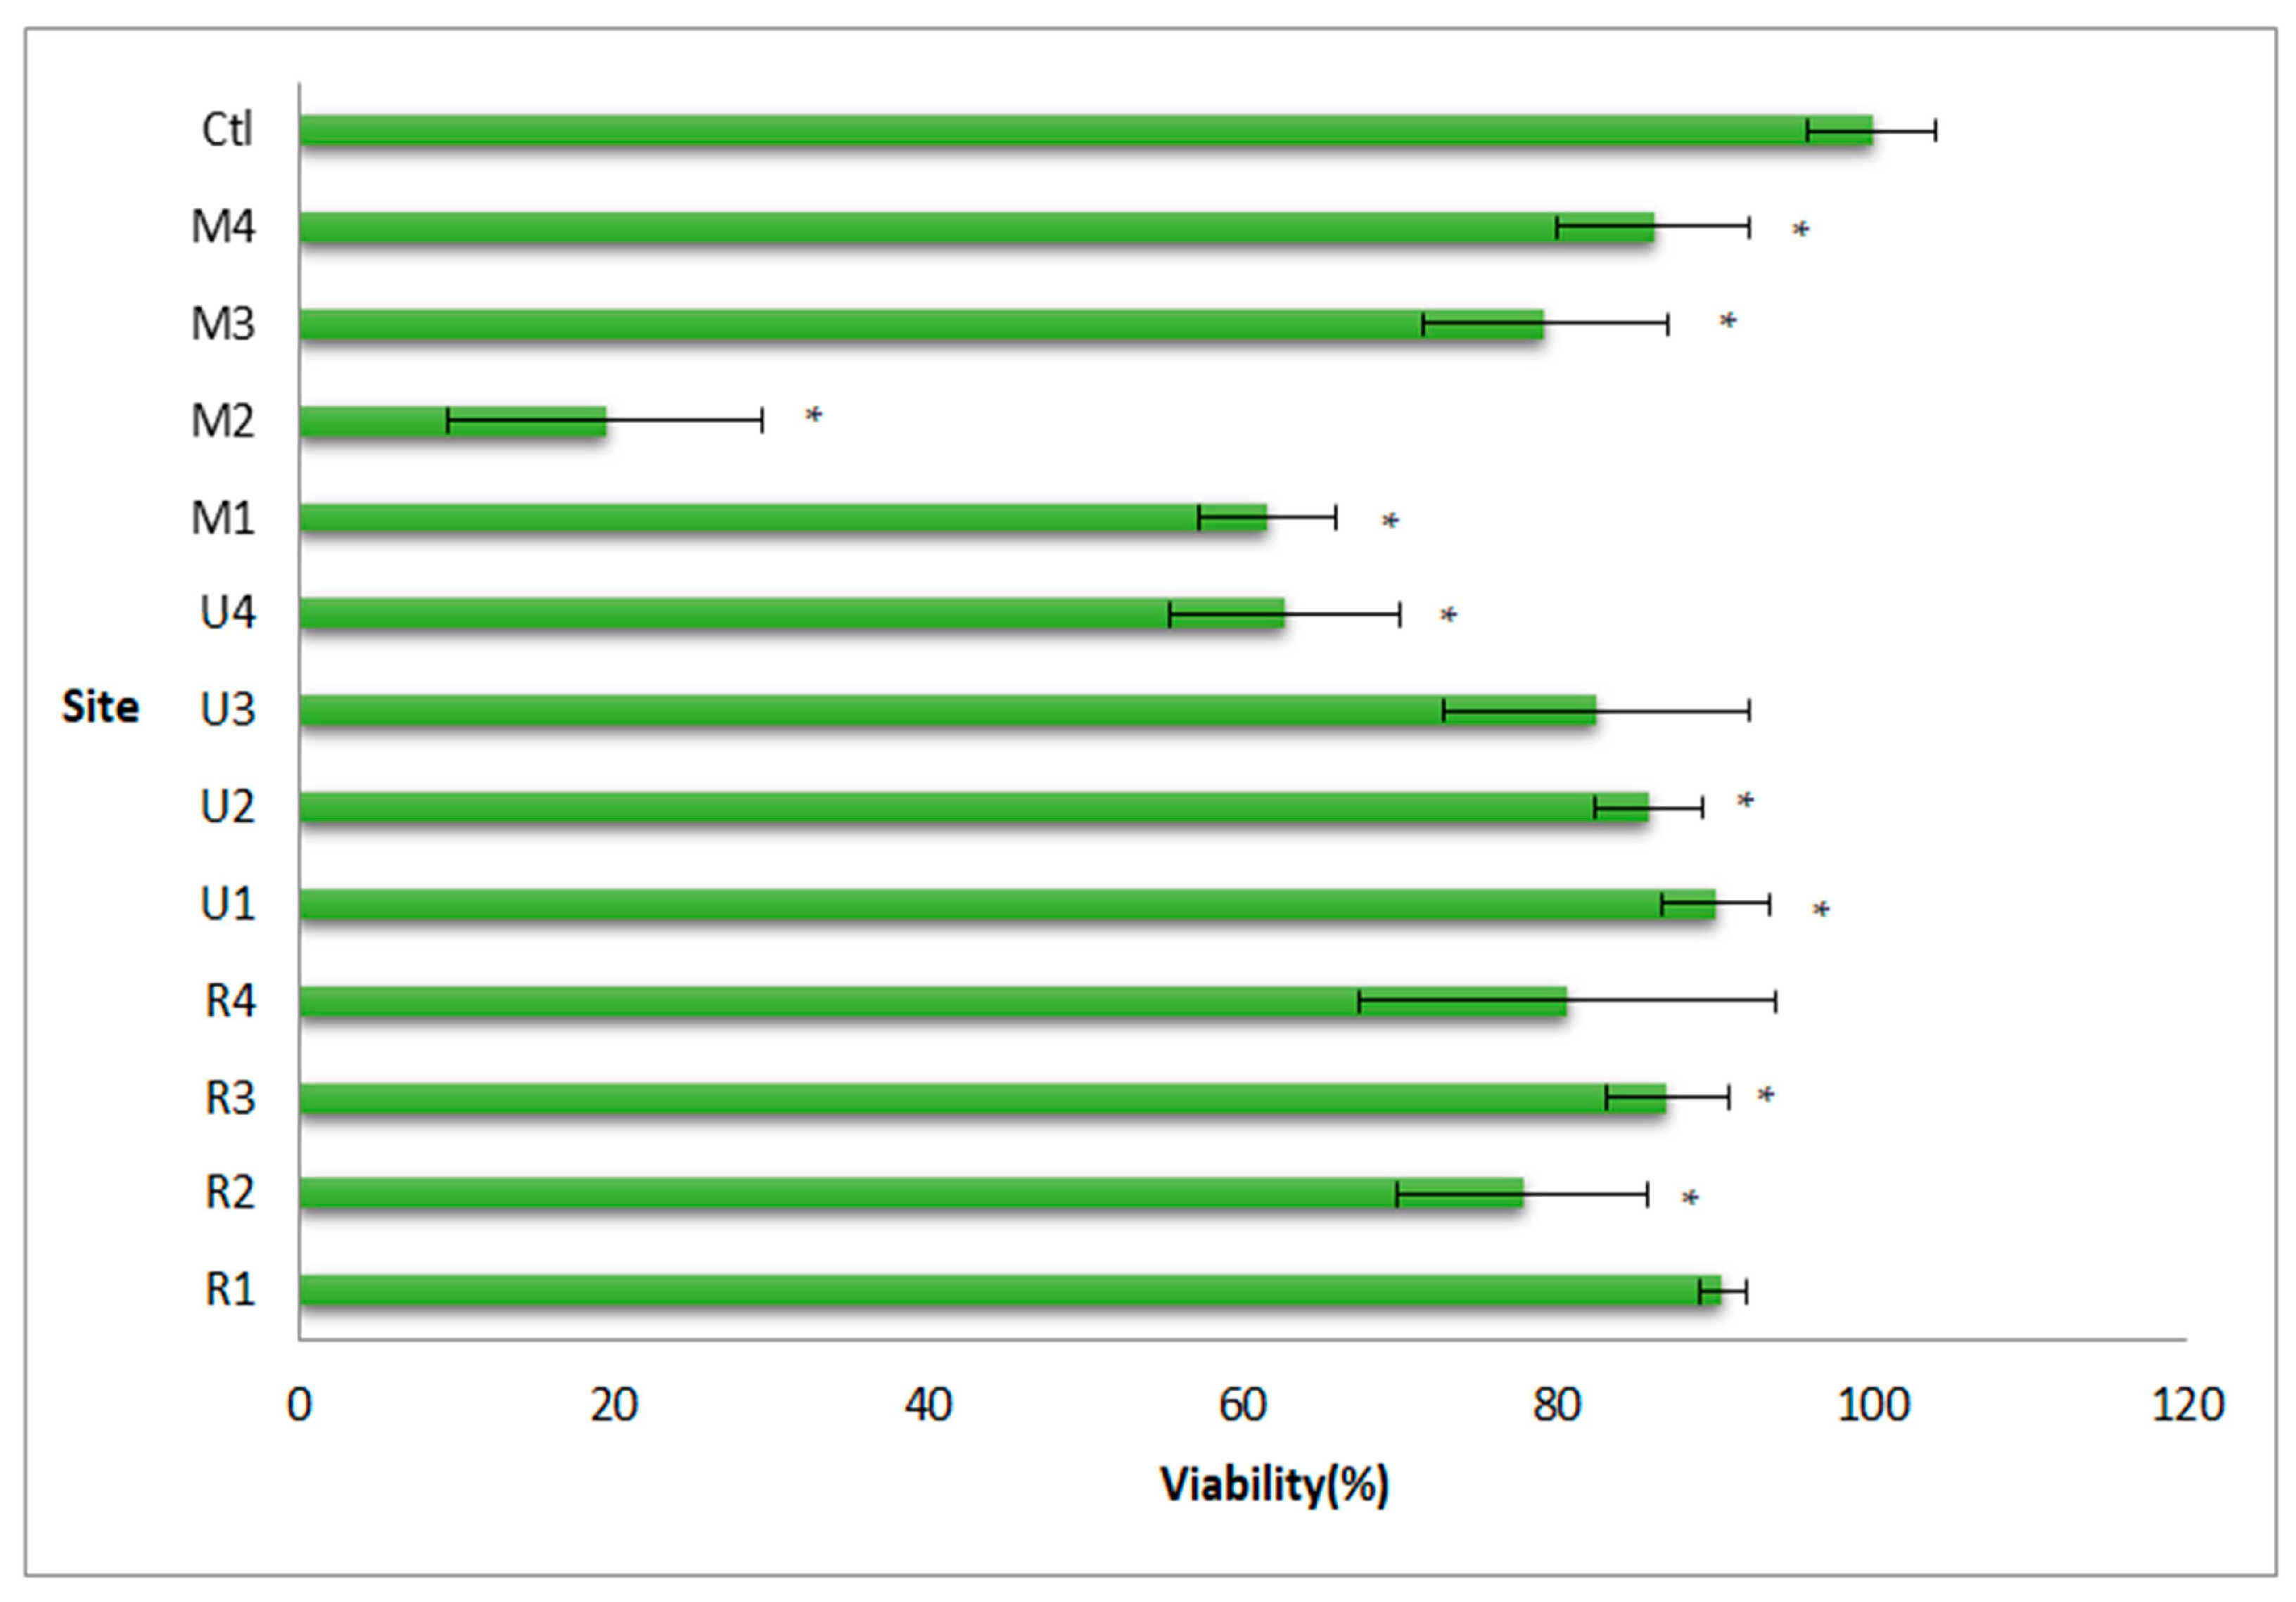
3.2. The Result of the Cytotoxicity Assessment by the MTT Assay

MTT test results Figure 10 below, conducted in triplicate, showed significant cytotoxicity in mixed settlements M1, M2 and M3, especially site number M2 (commercial motor-park), characterized by the lowest values of absorbance. Other settlements also showed evidence of cytotoxicity as shown by significant p-values (<0.05) on Student t-tests. These values, though not lower than in mixed sites, were evident in rural site R2 and urban sites, U1 and U2.

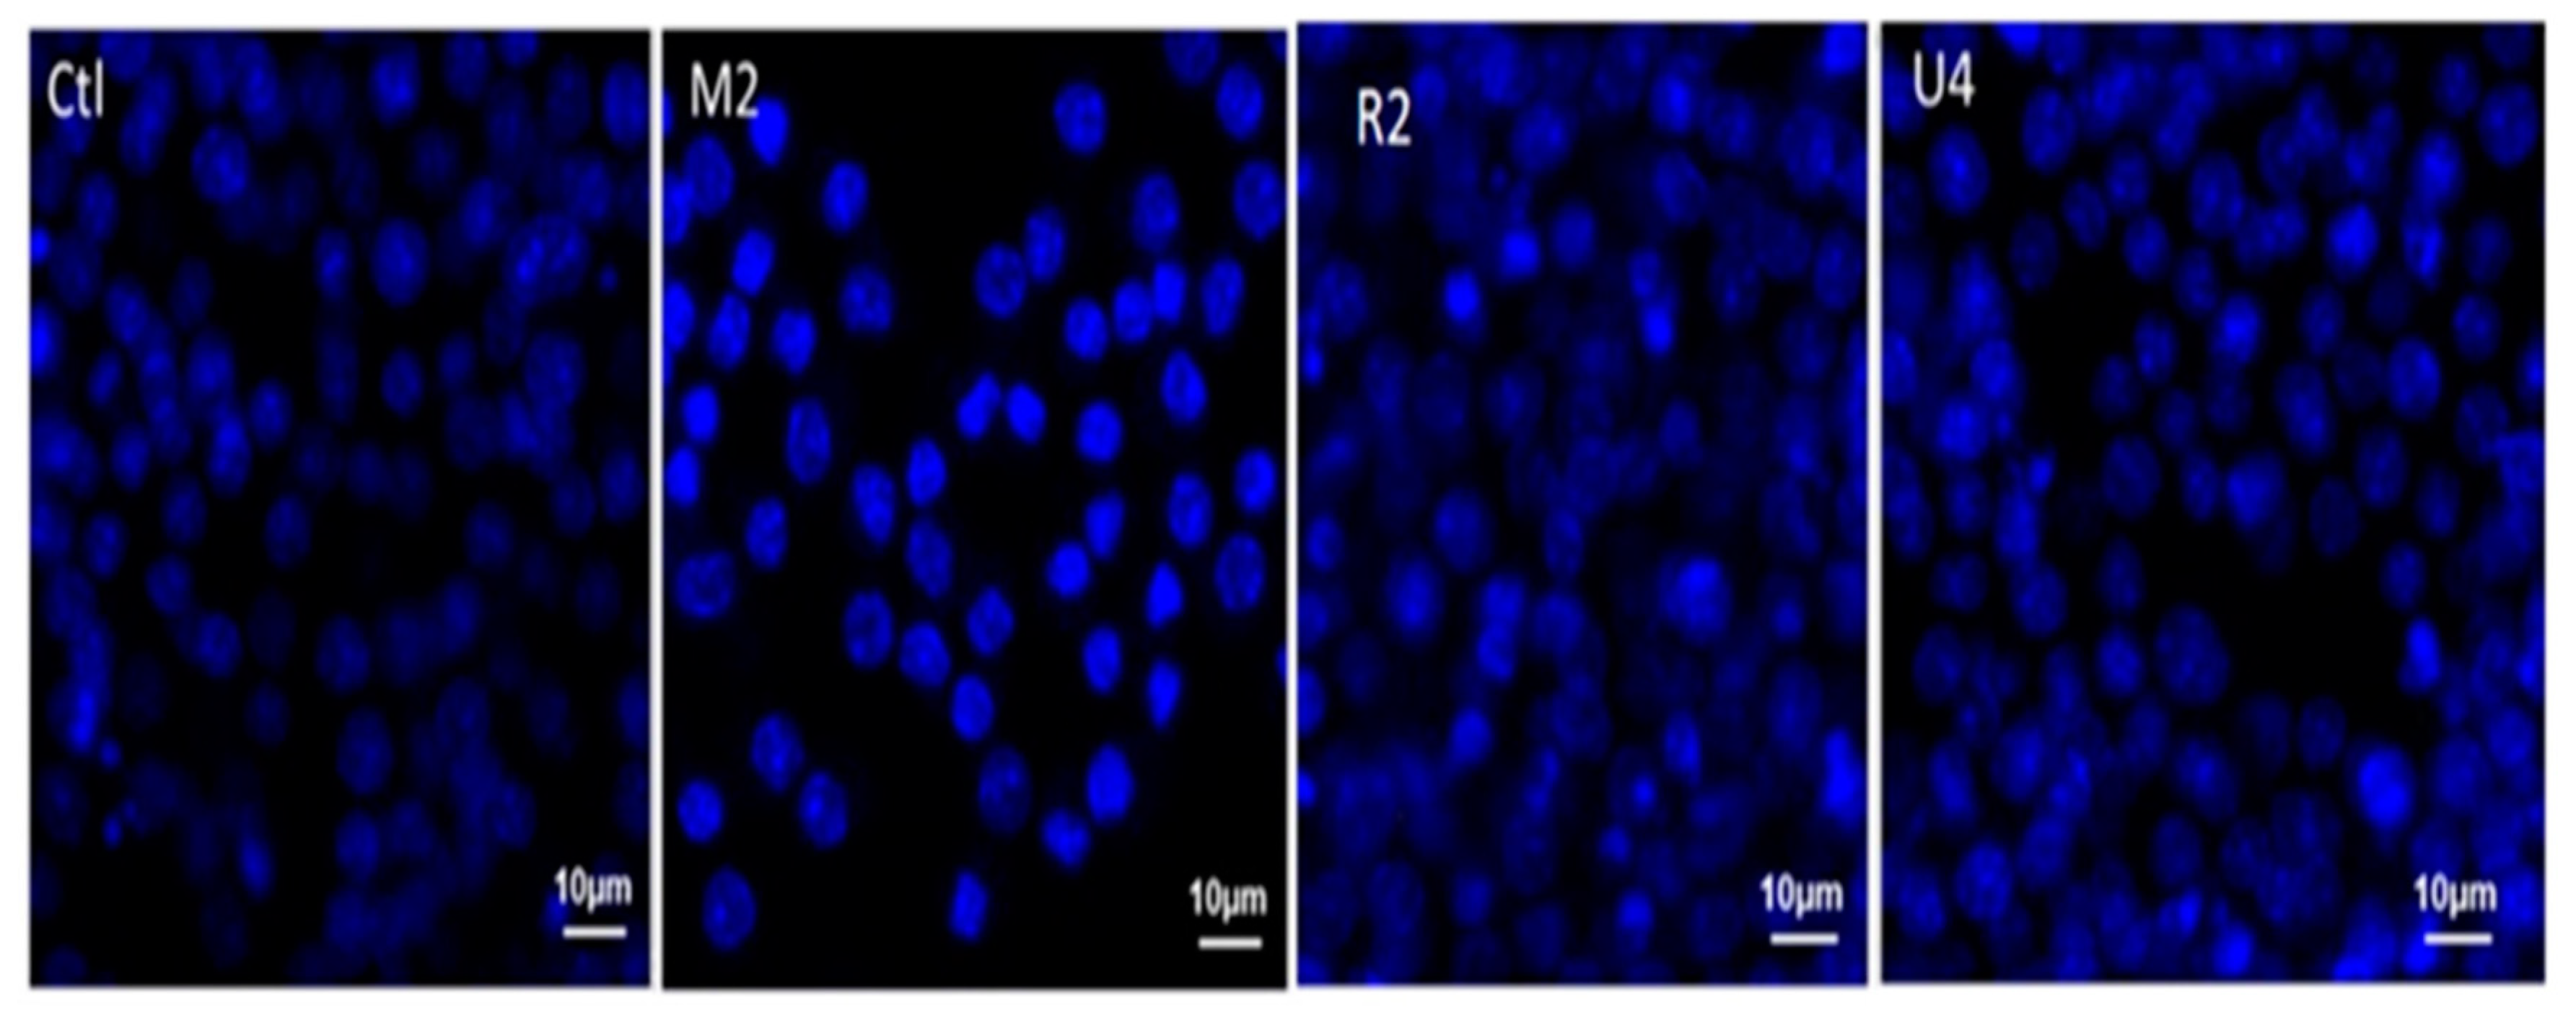
3.3. Results of Cellular Viability using DAPI Staining

Viability values are presented and calculated in percentage with standard errors shown in Figure 11. Evidence of the strongest decrease in cell viability and, therefore, the highest cytotoxic effect was observed in sites M2 (19.6%) and M1 (61.5%), both located in the mixed settlement characterized by high road vehicular traffic density (Table 1). Other mixed sites, M3 and M4, as well as sites R2, R3, U1, U2 and U4, showed significant but lower reductions in cellular viability. Figure 12 further provides images of the stained cells, particularly for the sites with the lowest recorded cytotoxicity values.

4. Discussion

Our findings show predominance in all sites of ambient aerosols of a size that significantly affects health, requiring concerted efforts to reduce exposure [53,65]. In terms of proximity to sources of air pollution, in this scenario, the health impact of road transportation vehicles varies depending on particle type, distance to source, and duration of exposure. Long-term air pollutant persistence worsens outcomes by prolonging exposure [66,67]. This is further confounded by the location of residential households proximal to the air sampling sites and moving traffic. Our results showed mean distances to sampling sites of <50 m in both rural and urban areas, which is within the radius of maximal risk (near field) to emission sources. The inhabitants of such homes experience chronic exposure to emissions and poor air quality. For PM2.5 and ultrafine particles, a 50% decrease within 100–150 m of a road is reported [68]. A decay to background concentrations within as little as 50 m has been described for PM 2.5 mass concentrations [69], although PM2.5 tends to be more spatially homogenous than ultrafine particles. Exposure occurs on three scales of distance, namely near-field (0 to 0.2 km), the urban scale (0.2 to 20 km), and the regional scale (20 to 2000 km). Elevated exposures occur in the near field environment and the people most affected are pedestrians, people in nearby buildings, cyclists, and vehicle passengers [52]. A variation in emission sources has been reported between rural and urban sites, with most sources in urban settings being vehicular and industrial [16]. Despite this, and in view of the unprecedented increase in motorization reported in developing countries [5] and our study scope, our comparison was based primarily on ambient aerosols at road traffic sites.
Various studies have demonstrated regional and country-specific variability in the chemical composition of particulate matter (PM). These include water-soluble ions, metallic elements, and organic compounds such as sulfates, dioxins, nitrates, and others, such as Ca, Mn, Cl, Al, Cr, Ni, and Pb [23,70,71,72,73]. Our results showed a predominance of silicone (Si), silicate compounds, predominantly aluminum silicate, calcium (Ca), zinc (Zn), zirconium (Zr), titanium (Ti), manganese (Mn), sulfur (S), iron (Fe), and cerium (Ce) as the elements with the highest relative abundances. Strata-specific differences were observed between rural and urban sites, with Ca, Zr, and Si compounds being the highest in the mixed settlement. Whereas Zr and silicon compounds had the highest abundance in rural sites, urban areas had higher levels of Fe and Ca. This highlights reported differences in PM sources, components, and concentration differences between urban and rural areas [74,75]. In the country, studies in a few states also showed variability in elemental compositions. A study to determine the relationship between climate conditions and air quality using X-ray fluorescence spectroscopy to characterize chemical elements showed varying levels of Na, Mg, Al, Si, P, S, Cl, K, Ca, Ti, Mn, Fe, Zn, As, Br, Rb, Sr, and Pb in different sizes [76]. The higher relative abundance of zirconium levels in this study could be attributed to the high level of zircon identified in Nigeria, particularly the northern states, as well as excavation activities that result in dust particulate suspension [62,77]. Studies that measured concentrations of PM in Nigeria also recorded regional and state variability, with average concentrations of PM10 measured in Abuja and Maiduguri (northern Nigeria) ranging from 118.3 to 132.0 µgm−3 and 553µgm−3 in Aba (eastern Nigeria) [78]. During the dry season an average PM10 daily concentration of 502.3 ± 39.9 μg m−3 was obtained in a commercial area within southwestern Nigeria, which exceeded ten-fold the WHO daily guideline value [79]. In a study which compared aerosol optical properties and radiative effects during two haze events in China. Findings showed differences in inversion of aerosol properties, an obvious increase in average aerosol optical depth (AOD), and fine mode particles [80]. Thus, emphasizing the need for studies to span time periods encompassing different weather phenomena and seasonal peculiarities. This highlights the need for constant monitoring of PM values and the use of widely distributed monitoring stations to ensure air quality control.
Although other studies have identified typical elemental patterns related to road vehicular emissions such as submicron metal chloride containing particles, which are typically mixed with carbonaceous materials in combustion emissions [23,81,82], brake and tire wear particles are classified as traffic/abrasion class, with corrosion products of vehicles as Fe/Cr, elements such as; Cu, Ba, Fe, and Sb used for brake abrasion, and Zn and black carbon for tire abrasion [83,84,85,86]. Our study identified these elements but with a high relative abundance for only some of these elements. This may be limited by the qualitative nature of our analysis or the short sampling duration within the study area. Longer-term air sampling studies can possibly provide a more detailed elemental profile and clearer wear patterns. The use of simulations and testing in controlled and semi-controlled environments may also account for the elemental patterns reported in referenced studies. Our study was performed in a purely uncontrolled environment and, therefore, affected by other factors such as: variation in wind speed, temperature changes, and topographic differences.
Fibrillar particles identified primarily in mixed settlements are known to exert cytotoxicity via possible mechanisms such as fragmentation, toxicity from early stages of formation, and acting as seeds for additional fibrils [87,88,89,90]. These particles have also been shown to possess high elastic moduli stemming from backbone intermolecular hydrogen bonding [91]. Low viability values obtained on DAPI staining in sites, particularly M1 and M2, emphasize the cytotoxic effect of particulate pollutants, particularly those of fibrillar nature, which predominate at these sites. The resultant health effects can be short-term, including increases in inflammatory markers [30], decreases in pulmonary function [92], respiratory symptoms such as exacerbations of chronic obstructive pulmonary disease (COPD) and infections [31], and increases in respiratory mortality [32]. Long-term effects can culminate in respiratory and cardiac disease. The evidence of significant reductions in viability in some rural and urban sites, although lower than in mixed sites, shows an adverse effect of pollutants even at reduced values. Further findings from MTT testing are indicative of marked particle toxicity to normal cell function in the same sites; M1 and M2 highlight the need for identifying particle types, sources, and possibly concentration. Although this study is limited by its focus on a qualitative comparison of particles only, significant differences in urban and rural settlements provide sufficient information to support policy change. Both zirconium and silica have demonstrated toxicity in previous global studies, with Zirconium linked to ocular irritation, skin itching, and respiratory symptoms, while Silica has been linked to chronic obstructive pulmonary disease (COPD), silicosis, and lung cancer via different transforming potencies and varying cytotoxity [93,94]. This occurs through the mechanisms of deoxyribonucleic acid (DNA) cell death, enhancement of miRNA expression and apoptosis [95,96]. The documented peril to communities existing in the absence of regular air quality monitoring and control cannot be overemphasized. Particulate pollution at levels below cut-off values over time shows adverse consequences for exposed individuals [97,98]. Our study findings support the need for long-term studies which will enable effective planning and monitoring of any control measures, such as lowering traffic speeds through the use of speed limits and maintaining constant traffic flow, both of which have been shown to reduce roadside PM10 levels [99,100].

5. Conclusions

Our study identified a predominance of PM2.5 particles in all sampled sites, indicating the presence of persisting significant exposure to adverse health effects from the dominant pollution sources, e.g., road vehicles. Mixed settlements, with a combination of vehicular and industrial sources of pollution, revealed the largest proportion of PM2.5 particles. This, coupled with the proximity of residences and households to road traffic sites, indicates a lack of adequate zoning and planning of residential areas. PM10 values, although lower than recorded PM2.5, are indicative of the dual risk to humans from various particle sizes. Despite lower cytotoxicity values being obtained in non-mixed settlements (urban and rural), this evidence shows that all settlements experience unwanted particulate pollution. Existing silica and aluminum silicone laden dust pollution, though limited by season, serves as a confounding factor and worsens air quality. The presence of a significant proportion of morphological fibrillar particles with known toxicity, also proven by our findings, here highlights a neglect of mitigating strategies for long-term respiratory and other chronic diseases. Non-communicable diseases from environmental exposure contribute to the burden of diseases in developing countries undergoing epidemiological transitions and changes in disease prevalence.
The presence of minimal elemental variability, except for some elements such as zirconium, emphasizes a possible similarity of pollution sources. This study provides a preliminary characterization of PM pollution and the role of natural pollution sources in Kano State, representative of expanding urban areas in Nigeria. The results support the need for improvement in traffic monitoring at multiple sites, further testing to identify emission profiles by point of origin, e.g., exhaust or non-exhaust, and the setting up of air quality monitoring stations to assess and manage safe levels. A further assessment of the concentration of these particles, possibly in a long-term study, will provide sufficient data to generate a trend analysis of particulate pollution in these sites. However, an identified limitation to our study is the absence of existing monitoring data to enable a comparison of particle profiles and constituents for similar periods in the year and peak traffic flow times similar to those utilized for this study. Recommendations made to stakeholders based on the results obtained will highlight the importance and effectiveness of future modelling on the impact of different particle types. Based on the findings obtained here, this can occur as a follow-up study or via implementation strategies and pathways aimed at tackling pollution through inter-sectoral collaboration. Stakeholder agencies such as: health, transportation and the environment can expand on this to provide a wider vision and strengthen future research partnerships and mitigation strategies. Proven cytotoxicity using different assessment methods in vitro will prove critical to informing behavioral change regarding the location of residences and residential planning protocols. Use of alternative fuel sources, i.e., greener sources of energy, will reduce emissions from the predominant use of petroleum products as a source of fuel. This will ultimately reduce particulate pollution, improving air quality and thus protecting human health and safety.

Author Contributions

Conceptualization, A.A.S., A.-M.T.-S. and S.K.; Data Curation, A.A.S.; S.K.; S.P.S.; I.W.B.; A.F.; M.A.A.; A.-M.T.-S. and A.-N.L.; Formal Analysis, A.A.S., A.-M.T.-S.;A.-N.L.; M.C. and S.K.; Funding acquisition, A.A.S.; A.-M.T.-S. and S.K.; Investigation, A.A.S.; A.-M.T.-S.; I.W.B.; S.P.S.; A.F.; M.A.A.; A.-N.L.; S.K.; M.V. and M.C.; Methodology, A.A.S.; A.-M.T.-S.; M.V. and S.K.; Project administration, A.-M.T.-S.; S.K. and A.A.S.; Resources, A.A.S.; A.-M.T.-S.; S.K.; I.W.B. and M.V.; Software, A.-M.T.-S.; A.A.S., A.-N.L.; M.C. and S.K.; Supervision, S.K.; A.-M.T.-S. and M.V.; Validation, S.K.; A.-M.T.-S. and A.A.S.; Visualization, A.-M.T.-S.; A.A.S.; S.K. and A.-N.L.; Writing—Original draft, A.A.S.; Writing-Review and editing, A.-M.T.-S.; S.K.; A.A.S. and A.-N.L. All authors reviewed the contents presented here and the submitted version of this manuscript.

Funding

This research work was funded via an academic Merit Grant from Petroleum Technology Development Fund (PTDF), Abuja, Nigeria.

Institutional Review Board Statement

This study was conducted according to the guidelines of the Helsinki declaration and ethical approval was obtained from the Scientific Ethics Research Committee on Health and related research, Kano State Ministry of Health, Nigeria (Ref No: MOH/797/T. 1:1700) on 30 September 2019.

Informed Consent Statement

Informed consent was obtained from all subjects involved in the study.

Data Availability Statement

All data requests will be reviewed by the authors and fulfilled.

Acknowledgments

The authors acknowledge the immeasurable support of the Kano State Government, the Kano State Ministry of Health and the Federal Road Safety Corps (FRSC), Kano Sector Command, Nigeria. We also acknowledge the support and commitment of the Petroleum Technology Development Fund, Abuja, Nigeria.

Conflicts of Interest

The authors declare no conflict of interest.

Appendix A

Three Google Maps® satellite image maps of the investigated local government areas depict typical traffic flow patterns (Figure A1, Figure A2 and Figure A3). The maps use a scale of 1:40,000 for a 96 dpi screen, where 2.5 cm equals 1 km on the ground.
Figure A1. Map of Nigeria highlighting Kano State and satellite image of Kano Municipal Local Government Areas showing typical week day traffic (Source: Google maps®).
Atmosphere 13 00080 g0a1
Figure A2. Map of Nigeria highlighting Kano State and satellite image of Kumbotso Local Government Areas showing typical week day traffic (Source: Google maps®).
Atmosphere 13 00080 g0a2
Figure A3. Map of Nigeria highlighting Kano State and satellite image of Nassarawa Local Government Areas showing typical week day traffic (Source: Google maps®).
Atmosphere 13 00080 g0a3

References

  1. Kim, B.M.; Park, J.-S.; Kim, S.W.; Kim, H.; Jeon, H.; Cho, C.; Kim, J.-H.; Hong, S.; Rupakheti, M.; Panday, A.K.; et al. Source apportionment of PM10 mass and particulate carbon in the Kathmandu Valley, Nepal. Atmos. Environ. 2015, 123, 190–199. [Google Scholar] [CrossRef] [Green Version]
  2. Squizzato, S.; Cazzaro, M.; Innocente, E.; Visin, F.; Hopke, P.K.; Rampazzo, G. Urban air quality in a mid-size city—PM2.5 composition, sources and identification of impact areas: From local to long range contributions. Atmos. Res. 2017, 186, 51–62. [Google Scholar] [CrossRef] [Green Version]
  3. Men, C.; Liu, R.; Wang, Q.; Guo, L.; Miao, Y.; Shen, Z. Uncertainty analysis in source apportionment of heavy metals in road dust on positive matrix factorization model and geographic information system. Sci. Total Environ. 2019, 652, 27–39. [Google Scholar] [CrossRef] [PubMed]
  4. Touzi, B.; Mabrouki, C.; Farchi, A. Sustainable Road Transportation in developed and developing countries: Framework and Future research. Int. J. Eng. Res. Technol. 2015, 4. Available online: https://www.researchgate.net/publication/323019562_Sustainable_Road_Transport_in_Developed_and_Developing_Countries_Framework_and_Future_Research (accessed on 21 February 2021).
  5. Schipper, L.; Fabian, H.; Leather, J. Transport and Carbon Dioxide Emissions: Forecasts, Options Analysis and Evaluation; ADB Sustainable Development Working Paper Series; ADB: Mandaluyong, Philipines, 2009. [Google Scholar]
  6. Gwilliam, K.M.; Bofinger, H. Africa’s Transport Infrastructure: Mainstreaming Maintenance and Management; World Bank Publications: Washington, DC, USA, 2011. [Google Scholar]
  7. Pirrone, N.; Cinerella, S.; Feng, X.; Finkelman, B.R.; Friedli, R.H.; Leaner, J.; Mason, R.; Mukherjee, A.B.; Stratcher, B.G.; Streets, G.D.; et al. Global mercury emissions into the atmosphere from anthropegenic and natural sources. Atmos. Chem. Phys. 2010, 10, 5951–5964. [Google Scholar] [CrossRef] [Green Version]
  8. Emmanuel, A.O. The impact of road development and expansion on urban cities “A case study of Akure metropolis”. Worldw. J. Multidiscip. Res. Dev. 2015, 2, 46–48. [Google Scholar]
  9. Jayasinghe, A.; Sano, K.; Nishiuchi, H. Network Centrality Assessment (NCA) as an alternative approach to predict vehicular traffic volume: A case of Colombo, Sri Lanka. Adv. Transp. Stud. 2015, 11, 834–853. [Google Scholar]
  10. Ishii, S.; Bell, J.N.B.; Marshall, F.M. Phytotoxic risk assessment of ambient air pollution on agricultural crops in Selangor State, Malaysia. Environ. Pollut. 2007, 150, 267–279. [Google Scholar] [CrossRef] [PubMed]
  11. Vlachokhostas, C.; Nastis, S.A.; Achillas, C.; Kalogeropoulos, K.; Karmiris, I.; Moussiopoulos, N.; Chourdakis, E.; Banias, G.; Limperi, N. Economic damages of Ozone air pollution to crops using combined air quality and GIS modeling. Atmos. Environ. 2010, 44, 3352–3361. [Google Scholar] [CrossRef]
  12. Koupal, J.; Palacios, C. Impact of new fuel specifications on vehicle emissions in Mexico. Atmos. Environ. 2019, 201, 41–49. [Google Scholar] [CrossRef]
  13. Shi, S.; Zhang, H.; Yang, W.; Zhang, Q.; Wang, X. A life cycle assessment of battery electric and internal combustion engine vehicles: A case in Hebei province China. J. Clean. Prod. 2019, 228, 606–618. [Google Scholar] [CrossRef]
  14. Kingombe, C. Africa’s Rising Middle Class Amid Plenty and Extreme Poverty; European Centre for Development Policy Management (ECDPM): Maastricht, The Netherlands, 2014. [Google Scholar] [CrossRef]
  15. Davila, A.F.; Rey, D.; Mohammed, K.; Rubio, B.; Guerra, A.P. Mapping the sources of urban dust in a coastal environment by measuring magnetic parameters of Platanus hispanica leaves. Environ. Sci. Technol. 2006, 40, 3922–3928. [Google Scholar] [CrossRef] [PubMed]
  16. Adeyanju, A.A.; Manohar, K. Effect of Vehicular Emission on Environmental pollution in Lagos. Sci-Afric J. Sci. Issues Res. Essays 2017, 5, 34–51. [Google Scholar]
  17. Hamidi, M.; Kavianpour, M.R.; Shao, Y. Synoptic analysis of dust storms in the Middle East. Asia-Pac. J. Atmos. Sci. 2013, 49, 279–286. [Google Scholar] [CrossRef]
  18. Middleton, N.; Kang, U. Sand and dust storms: Impact mitigation. Sustainability 2017, 9, 1053. [Google Scholar] [CrossRef] [Green Version]
  19. Klose, M.; Shao, Y.; Karremann, K.M.; Fink, H.A. Sahel dust zone and synoptic background. Geophys. Res. Lett. 2010, 37. [Google Scholar] [CrossRef]
  20. Lyngsie, G.; Awadzi, T.W.; Breuning-Madsen, H. Origin of Harmattan dust settled in Northern Ghana—Long transported or local dust? Geoderma 2010, 167, 351–359. [Google Scholar] [CrossRef]
  21. Riedl, M.; Diaz-Sanchez, D. Biology of diesel exhaust effects on respiratory function. J. Allergy Clin. Immunol. 2005, 115, 221–228. [Google Scholar] [CrossRef]
  22. Gonzalez-Diaz, S.N.; Arias-Cruz, A.; Macouzet-Sanchez, C.; Partida-Ortega, B.A. Impact of air pollution in respiratory allergic diseases. Med. Univ. 2016, 18, 212–215. [Google Scholar] [CrossRef]
  23. United States Environmental Protection Agency. Exposure and Human Health Reassessment of 2, 3, 7, 8-Tetrachlorodibenzo-p-Dioxin (TCDD) and Related Compounds National Academy Sciences External Review Draft; United States Environmental Protection Agency: Washington, DC, USA, 2004. Available online: https://www.cfpub.epa.gov (accessed on 9 May 2021).
  24. Elminir, H.K. Dependence of urban air pollutants on meteorology. Sci. Total Environ. 2005, 350, 225–237. [Google Scholar] [CrossRef]
  25. Dominici, F.; McDermott, A.; Zeger, S.L.; Samet, J.M. National maps of the effects of particulate matter on mortality: Exploring geographical variation. Environ. Health Perspect. 2003, 111, 39–44. [Google Scholar] [CrossRef] [PubMed] [Green Version]
  26. Langner, M.; Endlicher, W. Shrinking Cities: Effects on Urban Ecology and Challenges for Urban Development; Peter Lang GmbH: Berlin, Germany, 2007; pp. 17–35. [Google Scholar]
  27. Tecer, L.H.; Alagha, O.; Karaca, F.; Tuncel, G.; Eldes, N. Particulate matter (PM 2.5, PM10-2.5, and PM 10) and children’s hospital admissions for asthma and respiratory diseases: A bidirectional case-crossover study. J. Toxicol. Environ. Health Part A 2008, 71, 512–520. [Google Scholar] [CrossRef] [PubMed]
  28. World Health Organization (WHO). Household Air Pollution and Health. Updated 2018. Available online: https://www.who.int/newsroom/fact-sheets/detail/household-air-pollution-and-health (accessed on 7 July 2021). Updated 2018.
  29. Lagorio, S.; Forastiere, F.; Pistelli, R.; Lavorone, I.; Michelozzi, P.; Fano, V.; Marconi, A.; Ziemacki, G.; Ostro, D.B. Air pollution and lung function among susceptible adult subjects: A panel study. Environ. Health 2006, 5, 11. [Google Scholar] [CrossRef] [PubMed] [Green Version]
  30. Zeka, A.; Zanobetti, A.; Schwartz, J. Individual-level modifiers of the effects of particulate matter on daily mortality. Am. J. Epidemiol. 2006, 163, 849–859. [Google Scholar] [CrossRef] [PubMed] [Green Version]
  31. Barnett, A.G.; Williams, G.M.; Schwartz, J.; Neller, A.H.; Best, T.L.; Petroeschevsky, A.L.; Simpson, R.W. Air pollution and child respiratory health: A case crossover study in Australia and New Zealand. Am. J. Respir. Crit. Care Med. 2005, 171, 1272–1278. [Google Scholar] [CrossRef] [PubMed]
  32. Ostro, B.; Feng, W.Y.; Broadwin, R.; Lipsett, M. The effects of components of fine particulate air pollution on mortality in California: Results from CALFINE. Environ. Health Perspect. 2007, 115, 13–19. [Google Scholar] [CrossRef] [Green Version]
  33. Saenz, J.L.; Wong, R.; Ailshire, J.A. Indoor air pollution and cognitive function among older Mexican adults. J. Epidemiol. Commun. Health 2018, 72, 21–26. [Google Scholar] [CrossRef]
  34. Thompson, L.M. Household Air Pollution from Cooking Fires Is a Global Problem. Am. J. Nurs. 2019, 119, 61–64. [Google Scholar] [CrossRef]
  35. Kim, E.; Park, H.; Park, E.A.; Hong, Y.C.; Ha, M.; Kim, H.C.; Ha, E.H. Particulate matter and early childhood body weight. Environ. Int. 2016, 94, 591–599. [Google Scholar] [CrossRef]
  36. Roy, A.; Hu, W.; Wei, F.; Korn, L.; Chapman, R.S.; Zhang, J.J. Ambient particulate matter and lung function growth in Chinese children. Epidemiology 2012, 23, 464–472. [Google Scholar] [CrossRef] [Green Version]
  37. Franchini, M.; Mannucci, P.M. Thrombogenicity and cardiovascular effects of ambient air pollution. Blood 2011, 118, 2405–2412. [Google Scholar] [CrossRef] [PubMed]
  38. Nemmar, A.; Hoet, P.H.; Dinsdale, D.; Vermylen, J.; Hoylaerts, M.F.; Nemery, B. Diesel exhaust particles in lung acutely enhance experimental peripheral thrombosis. Circulation 2003, 107, 1202–1208. [Google Scholar] [CrossRef] [PubMed] [Green Version]
  39. Hamed, S.A.; Hamed, E.A.; Zakary, M.M. Oxidative stress and S-100B protein in children with bacterial meningitis. BMC Neurol. 2009, 9, 51. [Google Scholar] [CrossRef] [PubMed] [Green Version]
  40. Maher, P.; Schubert, D. Signaling by reactive oxygen species in the nervous system. Cell Mol. Life Sci. 2000, 57, 1287–1305. [Google Scholar] [CrossRef]
  41. Hvidtfeldt, U.A.; Sorensen, M.; Geels, C.; Ketzel, M.; Khan, J.; Tjonneland, A.; Overvad, K.; Brandt, J.; Raaschou-Nielsen, O. Long-term residential exposure to PM2.5, PM10, black carbon, NO2, and ozone and mortality in a Danish cohort. Environ. Int. 2019, 123, 265–272. [Google Scholar] [CrossRef]
  42. Ansari, M.; Ehrampoush, M.H. Meteorological correlates and AirQ+ health risk assessment of ambient fine particulate matter in Tehran, Iran. Environ. Res. 2019, 170, 141–150. [Google Scholar] [CrossRef]
  43. Liu, F.; Chen, G.; Huo, W.; Wang, C.; Liu, S.; Li, N.; Mao, S.; Hou, Y.; Lu, Y.; Xiang, H. Associations between long-term exposure to ambient air pollution and risk of type 2 diabetes mellitus: A systematic review and meta-analysis. Environ. Pollut. 2019, 252, 1235–1245. [Google Scholar] [CrossRef]
  44. Luo, G.W.; Zhang, L.Y.; Hu, X.S.; Qiu, R.Z. Quantifying public health benefits of PM2.5 reduction and spatial distribution analysis in China. Sci. Total Environ. 2020, 719, 137445. [Google Scholar] [CrossRef]
  45. Wang, J.Z.; Zhang, L.F.; Niu, X.S.; Liu, Z.K. Effects of PM2.5 on health and economic loss: Evidence from Beijing-Tianjin-Hebei region of China. J. Clean. Prod. 2020, 257, 120605. [Google Scholar] [CrossRef]
  46. Schwarze, P.; Totlandsal, A.; Herseth, I.J.; Holme, A.J.; Lag, M.; Refsnes, M.; Overik, J.; Sandberg, W.; Bolling, K.A. Importance of sources and components of particulate air pollution for cardio-pulmonary inflammatory responses. In Air Pollution; Rijeka, V.V., Ed.; Sciyo: Oslo, Norway, 2010; pp. 47–54. [Google Scholar] [CrossRef]
  47. Tiotiu, A.I.; Novakova, P.; Nedeva, D.; Chong-Neto, H.J.; Novakova, S.; Steiropoulos, P.; Kowal, K. Impact of Air Pollution on Asthma Outcomes. Int. J. Environ. Res. Public Health 2020, 17, 6212. [Google Scholar] [CrossRef]
  48. Bhatia, V.; Elnagary, L.; Dakshinamurti, S. Tracing the Path of Inhaled Nitric Oxide: Biological Consequences of Protein Nitrosylation. Pediatric Pulmonol. 2021, 56, 525–538. [Google Scholar] [CrossRef] [PubMed]
  49. Rouadi, P.W.; Idriss, S.A.; Naclerio, R.M.; Peden, D.B.; Ansotegui, I.J.; Canonica, G.W.; Gonzalez-Diaz, S.N.; Rosario Filho, N.A.; Ivancevich, J.C.; Hellings, P.W.; et al. Immunopathological Features of Air Pollution and Its Impact on Inflammatory Airway Diseases (IAD). World Allergy Organ. J. 2020, 13, 100467. [Google Scholar] [CrossRef] [PubMed]
  50. Sowlat, M.H.; Gharibi, H.; Yunesian, M.; Mahmoudi, M.T.; Lotfi, S. A novel, Fuzzy-based air quality index (FAQI) for air quality assessment. Atmos. Environ. 2011, 45, 2050–2059. [Google Scholar] [CrossRef]
  51. US Environment Protection Agency (EPA). Guideline for Developing an Ozone Forecasting Program; EPA-454/R-99-009; US EPA: Washington, DC, USA, 1999. [Google Scholar]
  52. Nordling, E.; Berglind, N.; Mele, E.; Emenius, G.; Hallberg, J.; Nyberg, F.; Pershagen, G.; Svartengren, M.; Wickman, M.; Bellander, T. Traffic-Related Air Pollution and Childhood Respiratory Symptoms, Function and Allergies. Epidemiology 2008, 19, 401–408. [Google Scholar] [CrossRef] [PubMed]
  53. Phalen, F.O.R. The particulate air pollution controversy. Dordrecht, Netherlands. Int. J. Epidemiol. 2003, 32, 128. [Google Scholar]
  54. Barnett, A.G.; Williams, G.M.; Schwartz, J.; Best, T.L.; Neller, A.H.; Petroeschevsky, A.L.; Simpson, R.W. The effects of air pollution on hospitalizations for cardiovascular disease in elderly people in Australian and New Zealand cities. Environ. Health Perspect. 2006, 114, 1018–1023. [Google Scholar] [CrossRef] [Green Version]
  55. Crouse, D.L.; Peters, P.A.; Van Donkelaar, A.; Goldberg, M.S.; Villeneuve, P.J.; Brion, O.; Khan, S.; Atari, D.O.; Jerrett, M.; Pope, C.A.; et al. Risk of non-accidental and cardiovascular mortality in relation to long term exposure to low concentrations of fine particle matter: A Canadian-national level cohort study. Environ. Health Perspect. 2012, 120, 708–714. [Google Scholar] [CrossRef]
  56. Ma, Y.; Zhang, M.; Jin, S.; Gong, W.; Chen, N.; Chen, Z.; Jin, Y.; Shi, Y. Long-term investigation of Aerosol optical and Radiative Characteristics in a Typical Megacity of Central China During Winter Haze Periods. J. Geophys. Res. 2019, 124, 12093–12106. [Google Scholar] [CrossRef]
  57. Sadiq, A.A.; Khardi, S.; Trunfio-Sfarghiu, A.; Alao, A.M.; Salam, P.S.; Faruk, A. Emissions from road transport vehicles and respiratory health in rural and urban communities, Kano state, Nigeria: A comparative cross sectional study (Full paper). In Proceedings of the International Conference for Environmental Health and Biotechnology (ICESB 2021), Osaka, Japan, 16–18 December 2021. [Google Scholar]
  58. Schipper, O.N.; Haddad, S.L.; Fullam, S.; Pourzal, R.; Wimmer, M.A. Wear Characteristics of Conventional Ultrahigh-Molecular-Weight Polyethylene versus Highly Cross-Linked Polyethylene in Total Ankle Arthroplasty. Foot Ankle Int. 2018, 39, 1335–1344. [Google Scholar] [CrossRef]
  59. Mossman, T. Rapid colorimetric assay for cellular growth and survival: Application to proliferation and cytotoxicity assays. J. Immunol. Methods 1983, 65, 55–63. [Google Scholar] [CrossRef]
  60. Kepp, O.; Galluzzi, L.; Lipinski, M.; Yuan, J.; Kroemer, G. Cell death assays for drug discovery. Nat. Rev. Drug Discov. 2011, 10, 221–237. [Google Scholar] [CrossRef] [PubMed]
  61. Marmureanu, L.; Marin, C.; Andrei, S.; Antonescu, B.; Ene, D.; Boldeanu, M.; Vasilescu, J.; Vitelaru, C.; Cadar, O.; Levei, E.-A. Orange Snow—A Saharan Dust Intrusion over Romania during Winter Conditions. Remote Sens. 2019, 11, 2466. [Google Scholar] [CrossRef] [Green Version]
  62. Naidja, L.; Ali-Khodja, H.; Khardi, S. Sources and levels of particulate matter in North African and Sub-Saharan cities: A literature review. Environ. Sci. Pollut. Res. 2018, 25, 12303–12328. [Google Scholar] [CrossRef] [PubMed]
  63. Key, M.R.; Johnson, C.C.; Horstwood, A.S.M.; Lapworth, J.D.; Knights, K.; Kemp, J.S.; Watts, J.M.; Gillespie, M.; Adekanmi, M. Investigating high Zircon concentration in the fine fraction of stream sediment draining the Pan-African Dahomeyan Terrane in Nigeria. Appl. Geochem. 2017, 27, 1525–1539. [Google Scholar] [CrossRef] [Green Version]
  64. Ma, Y.; Martynkova, S.G.; Valaskova, M.; Matejka, V.; Lu, Y. Effects of ZrSi04 in non-metallic brake friction materials on friction performance. Tribol. Int. 2012, 41, 166–174. [Google Scholar] [CrossRef]
  65. Air Quality: Health and Environment Alliance (HEAL). Updated 2018. Available online: https://www.env-health.org/issues/air-quality (accessed on 18 June 2021).
  66. Tan, Z. Air Pollution and Greenhouse Gases: From Basic Concepts to Engineering Applications for Air Emission Control; Springer Science + Business Media: Singapore, 2014; ISBN 978-981-287-212-8. [Google Scholar] [CrossRef]
  67. Annesi-Maesano, I.; Forastiere, F.; Balmes, J.; Garcia, E.; Harkema, J.; Holgate, S.; Kelly, F.; Khreis, H.; Hoffmann, B.; Maesano, C.N.; et al. The clear and persistent impact of air pollution on chronic respiratory diseases: A call for interventions. Eur. Respir. J. 2012, 18, 2002981. [Google Scholar] [CrossRef]
  68. Hitchins, J.; Morowska, L.; Wolff, R.C.; Dale, G. Concentrations of sub micrometer particles from vehicle emissions near a major road. Atmos. Environ. 2000, 34, 51–59. [Google Scholar] [CrossRef] [Green Version]
  69. Tittia, P.; Raunemaa, P.; Tissari, J.; Yli-Tuomi, T.; Leskinen, A.; Kukkonen, J.; Harkonen, J.; Karpinnen, A. Measurements and modeling of PM 2.5 concentrations near a major road in Kuopio, Finland. Atmos. Environ. 2000, 36, 4057–4068. [Google Scholar] [CrossRef]
  70. Hughes, L.S.; Cass, G.R.; Gone, J.; Ames, M.; Olmez, I. Physical and chemical characterization of atmospheric ultrafine particles in the Los Angeles area. Environ. Sci. Technol. 1998, 32, 1153–1161. [Google Scholar] [CrossRef]
  71. Harrison, R.M.; Shi, J.P.; Xi, S.; Khan, A.; Mark, D.; Kinnersley, R.; Yin, J. Measurement of number, mass and size distribution of particles in the atmosphere. Philos. Trans. R. Soc. Lond. Ser. A Math. Phys. Eng. Sci. 2000, 358, 2567–2580. [Google Scholar] [CrossRef]
  72. Vega, E.; Ruiz, H.; Escalona, S.; Cervantes, A.; Lopez–Veneroni, D.; Gonzalez–Avalos, E.; Sanchez–Reyna, G. Chemical composition of fine particles in Mexico City during 2003–2004. Atmos. Pollut. Res. 2011, 2, 477–483. [Google Scholar] [CrossRef]
  73. Mues, A.; Manders, A.; Schaap, M.; Van Ulft, L.; Van Meijgaard, E.; Builtjes, P.J.H. Differences in particulate matter concentrations between urban and rural regions under current and changing climate conditions. Atmos. Environ. 2013, 80, 232–247. [Google Scholar] [CrossRef]
  74. Langner, M.; Kull, M.; Endlicher, W.R. Determination of PM10 deposition based on antimony flux to selected urban surfaces. Environ. Pollut. 2011, 159, 2028–2034. [Google Scholar] [CrossRef] [PubMed]
  75. Akinlade, G.O.; Olaniyi, H.B.; Olise, F.S.; Owoade, O.K.; Almeida, S.M.; Almeida-Silva, M.; Hopke, P.K. Spatial and temporal variations of the particulate size distribution and chemical composition over Ibadan, Nigeria. Environ. Monit. Assess. 2015, 187, 544. [Google Scholar] [CrossRef]
  76. Zircon Occurrence in Nigeria, Ministry of Mines and Steel development Federal Republic of Nigeria. Updated January 2021. Available online: https://portal.minesandsteel.gov.ng/MarketPlace/Mineral/Occurrence/141 (accessed on 10 May 2021).
  77. Efe, S.I. Spatial distribution of particulate air pollution in Nigerian cities: Implications for human health. J. Environ. Health Res. 2008, 7, 107–116. [Google Scholar]
  78. Ana, G.; Odeshi, T.; Sridhar, M.K.; Ige, M.O. Outdoor respirable particulate matter and the lung function status of residents of selected communities in Ibadan, Nigeria. Perspect. Public Health 2014, 134, 169–175. [Google Scholar] [CrossRef]
  79. Geng, H.; Kang, S.; Jung, H.-J.; Choël, M.; Kim, H.; Ro, C.-U. Characterization of individual sub-micrometer aerosol particles collected in Incheon, Korea, by quantitative transmission electron microscopy energy dispersive X-ray spectrometry. J. Geophys. Res. 2010, 115, 15306. [Google Scholar] [CrossRef]
  80. Shikuan, J.; Yingying, M.; Ming, Z.; Wei, G.; Lianfa, L.; Xin, M. Comparation of Aerosol optical properties and Associated Radiative effects of Air pollution events between summer and winter: A case study in January and July 2014 over Wuhan, Central China. Atmos. Environ. 2019, 218, 117004. [Google Scholar] [CrossRef]
  81. Hu, Y.; Lin, J.; Zhang, S.; Kong, L.; Fu, H.; Chen, J. Identification of the typical metal particles among haze, fog, and clear episodes in the Beijing atmosphere. Sci. Total Environ. 2014, 1, 369–380. [Google Scholar] [CrossRef]
  82. Carslaw, K.; Boucher, O.; Spracklen, D.; Mann, G.; Rae, J.; Woodward, S.; Kulmala, M. A review of natural aerosol interactions and feedbacks within the earth system. Atmos. Chem. Phys. 2010, 10, 1701–1737. [Google Scholar] [CrossRef] [Green Version]
  83. Furusjo, E.; Sternbeck, J.; Cousins, A.P. PM (10) source characterization at urban and highway roadside locations. Sci. Total Environ. 2007, 387, 206–219. [Google Scholar] [CrossRef] [PubMed]
  84. Weckwerth, G. Verification of traffic emitted aerosol components in the ambient air of Cologne (Germany). Atmos. Environ. 2001, 35, 5525–5536. [Google Scholar] [CrossRef]
  85. Marcazzan, G.M.; Ceriani, M.; Valli, G.; Vecchi, R. Source apportionment of PM10 and PM2.5 in Milan (Italy) using receptor modelling. Sci. Total Environ. 2003, 317, 137–147. [Google Scholar] [CrossRef]
  86. Adachi, K.; Tainosho, Y. Characterization of heavy metal particles embedded in tire dust. Environ. Int. 2004, 30, 1009–1017. [Google Scholar] [CrossRef]
  87. Aguzzi, A.; O’connor, T. Protein aggregation diseases: Pathogenicity and therapeutic perspectives. Nat. Rev. Drug Discov. 2010, 9, 237–248. [Google Scholar] [CrossRef]
  88. Glabe, C.G. Structural classification of toxic amyloid oligomers. J. Biol. Chem. 2008, 283, 29639–29643. [Google Scholar] [CrossRef] [Green Version]
  89. Martins, I.C.; Kuperstein, I.; Rousseau, F. Lipids revert inert Ab amyloid fibrils to neurotoxic protofibrils that affect learning in mice. EMBO J. 2008, 27, 224–233. [Google Scholar] [CrossRef] [Green Version]
  90. Xue, W.-F.; Hellewell, A.L.; Radford, S.E. Fibril fragmentation enhances amyloid cytotoxicity. J. Biol. Chem. 2009, 284, 34272–34282. [Google Scholar] [CrossRef] [Green Version]
  91. Knowles, T.P.; Fitzpatrick, A.W.; Welland, M.E. Role of intermolecular forces in defining material properties of protein nanofibrils. Science 2007, 318, 1900–1903. [Google Scholar] [CrossRef]
  92. Lai, C.-H.; Lin, C.-H.; Liao, C.-C. Respiratory deposition and health risk of inhalation of particle-bound heavy metals in the carbon black feeding area of a tire manufacturer. Air Qual. Atmos. Health 2017, 10, 1281–1289. [Google Scholar] [CrossRef]
  93. Health Effects of Occupational Exposure to Respirable Crystalline Silica. DHHS (NIOSH) CDC Publication Number 2002-129; April 2002. Available online: https://www.cdc.gov/niosh/docs/2002-129/default.html (accessed on 17 June 2021).
  94. Elias, Z.; Poirot, O.; Daniere, C.M.; Terzetti, F.; Marande, M.A.; Dzwigaj, S.; Pezerat, H.; Fenoglio, I.; Fubini, B. Cytotoxic and transforming effects of silica particles with different surface properties in Syrian hamster embryo (SHE) cells. Toxicol. Vitr. 2000, 14, 409–422. [Google Scholar] [CrossRef]
  95. Atalay, H.; Celik, A.; Ayaz, F. Investigation of genotoxic and apoptotic effects of zirconium oxide nanoparticles (20nm) on L929 mouse fibroblast cell line. Chem. Biol. Interact. 2018, 296, 98–104. [Google Scholar] [CrossRef] [PubMed]
  96. Cossellu, G.; Motta, V.; Dioni, L.; Angelici, L.; Vigna, L.; Farronato, G.; Pesatori, A.; Bollati, V. Titanium and zirconium levels associated with changes in microRNAs expression: Results from a Human Cross-sectional Study on Obese Population. PLoS ONE 2016, 11, e016191. [Google Scholar] [CrossRef]
  97. Dominici, F.; Schwartz, J.; Di, Q.; Braun, D.; Choirat, C.; Zanobetti, A. Assessing adverse health effects of long-term exposure to low levels of ambient air pollution: Phase 1. Res. Rep. Health Eff. Inst. 2019, 200, 1–51. [Google Scholar]
  98. Brauer, M.; Brook, J.R.; Christidis, T.; Chu, Y.; Crouse, D.L.; Erickson, A.; Hystad, P.; Li, C.; Martin, R.V.; Meng, J.; et al. Mortality-air pollution associations in low-exposure environments (MAPLE): Phase 1. Res. Rep. Health Eff. Inst. 2019, 203, 1–87. [Google Scholar]
  99. Kohoutek, S.; Weinbruch, S.; Boltze, M. Reduction potential of environment responsive traffic control on roadside particulate matter and nitrogen oxide concentrations. Transp. Res. Rec. J. Transp. Res. Board. 2012, 2270, 162–170. [Google Scholar] [CrossRef]
  100. Gehrig, R.; Hill, M.; Buchmann, B.; Imhof, D.; Weingartner, E.; Baltensperger, U. Separate determination of PM10 emission factors of road traffic for tailpipe emissions and emissions from abrasion and resuspension processes. Int. J. Environ. Pollut. 2004, 22, 312–325. [Google Scholar] [CrossRef]
Figure 1. The Nigerian Map shows Kano State (light blue) and an enlarged map of Kano State showing population density, study areas, and the state capital, Kano Municipal Local Government Area.
Atmosphere 13 00080 g001
Figure 2. Distribution of Road Transportation Vehicles in Kano State’s rural and urban settlements [57].
Atmosphere 13 00080 g002
Figure 3. This show the SEM-EDX Imaging: (a) The appearance of the carbon adhesive disc particles is consistent for all collection sites (b) a large sand particle is present in the peripheral zone (c,g,i) visualization of central areas, concentrated in particles: (c) mixed site, (g) urban site, (i) rural site; (h) global EDX analysis over the entire area of the image with compound showing in red the Si-based particles and in green the C-based particles. Details of silicone (Si) wicks observed in different sites: (d) urban site (e) mixed site (f) rural site. (jl)—EDX spectra associated with images (b,e,h).
Atmosphere 13 00080 g003
Figure 4. The number-size distribution of Particles from twelve sampling sites in three local Government Areas.
Atmosphere 13 00080 g004
Figure 5. Site specific histograms of particles using equivalent surface ratio (ESR).
Atmosphere 13 00080 g005
Figure 6. Site specific histograms showing particle distribution by equivalent circle diameter (ECD).
Atmosphere 13 00080 g006
Figure 7. Classification of particles from all sites using an Equivalent Surface Ratio (ESR).
Atmosphere 13 00080 g007
Figure 8. The classified particles are divided into four groups based on settlement: (a) urban, (b) mixed, and (c) rural (d) A Comparism diagram of the ratio of Si fiber to sand fibres for all sites.
Atmosphere 13 00080 g008aAtmosphere 13 00080 g008b
Figure 9. (a) Mineralogy of particles with a size diameter of <2.5 μm from all collection sites; (b) Mineralogy of particles with a size diameter of 2.5 µm–<10 μm from all collection sites.
Atmosphere 13 00080 g009aAtmosphere 13 00080 g009b
Figure 10. The mean and standard errors of MTT tests read at 570 nm absorbance for all sites.
Atmosphere 13 00080 g010
Figure 11. Mean viability values and standard errors by DAPI analysis by site.
Atmosphere 13 00080 g011
Figure 12. Typical DAPI staining of macrophages in control or particle-exposed conditions in some sites illustrates intense DAPI staining (saturation) due to intense internalization of the dye along with nuclear condensation; note the lower cellular density for the M2 site, corresponding to higher cell death.
Atmosphere 13 00080 g012
Table 1. Details of air sampling sites in Kano State-Nigeria.
Site IDNameSettlement Type/LGATraffic DensityIdentified Pollution Sources
R1Masalacin Alhaji Abba RoadRural
Kumbotso
HighTraffic, grain thrashing, harmattan dust, open burning
R2Coca-cola RoadLowBottling plant, traffic, dust
R3Turaki Memorial school HighwayLowTraffic, harmattan dust, open burning
R4Kumbotso village near highwayHighTraffic, open burning, agriculture
M1Central Mosque areaUrban-Mixed
Nassarawa
HighTraffic, local food industries, dust
M2Yankaba Car Park (Tashan Yankaba)HighTraffic, automobile workshops, commercial car park, open burning, factories, dust
M3Hadeija RoadLowTraffic, open burning, harmattan dust
M4Amau Yakubu street, GRALowTraffic, open burning, dust
U1Municipal Clinic RoadUrban
Kano Municipal
LowTraffic, harmattan dust
U2Kofar Mata AreaHighTraffic, harmattan dust
U3Near British CouncilHighTraffic, harmattan dust
U4Layin Dantata KokiLowTraffic, harmattan dust
Table 2. Distances between households (HH) and air sampling sites in three local government areas in Kano State, Nigeria.
S/NLGA/Site NumberSettlement TypeDistance to Households
Mean ± SD (meTers)
1Kano Municipal
Site: U1-U4Urban37.2 ± 27.0
2Nassarawa
Site: M1-M4Mixed34.1 ± 21.7
3Kumbotso
Site: R1-R4Rural36.8 ± 22.7
Publisher’s Note: MDPI stays neutral with regard to jurisdictional claims in published maps and institutional affiliations.

