Abstract
Analyzing atmospheric circulation patterns characterize prevailing weather in a region. The method of principal component analysis and clustering was used to classify daily atmospheric circulation patterns. The average daily geopotential height of 500 hPa with 0.5° resolution of the ECMWF (1990–2019) were extracted from the Middle East. The S array was used to identify air types, and k-means clustering was used to classify daily air types. All days were divided into eighteen groups. Then, the surface maps and moisture flux divergence at the 850-hPa level of each pattern were studied. The, the connection between circulation patterns and precipitation occurrence is investigated by the PI index. The existence of a variety of precipitation and temperature regimes and consequent dry/wet periods is related to the type and frequency of the circulation patterns. In patterns with south to southwesterly currents, the low-pressure surface center extends from the south of the Red Sea to southern Turkey and is associated with the mid-level trough, where the moisture fluxes converge in the south of the Red Sea, southwest/south of Iran, and east of the Mediterranean Sea. Therefore, according to the intensity of the patterns, the most precipitation falls in the country’s western half, and the Zagros Mountain’s wind side. With the eastward movement of the Cyclonic patterns, the rainfall area extends to the eastern half of the country. With the pattern that the thermal low surface pressure extends to 35 °N latitude and is associated with the mid-level subtropical high, almost no rain occurs in the country.
1. Introduction
The main idea for classifying atmospheric circulation patterns is to classify a set of atmospheric parameters into a univariate catalog and to organize cases with similar characteristics in the same group. A more straightforward interpretation of weather conditions would be to the advantage of the classification. The air mass types can be identified by the following two approaches: air mass classification or atmospheric circulation patterns. The air mass-based approach determines the air mass type using local values of the meteorological quantities (such as temperature, humidity, and wind speed). In the circulation approach, the air mass types are determined by analyzing the sea level pressure, geopotential height, or the wind field at time intervals on a regular grid [1].
To classify atmospheric circulation patterns, many researchers have used the principal component analysis (PCA) method. Esteban et al. [2], in a study of atmospheric circulation patterns in Western Europe, categorized daily synoptic circulation patterns into 20 groups and showed sea level pressure and 500 hPa geopotential height configurations throughout the year. Käsmacher and Schneider [3] described atmospheric circulation patterns in the Svalbard archipelago based on NCEP/NCAR data with 2.5° grid resolution for sea level pressure, 500 hPa, and 700 hPa geopotential heights at nine groups. The results of this study are very indicative of atmospheric conditions in different seasons, and the quantities of temperature and precipitable water are associated with the types of air masses. Rimkus et al. [4] revealed the atmospheric circulation patterns during dry periods in Lithuania and specified that drought persistence in the Baltic region is always predetermined by anticyclonic solid circulation. Chadee and Clark [5] extracted seven atmospheric circulation patterns in the Caribbean by analyzing two-stage clustering in the k-means algorithm for 850 hPa wind components from NCEP/DOE analysis data from 1970 to 2010. Smith and Sheridan [6] clustered geopotential height anomalies at levels of 100, 10 hPa, and the sea level pressure to study patterns of tropospheric and stratospheric potential vorticity. In Iran, Raziei [7], by PCA classification and clustering, identified 18 atmospheric circulation patterns for the Middle East and Iran. It was demonstrated that patterns with meridional and northwesterly flow often cause drought, and patterns with southwesterly flow cause wet events. In addition, Raziei et al. [8] identified regional spatial modes of daily precipitation variability by PCA. Results suggest that the large-scale circulation types (the geographical position of the mid-tropospheric troughs/ridges and the low-tropospheric Arabian anticyclone over the Middle East) mainly govern the spatial distribution of precipitation over Iran. Raziei et al. [9] investigated the space and time variability of winter dry/wet events and their associated large-scale atmospheric driving circulations. Results show that the circulation types (CTs) are potential predictors for the winter dry/wet events in western Iran. Omidvar et al. [10] identified atmospheric circulation patterns involved in wet/dry periods using the PCA method in central Iran. The Siberian, high to the south, and the formation of high atmospheric stability in the study area were characterized by cold air descent and cloudlessness, which led to low precipitation and drought events. Atmospheric circulation patterns identified for Iran are based on monthly average atmospheric data and with a resolution of 2.5° [11,12,13,14,15].
Due to the importance of winter as the main rainy season in Iran, the identification of atmospheric circulation patterns of other seasons has been less studied. On the other hand, most studies have been conducted regionally in a province/small part of the country [16,17]. This study has classified the synoptic patterns affecting Iran and the Middle East from 1990 to 2019, using the PCA method for all seasons and with a higher accuracy using data with 0.5° resolution on a daily time scale. Then, composite maps of the mean sea level pressure (MSLP), and 500 hPa geopotential height (GPH) were prepared and analyzed. Previous studies have focused mainly on 500 hPa and MSLP parameters. However, in the present study, the 850-hPa moisture flux, which was considered an important quantity for the precipitation occurrence, was calculated and analyzed in each of the patterns. Moreover, the performance index (PI) was studied to examine the relationship between precipitation occurrence and each circulation pattern.
2. Materials and Methods
2.1. Study Area
The study area (Figure 1) was selected as longitude 20–65° E and latitude 10–55° N, and it included all climate systems affecting Iran.
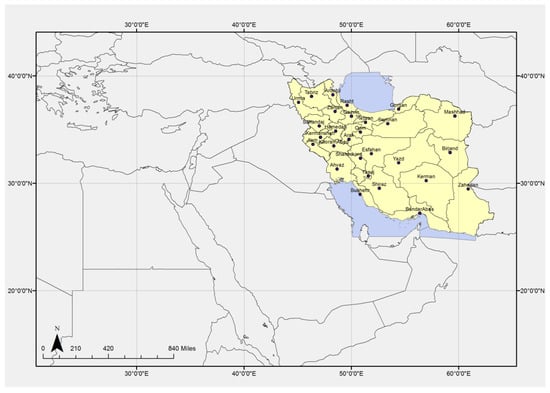
Figure 1.
Study area.
2.2. Data
The classification of atmospheric circulation patterns in Iran and the Middle East was performed and analyzed using geopotential height data at the level of 500 hPa as a reference level representing the middle level of the atmosphere and is almost free from land surface topography effects. The hourly gridded (0.25° × 0.25°) GPH at 500-hPa levels were obtained from the ECMWF reanalysis datasets for a period of 30 years (1990–2019). To the hardware limitations, gridded data with 0.5° were used. Daily mean values of GPH of 500 hPa were computed from the hourly data. Therefore, the data matrix includes 8281 columns (grid points) and 10,957 rows (number of days).
In the continuation, sea level pressure data were prepared for sea level pressure maps, and horizontal wind speed, temperature, and relative humidity level data of 850 hPa were received for calculation and preparation of moisture flux divergence maps. In the next step, precipitation data obtained from 112 synoptic stations on a daily basis over 30 years (1990–2019) were used for studying wet/dry events in Iran. The characteristics of the stations are in Table 1.

Table 1.
Synoptic stations in Iran.
2.3. Methods
2.3.1. Principal Component Analysis
The purpose of PCA is to find the number of components that explain the observed correlations between variables. The maximum number of components equals to the number of variables; the first major component extracted has the largest amount of data variance in the entire dataset. The second component considers the largest dataset not calculated by the first component and is not correlated with the first component. The first few components are selected with values greater than one that covers a large portion of the variance described, and the other minor components are ignored. In the present study, PCA method with an S array was used to analyze and select the components.
2.3.2. Clustering
There are different clustering methods and algorithms for classifying days that are meteorologically homogeneous. Among the various methods, the multi-core clustering method (k-means) is well known and widely used. This method selects the days of the sample to show the mean conditions of each air mass, and then the other days are determined to the nearest cluster based on its distance from the mean values of the sample days. This process is repeated and the average of the newly selected days is calculated along with the update of the effective group membership. This method ends after repetition that does not create any new makeup [7].
In the present study, clustering by the k-means method was used to classify air types so that it presents the most alternating patterns of atmospheric circulation in the study area during the year. After selecting the main components and determining the component scores, all days (10,957 days) were classified into 18 groups [15] during 1990–2019.
2.3.3. Preparation of Combined Maps
Sea level pressure and geopotential height of 500-hPa maps were prepared and interpreted for each CP. The relationship between the spatial distribution of the moisture flux level of 850 hPa, which is one of the primary and important quantities in the occurrence of rainfall, was investigated. The 850-hPa level was selected to study the moisture flux, because most precipitation clouds are formed at an altitude of less than 2700 m in Iran, which is lower than the level of 700 hPa (approximately 3000 m). Moreover, the 925-hPa level is below the ground level in the study area. Therefore, its data are not measured. Moisture flux of 850 hPa was calculated and analyzed according to Equation (1) [18].
Concerning (1) MFC, it refers to the convergence of the moisture flux (gr/kg*s). To the right of the relation, the first sentence shows the horizontal advection of specific humidity, and the second sentence denotes the product of the specific humidity and horizontal mass convergence.
It should be noted that the scope of the study includes all water areas affecting Iran (Mediterranean Sea, Red Sea, and the Arabian Sea), which are important sources of rainfall moisture.
2.3.4. Dry/Wet Events Analysis
To identify dry/wet periods, many indicators have been introduced so far. Indicators based only on rainfall variables can well identify rainfall anomalies and dry and wet periods. This study used the precipitation data obtained from 112 synoptic stations daily over a 30-year statistical period (1990–2019).
The performance index (PI) was used to evaluate the relationship between atmospheric circulation patterns and wet/dry events [19]. This index defines the conditional probability of precipitation occurrence and precipitation intensity in a circulation pattern. PI quantifies the relevance of each circulation pattern to the occurrence of precipitation by comparing the daily mean precipitation of a given circulation type i, with the climatological daily mean precipitation.
where ni is the number of days of pattern i, Ri is the total amount of precipitation during those days, and R is the total precipitation received in the entire study period of n days. Thus, a PI(i) value for a particular type i measures the relative contribution of that type to the total precipitation. A PI(i) much higher than one indicates that type i contributes to the total precipitation, and the wet period prevails. A PI(i) much less than one indicates that type i does not participate much in the area precipitation, so an increase in the frequency of such a pattern reduces the precipitation and, consequently, causes drought in an area.
3. Results and Discussion
In the present study, atmospheric circulation patterns affecting Iran’s climate were identified and analyzed by principal component analysis with S array. The data matrix was the geopotential height of 500 hPa with a resolution of 0.5° in all days of the year during 1990–2019. Based on Table 2, which shows the percentage of variance described by the vectors; 95.93% of the total variance of the data is explained by nine components. In addition, the first component with 72.18% variance has the most roles in explaining the variance of the data; the other components have less weight. All days (10,957 days) were divided into 18 groups. Figure 2, Figure 3, Figure 4, Figure 5 and Figure 6 show the mean sea level pressure patterns, 500-hPa geopotential height, and 850-hPa moisture flux in circulation patterns 1 to 18. These patterns are explained in detail below.

Table 2.
Percentage of variance of the selected components of PCA on 500-hPa geopotential height.
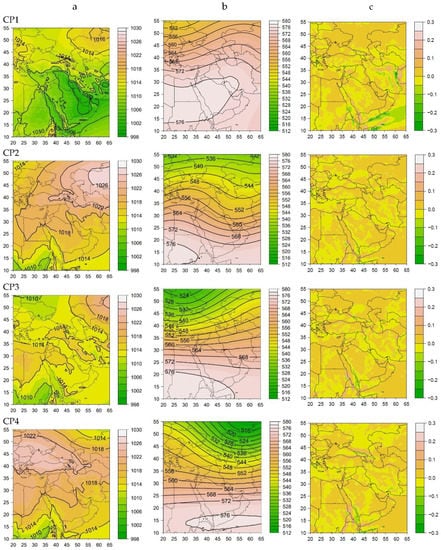
Figure 2.
Atmospheric circulation patterns in Iran in the period of 1990–2019 for patterns CP1 to CP4, (a) average sea surface pressure (hPa), (b) average geopotential height of 500 hPa (dm), and (c) average moisture flux divergence () (convergence with negative values in green).
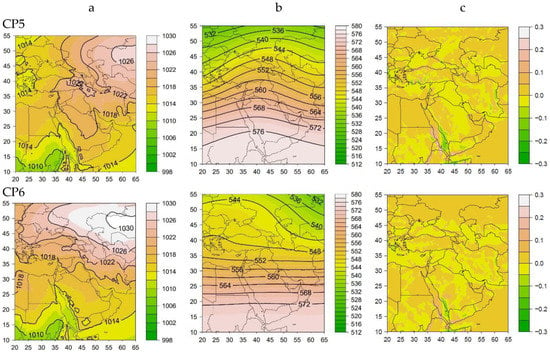
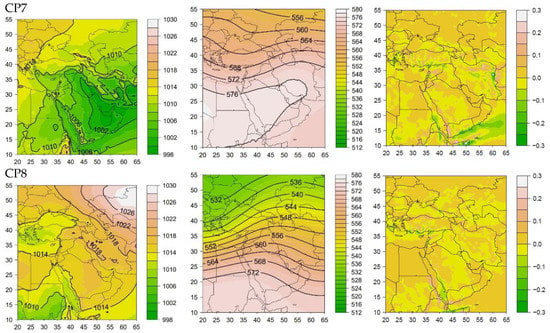
Figure 3.
As in Figure 2, for patterns 5–8.
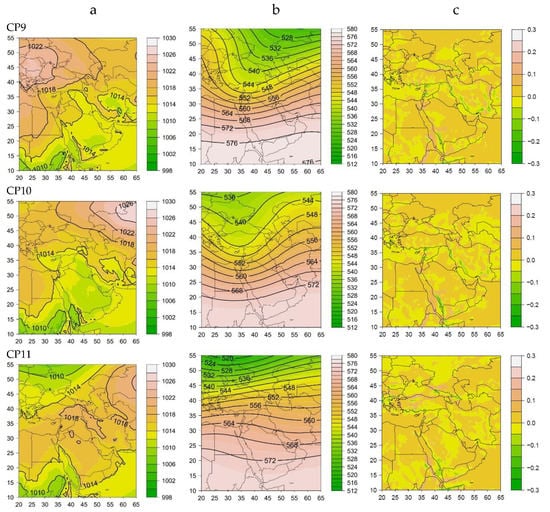

Figure 4.
As in Figure 2, for patterns 9–12.
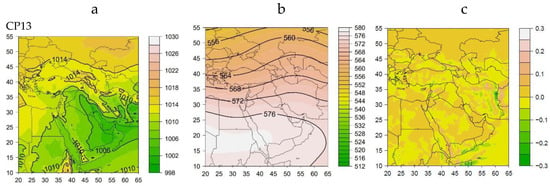
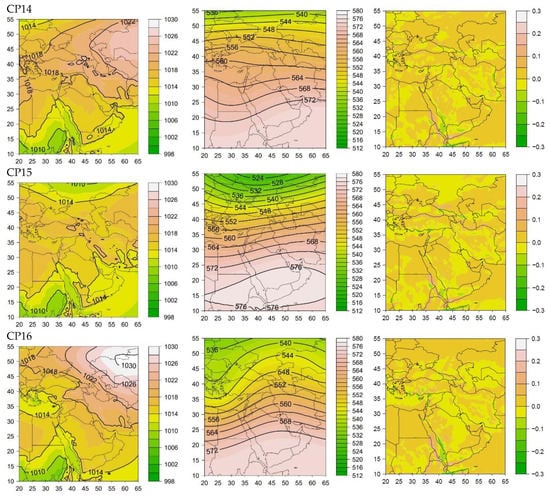
Figure 5.
As in Figure 2, for patterns 13–16.


Figure 6.
As in Figure 2, for patterns 17–18.
Circulation pattern 1: According to the sea level pressure map, the low thermal pressure of 1002 hPa is in the south and southwest of Iran and the 1006-hPa pressure covers east and southeast of Iran, Iraq, and Saudi Arabia. A high pressure of 1016 hPa can be observed in Russia. In the 500-hPa geopotential height, the subtropical high, associated with the surface thermal low, is located below 30° latitude and extends from northeastern Africa to the southwest and south of Iran. A weak trough is in Eastern Europe and a ridge due to a subtropical high extending to the Caspian Sea’s east. This pattern occurs in summer. The average moisture flux of 850 hPa reveals convergence in the eastern parts of Iran with a maximum value of 0.28 and on the sea borders of Yemen, Oman and the southern Red Sea. This condition is compatible with the surface thermal low pressure over southern parts of Iran and the resulting southern currents from the Arabian Sea. Therefore, this pattern shows the establishment of warm and dry conditions in the study area.
Circulation pattern 2: A siberian high pressure with a center of 1026 hPa extends to the northern strip of Iran with relatively low pressure in the south of Iran. At the middle level of the atmosphere (500 hPa), the trough extends east of the Caspian Sea toward central and southern Iran to eastern Saudi Arabia. A convergence of moisture flux at the level of 850 hPa is seen in the southern parts of Iran, and the southern part of the Red Sea. The establishment of this pattern shows wet conditions in the eastern half of the country and significant precipitation is expected, especially in the east and southeast.
Circulation pattern 3: A low pressure (1012 hPa) is in Eastern Europe and low geopotential height is at the level of 500 hPa in this region. The subtropical high is located below the latitude of 20°. Relatively weak moisture flux convergence is observed in parts of the west and east of Iran and the south of the Red Sea. Therefore, light wet events were expected in the country.
Circulation pattern 4: In this pattern map, low pressure prevails over Russia, which is associated with the trough extending from the northeast of the Caspian Sea to the central parts of the country. The high-pressure 1024 hPa extends from southern Europe and the Black Sea to the edge of Iran’s northwestern borders, which is accompanied by a ridge in the middle level of the atmosphere. The sub-tropical high was observed below 20° latitude. There is a relative convergence of moisture flux in east and southeast Iran and the southern Red Sea parts. Therefore, wet events are expected in the east and southeast of the country.
Circulation pattern 5: Similarly, to pattern 2, the Siberian high pressure with a center of 1026 hPa has penetrated to the northern half of Iran. At the level of 500 hPa, the trough extends east of the Caspian Sea towards the east of Iran. At the same time, a ridge stretches along the meridian from Saudi Arabia to the west of the Caspian Sea. The average pattern of moisture flux indicates convergence in the northeast of the Mediterranean Sea, east of Iran with a maximum value of −0.11, and south of the Red Sea with a maximum value of −0.12. Therefore, wet events are expected in parts of the east and southeast of the country; dry events will be seen in other parts of the country.
Circulation pattern 6: A siberian high pressure with a center of 1030 hPa has penetrated Iran’s northern half. There is a trough in the east of the Caspian Sea towards the northeast of Iran. The contour lines are orbital below 35° in 500 hPa. There is a convergence of moisture flux in parts of east and southeast of Iran and south of the Red Sea. Thus, wet events are more expected in the east and southeast of Iran.
Circulation pattern 7: A sea surface pressure pattern shows low thermal pressure in most parts of Iran (except the northern strip of the country), Iraq, southern Turkey, Saudi Arabia, and East Africa. In the 500-hPa geopotential map, the subtropical high is below 30° latitude. Its extension continues from northeast Africa to the southern half of Iran, and its ridge extends to the northeast of the country. In addition, the trough can be seen from the Black Sea northeast to the Mediterranean east and even north of the Red Sea. There is a convergence of moisture flux in the northeast of the Mediterranean Sea and south of Turkey. Dry events are expected in all parts of the country.
Circulation pattern 8: A siberian high pressure with a center of 1028 hPa is in an latitude of 50° and has spread to the lower latitudes, covering Iran. Low pressures are located on the Red Sea as well as in the center of the Mediterranean. In the atmosphere middle level, a trough can be seen from the west of the Black Sea towards the central parts of the Mediterranean. The gradient of the contours is relatively high (40 dam) between latitudes of 20 to 40 degrees. In addition, a weak trough is in the southeast of Iran. The pattern of moisture flux shows convergence in southern Turkey and the southern Red Sea. Hence, there is an expectation of dry events in most of the country except the southeast.
Circulation pattern 9: An Eastern European high pressure with a center of 1024 hPa is in the west of the Black Sea and is penetrating Iran from the west of the Caspian Sea. In other parts of the country, relatively low pressure is established. In the middle level, a deep trough with a positive slope is in the north of the Caspian Sea towards the east of Turkey and then stretched to the north of the Red Sea. The gradient of contours is relatively high, between latitudes of 25° to 45°. The moisture flux pattern shows convergence in the south of the Red Sea, northeast of the Mediterranean Sea, and most parts of Iran. During the activity of this pattern, the establishment of wet weather conditions and precipitation in most parts of the country (except southwest), especially the northwest, west, southwest, and central Zagros, are predicted.
Circulation pattern 10: In the surface map, a low pressure (1010 hPa) is located at the south of the Red Sea and toward Iran’s west and southwest borders. In the atmosphere, the middle level is associated with a deep trough that stretches from the north of the Black Sea to the middle part of the Red Sea, and Iran, the western half, is located in the east of this trough. Moisture flux convergence is in the south of the Red Sea, east of the Mediterranean, and in the west, southwest, and parts of southern Iran, with a maximum value of −0.11. Therefore, gradually wet events will be happening in those areas, and with the mid-level trough progress to the east, central, southern, northeastern regions, and east of the country.
Circulation pattern 11: With the spread of Siberian high pressure to lower latitudes, most Iran, eastern Turkey, Iraq, Saudi Arabia, and the eastern Mediterranean have been affected by relatively high pressure. A weak trough is passing through the east of the country. The moisture flux pattern shows relatively weak convergence in the southern Red Sea and southwestern Turkey. With the establishment of this pattern, dry events are predicted in most parts of the country; however, relatively humid conditions will occur in the eastern part of the country.
Circulation pattern 12: The southern, central, and eastern parts of Iran affected by the Red sea extended low pressure. At the mid-level of the atmosphere, cut-off low (540 hPa) is over the Black Sea, and the trough stretches from the Black Sea to the southern Mediterranean. The gradient of the contours is high, between 20° and 35° latitudes. The convergence of moisture flux is in the northeast of the Mediterranean Sea, southern Turkey, western and northwestern Iran, and the southern Red Sea, with a maximum value of −0.12. Wet weather conditions are expected, especially in the western half of the country.
Circulation pattern 13: Most parts of Iran, Saudi Arabia, Iraq, and the Red Sea are subject to low thermal pressure, which is associated with the subtropical high from northeastern Africa to southern Iran. The ridge stretches to the north of the Caspian Sea; in addition, there is a weak trough in western Turkey. Convergence of moisture flux at a level of 850 hPa is in the northeast of the Mediterranean Sea. In parts of eastern Iran, consistent with southern thermal low pressure currents, moisture convergence is seen. The establishment of dry weather in most parts of the country is predicted. Wet events will occur only in the northern northwest of the country.
Circulation pattern 14: The Siberian high pressure (1024 hPa) is expanding to the northern half of Iran, and low pressure is established on the Red Sea and spreads toward Saudi Arabia and the south of Iran. At the 500-hPa level, a trough can be seen from the southeast Mediterranean to the western Red Sea. The convergence of moisture flux is in the south of the Red Sea. Therefore, favorable humid weather conditions will occur in the western parts of the country.
Circulation pattern 15: A high pressure affects the northern parts of Iran and the Zagros Mountains, and a low pressure is observed on the Red Sea. A sub-tropical high is located in the south of the Red Sea and south of Saudi Arabia. A weak trough passes through high latitudes north of the Black Sea. There is a weak convergence of moisture flux in southwestern Turkey and south of the Red Sea. Wet conditions are likely to occur in the western parts of the country.
Circulation pattern 16: A Siberian high pressure with a center of 1030 hPa has penetrated the northeast of the Caspian Sea to the northern half of Iran. The low pressure is on the Mediterranean, and another low pressure is on the Red Sea, which is accompanied by a deep trough in the mid-level of the atmosphere in this region. Convergence of moisture flux is observed in the Red Sea, northeast of the Mediterranean Sea, and parts of the western country. Therefore, wet events are expected in the western and southwestern regions of the country.
Circulation pattern 17: The relatively low pressure that forms in the south of the Red Sea affects most parts of the country. There is a deep trough in the country’s northwest in the middle level of the atmosphere, which, in the southern part, stretches over Iraq, Saudi Arabia, and the Red Sea. Convergence of moisture flux is observed in most parts of the country, especially in the southern half of Iran. Favorable conditions for wet events are predicted in most parts of the country, especially the southwest and south.
Circulation pattern 18: An Eastern European high pressure extends to the north of Iran, but most parts of the country are affected by thermal low pressure that extends from the Red Sea to Saudi Arabia, Iraq, and Iran. The subtropical high is observed from northeastern Africa to southern Iran in the middle level of the atmosphere. There are two weak troughs in the eastern Mediterranean and another is in the northeast of the Caspian Sea. Convergence of moisture flux is in the southern shores of the Caspian Sea and eastern parts of Iran. Due to the passage of the shallow trough over the Caspian Sea and the northern currents of Eastern Europe, high pressure and wet events will happen in the southern shores of the Caspian Sea.
Figure 7 shows the PI index values in each of the 18 circulation patterns, respectively. The value of the PI index in CP1 (Figure 7a) is less than one in the country, which indicates the lack of impact of this pattern on the country’s precipitation. Therefore, the activity of this circulation pattern causes drought in Iran. In CP2 (Figure 7b), except for the northwest and west areas of the country, in other regions, the value of the PI index is greater than one, which indicates the significant contribution of this pattern in precipitation in the country. However, the most significant impact of this pattern is observed in the east and southeast. The present pattern is one of the precipitation patterns and causes wet events in most parts of Iran.
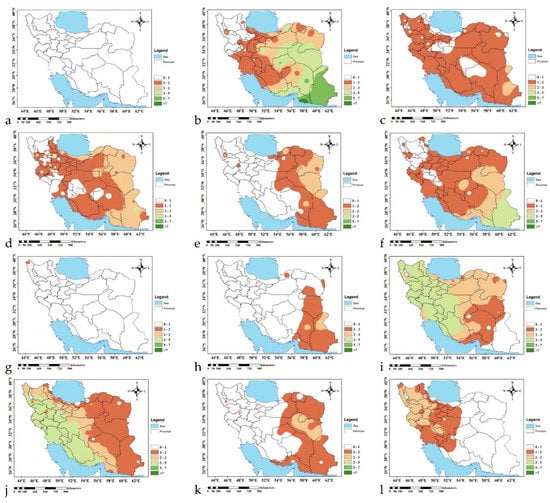
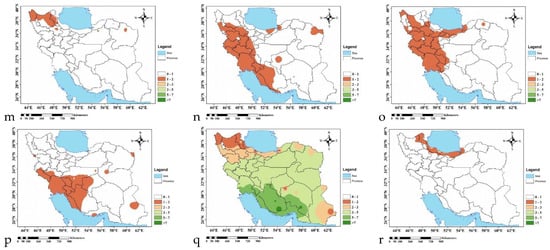
Figure 7.
PI Index for patterns 1–18 (a–r), respectively.
PI value is more than one in most areas in CP3 (Figure 7c); the present pattern is as a moderate precipitation pattern of a wide area of Iran. However, in some parts of the center and the southern shores of the Caspian Sea, due to the value of the index, which is less than one, they will have dry conditions. In CP4 (Figure 7d) and in the northwest, some parts of the west, southwest, and central of Iran, the value of PI is less than one; however, in most parts of the country, the index value is more than one. Therefore, most regions of the country, especially in the eastern half of Iran, will experience rainy events.
The value greater than one for the PI index in the east indicates that the dominance of CP5 will cause wet conditions in these areas and drought in the rest of the country (Figure 7e). In CP6 (Figure 7f), the index value is more than one (except the northwest, some parts of the west, and the north Zagros mountain area). Therefore, most regions of the country with the establishment of this pattern will have significant rainfall, mostly in east and southeast regions. Circulation pattern 7, similar to CP1, does not play a significant role in the country’s precipitation and cause drought in the whole country because the index value in the whole country is less than one (Figure 7g). According to Figure 7h, only the east and southeast of the country will experience wet events in pattern 8, and dry conditions are established in most country areas.
The spatial distribution of the PI index demonstrates that pattern 9 has the most significant effect on precipitation in the western half of Iran, and by moving this system to the east, the effect of this pattern on rainfall in the eastern regions, especially in the southeast of the country, is reduced. Its activity causes wet events in most parts of Iran (Figure 7i). Figure 7j is the best case in precipitation for the whole country because PI is more than one in all parts of the country. However, with this system moving to the east, the pattern 10, on precipitation in the country’s eastern regions, is slightly reduced. The activity of the present pattern causes wet events all over the country.
Circulation pattern 11, similar to CP5, indicates the dominance of wet conditions in the eastern half of the country and drought in the rest (Figure 7k). In Figure 7l, values greater than one for the PI index are seen in the western half of the country. Therefore, in CP12, precipitation is expected in the northwest, west, central Zagros, and center of the country. In Figure 7m, the index value in the country (except for a small part of the northwest) is less than one. Therefore, the establishment of pattern 13 will lead to drought for the country.
The effect of pattern 14 on precipitation is more significant in the west, southwest, and west of the south area of Iran, where the PI index value is between 1 and 2 (Figure 7n). In Figure 7o, the index results show values between 1 and 2 in the northwest, west, southwest, and eastern areas of the southern coast of the Caspian Sea. Therefore, the current pattern causes rainfall only in the mentioned areas and drought in other parts of the country.
The southwest, parts of the south and center of Iran have more than one PI value (Figure 7p), which can have a relative effect on precipitation in these areas. In Figure 7q, favorable conditions for precipitation are in the whole country, especially the southwest and south of the country, due to the values of more than 3 for the PI index. In Figure 7r, in CP18, only the southern shores of the Caspian Sea and Ardabil province will experience wet conditions, and in other parts of the country, this pattern will be accompanied by drought.
These results are in agreement with the findings of [12] that the east Mediterranean trough affects the western part of the country while the Caspian trough affects the eastern parts of Iran and [9] that wet events in central and southwestern Iran are mainly related to the occurrence of a deep and large trough over the eastern Mediterranean Sea and the Red Sea. In the third, which is exclusively due to regional conditions and topography of the southern shores of the Caspian Sea, the establishment of high pressure on the Caspian Sea is associated with the passage of the trough on the sea.
In general, according to this study, in all precipitation patterns, there is a relationship between anticyclonic circulation on the Arabian Sea and the Arabian Peninsula at the surface and trough of the mid-level of the atmosphere [8]. Anticyclonic circulation by southeast, south, and southwest currents transfers moisture from southern water sources (Indian Ocean, Arabian Sea, and the Red Sea) to Iran [20]. In addition, the trough provides ascending motions in the region.
4. Conclusions
Determining the atmospheric circulation patterns and their relationship with precipitation will be valuable and effective in weather forecasting and regional planning. The present study used principal component analysis with S array and k-means clustering to classify circulation patterns in the Middle East and Iran. Afterward, the relationship between circulation patterns and precipitation occurrence was investigated. Significant differences in the arrangement of patterns, their moisture, and precipitation conditions in Iran were observed.
In the circulation patterns of the dry events (CPs 1,7,13), low thermal pressure from southern India, below 35°N is associated with subtropical high at the mid-level atmosphere. The maximum moisture flux of 850 hPa in the eastern parts of Iran and the Yemen/Oman maritime borders is compatible with the southern and southeastern flow. In CPs 2, 4, 5, 6, 8, and 11, wet events occur in the east and dry events often happen in the west of the country; the ridge of subtropical high is found in northwestern Iran, Iraq, and Saudi Arabia or in the eastern Mediterranean and the trough passes the eastern parts of Iran. High pressure covers the northern half of the country. There is the convergence of moisture flux in the east and southeast of Iran. In other patterns (CPs 9, 12, 14–16), dry events occur in the east of country, and low pressure in the south and center of the Red Sea is associated with the mid-level atmosphere trough in the eastern Mediterranean to Red Sea. Convergence of moisture flux was in the west, southwest, south, and northwest of Iran. While in wet events of the whole country (CPs 3, 10, 17), low pressure penetrating from the west and south of Iran covered most parts of the country. A relatively deep trough covered the Black Sea to North Africa and the Red Sea. Suitable humidity can be observed in the west, south and east of Iran, as well as in Syria and the Red Sea. In CP 18, due to the special mountainous conditions in the south and the Caspian Sea in the north, the establishment of high pressure on the sea is accompanied by the passage of a mid-level atmosphere trough over the southern shores of the Caspian Sea.
According to the patterns of the PI index, it can be observed that the occurrence of precipitation in Iran follows three patterns. In the first pattern, in which precipitation often occurs in the western regions of the country, the southern low pressure extends from the Red Sea through Saudi Arabia to Iran, while the mid-level trough of the atmosphere flows from the Mediterranean to the southern parts of the Red Sea (CPs: 3, 9, 10, 12, 14–16). In the eastward movement of this pattern, if the trough is not weakened and the moisture conditions are favorable, precipitation would be observed in the eastern parts of the country. In the second, the southern regions of Iran are affected by low pressure, and the northern regions are affected by the high pressure of Eastern Europe or Siberia. The trough is extended from the north of the Caspian Sea to the center and south of Iran. This pattern is raining in the eastern regions of the country (CPs: 2, 4–6, 8, 11).
The use of data with a resolution of 0.5° clearly demonstrates more details of the regional characteristics of high and low pressures, as well as mid-level of atmosphere low and high, which could not be distinguished and observed in previous studies. As a result, these details can be used in local analysis to achieve more accurate spatial and temporal results. In addition, the performance index was used to evaluate the relationship between atmospheric circulation patterns and precipitation. This index shows the conditional probability of precipitation occurrence and its intensity in a circulation pattern for each region. This paper focuses on the effect of atmospheric circulation patterns on rainfall distribution in Iran. In other studies, the authors will examine the effect of atmospheric circulation patterns on the occurrence of flood, heavy snowfall, and frost, etc.
Author Contributions
Conceptualization, Z.G., E.F. and M.H.; Data curation, Z.G.; Formal analysis, Z.G.; Investigation, Z.G.; Methodology, Z.G. and E.F.; Project administration, Z.G. and E.F.; Software, Z.G.; Supervision, E.F.; Validation, Z.G.; Visualization, Z.G.; Writing—original draft, Z.G.; Writing—review & editing, M.H. and E.F. All authors have read and agreed to the published version of the manuscript.
Funding
This research, received no external funding and the APC was funded partially by IOAP participant: University of Graz.
Institutional Review Board Statement
Our work is original. It was not published in another journal and it have not been submitted to other journal.
Informed Consent Statement
The authors consent to their participation in the article entitled “Daily atmospheric circulation patterns and their influence on dry/wet events in Iran” by Zahra Ghassabi, Ebrahim Fattahi and Maral Habibi.
Data Availability Statement
All data used in this study are available upon request. The data that support the findings of this study are openly available in https://cds.climate.copernicus.eu/cdsapp#!/dataset/reanalysis-era5-pressure-levels?tab=form, accessed on 22 November 2021; the precipitation data that support the findings of this study are available from the www.weather.ir (accessed on 22 November 2021) upon reasonable request.
Acknowledgments
The authors acknowledge the financial support provided by the University of Graz. We would like to thank all the Data providers. Data were provided by Iran Meteorological Organization, the European Centre for Medium-Range Weather Forecasts (ECMWF) and Integrated Climate Data Center—ICDC.
Conflicts of Interest
The authors declare no conflict of interest.
Ethics Approval
(1) This material is the authors’ original work, which has not been previously published elsewhere. (2) The paper is not currently being considered for publication elsewhere. (3) The paper reflects the authors’ research and analysis wholly and truthfully. (4) The paper properly credits the meaningful contributions of co-authors and co-researchers. (5) The results are appropriately placed in the context of prior and existing research. (6) All sources used are correctly disclosed (correct citation). Copying of text must be indicated as such by using quotation marks and giving proper reference. (7) All authors have been personally and actively involved in substantial work leading to the paper and will take public responsibility for its content. The violation of the Ethical Statement rules may result in severe consequences. I agree with the above statements and declare that this submission follows Solid-State Ionics’ policies outlined in the Guide for Authors and the Ethical Statement.
Consent to Participate
I am a corresponding author; on behalf of the other authors, I declare that we are satisfied with participating in the research.
Consent for Publication
I am a corresponding author; on behalf of the other authors, I declare that we are pleased to publish this valuable Journal research.
References
- Huth, R.; Beck, C.; Philipp, A.; Demuzere, M.; Ustrnul, Z.; Cahynová, M.; Kyselý, J.; Tveito, O.E. Classifications of atmospheric circulation patterns. Ann. N. Y. Acad. Sci. 2008, 1146, 105–152. [Google Scholar] [CrossRef] [PubMed]
- Esteban, P.; Vide, J.M.; Masesc, M. Daily Atmospheric Circulation Catalogue for Western Europe Using Multivariate Techniques. Int. J. Climatol. 2006, 26, 1501–1515. [Google Scholar] [CrossRef]
- Käsmacher, O.; Schneider, C. An Objective Circulation Pattern Classification for the Region of Svalbard. Geogr. Ann. Ser. A Phys. Geogr. 2011, 93, 259–271. [Google Scholar] [CrossRef]
- Rimkus, E.; Kazys, J.; Valiukas, D.; Stankunavicius, G. The atmospheric circulation patterns during dry periods in Lithuania. Oceanologia 2014, 56, 223–239. [Google Scholar] [CrossRef] [Green Version]
- Chadee, X.; Sitaaz, T.; Clark, R.M. Daily near surface large scale atmospheric circulation patterns over the wider Caribbean. Clim. Dyn. 2015, 44, 2927–2946. [Google Scholar] [CrossRef]
- Smith, E.T.; Sheridan, S.C. The influence of atmospheric circulation patterns on cold air outbreaks in the eastern United States. Int. J. Climatol. 2018, 39, 2080–2095. [Google Scholar] [CrossRef]
- Raziei, T. Investigation of the Relationship between 500-hPa Atmospheric Circulation Patterns and Dry and Wet Periods in Western Iran. Ph.D. Thesis, University of Tehran, Tehran, Iran, 2007. [Google Scholar]
- Raziei, T.; Mofidi, A.; Santos, J.A.; Bordid, I. Spatial patterns and regimes of daily precipitation in Iran in relation to large-scale atmospheric circulation. Int. J. Climatol. 2012, 3221, 226–1237. [Google Scholar] [CrossRef] [Green Version]
- Raziei, T.; Bordid, I.; Pereira, L.S.; Real, J.C.; Santos, J.A. Relationship between daily atmospheric circulation types and winter dry/wet spells in western Iran. Int. J. Climatol. 2011, 321, 1056–1068. [Google Scholar] [CrossRef] [Green Version]
- Omidvar, K.; Fatemi, M.; Narangifard, M.; Hatami, K.; Beiglou, B. A Study of the Circulation Patterns Affecting Drought and Wet Years in Central Iran. Adv. Meteorol. 2016, 2016. [Google Scholar] [CrossRef]
- Azizi, G.; Alizadeh, T. Relationship between the Type of Sea Level Circulation Patterns and Widespread Rrainfall in Iran. J. Phys. Geogr. Res. 2014, 46, 297–310. [Google Scholar] [CrossRef]
- Alijani, B. Variations of 500-hPa flow patterns over Iran and surrounding areas and their relationship with the climate of Iran. Theor. Appl. Climatol. 2002, 72, 41–54. [Google Scholar] [CrossRef]
- Hoseyni, A.; Akbari-Ghamsari, H. Identification of synoptic patterns causing heavy rainfall in Taleghan watershed in Alborz province. J. Spat. Anal. Environ. Hazards 2017, 3, 89–100. [Google Scholar]
- Mostafaei, H.; Alijani, B.; Saligheh, M. Synoptic analysis of heavy and widespread rainfall in Iran. J. Spat. Anal. Environ. Hazards 2015, 2, 65–76. [Google Scholar]
- Fattahi, E.; Babaee-Feeni, O. Categorizing of precipitation and drought producing synoptic circulation. J. Geogr. Res. 2014, 29, 105–122. [Google Scholar]
- Darand, M.; Garcia-Herrera, R.; Asakereh, H.; Amiri, R.; Barriopedro, D. Synoptic conditions leading to extremely warm periods in Western Iran. Int. J. Climatol. 2018, 38, 307–319. [Google Scholar] [CrossRef]
- Gayoor, H.A.; Halbian, A.H.; Saberi, B.; Hossain-AliPoorjazi, F. Investigation of the relationship between heavy precipitation and high circulation patterns of the upper atmosphere (Case study: Southern Khorasan province). Nat. Environ. Hazards 2012, 11, 1–27. [Google Scholar] [CrossRef]
- Banacos, P.C.; Schultz, D.M. The Use of Moisture Flux Convergence in Forecasting Convective Initiation: Historical and Operational Perspectives. J. Weather Forecast. 2005, 20, 351–366. [Google Scholar] [CrossRef]
- Zhang, X.; Wang, X.L.; Corte-Real, J. On the relationships between daily circulation patterns and precipitation in Portugal. J. Geophys. Res. 1997, 1021, 3495–13507. [Google Scholar] [CrossRef]
- Ghassabi, Z.; Fathi, M.; Norouzi, M.; Rezazadeh, P. Analysis of Moisture Sources and Spatial-Temporal Patterns Affecting Spring Snowfall in Chaharmahal and Bakhtiari Province of Iran. Geogr. Environ. Plan. 2020, 31, 43–56. [Google Scholar] [CrossRef]
Publisher’s Note: MDPI stays neutral with regard to jurisdictional claims in published maps and institutional affiliations. |
© 2022 by the authors. Licensee MDPI, Basel, Switzerland. This article is an open access article distributed under the terms and conditions of the Creative Commons Attribution (CC BY) license (https://creativecommons.org/licenses/by/4.0/).