1. Introduction
Outdoor air pollution is severely harming global public health. Each year, 4.2 million deaths are attributed to high levels of ambient air pollution globally [
1]. Road transport emissions are a key contributor to this public health burden and have been attributed to 385,000 deaths globally from ambient ozone and PM
2.5 (particulate matter with diameter below 2.5 µm) [
2]. In the UK, ambient PM and Nitrogen Oxide (NO
x) levels are above the WHO guidelines and the interim targets for a significant share of the population, and 28,000–36,000 annual deaths have been attributed to such significantly high levels of pollution [
3,
4]. This has led to an urgent need to focus on reducing population exposure, particularly where it has exceeded the original WHO guidelines [
5,
6]. This urgency in addressing air pollution is also evident in efforts to limit climate change, with attention recently diverted to achieving ‘net-zero’ greenhouse gas emissions by 2050 [
7]. Reducing the emissions from road transport is a central factor in air pollution and climate goals, and the promise of new technologies such as electric vehicles (EVs) may help to achieve such aims. However, this pathway, to decarbonise through EVs, needs to consider the resulting impact on air quality.
Policies to decarbonise road transport in the UK through EVs were first formulated in 2017, which introduced a ban on new sales of all new internal combustion engine vehicles (ICEVs) from 2040, and was later followed up with the UK’s Department for Transport’s (DfT) accompanying ‘The Road-to-Zero’ strategy, introduced later in 2018 [
8]. Yet, this strategy proved to be insufficiently ambitious to meet wider government carbon reduction targets [
9,
10,
11]. As a result, in 2021 the DfT announced their ‘Transport Decarbonisation Plan’ (TDP), a net-zero greenhouse gas emission strategy that bans the sale of ICEV passenger cars and vans from 2030, with the sale of plug-in hybrid electric vehicles (PHEVs) permitted until 2035 [
12]. The TDP also introduces the DfT’s first pathway for heavy goods vehicles (HGVs) and buses to achieve complete decarbonisation. The primary focus of the TDP is to meet the climate goals of the UK government, but its direct impact on air quality has not been considered. In this study we use the pathway set out by the TDP to determine how the rollout of EVs may impact air quality and its associated effects on population health.
Tangential to the attention on reducing carbon emissions from road transport, are recent efforts to reduce air pollutant emissions from ICEVs. Improvements in exhaust emission control technologies, brought in by each new euro standard in the UK and Europe, have significantly reduced emissions of NO
x and PM
2.5 since their peak in the 1990s [
13]. Despite these reductions, emissions from Euro 5 and Euro 6 diesel passenger car and Light Goods Vehicles (LGVs) ICEVs have remained significantly above the regulated limit of NO
x in real world conditions [
14,
15]. This lack of real world emission reduction has contributed to harmful levels of PM
2.5 and NO
x in the UK, leading to the establishment of road transport focused Clean Air Zones across the UK [
16]. However, the latest euro standards are based on real driving emissions (RDE) testing, resulting in manufacturers introducing previously available and effective NO
x exhaust emission control technologies to new diesel cars. This latest euro standard may finally produce the desired real-world performance required to improve urban air quality in Europe. This recent improvement in real world NO
x emissions is used in this study to predict how a future improved ICEV fleet could perform when compared against a fleet with a rollout of EVs.
Non-exhaust emissions, the PM emissions produced from the frictional wearing of brake, tyre and road surfaces, have now surpassed exhaust emissions for PM
2.5 and PM
10 in the UK and across Europe [
17,
18]. This is a result of improvements in exhaust control technologies in ICEVs and has coincided with the growing uptake of zero exhaust emissions vehicles, i.e., battery electric vehicles (BEVs). The greater significance of non-exhaust emissions and the growing number of BEVs has led to a discussion in the literature comparing the exhaust and non-exhaust emissions rates of individual BEVs and ICEVs. The difference in non-exhaust emissions for EVs relies on a relationship between vehicle curb mass and non-exhaust emission rates [
19,
20,
21]. Such a relationship would increase tyre and road wear emissions for EVs, as they have a higher curb mass than an ICEV, largely due to the battery pack of the EV. Yet, regenerative braking may reduce brake wear emissions for EVs. We explore how increased curb mass and regenerative braking for EVs may affect fleet PM
2.5 emissions in 2030.
Numerous studies have now demonstrated the way an electrified passenger car fleet can substantially improve air quality [
22,
23,
24]. Yet, in Europe, where emissions from the passenger car fleet is widely affected by poorly regulated diesel vehicles [
14], there are fewer examples, with Soret et al. (2014) providing the most informative study to-date [
25]. Soret et al. (2014) show that in Barcelona and Madrid the greatest benefit for the electrification of passenger cars is a reduction in NO
2 concentrations, with PM
2.5 improvement being limited due to the large contribution of non-exhaust emissions and resuspension. This study contributes to the growing literature on how EVs may impact air quality by examining how the electrification of the UK’s road transport fleet may impact ambient PM
2.5 and NO
x concentrations and the resultant population health impacts.
This paper presents the first set of results from a program conducted by the authors with regard to how different sectors in the UK can improve air quality. Future publications aim to analyse domestic and agricultural sectors and the synergies between climate measures and air quality.
2. Methods
To evaluate the scenario of the electrification of road transport we have used an air quality simulation tool, UKIAM (UK Integrated Assessment Model). UKIAM is a framework of models that is used to assess future scenarios for air pollution in the UK to support the development of abatement strategies [
26]. An overview of the UKIAM framework is provided below, followed by a more detailed description of the road-transport sub-model, BRUTAL (Background, Road and Urban Transport modelling of Air quality Limit values), which was used to represent the road transport scenarios in this study [
27]. Next, the emission factors for the latest ICE and EV technologies, which were implemented in BRUTAL, are provided, with a sensitivity study covering the uncertain change in the non-exhaust emissions of EVs. Finally, the methods for modelling the evolution of the fleet that can be used in future are provided.
2.1. UKIAM Framework
UKIAM is a framework of models that takes the input projections of emissions to determine the ambient concentrations and deposition of pollutants, and the resulting environmental and health impacts across the UK. The framework itself is not an atmospheric model, instead the atmospheric chemistry and dispersion of pollutants are characterized using pre-calculated source-receptor matrices derived from FRAME and EMEP models [
26,
28]. This source receptor approach allows the UKIAM framework to run efficiently compared to traditional atmospheric models and allows for a quick generation and analysis of scenarios. The UKIAM framework takes an input of emissions of NO
x, SO
2, NH
3, PM
2.5, and VOCs from around 90 geographically defined sources within the UK, from shipping and from other countries in Europe. These emissions are mapped geographically, then, using the set of source-receptor relationships that are specific to each source, the resulting concentrations and deposition of pollutants are calculated. Cross-pollutant interactions are quantified in the source-receptor relationships and assumes linear relationships, which are valid for small changes in precursor emissions [
29]. Ambient concentrations of NO
x and NO
2 and primary and secondary PM
2.5 are produced at a 1 km-by-1 km resolution and are used with the distribution of population density over the UK to determine the impact on population health and monetized impacts. A complete description and cases studies derived using the UKIAM framework can be found in [
5,
26]
For this study, we have used the BRUTAL sub-model covering the road transport sector to explore changes in the vehicles fleet and associated emissions with the contribution of emissions from other sources remaining unchanged. Electricity generation emissions remain constant across all scenarios. This projection for electricity generation represents a pathway that can support the electricity demand from a fleet of EVs and illustrates a significant growth in renewable generation by 2030. To avoid oversimplifying the complex dynamics of the future energy system we have chosen not to assume how EV electricity demand will be met, by either a single or a mix of specific power plant types, as has been the case in previous work concerning gas, coal, or renewables [
24,
25]. Instead, each scenario uses the same electricity generation emissions to isolate the changes in vehicle exhaust and non-exhaust emissions. The omission of electricity generation emissions is discussed in the study limitations,
Section 5.1.
2.2. BRUTAL Road Transport Sub-Model
In the BRUTAL sub-model for road-transport the road network is mapped to a 1 km-by-1 km grid, where the emissions from road transport are calculated using a bottom-up approach [
27]. In each grid cell, road lengths that are categorised as rural, urban, or motorway are combined with annual average daily flows to derive the driven vehicle kilometres (vkm). This calculation of vkm in each cell is repeated for each of the following vehicle types: cars, LGVs, rigid HGVs, articulated HGVs, and buses, based on vehicle type specific annual average daily flows. The fleet composition, which specifies the proportion of vkm driven by each fuel type and euro standard of the fleet, is used to further disaggregate the vkm in each cell. Finally, average vehicle speeds, determined by the road type, are used with COPERT based emission factors to calculate emissions of NO
x, NO
2, exhaust PM
10 and PM
2.5 [
30]. For non-exhaust PM
10 and PM
2.5, the tier 2 methodology specified in the EMEP/EEA air pollutant emission inventory guidebook was recently added to the model [
5,
31]. Emissions from cold starts are calculated, as are emissions from vehicles with failed exhaust emission control technologies (e.g., failure of diesel particulate filters). The road transport emissions for each grid cell across the UK are then combined with the other sources in the UKIAM framework, in order to derive the overall ambient concentrations of PM
2.5 and NO
x. Further details of the BRUTAL model can be found in [
27,
32].
2.3. Emissions Factors for New ICEVs and EVs
Real world emissions of NO
x for the latest Euro 6 diesel passenger cars have declined to within the regulatory limit of 80 mg/km, as demonstrated in the latest COPERT 5.4 emission factors, where the emissions for Euro 6d-temp and 6d are found to be 85% and 75% lower than anticipated [
30]. We have implemented this change in the COPERT 5.4 emission factors used in BRUTAL for Euro 6 RDE diesel cars, which brings the NO
x emissions of these vehicles close to that of modern petrol cars.
To align our methods with the UK’s National Atmospheric Emission Inventory (NAEI), we employed their approach for modelling regular hybrid EVs (HEVs) and plug-in hybrid EVs (PHEVs) [
33]. This method uses different emission factors for each of the following types of driving conditions: urban, rural, or motorway, and varies for each type of hybrid.
2.4. Sensitivty Studies for EV Non-Exhaust Emissions
As of yet, a consensus on how non-exhaust emissions from passenger car EVs may differ from conventional ICEVs has not been reached [
34]. To this end, we have used the EMEP/EEA air pollutant emission inventory guidebook’s tier 2 methodology and emission factors for all vehicles [
31]. This methodology considers the emission factors for tyre, brake and road wear, and does not include resuspension. Resuspension is captured by BRUTAL through an empirically derived background contribution and remained constant for all scenarios.
A sensitivity analysis was included for two case studies on how EV non-exhaust emissions may differ for passenger car and LGV EVs. These sensitivity studies were applied to the electrification scenario for the year 2030 (results are given in
Section 4.2 Sensitivity Studies). The remaining heavy vehicle types were unchanged for these sensitivity studies given that evidence suggesting that non-exhaust emissions for EVs will be different for these vehicle types is not yet available.
2.5. Fleet Turnover Model
A fleet turnover model was created to simulate how the UK’s fleet of vehicles evolved year by year. The model produced a yearly snapshot of the fleet in the future, providing a classification of the vehicle kilometres driven (vkm) by vehicle type, fuel type, and euro standard.
The fleet turnover model used a scenario of annual vehicle sales and related these to the starting fleet stock (starting in 2019), which was provided by the UK’s Department for Transport (DfT) online licensing data tables. The turnover of vehicles in the fleet was then simulated using the survival curves from the NAEI [
33]. The survival rate reveals the number of vehicles that remain in the fleet year by year. The survival rate used here captures all exit pathways for a vehicle to leave the fleet, such as scrappage or exportation out of the UK. ICEV survival curves were used for EVs as there exists a lack of real-world data for these new vehicle types.
To determine how the stock of vehicles for a given year managed to meet the yearly vkm, required using a mileage–age relationship to bias the vkm towards newer vehicles. A mileage–age profile denotes how the mileage of vehicles declines as they age. In the UK, the newest vehicles are driven the most, with mileage reducing at a consistent rate each year. The mileage–age profiles from Dun et al. (2015) were used for cars and LGVs [
35]. As there were no alternatives available for the remaining vehicle types, the profile for LGVs was applied to the remaining vehicle types: HGVs and buses. It was assumed that the mileage–age profile for EVs follow their ICEV equivalent as no alternative data is yet available for this relationship of EVs.
4. Results
The results are presented in two parts, where the first provides results from 2018 to 2030 for each scenario and the second provides results from 2030 to 2050. This allows us to discuss some of the uncertainties for 2030, and to clearly separate the results of 2030 from the more speculative results beyond 2030, to 2050.
4.1. Emissions
Emissions in 2030 for each scenario are given
Figure 2 and
Figure 3 below. The more uncertain long term results for 2040 and 2050 are given in
Figure 4.
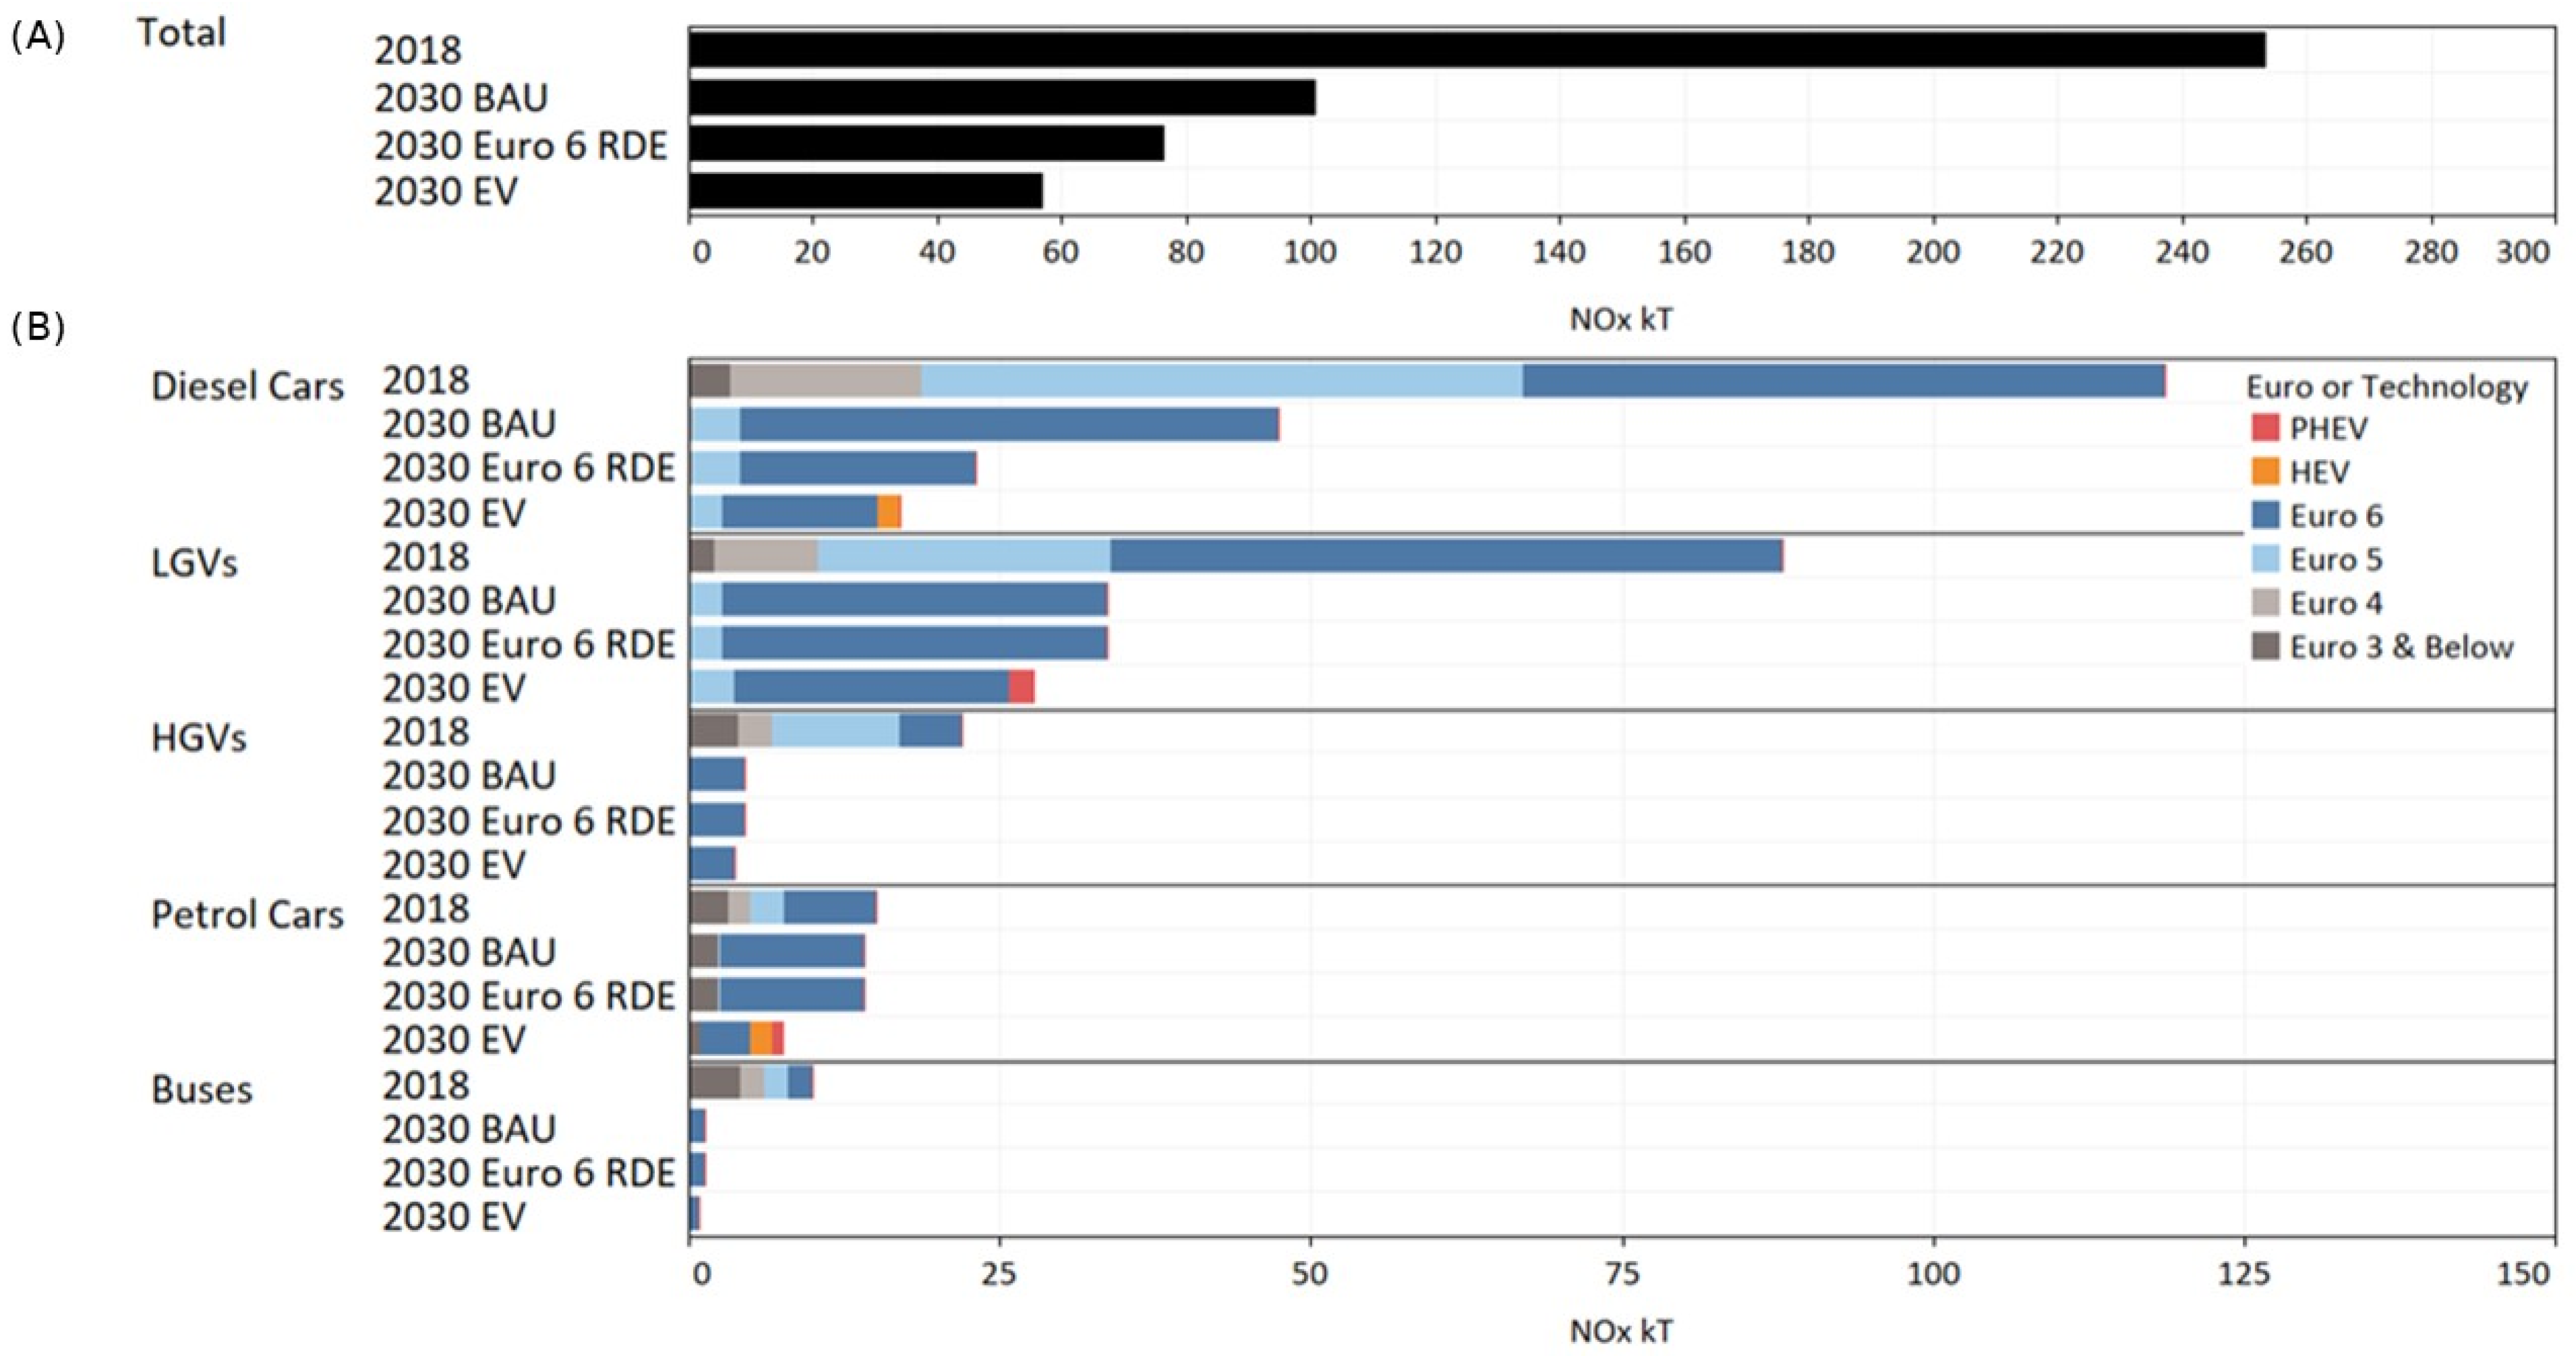
In 2030 for all scenarios, NO
x emissions are well below those observed in 2018. Both the Euro 6 RDE and EV scenarios reduce NO
x beyond the BAU scenario, with emissions from diesel cars reducing the most for a single vehicle type in both scenarios. The yearly total NO
x emissions for each scenario are illustrated in
Figure 2 and are provided for each vehicle type and then further disaggregated by euro standard or technology in colour.
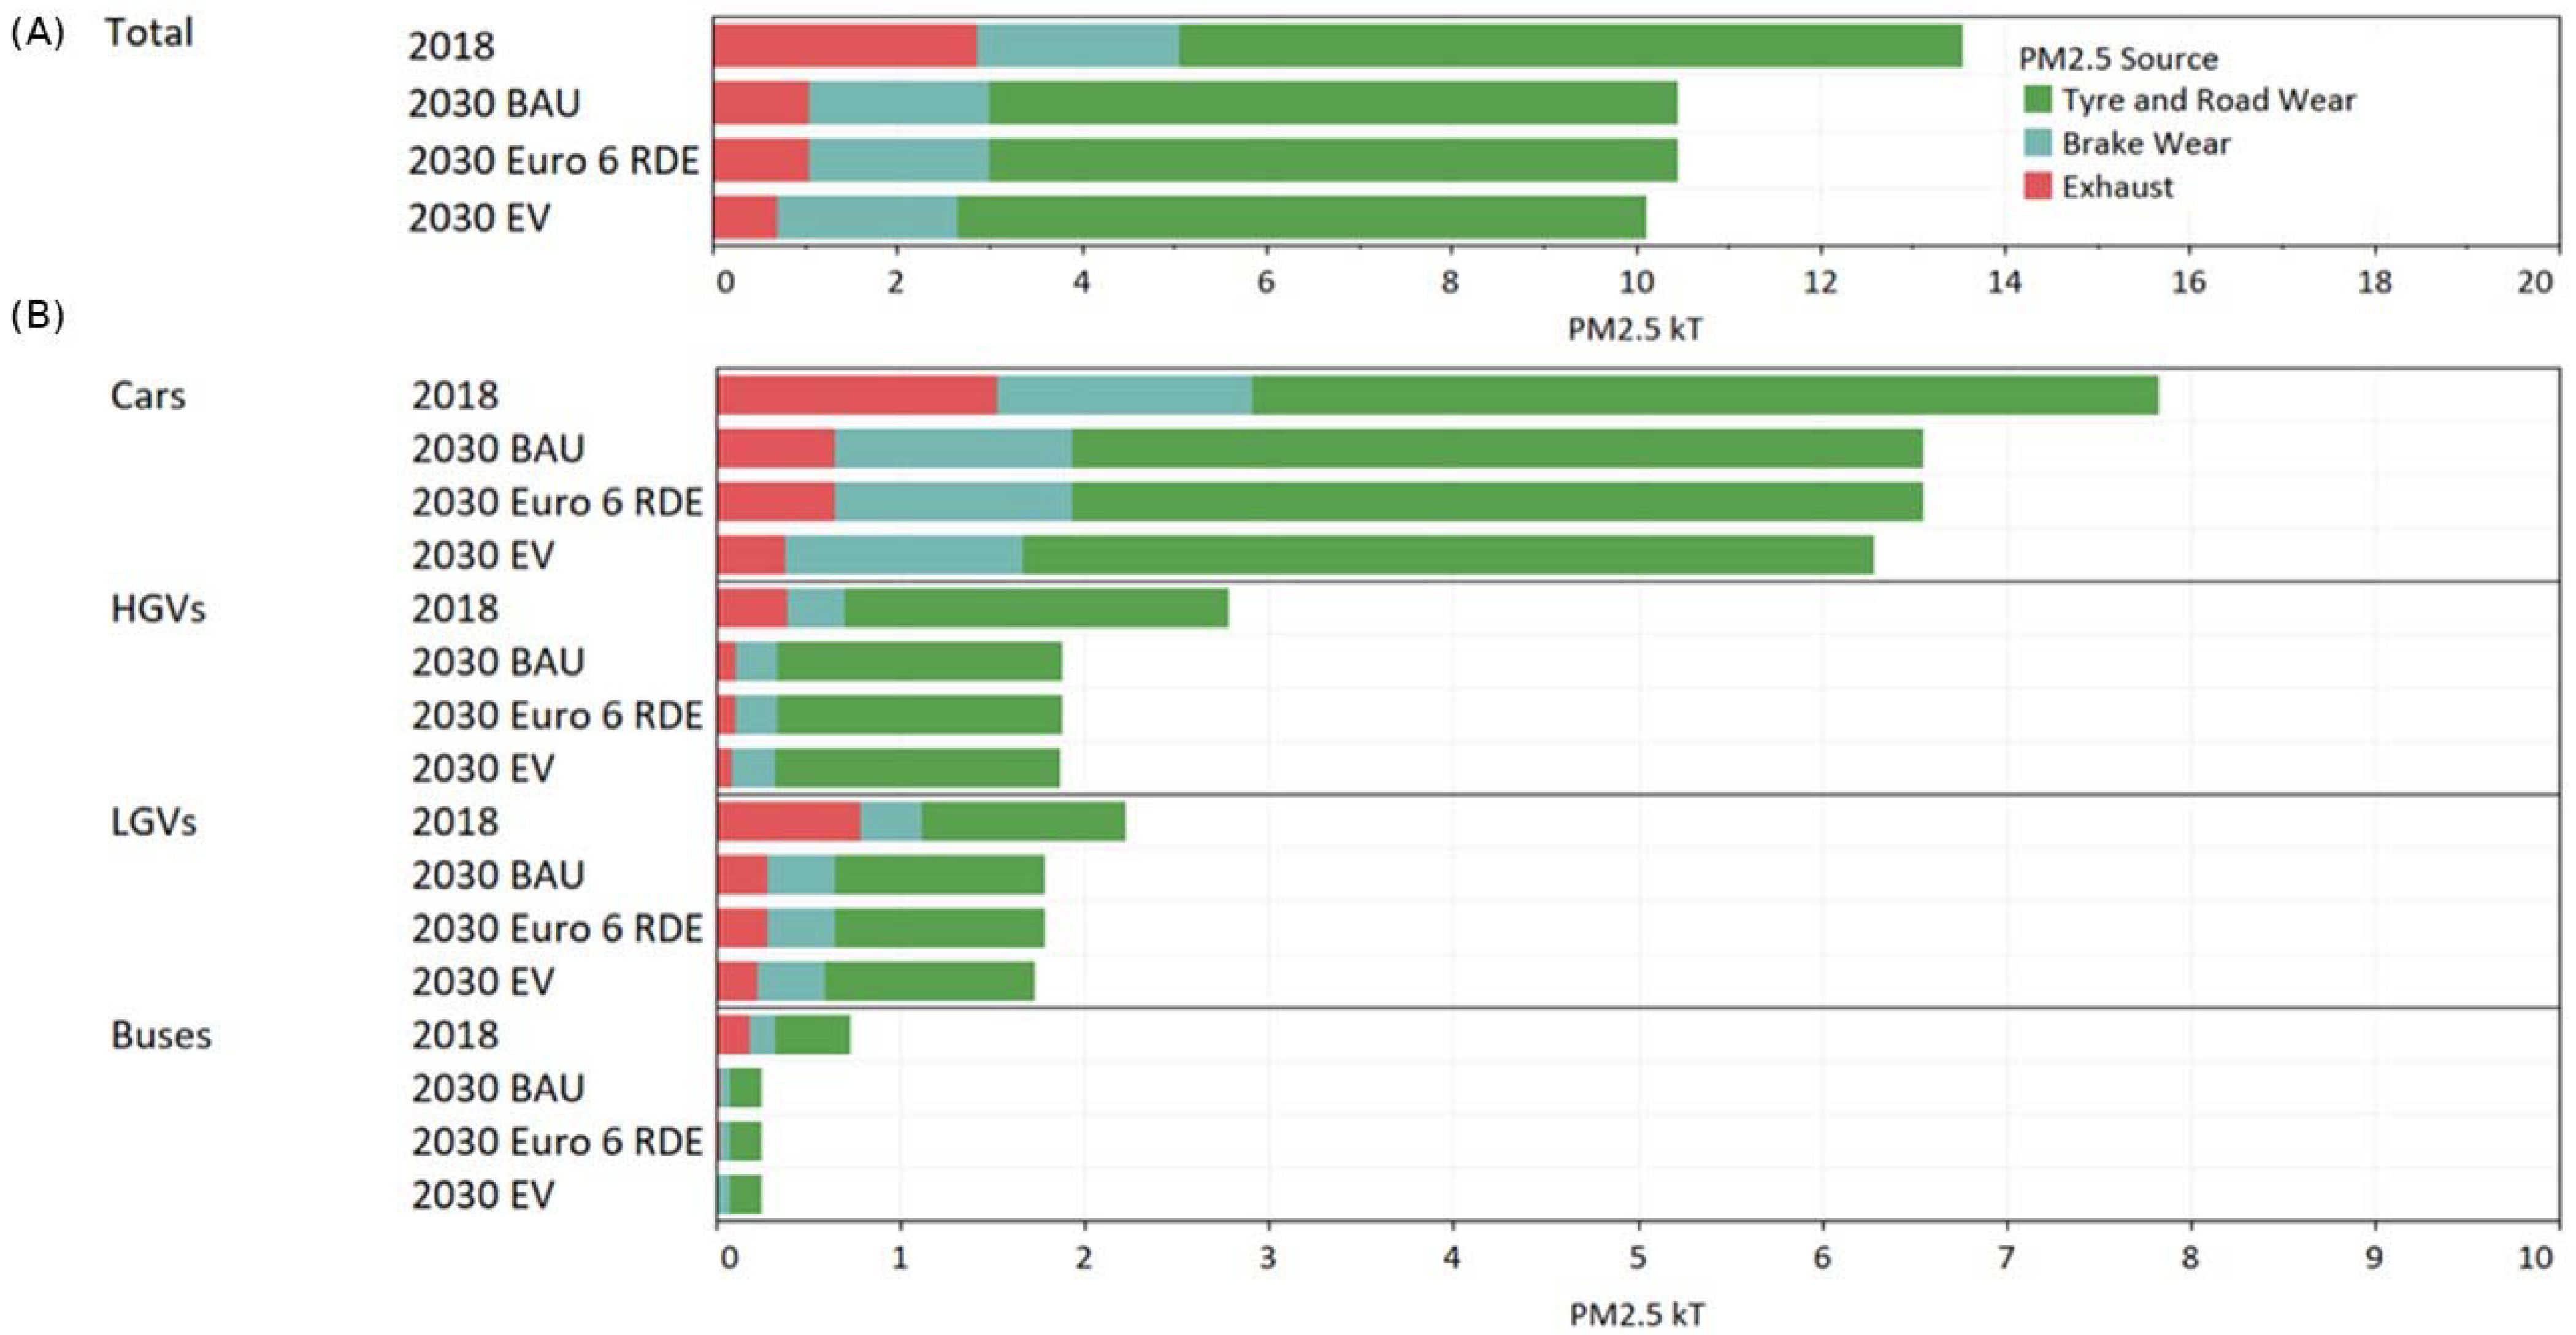
In all the listed scenarios, emissions of PM
2.5 do not decrease by the same extent as NO
x. Fleet emissions reduce by 3.1 kT from 13.6 kT in 2018 to 10.5 kT in 2030 BAU and only reduce by a further 0.3 kT for the EV scenario. PM
2.5 emissions for each scenario are given in
Figure 3, which outlines emissions classified by vehicle type with the emissions further disaggregated by emission source: exhaust, brake wear, or tyre and road wear.
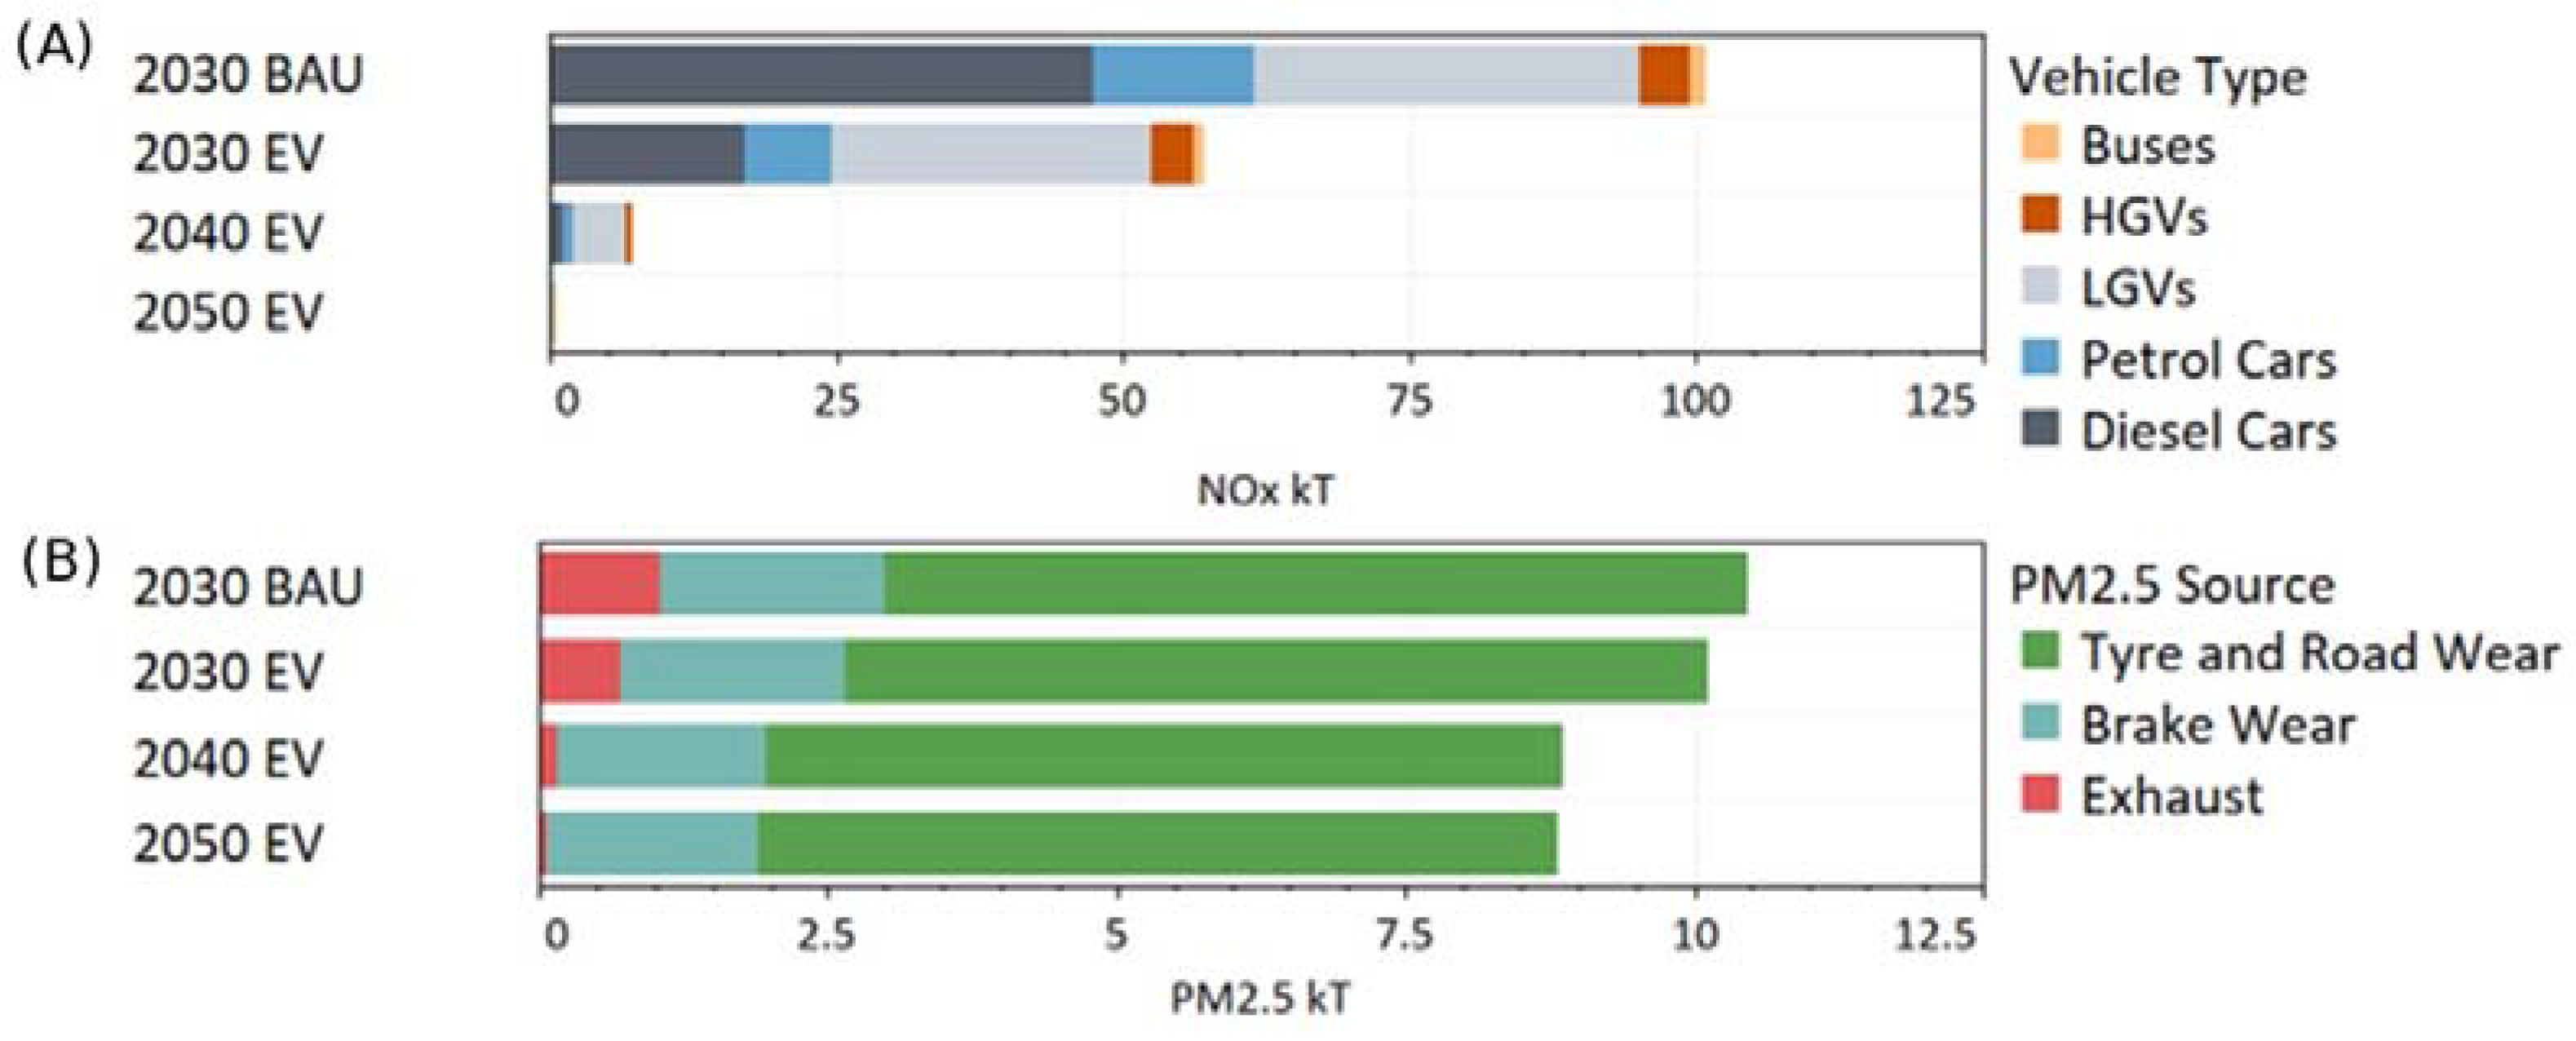
Beyond 2030, for the EV scenario, NO
x emissions are further reduced, most noticeably between 2030 and 2040, and by 2050 NO
x emissions are negligible. However, for PM
2.5 there is a much smaller relative reduction beyond 2030, with the exhaust emissions resulting in the reductions and non-exhaust emissions remaining largely unchanged up to 2050. These results for NO
x and PM
2.5 are illustrated in
Figure 4.
4.2. Sensitivty Studies
Two sensitivity studies were conducted to observe the potential change in PM2.5 non-exhaust emissions from EVs. These sensitivity studies suggested that PM2.5 emissions in the EV scenario in 2030 may change if passenger car and LGV EVs are modelled with different non-exhaust emission factors than for ICEVs.
The first sensitivity study translates all non-exhaust emissions proportionally to the increased curb mass for EVs. Recent Battery EVs (BEVs) are between 21–24% heavier than their ICEV counterparts, largely due to the additional mass of the battery [
19,
34]. A relationship between mass and non-exhaust emissions has been suggested by emission factors used in emission inventories where larger emission factors are demonstrated for heavier vehicle types, but a relationship between these factors has never been explicitly defined [
19,
21]. To accommodate for the additional curb mass of all EVs, we applied a 25% increase to all non-exhaust emissions for EVs to observe the potential effect this may have on fleet wide emissions. The increase in total PM
2.5 emissions, in this sensitivity study for the EV scenario, was found to be 9% in 2030.
The second sensitive study reflects the potential change in brake wear emissions through regenerative braking. Regenerative braking is an alternative braking system employed by EVs to recuperate kinetic energy under braking. This kinetic energy is then stored in the battery, improving the overall efficiency of the vehicle. Regenerative braking may reduce brake wear by reducing the overall use of the frictional brake and by reducing the temperature of the brake rotor [
20]. A recent review of the potential brake wear emission reductions through regenerative braking found that these emissions may be 75% lower for EVs than ICEVs [
20]. We have used this 75% reduction for all EVs to observe the potential impact of regenerative braking. This sensitivity study produced a total PM
2.5 emission reduction of 7% for the EV scenario. A reduction of 7% for all PM
2.5 emissions corresponds to a reduction in the brake wear emissions of 35% across the fleet.
The results from the two sensitivity studies are not strictly additive, due to the interaction between increased brake wear emissions resulting from the EV curb mass and the reduction in brake wear due to regenerative braking. Therefore, the overall effect can only be approximated as slightly greater than a 2% increase in the overall PM2.5 emissions for the EV fleet in 2030. This is minute considering the overall uncertainties.
4.3. Concentrations
The UKIAM framework produces concentration maps of air pollutants across the UK. These concentration maps are superimposed with maps of population density, which allows for the calculation of population weighted mean concentrations (PWMC). The PWMC is calculated using:
where
x and
y are the coordinates of the 1 km-by-1 km grid cell in UKIAM; Concentration and Population provide the respective values within the specific grids cell; Total population covers the area the
PWMC is calculated over. PWMCs show the mean concentration that the population is exposed to over a yearly period and can be derived by applying Equation (1) to specific regions or areas, e.g., rural, urban, across the whole of the UK, or for London. PWMCs are used here to compare the impact on air quality by the different scenarios. Changes in PWMC for PM
2.5 reflect changes in both the secondary inorganic aerosol (SIA), which will be affected by changes in NO
x emissions and the changes in primary PM
2.5, which are more important in populated urban regions.
Compared to 2018, the BAU scenario in 2030 reduced the PM
2.5 PWMC by 1.48 µg/m
3, or 16%. The Euro 6 RDE scenario further reduced the PM2.5 PWMC by an additional 0.47 µg/m
3. Finally, the EV scenario narrowly reduced this by a further 0.04 µg/m
3. These results are given in
Table 2, where reductions in PWMC of PM
2.5 and NO
x are provided relative to the 2018 and to the 2030 BAU scenario. For NO
x, the PWMC reduced by 5.76 µg/m
3 by 2030 for the BAU scenario. The Euro 6 RDE and EV scenarios reduced the NOx PWMC by an additional 1.41 µg/m
3 and 2.09 µg/m
3, respectively, over the BAU scenario in 2030.
Table 3 provides relative reductions in PWMC for the EV scenario beyond 2030, when compared to the 2030 BAU scenario and the 2030 EV scenarios. The reductions are shown relative to these two scenarios to illustrate further change in PWMC from 2030 onwards and a limit on further reductions for the EV fleet beyond 2040.
Traffic emission specific reductions in PWMC are provided in
Table 4, which shows relative changes in PWMC between the two key scenarios in this study, which are: the reduction in PWMCs from the EV scenario when compared to the 2030 Euro RDE scenario. Most changes in
Table 4 show decreases in PWMC, yet for primary PM
2.5 there an increase is observed due to changes in vehicle type composition up to 2050.
4.4. Health Impacts
The benefits that result from changes in air pollutant exposure have been calculated using methods approved by the UK government [
36,
37]. The benefits of reducing PM
2.5 concentrations have been further adjusted to account for the findings of a systematic review of mortality impacts of PM
2.5 exposure [
38], carried out in the development of the WHO’s Air Quality Guidelines [
4]. All prices are provided in £(GBP) for 2020.
The monetised value of reducing annual exposure to PM2.5 by 1 µg/m3 is estimated to be £62.8 (range £16.9 to £178) per person per year. As a result, reducing the mean exposure of the whole UK population of around 66 million people by 1 µg/m3 provides an annualised benefit of £4.1 billion (£1.1 to £11.8 billion).
The additional benefit of reducing NO
2 by 1 ug/m
3 is estimated to be £7.0 (range £0.5 to £27.6) per person, although with great uncertainties due to the difficulties in distinguishing the role of NO
x from other pollutants, notably PM
2.5 [
38]. The NO
2 contribution to total NO
x depends on the local chemistry and levels of other pollutants, and a mix of sources additional to road transport. To produce an indicative estimate of the benefits of NO
x reduction below, we have assumed that the NO
2 reduction is responsible for approximately 70% of the change in NO
x as an estimate for moderate to low annual average NO
x concentrations. This implies that reducing the mean exposure of the UK population of 66 million by 1 µg/m
3 of NO
x provides an annualised benefit of £320 million (£25 to £1280 million).
These figures generate the following benefits for the EV and Euro 6 RDE scenarios:
For the EV scenario, the PWMC reductions from 2018 to 2030 of 1.99 µg/m
3 of PM
2.5 and 7.85 µg/m
3 of NO
x (from
Table 2) results in a total annual benefit for the UK of £10.8 bn (£8.2 bn PM
2.5 + £2.5 bn NO
2) in the range of £2.4 bn to £33.5 bn
For the Euro 6 RDE scenario, the PWMC reductions from 2018 to 2030 of 1.95 µg/m
3 of PM
2.5 and 7.17 µg/m
3 of NO
x: (from
Table 2) results in a total annual benefit for the UK of £10.4 bn (£8.0bn PM
2.5 + £2.3 bn NO
2) in the range of £2.4 bn to £32.2 bn
For the EV scenario, the PWMC reductions from 2018 to 2040 of 2.06 µg/m
3 of PM
2.5 and 9.32 µg/m
3 of NO
x (From
Table 2 and
Table 3) results in a total annual benefit for the UK of £11.6 bn (£8.5 bn PM
2.5 + £3.0 bn NO
2) in the range of £2.5 bn to £36.1 bn
As well as benefits to health, there exist benefits for building materials (e.g., via reduced deposition of particulates that cause soiling), crops, forests and ecosystems (e.g., via reduced deposition of nitrogen, leading to ecological imbalances) for the pollutants of interest here. However, under existing methods for the quantification of impacts and their monetary equivalent, the health impact assessment accounts for most of the benefits that pertain to pollutant mitigation.
5. Discussion
The results show a large reduction in NOx emissions and a consequential reduction in NOx PWMC of 5.76 µg/m3 (or 36%) from 2018 to 2030 for the BAU scenario. These reductions are due to vehicle turnover of the fleet, with the removal of the most highly emitting vehicles. The next scenario, Euro 6 RDE, improves on this by reducing PWMC a further 1.41 µg/m3 (or 14%) over the BAU scenario. This reduction is a result of new RDE compliant vehicles that are introduced into the fleet, reducing real world tailpipe NOx emissions. The resultant Euro 6 dominated fleet, in 2030, leaves little room for improvement for the EV scenario, which only reduced NOx PWMC by an additional 0.68 µg/m3 or 4% over the Euro 6 RDE fleet. These results suggest that the Euro 6 RDE fleet and the fleet created through the introduction of EVs will reduce ambient NOx PWMCs to similar levels by 2030, with the electrified fleet yielding a slightly larger reduction. These results are reflected in the monetized health benefits, with a slightly greater benefits in the EV scenario.
For PM2.5, the relative reductions in emissions and PWMCs by 2030 were significantly less than for NOx for all scenarios. As for the NOx results, the turnover of vehicles lowered PM2.5 emissions and PWMC from 2018 to 2030 for the BAU scenario. By 2030, nearly all diesel vehicles will be installed with diesel particulate filters (DPF), as the fleet will be dominated by Euro 5 standard and above vehicles. There is no further improvement for the Euro 6 RDE scenario since the real-world emissions of exhaust PM2.5 will have been compliant since the introduction of Euro 5 with DPFs. The EV scenario reduced exhaust emissions over the BAU and Euro 6 RDE scenarios, but since non-exhaust emissions contribute to primary PM2.5 emissions to a greater extent by 2030, only a small overall change in primary PM2.5 emissions can be observed in 2030 between all scenarios. The reduction in PM2.5 PWMC between the Euro 6 RDE and EV scenario were found to be within 1% in 2030, largely due to the contribution of non-exhaust emissions.
From 2030 onwards, NOx PWMCs was found to reduce at a slow rate for the EV scenario, reducing by 7.85 µg/m3 from 2018 to 2030, then reducing an additional 1.47 µg/m3 by 2040, and finally only reducing by a further 0.61 µg/m3 by 2050. This diminishing return resulted from the turnover of vehicles removing the oldest vehicles first, with the majority of the remaining fleet comprised of Euro 6 RDE vehicles beyond 2030. There were smaller PM2.5 PWMC reductions beyond 2030 for the EV scenario due to the contribution of non-exhaust emissions. This results in the majority of the monetized health benefits occurring between 2018 and 2030, followed by a small increase in such benefits by 2040 and only negligible improvement thereafter.
Our results reveal that the introduction of EVs may produce a greater reduction in NO
x exposure than for PM
2.5. These results agree with a comparable study in the literature, conducted by Soret et al. (2014), who found greater benefit in the reduction of NO
2 in contrast to PM
2.5 in Barcelona and Madrid in Spain [
25]. Both EV and Euro 6 RDE scenarios show that technological improvements, through EVs or improvements in exhaust emission control, yield benefits for air quality.
Overall, the results show a very modest benefit of fleet electrification over ICEV technological improvement for air quality in the UK. Yet, there is a potential for further improvements, particularly for PM2.5, that could be achieved by reducing transport demand through methods such as modal change or active travel. This is because neither technological solution currently offers a method for reducing non-exhaust emissions to the extent required to improve air quality.
The small change in total PM
2.5 emissions in both sensitivity studies, with an increase of 9% for a heavier fleet with EVs and a 7% fleet wide reduction through the use of regenerative braking, are not significant enough to affect the earlier discussion on PM
2.5 between the scenarios by 2030. It is important to highlight the significant uncertainties that are associated with the emission factors used for non-exhaust emissions. These uncertainties are expected to be on the order of +/− 50% when using emission factors from the EMEP/EEA air pollutant emission inventory guidebook [
31]. As a result, these small changes found in the sensitivity study are well within the uncertain bounds of these emission factors. Therefore, to truly understand how EVs may change non-exhaust emissions a better accuracy in these emission factors is required, followed by empirical observations of the relationship between vehicle curb mass and non-exhaust emissions and the reduction in brake wear emissions due to regenerative braking.
5.1. Study Limitations
The main limitation of this study is the omission of the impact of charging EVs on electricity generation. As outlined in
Section 2.1. UKIAM framework, we chose to not include a differentiation in emissions from electricity generation between the scenarios, so as to isolate the changes in exhaust and non-exhaust emissions between the scenarios. However, to provide context for this potential increase in emissions we provide an estimation of the worst case of emissions produced for the EV scenario using data from a net zero pathway by the UK’s Committee on Climate Change [
7]. The CCC’s ‘balanced’ net-zero pathway includes the rate of EV uptake that would satisfy the UK’s TDP and 2030 ICEV ban, which is similar to the EV scenario in this paper. In the CCC scenario, the total electricity demand from road transport in 2030 is 47 TWh (or 169 PJ). How this demand will be met, through a fleet of dispatchable marginal thermal generators or through integration with renewables via smart charging and vehicle-to-grid, is a further research field in itself. There is also growing uncertainty regarding how Carbon Capture and Storage (CCS) technologies will alter emissions from natural gas and biomass in the future. To provide a simple estimate of the worst case for GHG emission reductions, we assume this demand will be met by conventional natural gas CCGT plants. This results in 9 kT of NO
x emissions in 2030 when considering emission factors from the current fleet of power stations [
39]. Bearing in mind that these emissions will have a smaller impact on population exposure than exhaust emissions, due to the geographical location, the high emission release point of the stacks, and from secondary formulation, the 9 kT, would be equivalent to 16% of road transport exhaust NO
x emissions. The increase in primary PM
2.5 emissions would be 0.047 kilotons, leading to a negligible effect on total PM
2.5 emissions. It remains too speculative to provide an emission estimate for beyond 2030, as the remaining thermal generation will have CCS capabilities. Future work should build on the change in road transport exhaust and non-exhaust emissions and the upstream impacts on air quality and human health as demonstrated in this paper. The additional requirement of electricity generation for the fleet of EVs should be investigated further, alongside other indirect effects such as reduced refinery needs for fuel production, to assess how the integration EVs into the future energy system will impact air quality.


