
Spatiotemporal Variation of Air Quality (PM and NO2) in Southern Paris during COVID-19 Lockdown Periods


Abstract
:1. Introduction
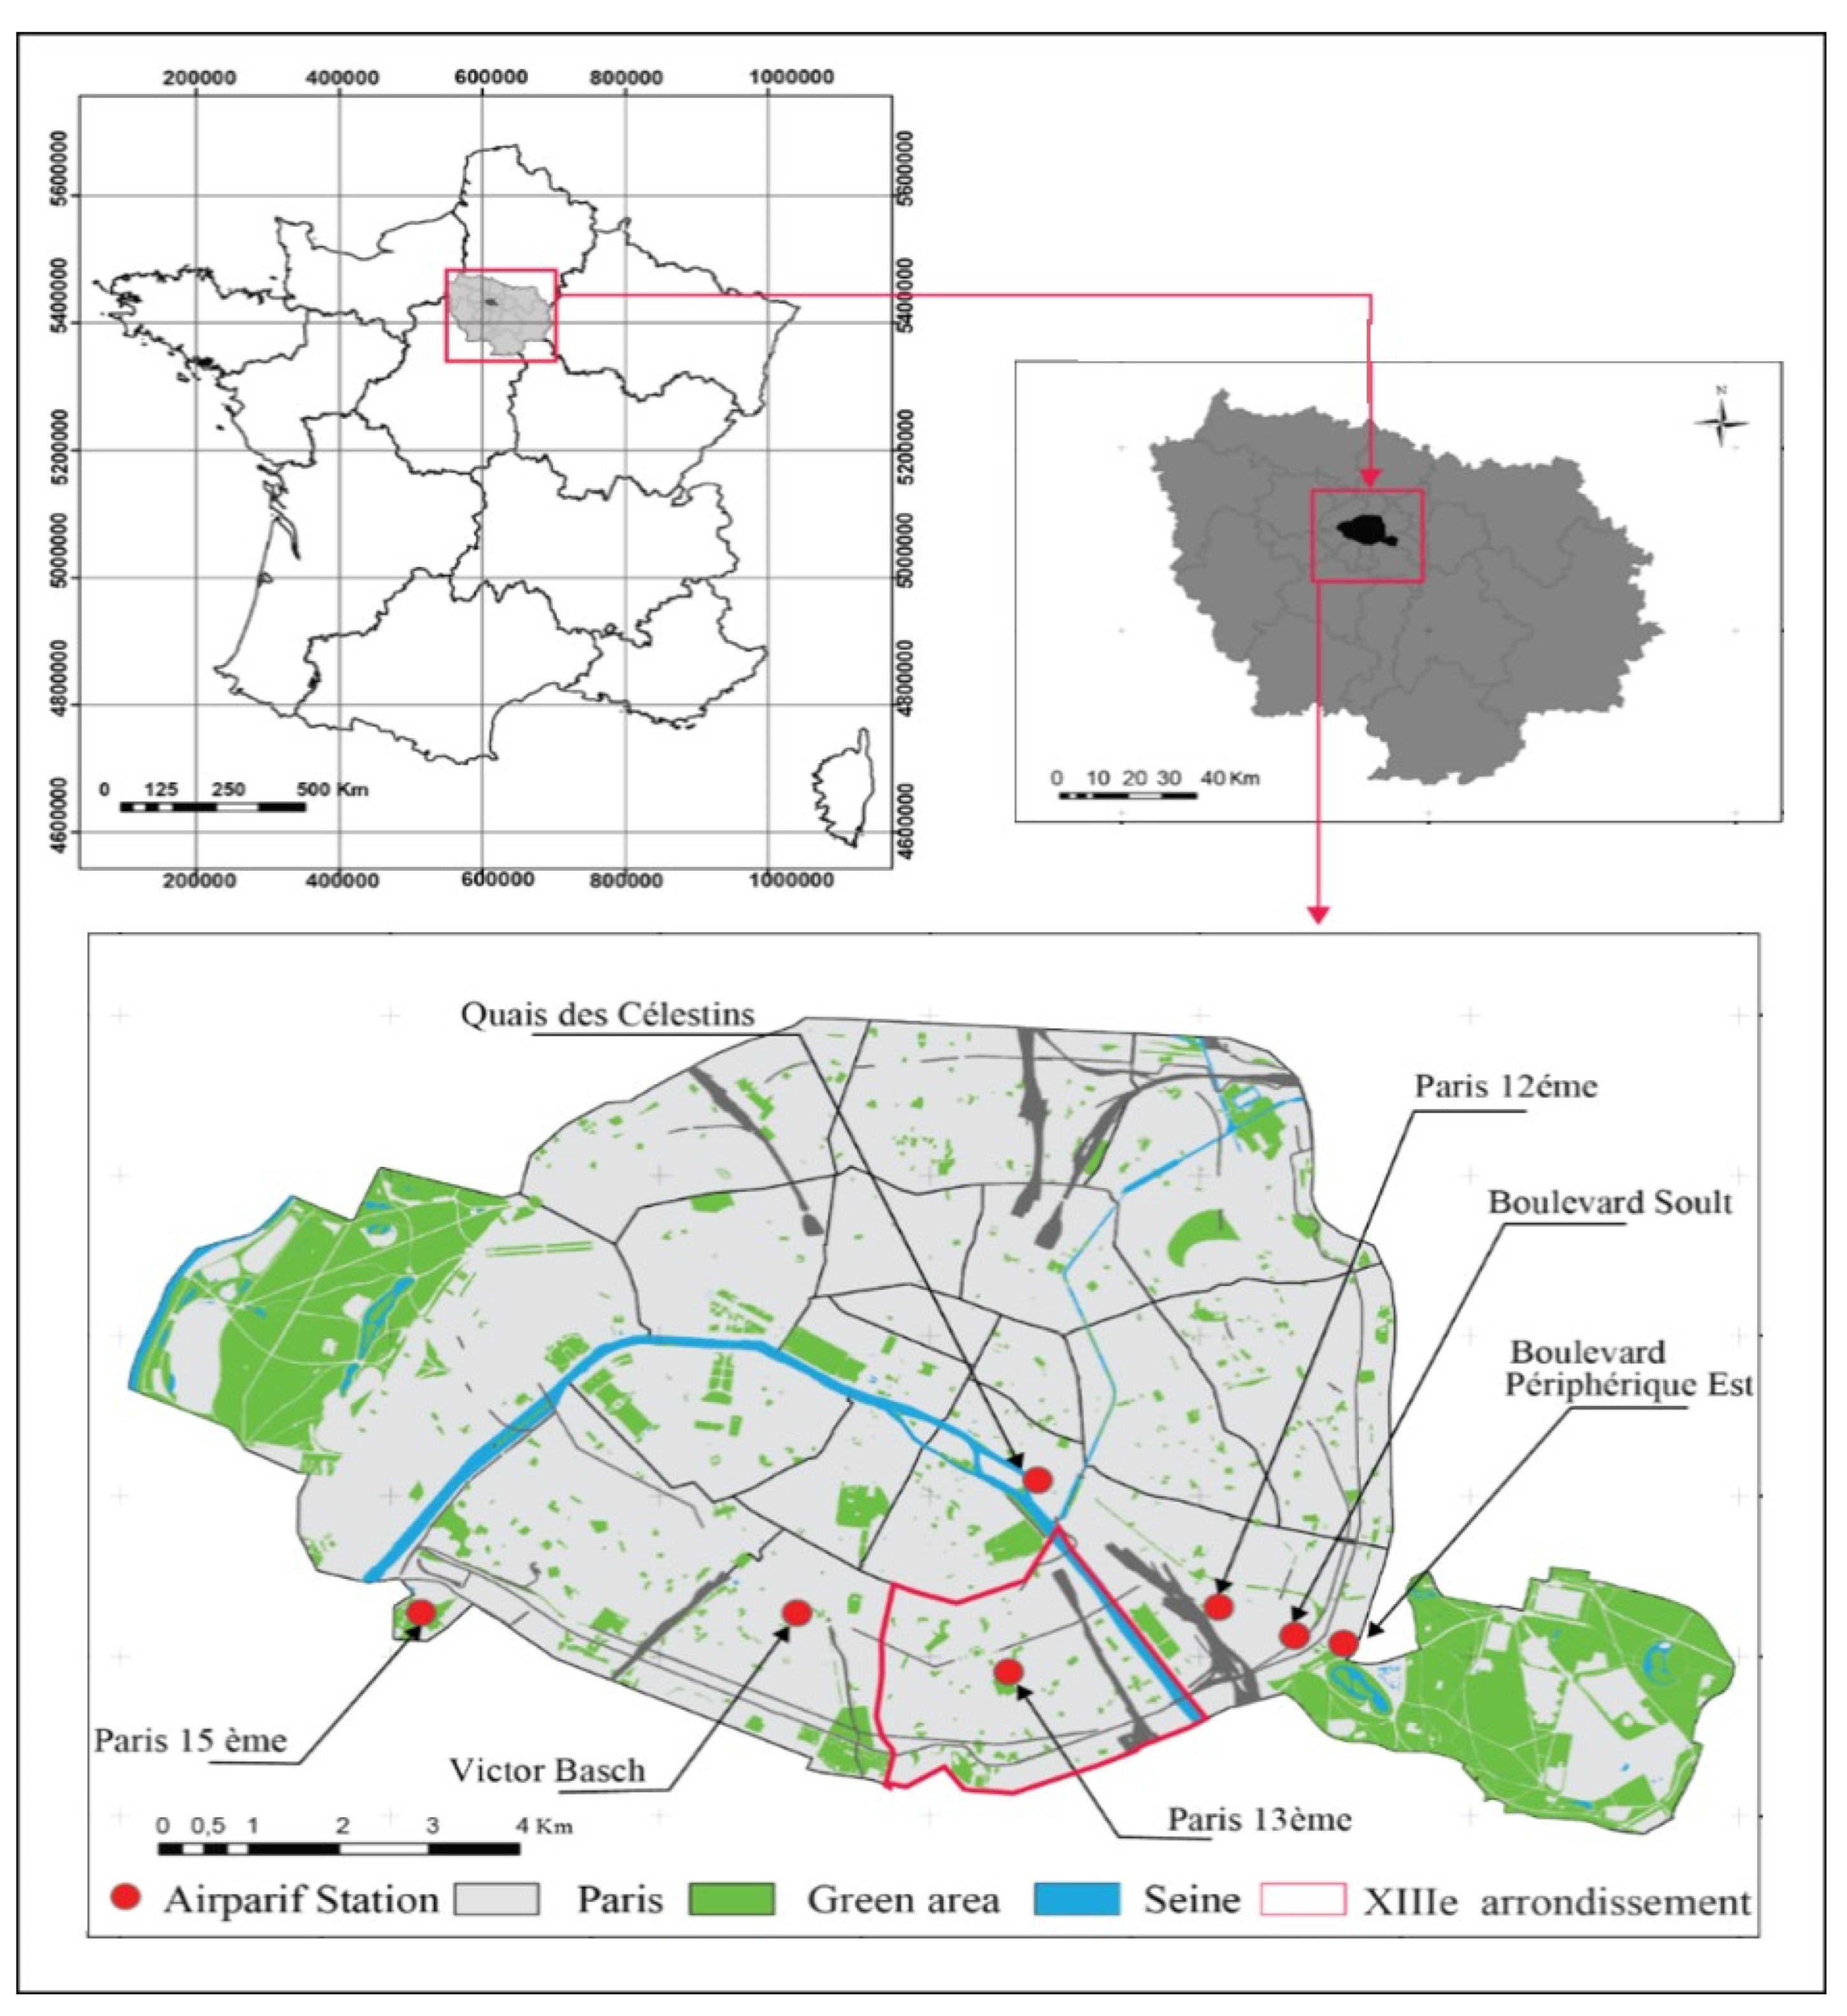
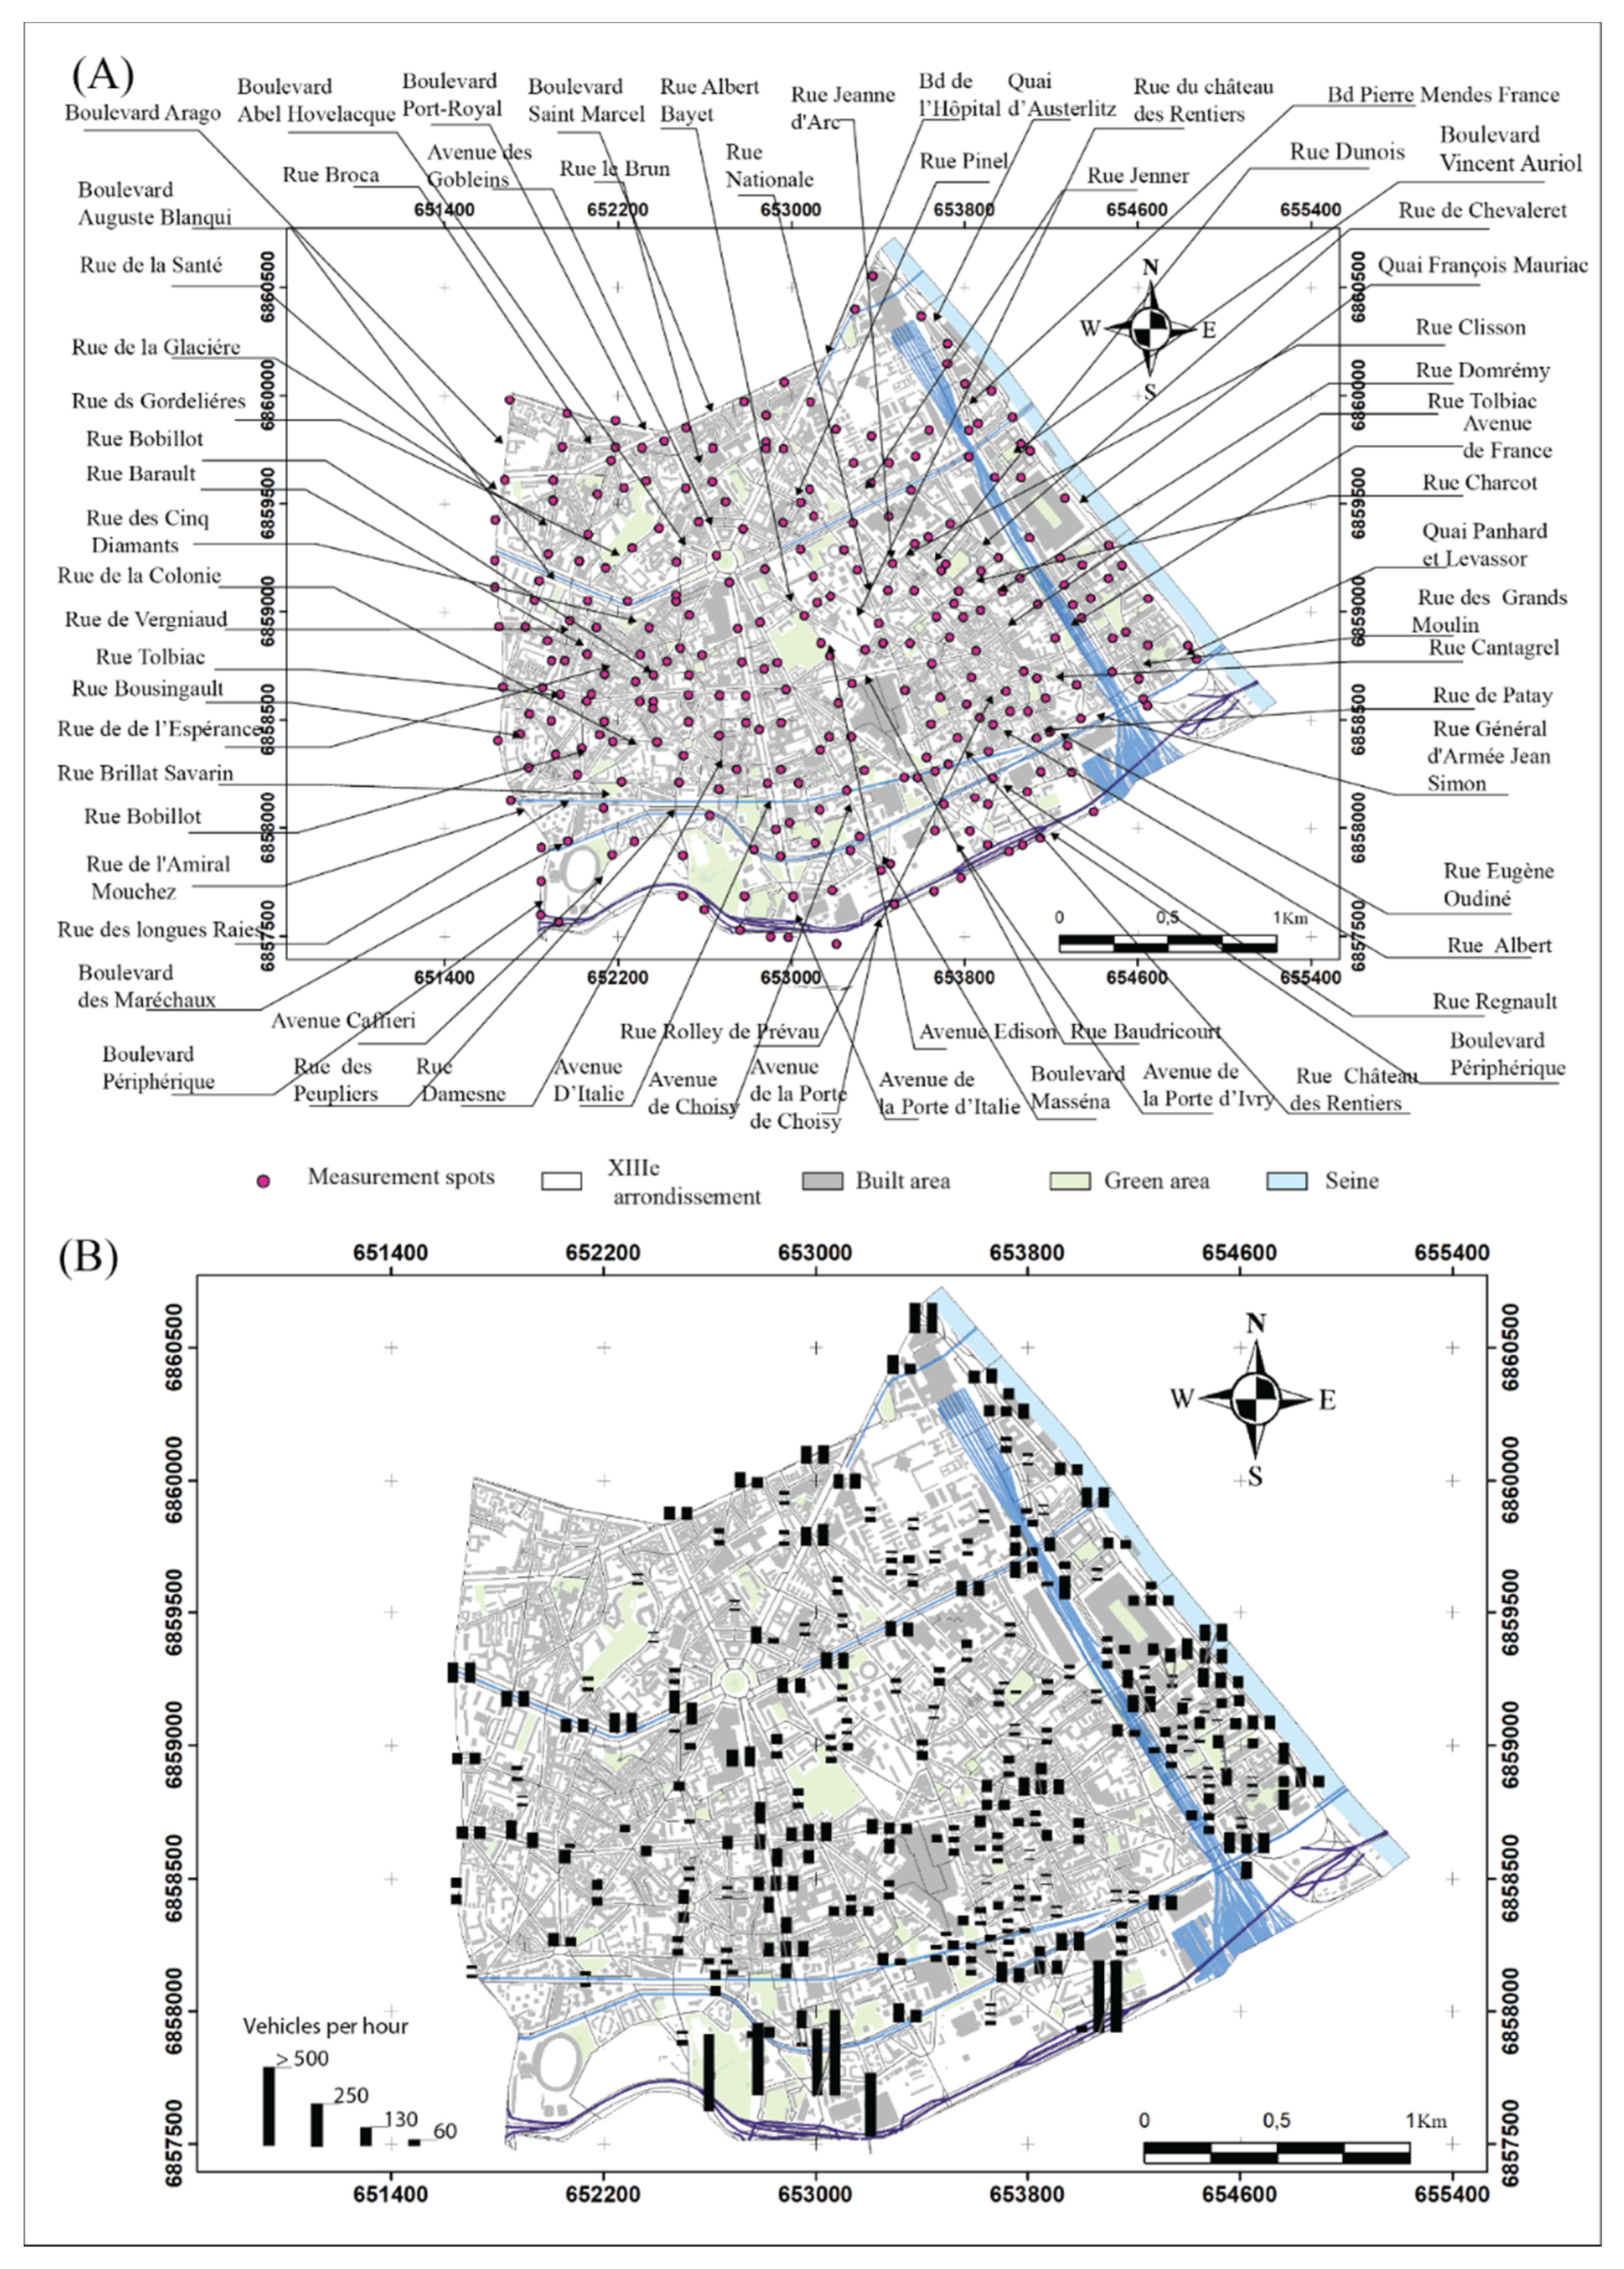
2. Study Area
3. Methods and Materials
4. Results
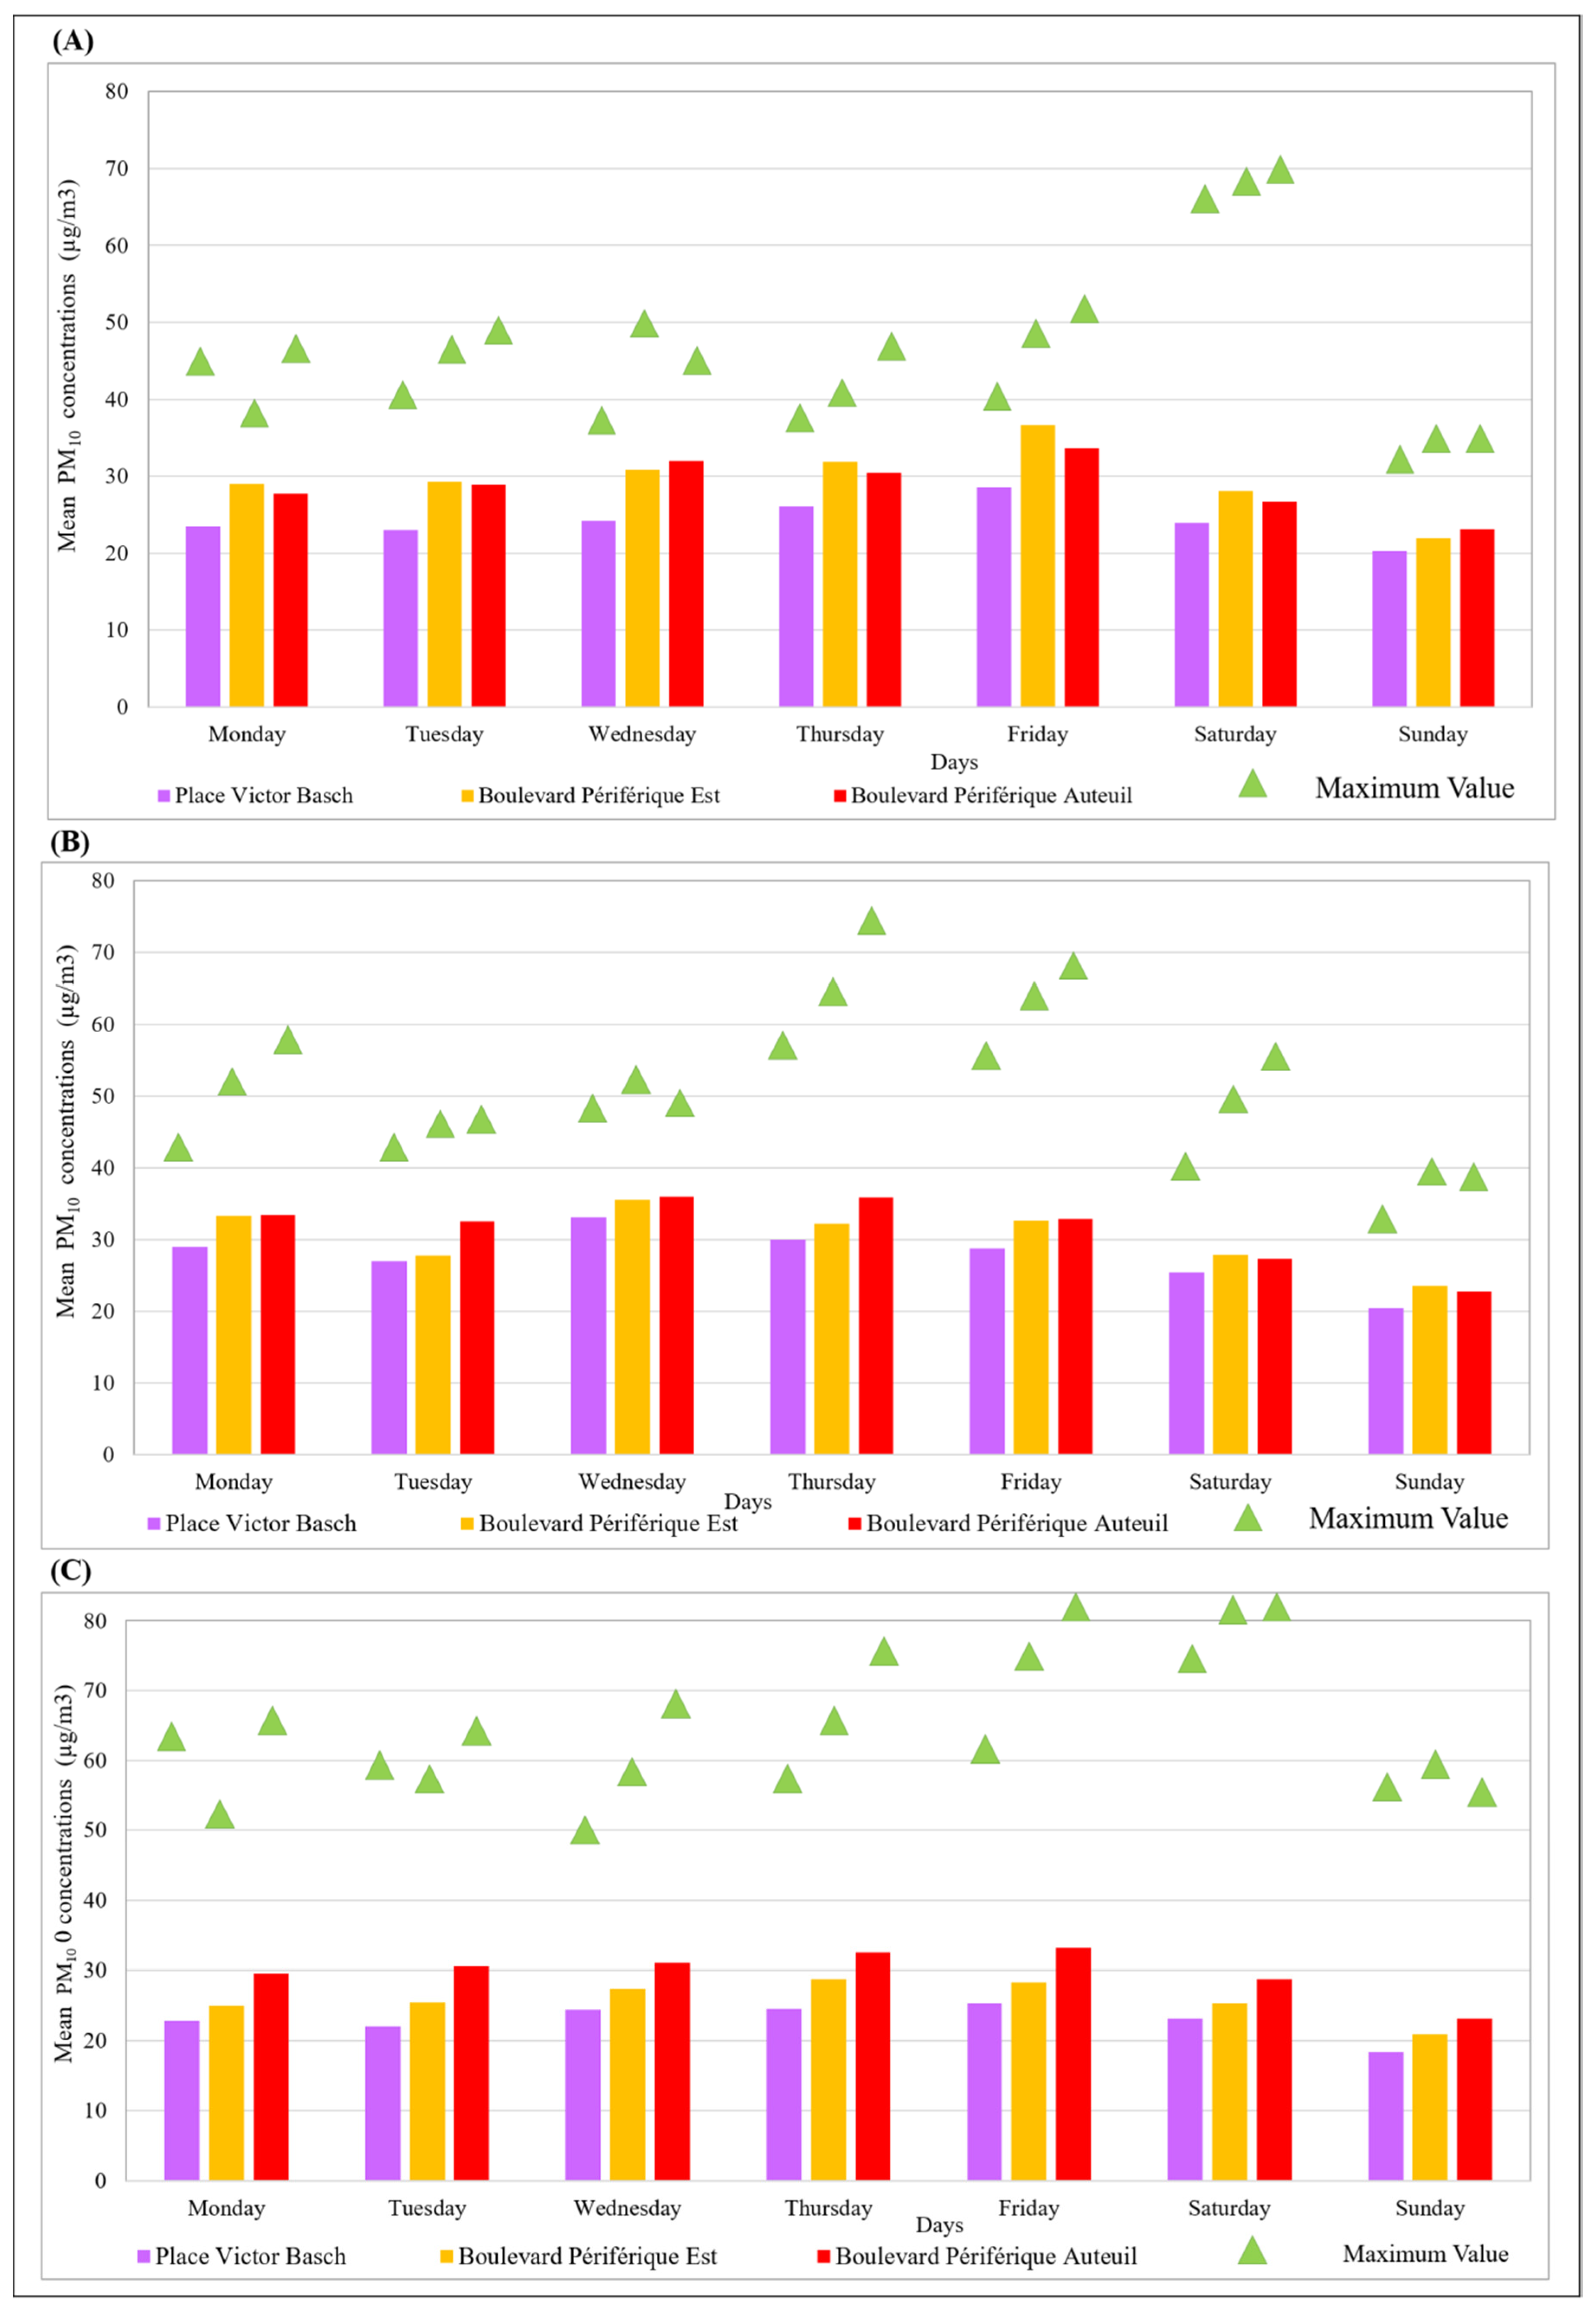
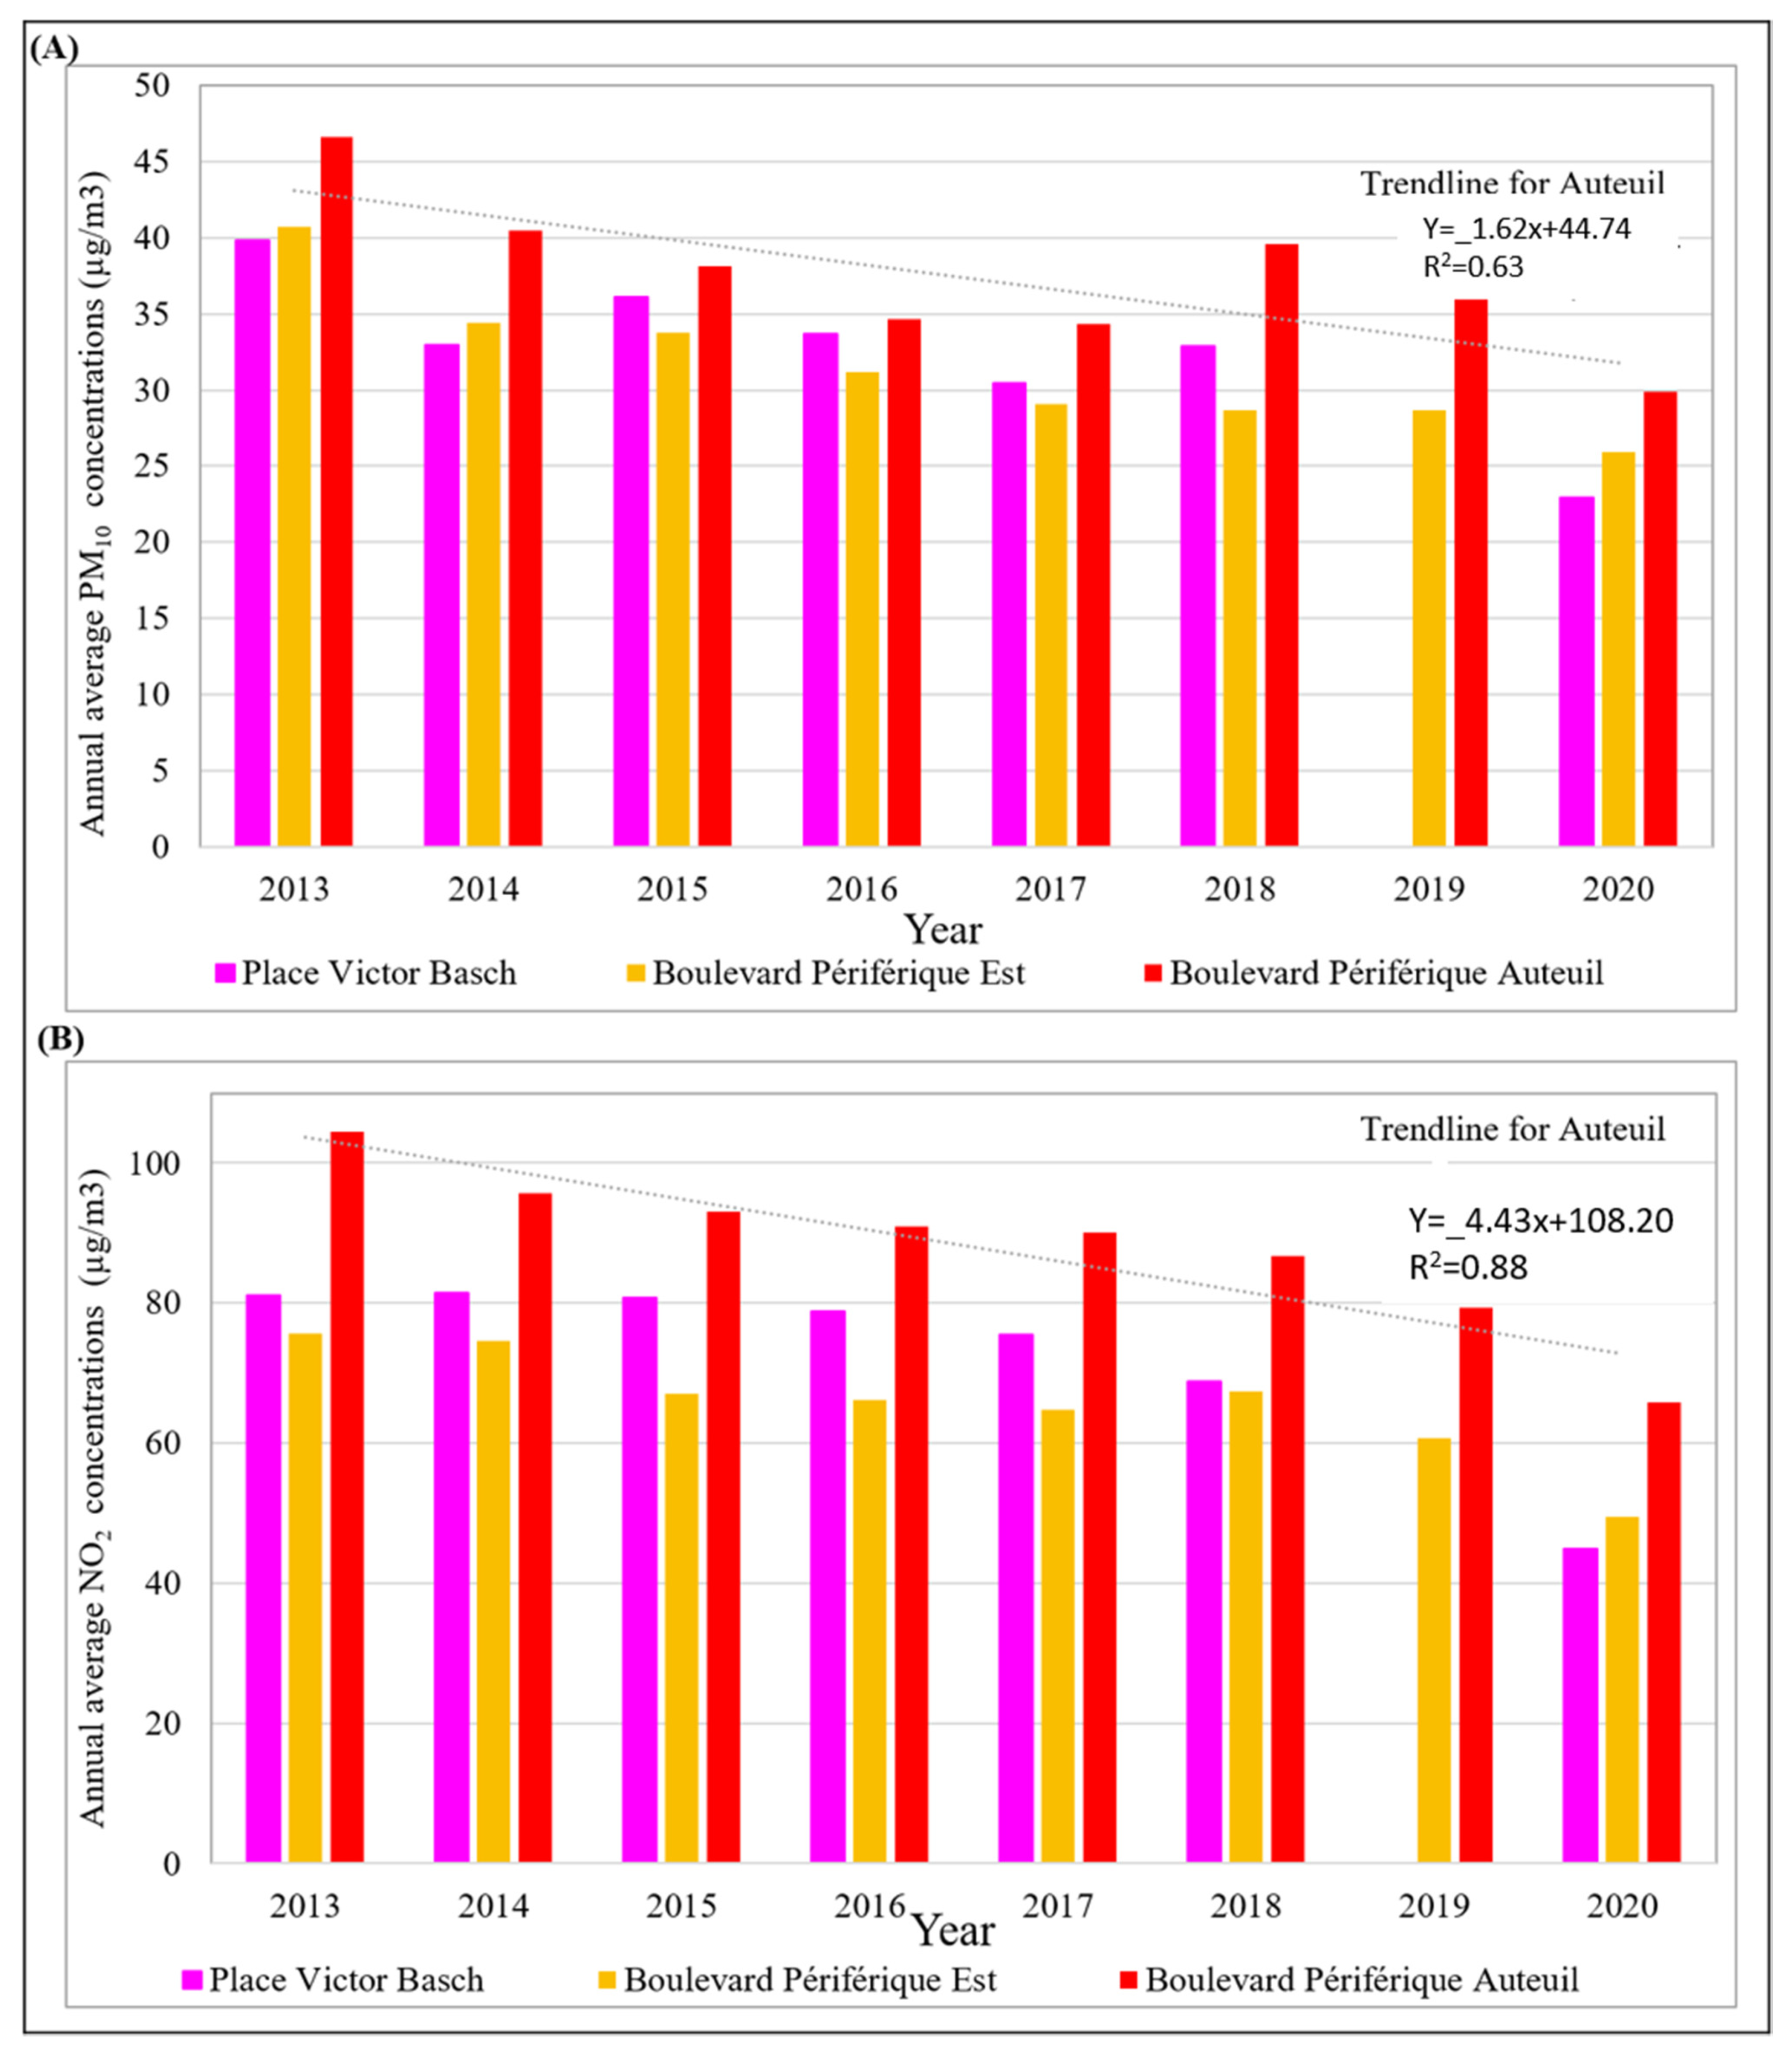
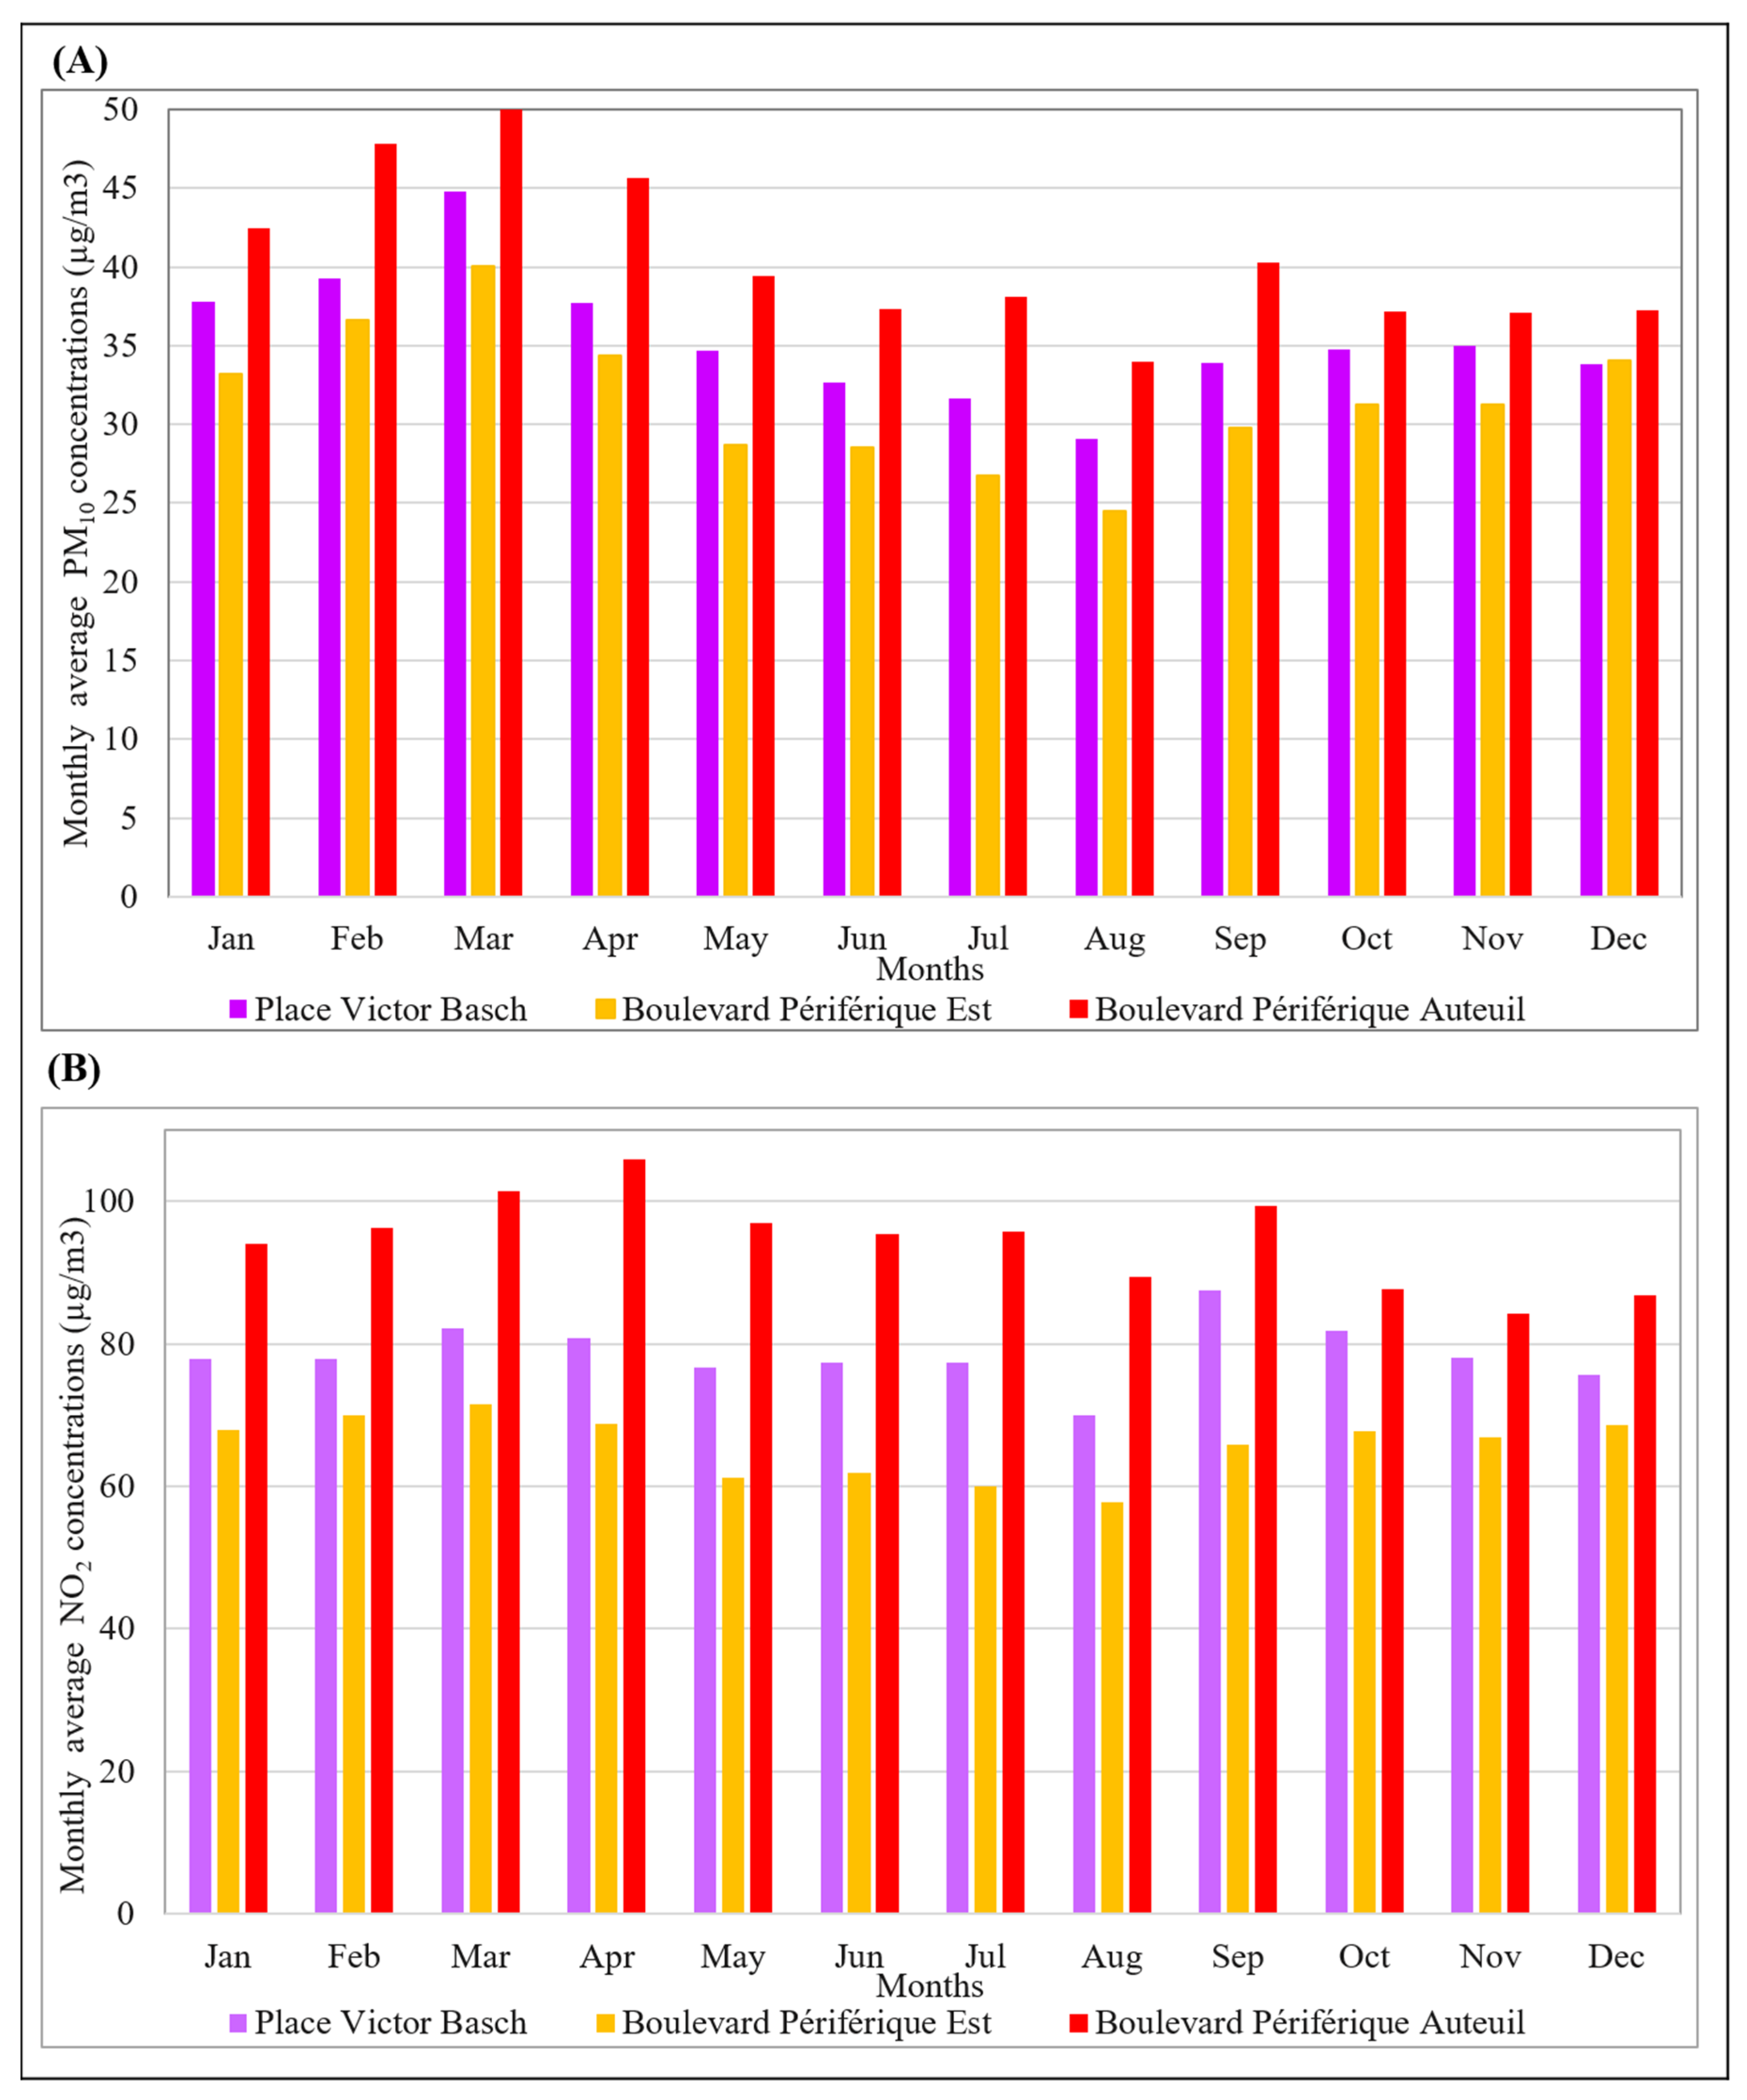
4.1. Temporal Variations in PM10 and NO2 Concentrations
4.2. Exceedances of WHO Thresholds
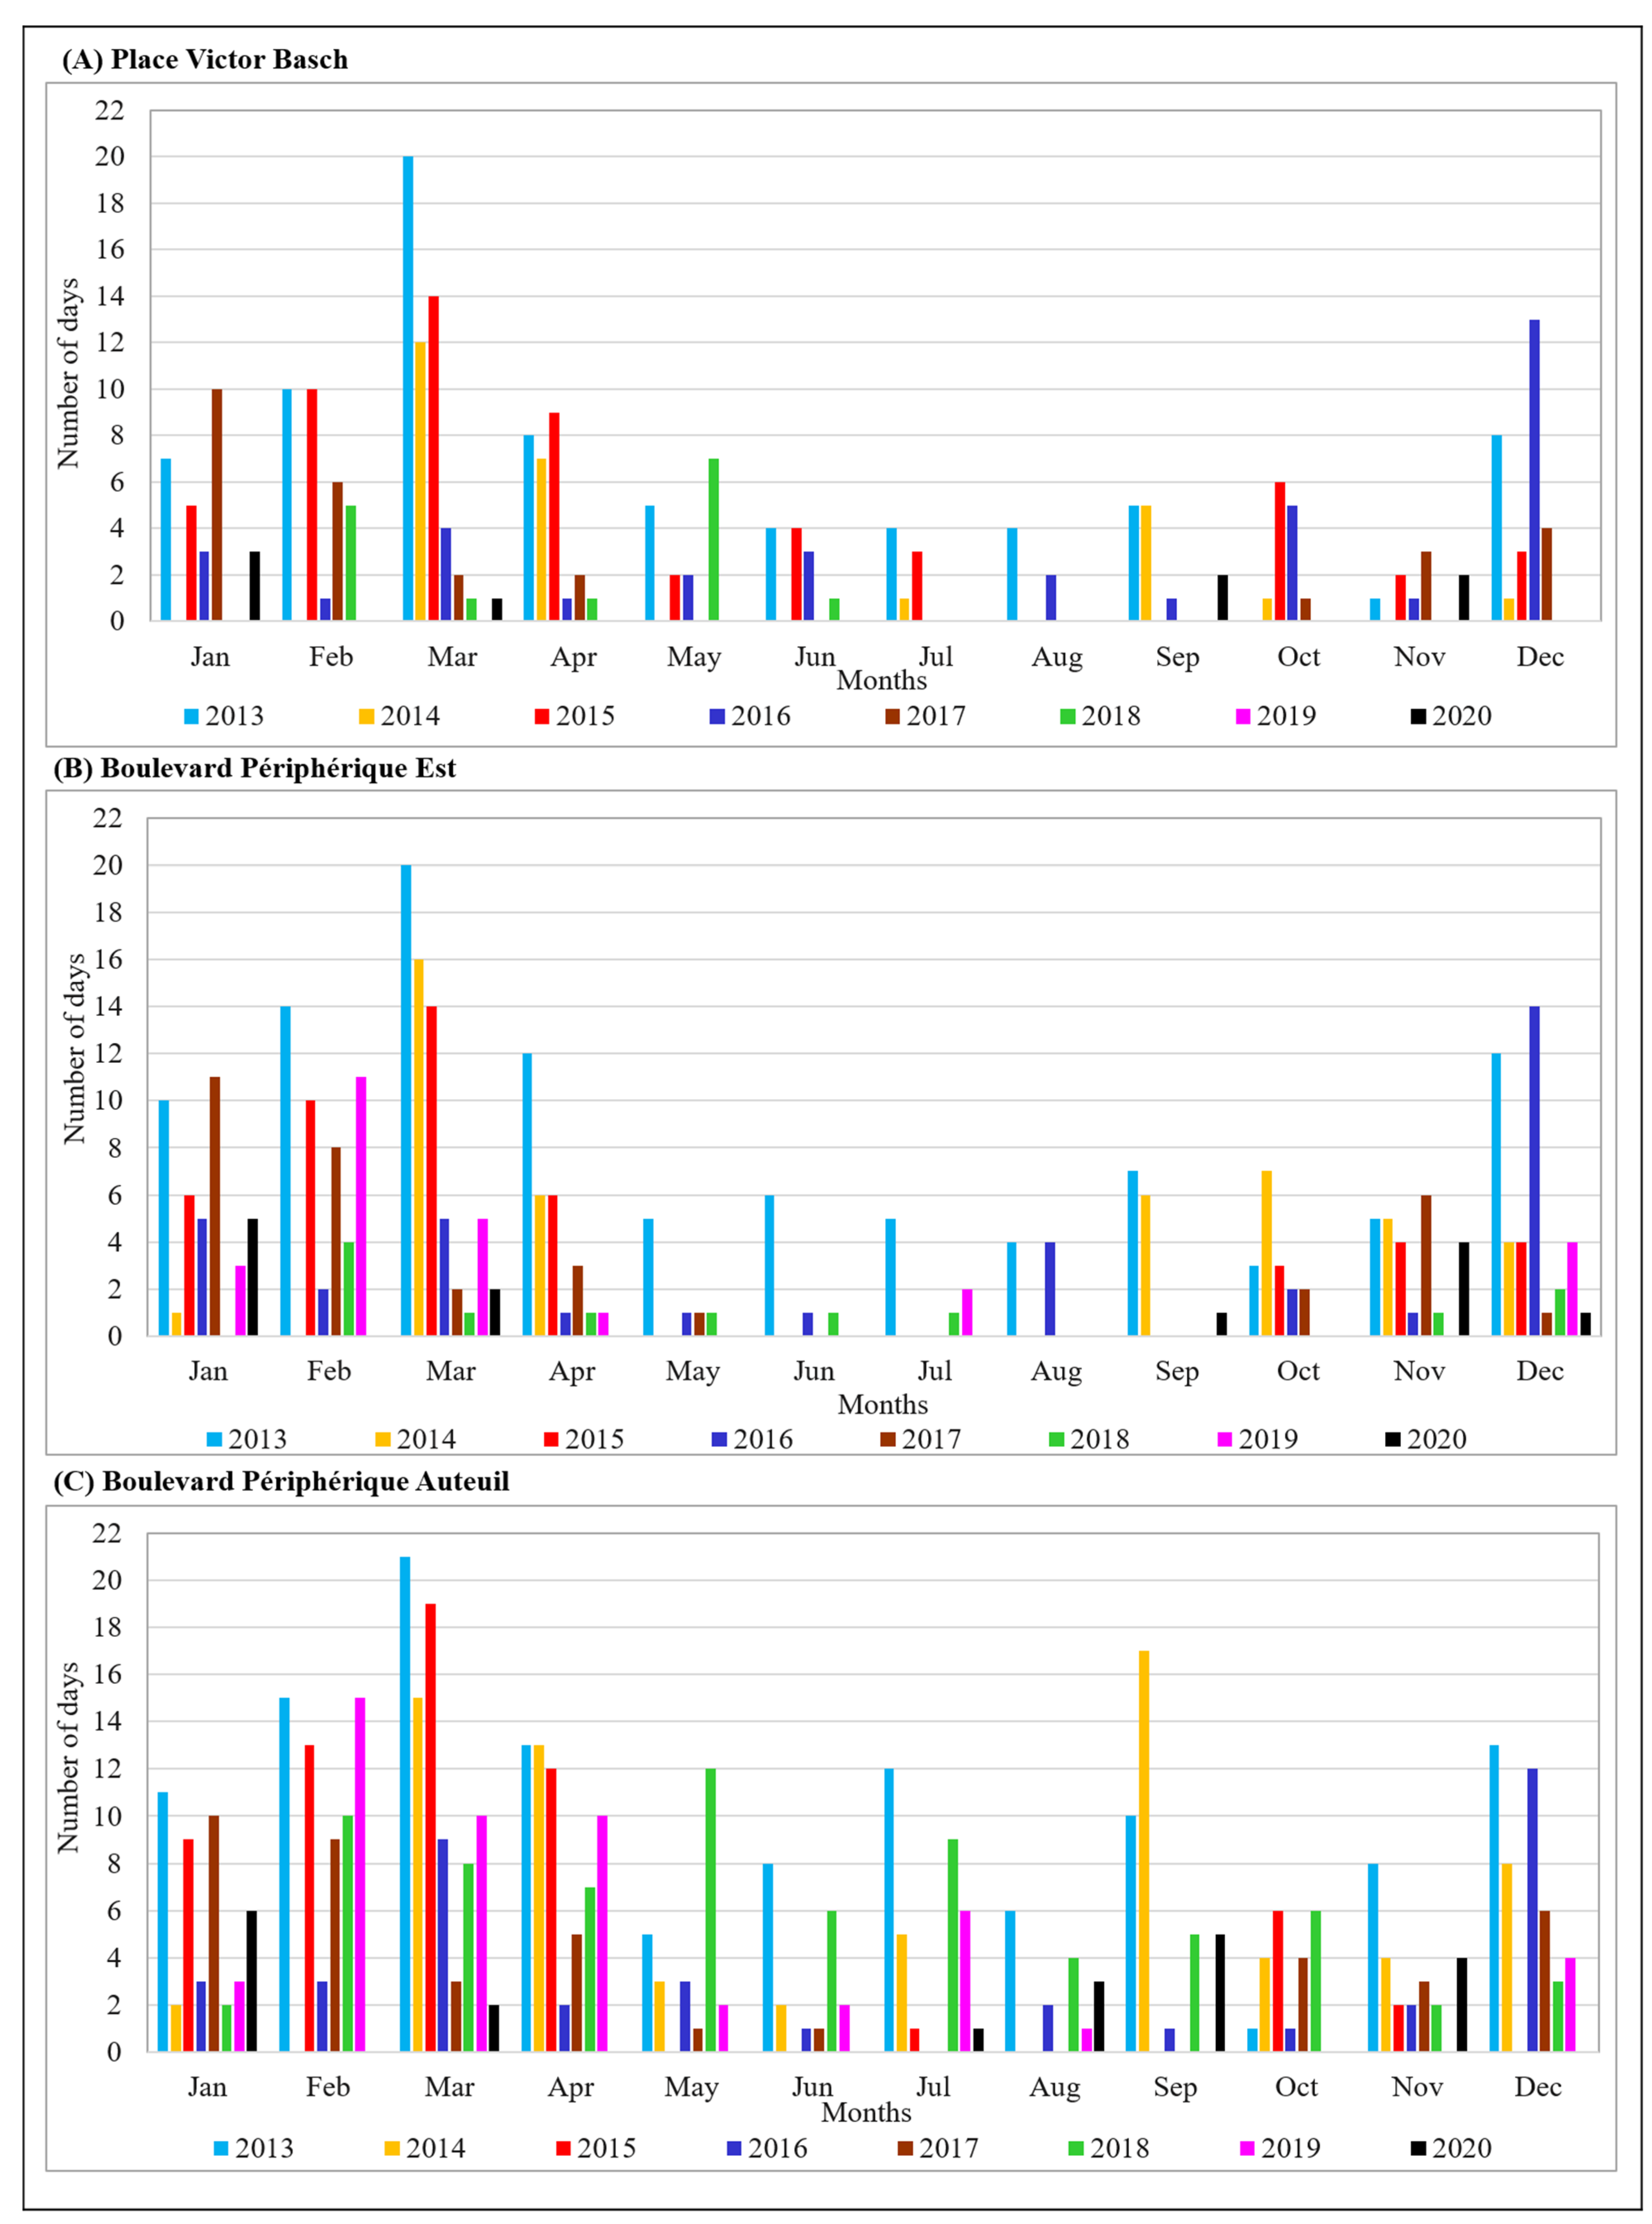
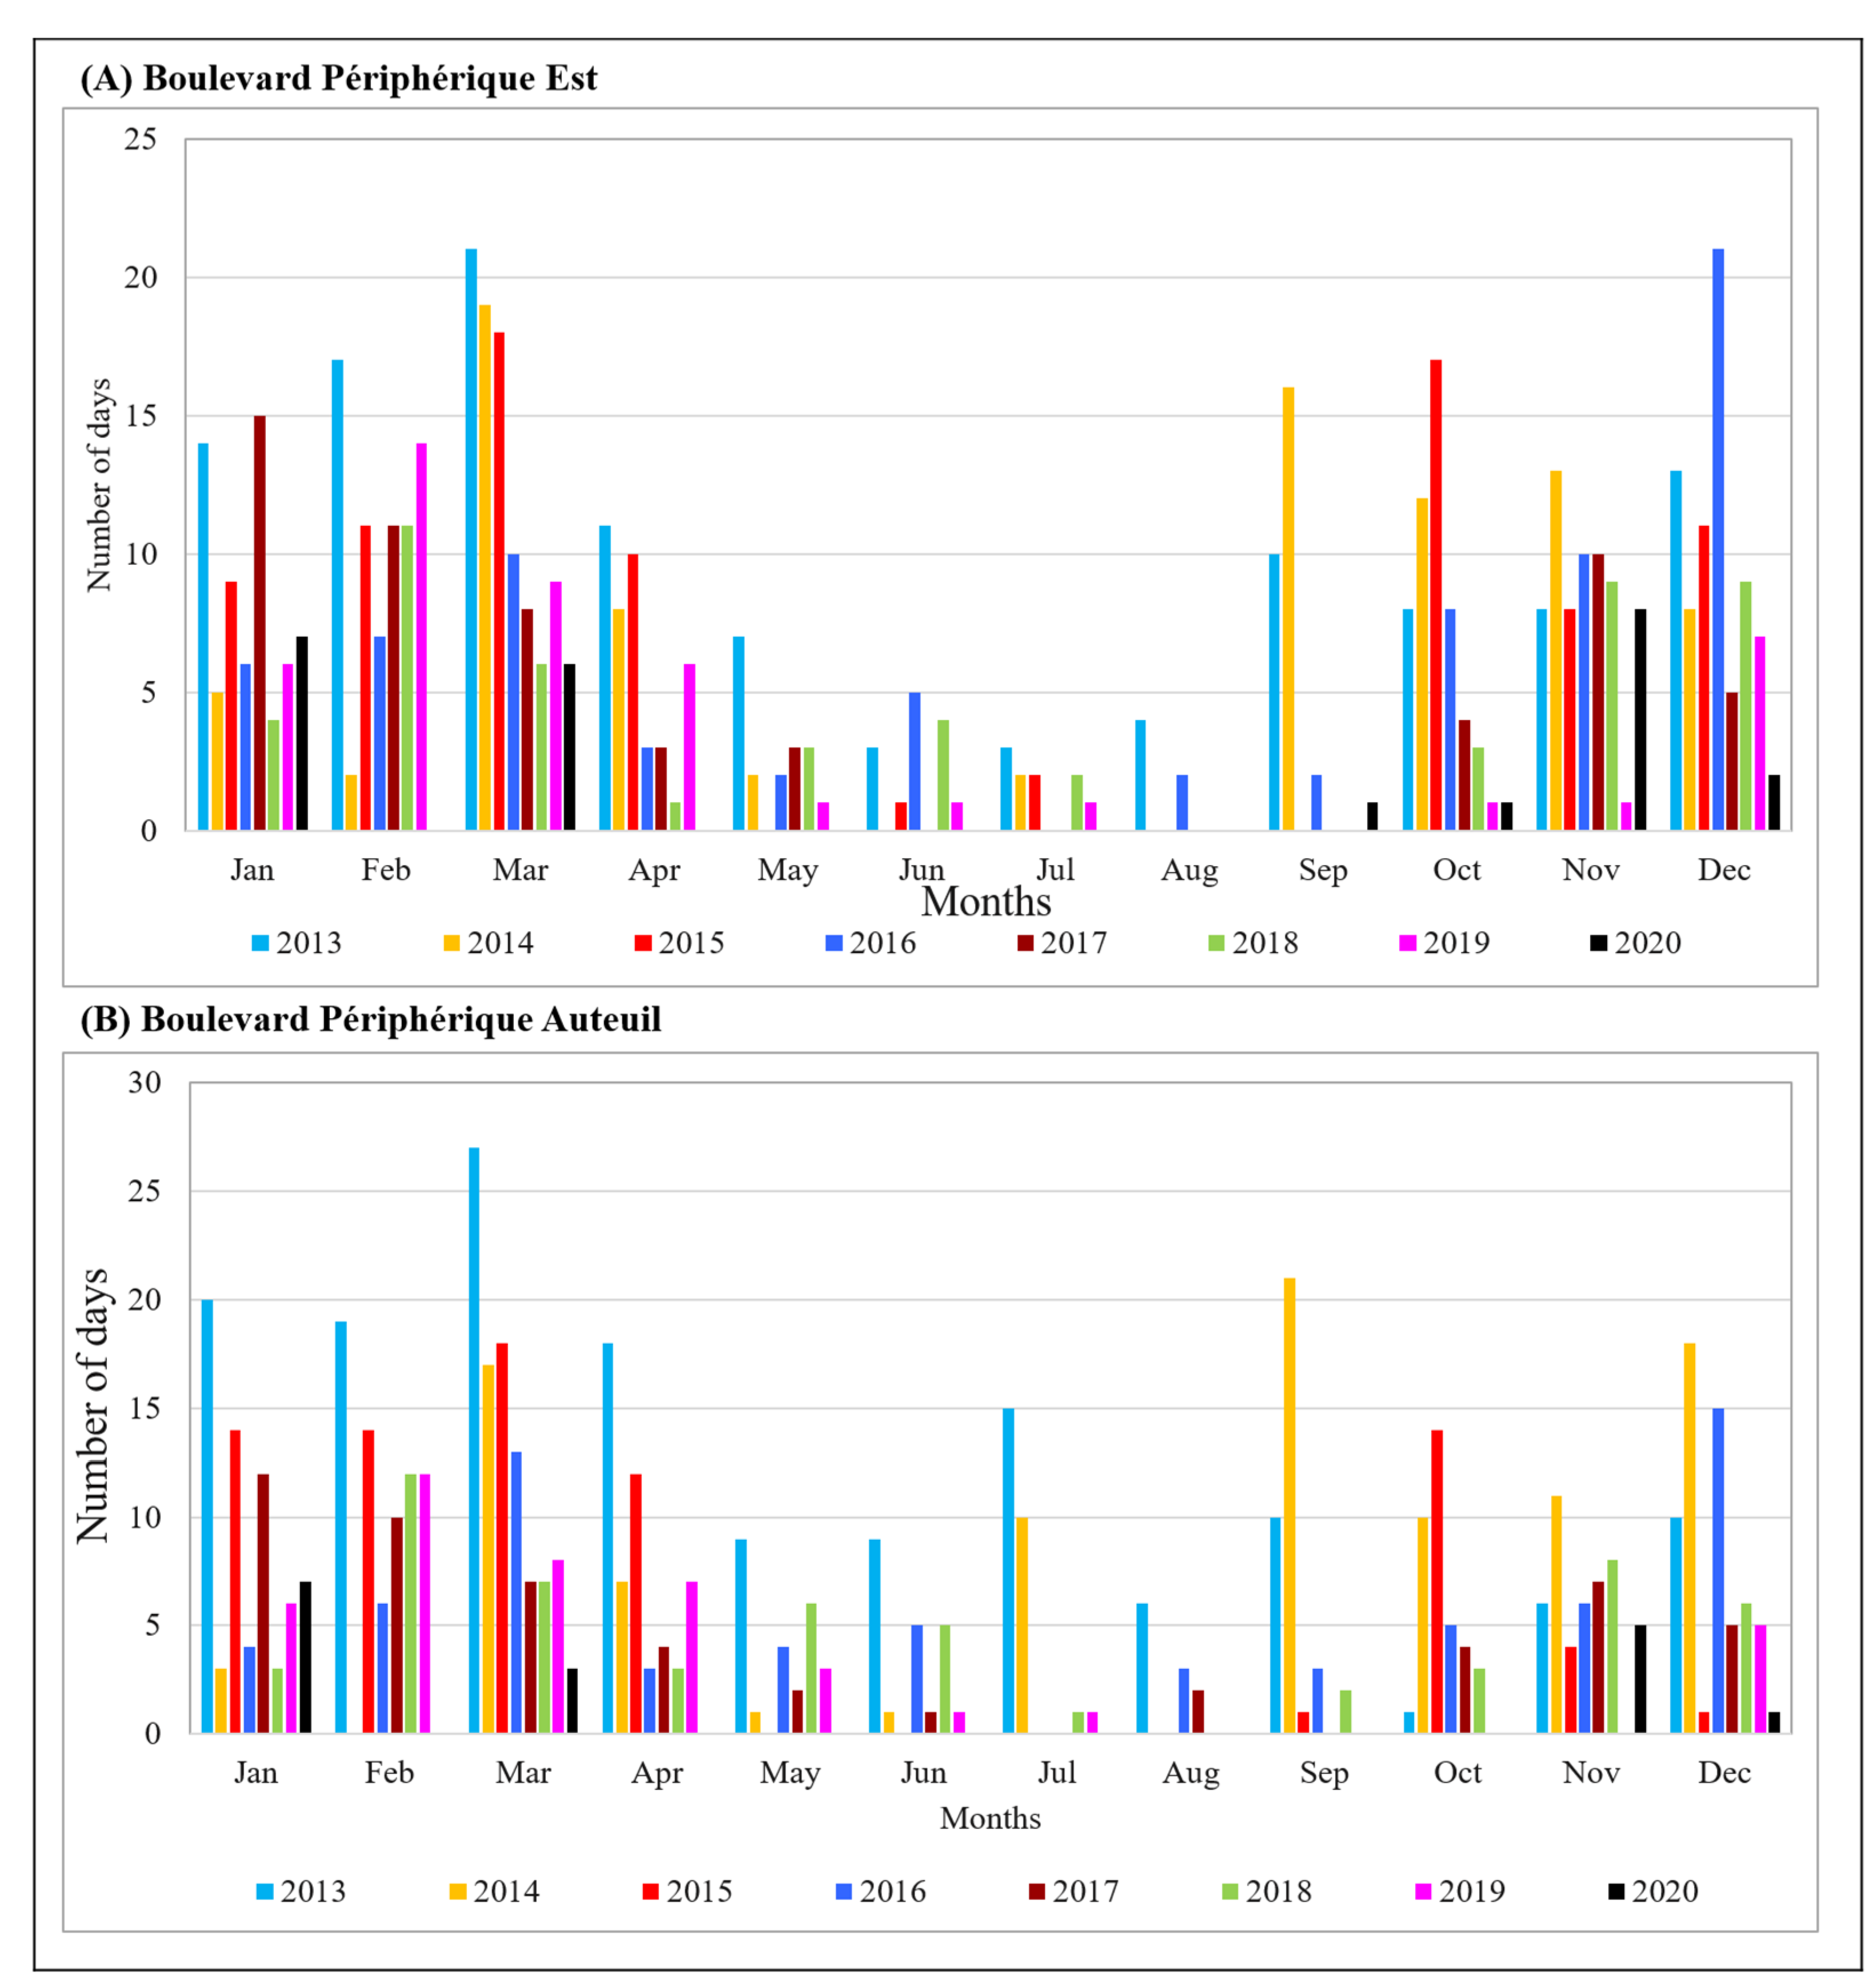
4.2.1. Monthly Exceedances of PM
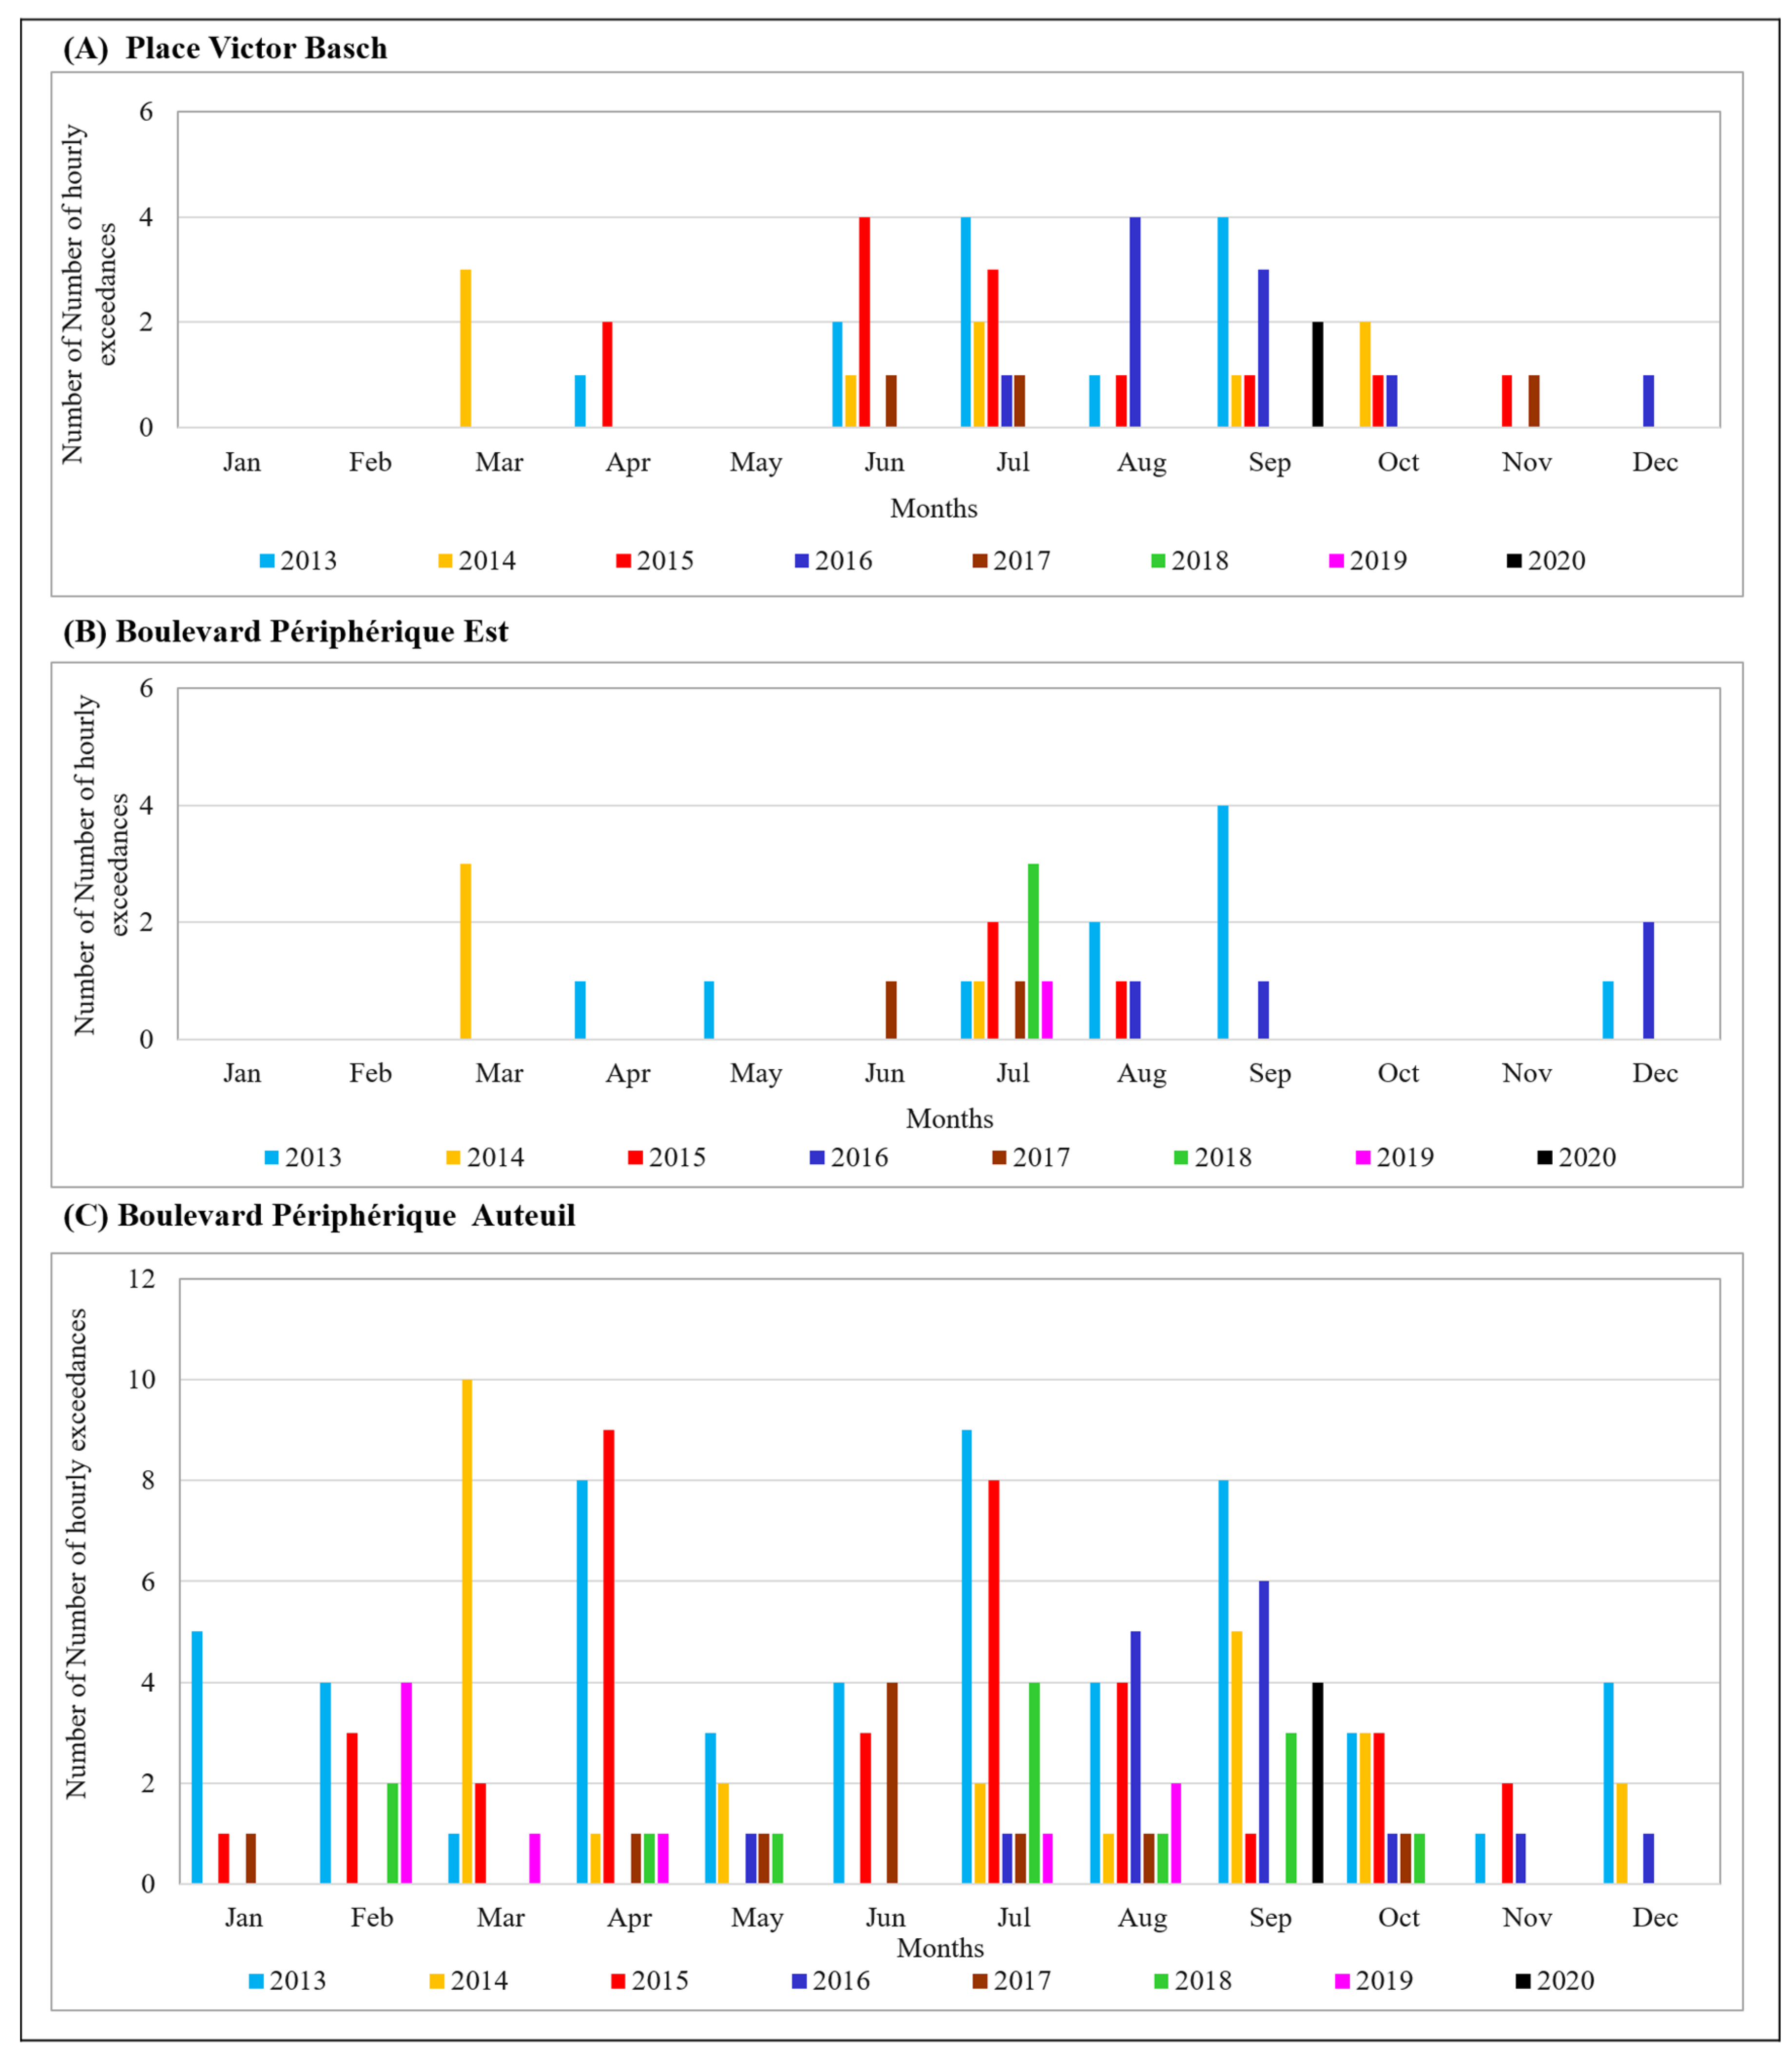
4.2.2. Monthly Exceedances of NO2
4.3. Differences between Lockdown and Non-Lockdown Phases
4.4. Spatiotemporal Variability of Daily Concentrations of NO2, PM2.5, and PM10 from Mobile Measurements (Fine Scale)
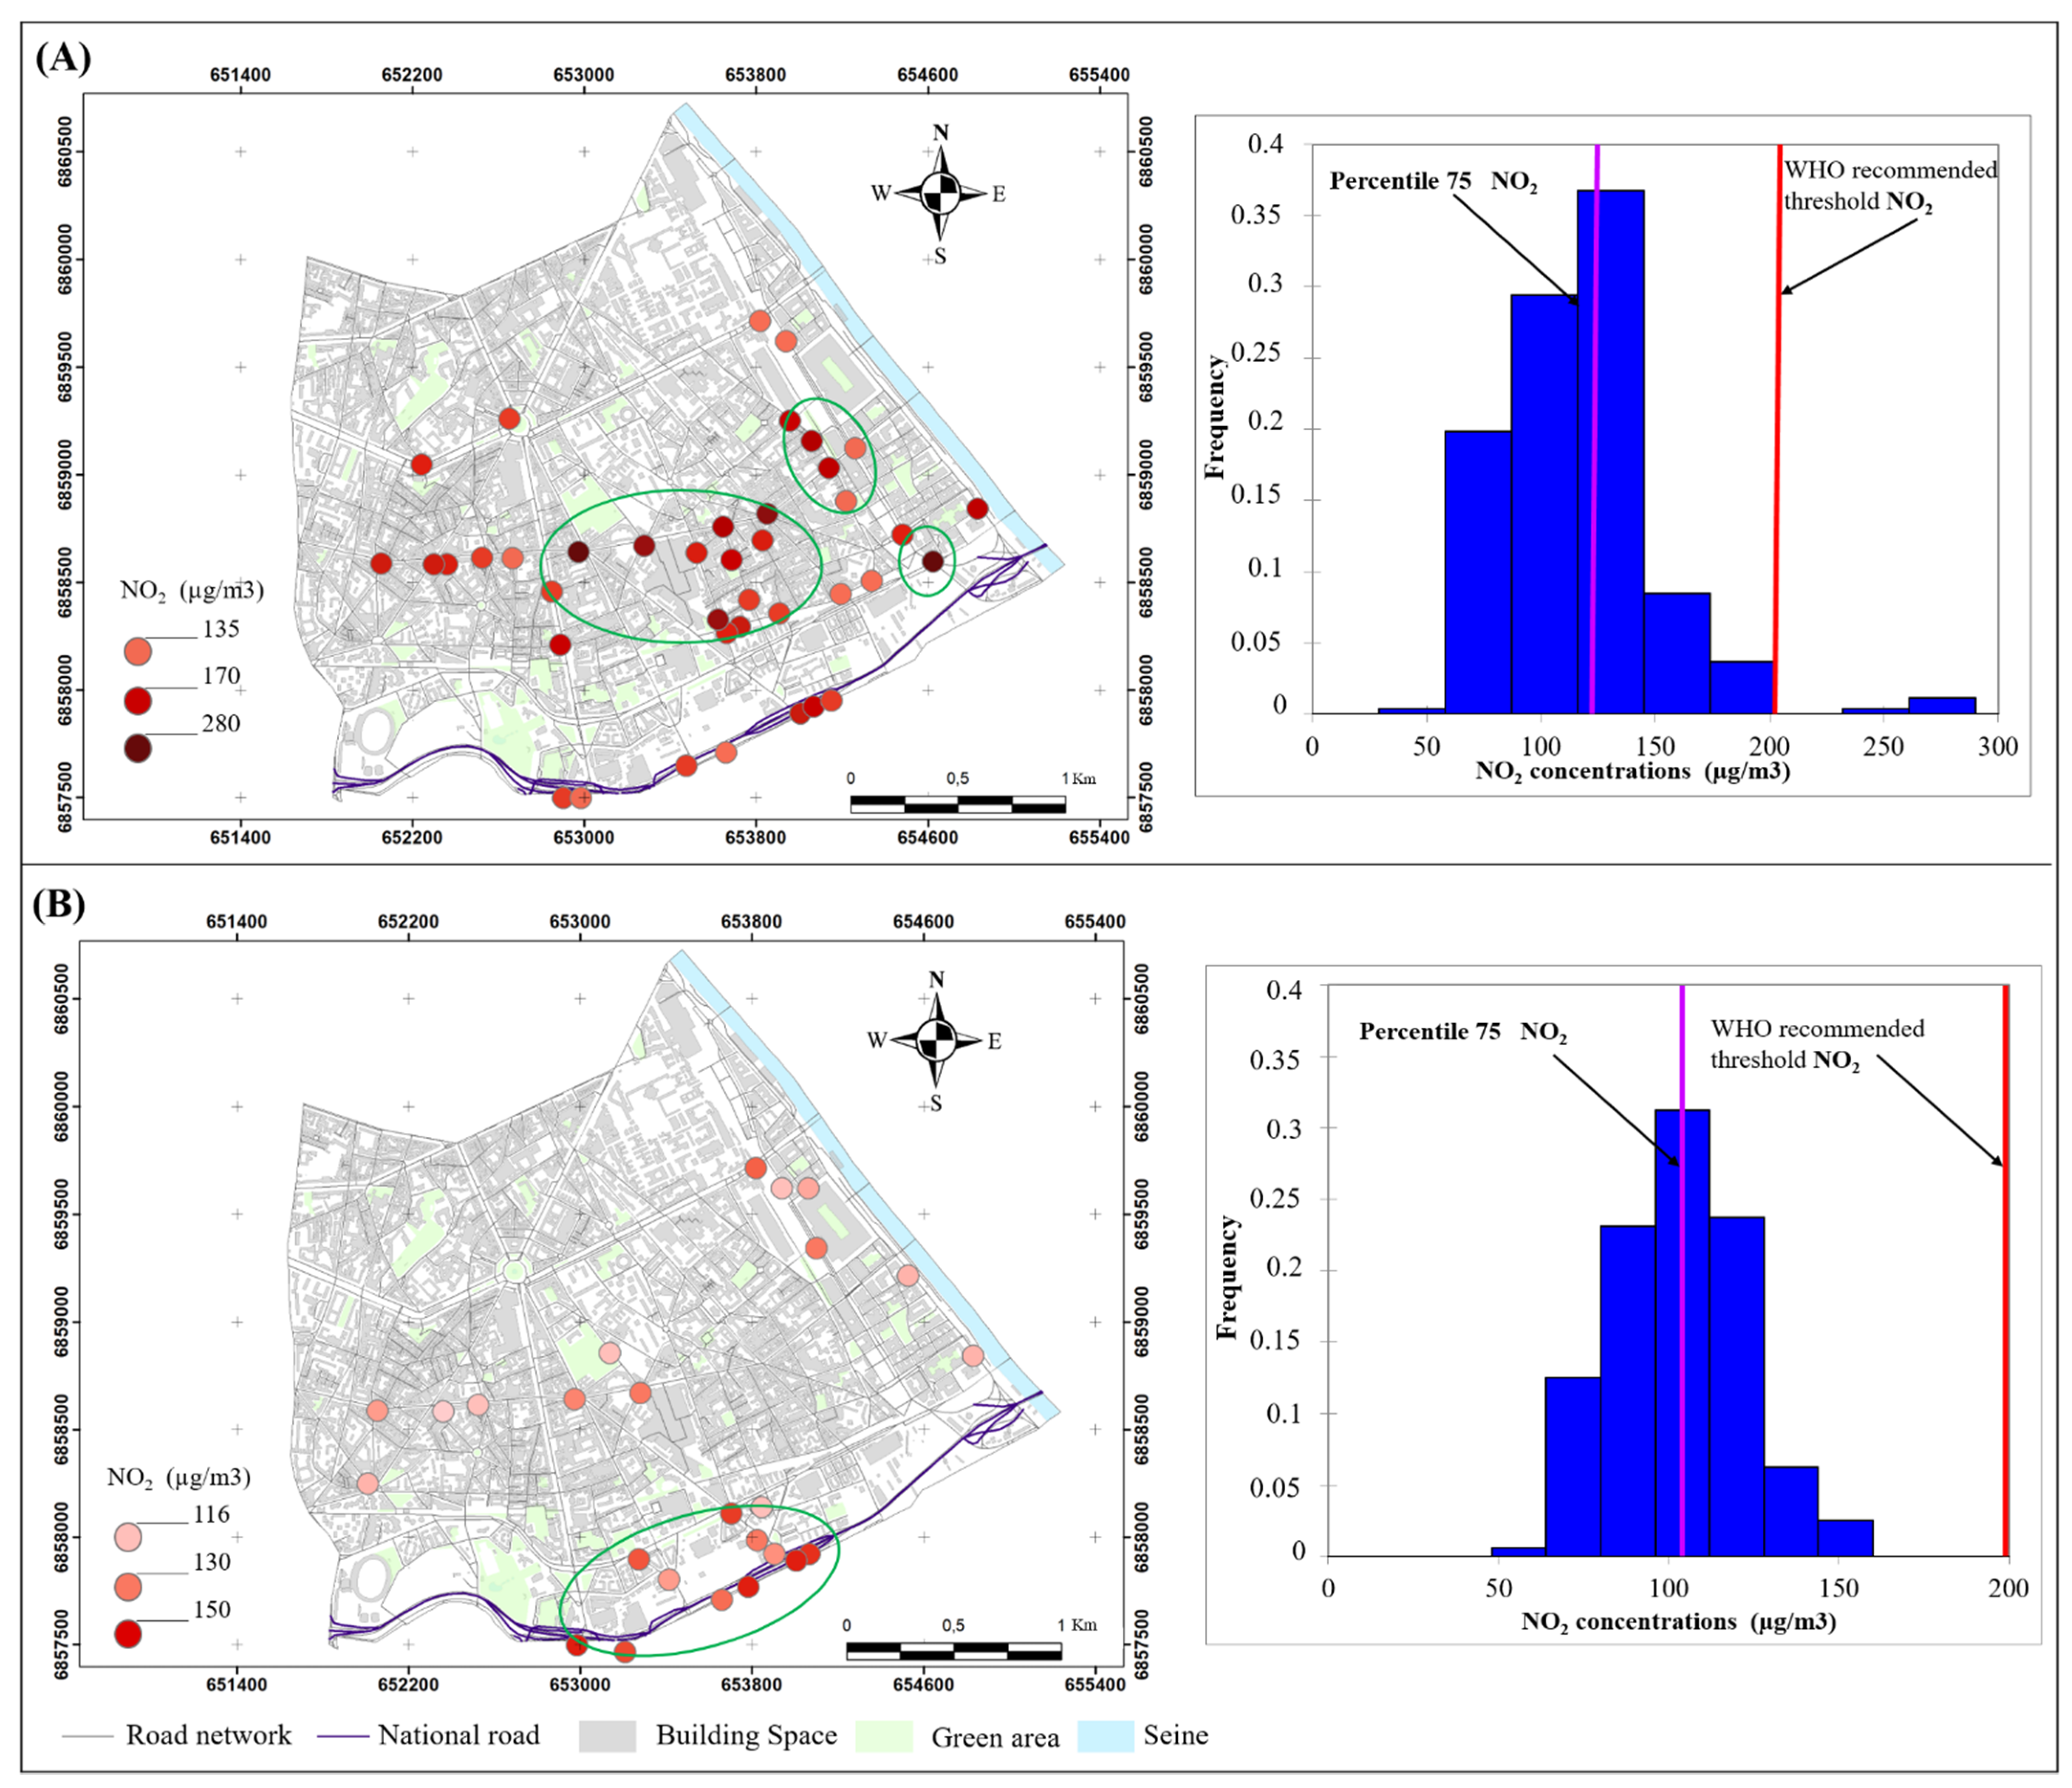
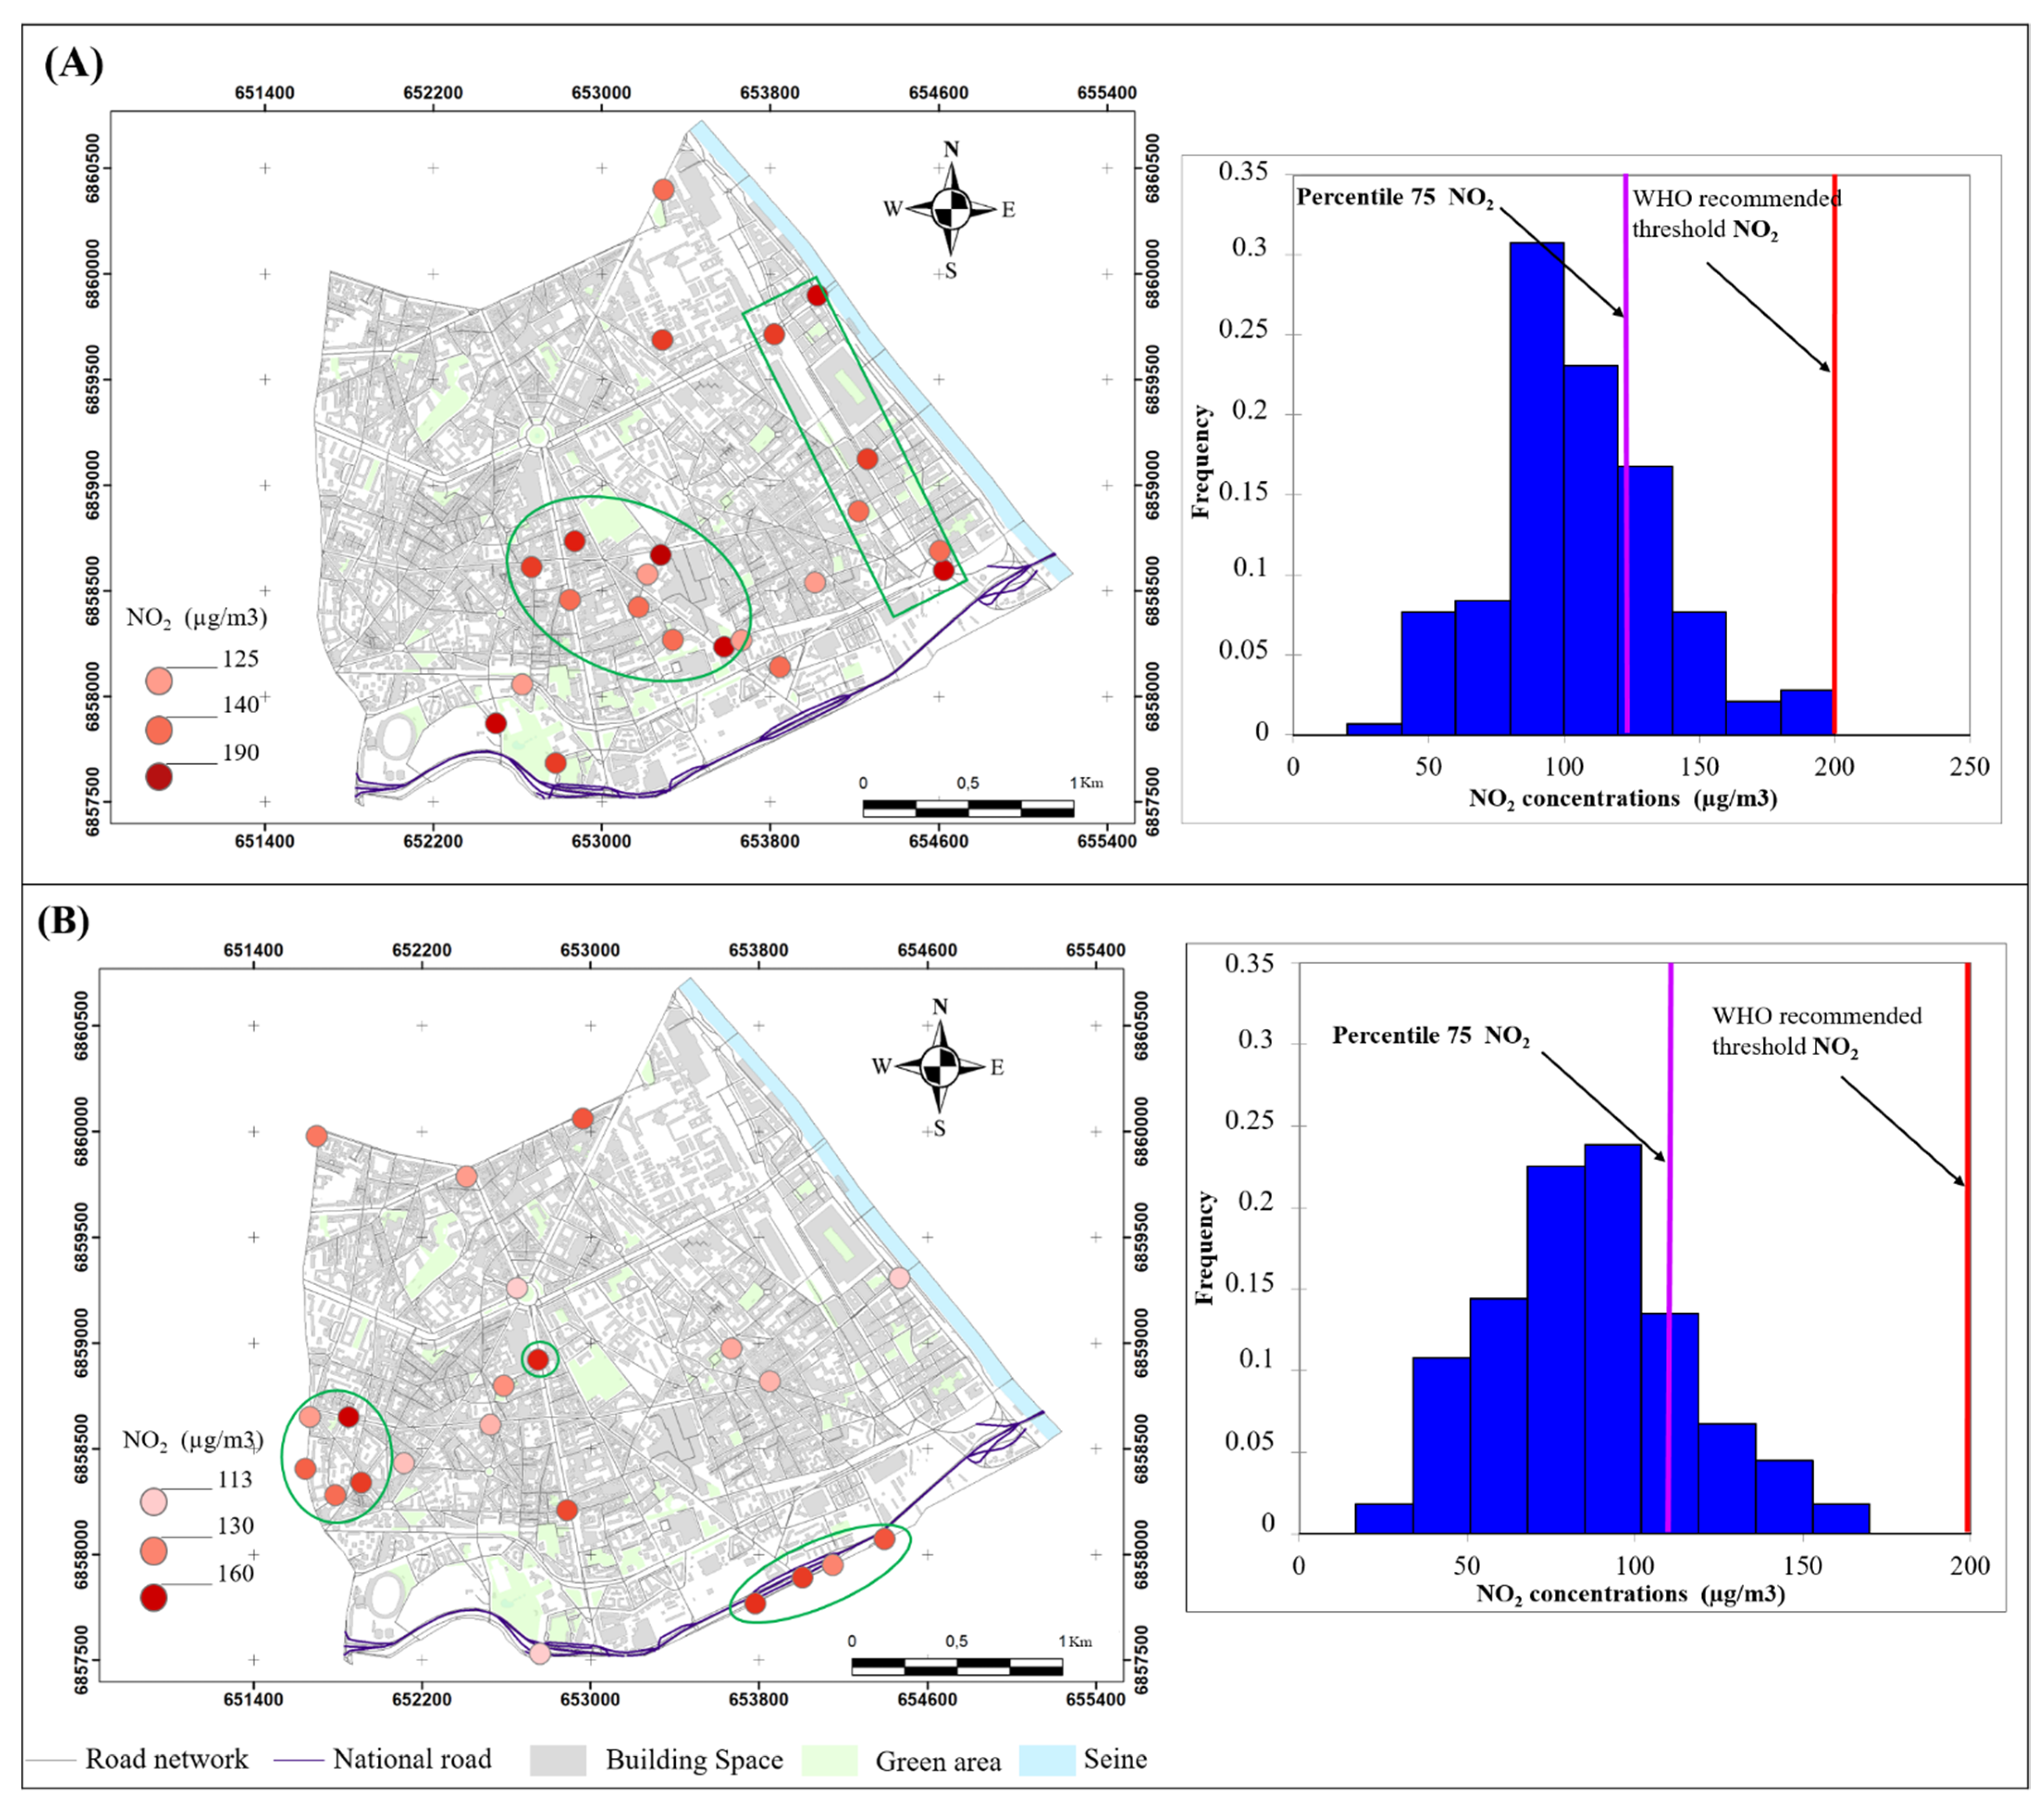
4.4.1. Spatiotemporal Variability of NO2 Concentrations
Differences in NO2 during Lockdown by Weather Type: Stable or Unsettled
NO2 Variations during Non-Lockdown Periods by Weather Type
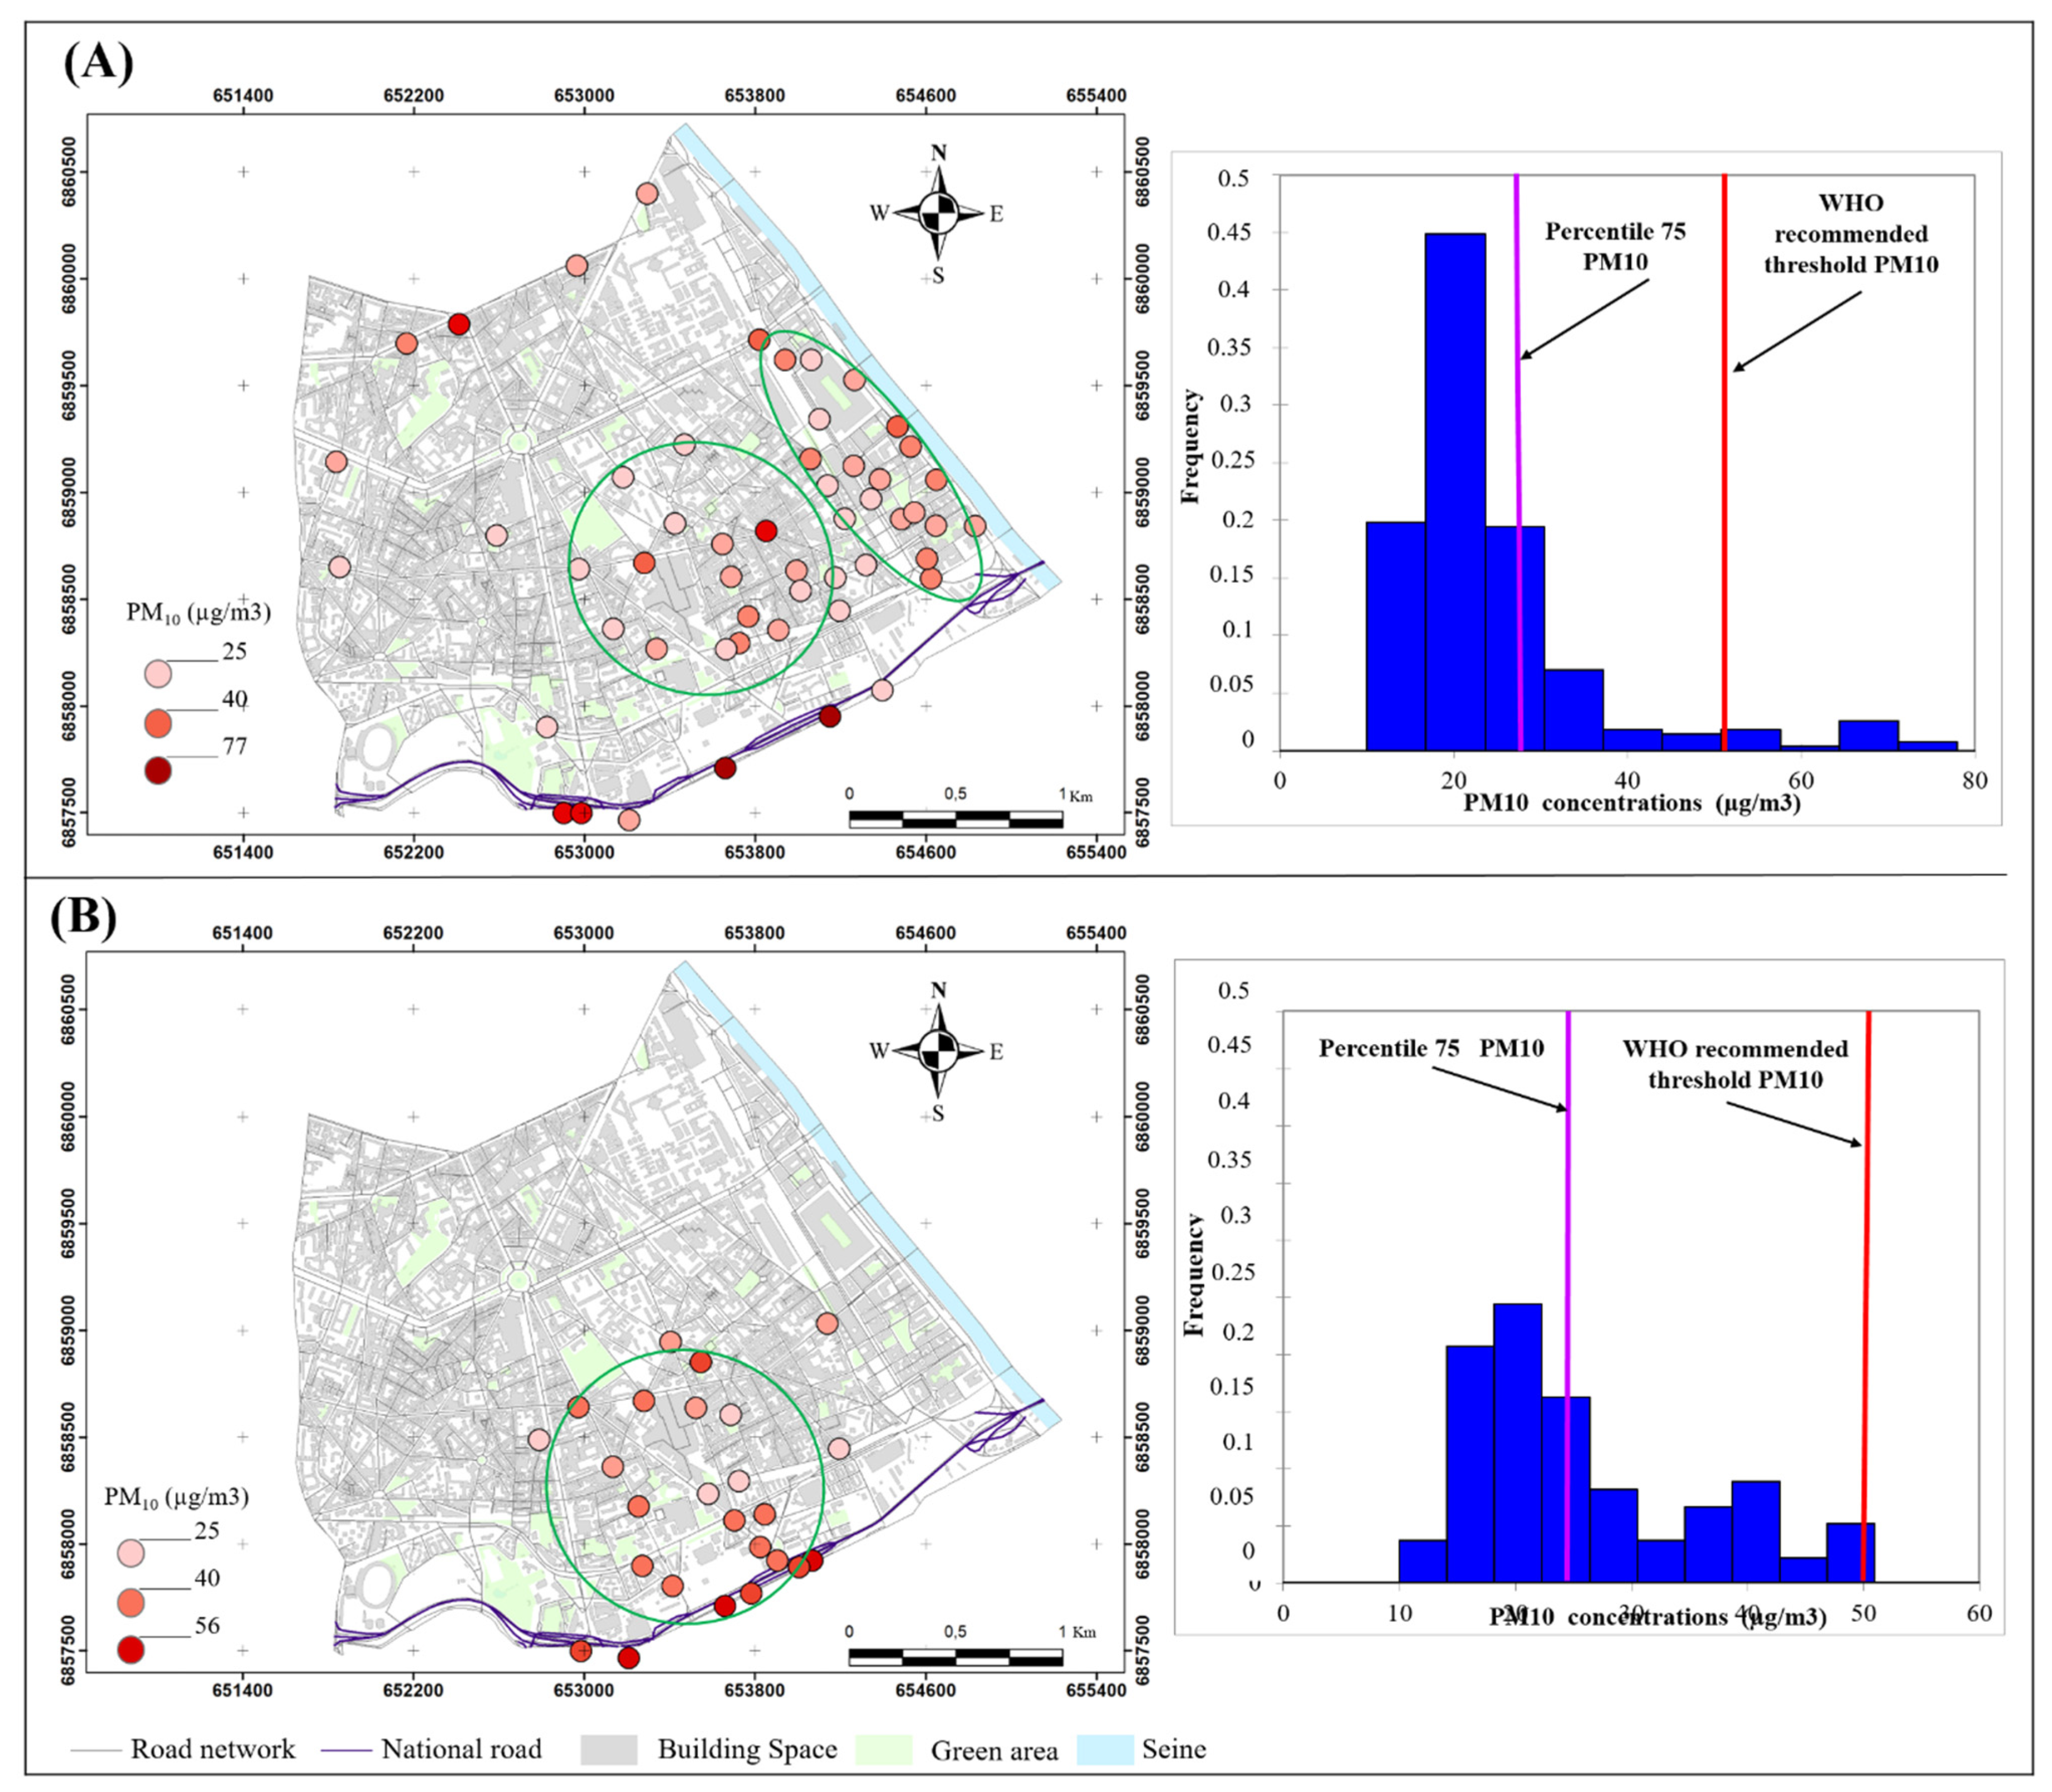
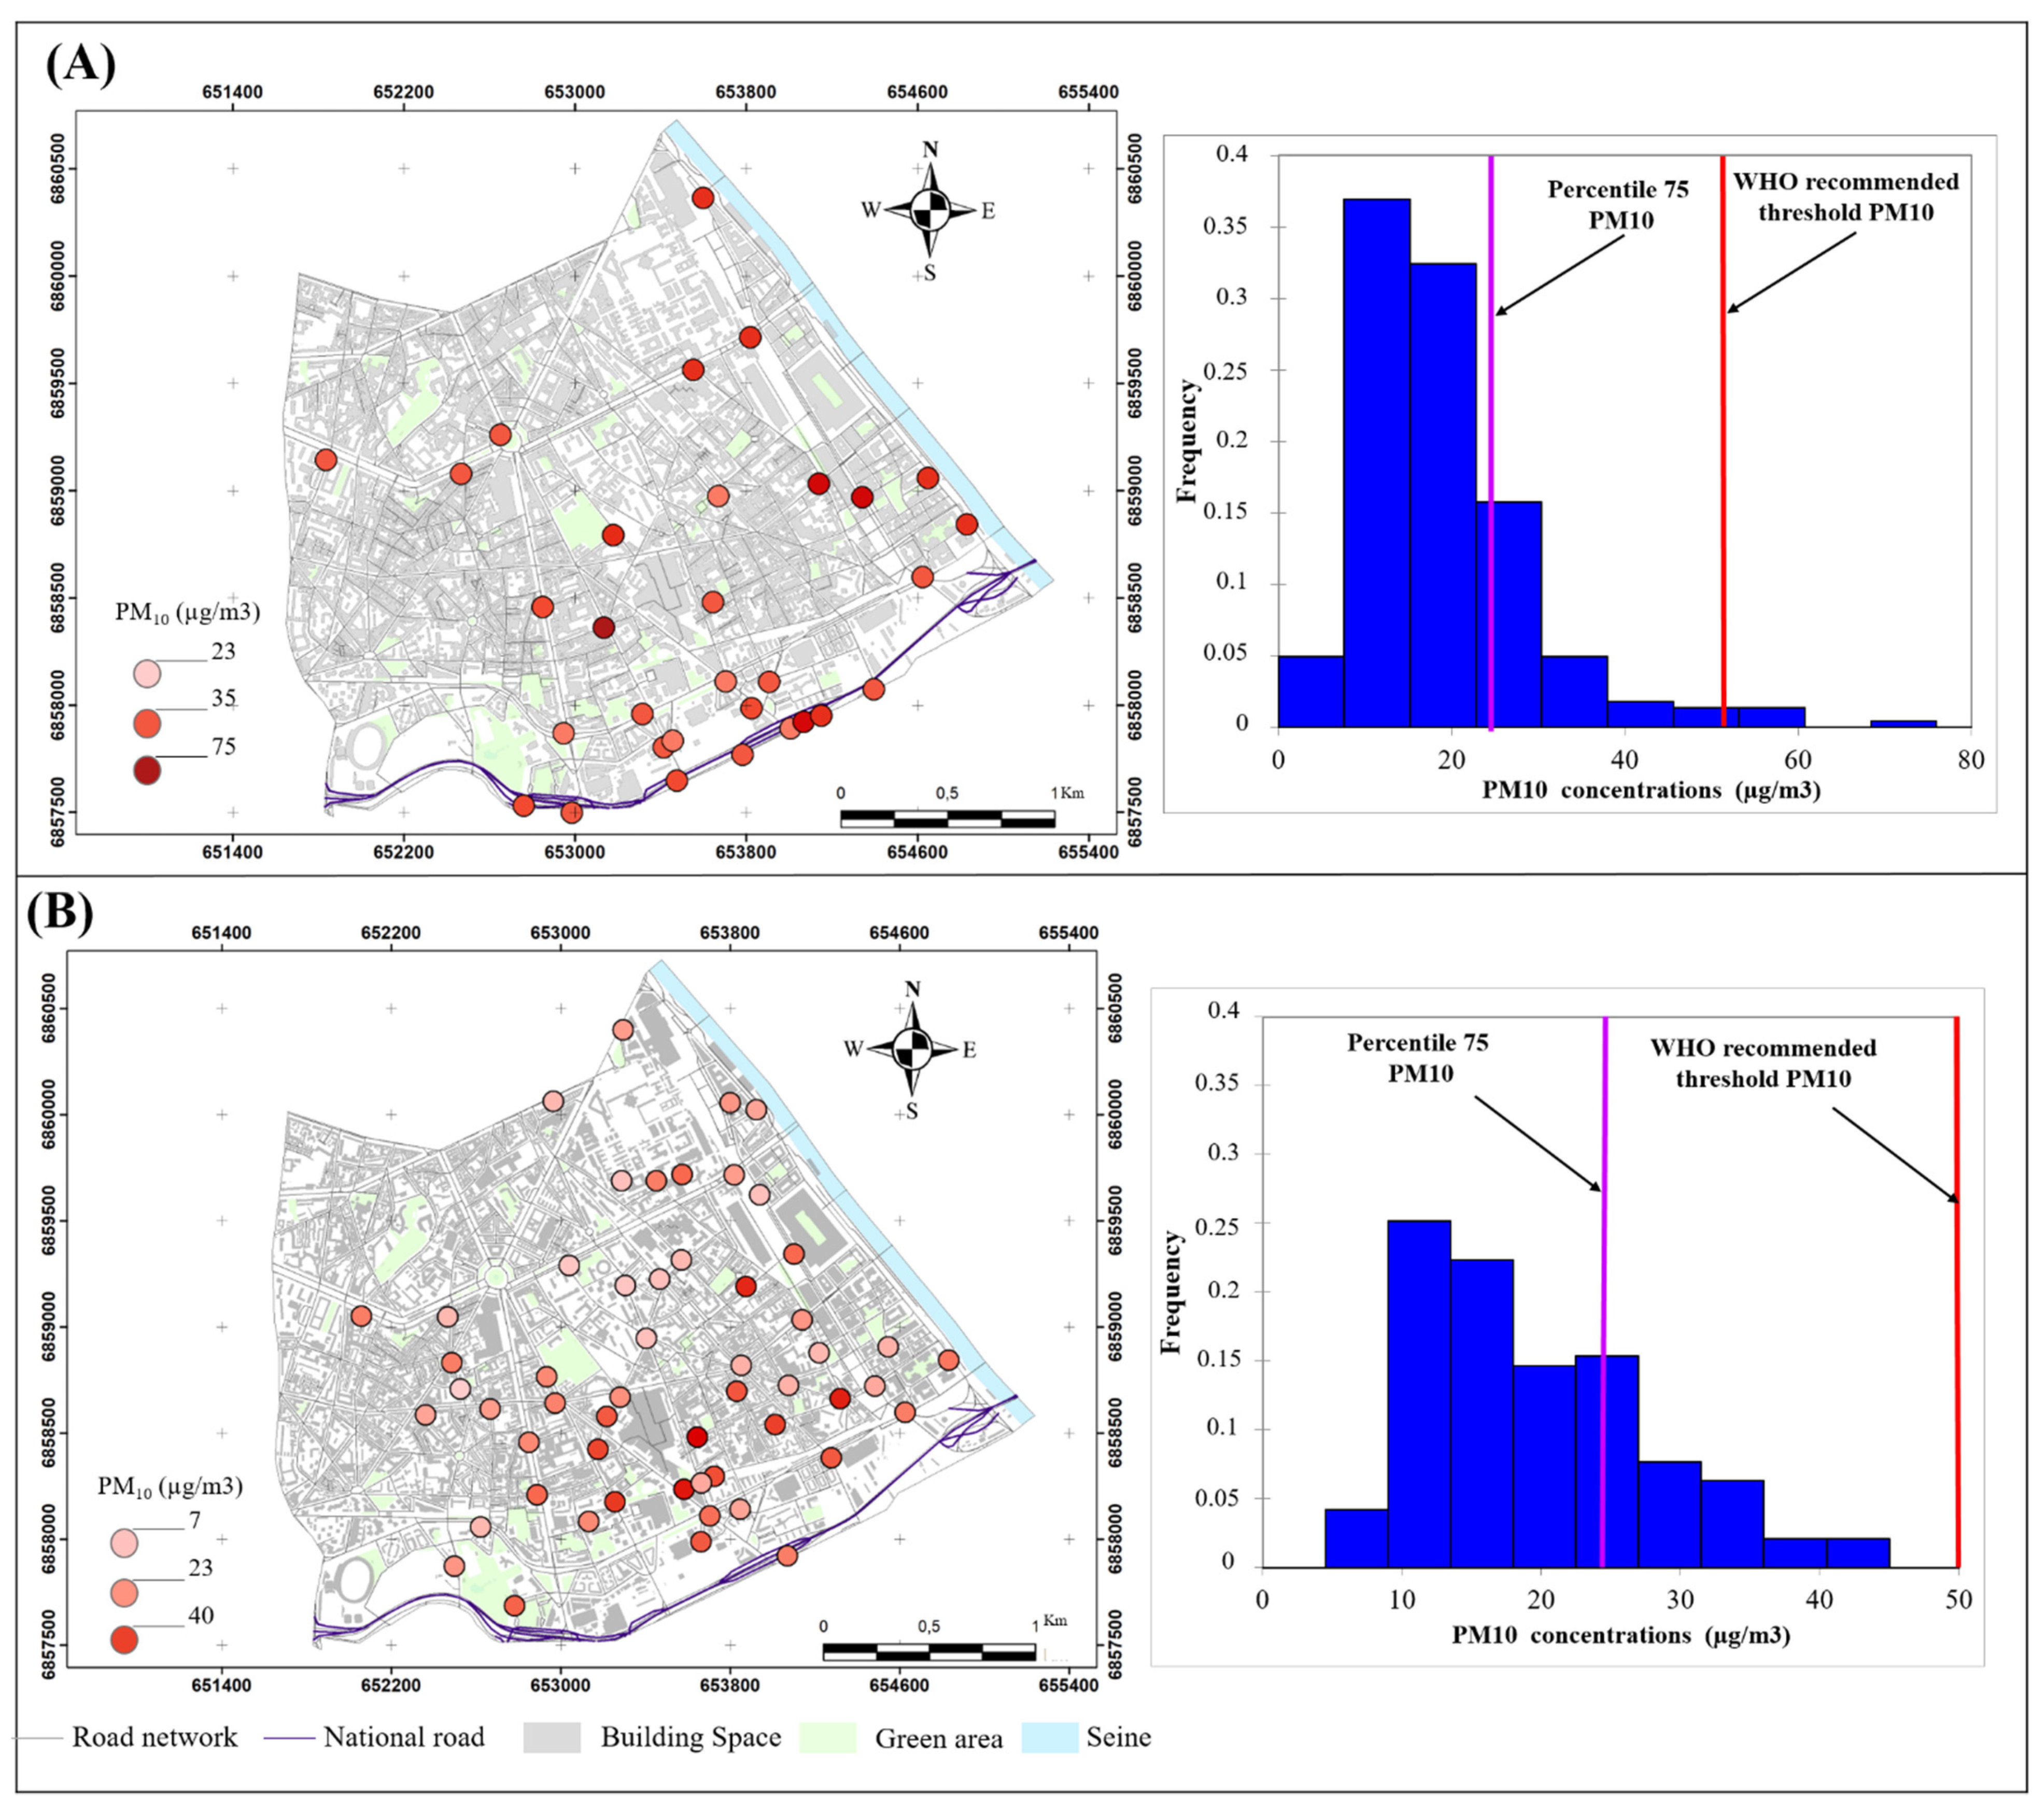
4.4.2. Spatiotemporal Variability of Daily PM10 Concentrations
PM10 Variations during Lockdown in Stable and Unsettled Weather
PM10 Variations during Non-Lockdown Periods in Stable and Unsettled Weather
5. Discussion
6. Conclusions
Author Contributions
Funding
Institutional Review Board Statement
Informed Consent Statement
Data Availability Statement
Conflicts of Interest
Appendix A
References
- World Health Organization. WHO Global Air Quality Guidelines: Particulate Matter (PM2.5 and PM10), Ozone, Nitrogen Dioxide, Sulfur Dioxide and Carbon Monoxide. World Health Organization. 273p. Licence: CC BY-NC-SA 3.0 IGO. 2021. Available online: https://apps.who.int/iris/handle/10665/345329 (accessed on 17 May 2021).
- WHO (World Health Organization). Coronavirus Disease (COVID-2019) Situation Reports; World Health Organization: Geneva, Switzerland, 2020; Available online: https://reliefweb.int/report/world/coronavirus-disease-2019-covid-19-situation-report-94-23-april-2020 (accessed on 23 March 2020).
- GBD. 2018. Global, regional, and national comparative risk assessment of 84 behavioural, environmental and occupational, and metabolic risks or clusters of risks for 195 countries and territories, 1990-2017: A systematic analysis for the Global Burden of Disease Study 2017. Lancet 2017, 392, 1923–1994. [Google Scholar] [CrossRef] [Green Version]
- Copat, C.; Cristaldi, A.; Fiore, M.; Grasso, A.; Zuccarello, P.; Signiorelli, S.; Conto, G.O.; Ferrante, M. The role of air pollution (PM and NO2 ) in COVID-19 spread and lethality: A systematic review The role of air pollution (PM and NO2) in COVID-19 spread and lethality: A systematic review. Environ. Res. 2020, 191, 110129. [Google Scholar] [CrossRef] [PubMed]
- Ju, M.J.; Oh, J.; Choi, Y.-H. Changes in air pollution levels after COVID-19 outbreak in Korea. Sci. Total Environ. 2021, 750, 141521. [Google Scholar] [CrossRef] [PubMed]
- Airparif. Surveillance et Information sur la Qualité de à Paris en 2016; Rapport Airparif: Paris, France, 2016; 12p. [Google Scholar]
- Airparif. Bilan de la Qualité de l’air Année 2018; Surveillance et Information en Île-de-France: Paris, France, 2018; 92p. [Google Scholar]
- Anthes, R.A. Meteorology, 7th ed.; Prentice Hall: Upper Saddle River, NJ, USA, 1997; 214p. [Google Scholar]
- Basly, L. Télédétection Pour la Qualité de l’air en Milieu Urbain. Domain_Other. Ph.D. Thesis, Université Nice Sophia Antipolis, Nice, France, 2000. ffNNT: 2000NICE5465ff. fftel-00006291f. [Google Scholar]
- Dahech, S. Vent, Type de temps et Impact Sur la Pollution Atmosphérique à Sfax. Ph.D. Thesis, Université Paris VII, Paris, France, 2007; 309p. [Google Scholar]
- Roussel, I. Climat et qualité de l’air. Cahier de géographie physique. Univ. Des Sci. Et Technol. De Lille N° 1993, 9, 33–46. [Google Scholar]
- Wang, C.; Horby, P.W.; Hayden, F.G.; Gao, G.F. A novel coronavirus outbreak of global health concern. Lancet 2020, 473, 470–473. [Google Scholar] [CrossRef] [Green Version]
- Zhu, Y.; Xie, J.; Huang, F.; Cao, L. Association between short-term exposure to air pollution and COVID-19 infection: Evidence from China. Sci. Total Environ. 2020, 727, 138704. [Google Scholar] [CrossRef] [PubMed]
- McKee, M.; Stuckler, D. If the world fails to protect the economy, COVID-19 will damage health not just now but also in the future. Nat. Med. 2020, 26, 640–648. [Google Scholar] [CrossRef] [PubMed] [Green Version]
- Zhang, X.; Tang, M.; Guo, F.; Wei, F.; Yu, Z.; Gao, K.; Jin, M.; Wang, J.-B. Associations between Air Pollution and COVID-19 epidemic during quarantine period in China. Environ. Pollut. 2021, 268, 115897. [Google Scholar] [CrossRef] [PubMed]
- Dutheil, F.; Baker, J.S.; Navel, V. COVID-19 as a factor influencing air pollution. Environ. Pollut. 2020, 263, 3p. [Google Scholar] [CrossRef] [PubMed]
- Chakraborty, I.; Maity, P. COVID-19 outbreak: Migration, effects on society, global environment and prevention. Sci. Total Environ. 2020, 728, 138882. [Google Scholar] [CrossRef] [PubMed]
- Direction Régionale des Entreprises, de la Concurrence, de la Consommation, du Travail et de l’Emploi d’Île-de-France. 2016. Économie Numérique: 80% des établissements Franciliens en Cœur d’agglomération, Note Thématique du Service études, Statistiques, évaluation de la Direccte Île-de-France, Pris, mars 2016, 6p. Available online: https://www.insee.fr/fr/statistiques/1908413 (accessed on 17 May 2021).
- INSEE. Population légale de l’île de France. In Insee Flash Île-de-France N° 45; Paris, France. 2020. Available online: https://www.insee.fr/fr/statistiques/5002478 (accessed on 17 May 2021).
- Airparif. Bilan de la qualité de l’air Année 2019; Surveillance et Information en Île-de-France: Paris, France, 2019; 98p. [Google Scholar]
- APUR. Les Quartiens Parisiens de la Politique de la Ville. Contrat de Ville 2015–2020. Principale Données de l’Observatoire des Quartier Prioritaires; APUR Atelier Parisien d’Urbanisme: Paris, France, 2016; 112p. [Google Scholar]
- Dahech, S.; Charfi, S.; Madelin, M. Représentativité des températures mesurées dans la station météorologique Paris Montsouris. Climatologie 2021, 17, 5. [Google Scholar] [CrossRef]
- Lin, C.; Gillespie, J.; Schuder, M.D.; Duberstein, W.; Beverland, I.J.M.R. Heal Evaluation and calibration of Aeroqual series 500 portable gas sensors for accurate measurement of ambient ozone and nitrogen dioxide. Atmos. Environ. 2015, 100, 111–116. [Google Scholar] [CrossRef]
- Monnier, S.; Thibaudon, M.; Besancenot, J.-P.; Michelot, N. Pollution, pollen et pollinoses: Retour sur l’épisode de pollution de mars 2014 en France. Pollut. Atmosphérique. 2015, 157–164. [Google Scholar]
- Rahman, A.; Luo, C.; Khan, M.H.R.; Ke, J.; Thilakanayaka, V.; Kumar, S. Influence of atmospheric PM2.5, PM10, O3, CO, NO2, SO2, and meteorological factors on the concentration of airborne pollen in Guangzhou, China. Atmos. Environ. 2019, 212, 290–304. [Google Scholar] [CrossRef]
- Skirienė, A.F.; Stasiskienė, Z. COVID-19 and Air Pollution: Measuring Pandemic Impact to Air Quality in Five European Countries. Atmosphere 2021, 12, 290. [Google Scholar] [CrossRef]
- Sokhi, R.S.; Singh, V.; Querol, X.; Finardi, S.; Targino, A.C.; de Fatima Andrade, M.; Zavala, M. A global observational analysis to understand changes in air quality during exceptionally low anthropogenic emission conditions. Environ. Int. 2021, 157, 106818. [Google Scholar]
- Brunet, Y.; Chevallier, F.; Colette, A.; Deniel, C.; Doussin, J.-F.; Dubreuil, V.; Hanoune, B.; Lac, C.; Loubet, B.; Loustau, D.; et al. Effet du Confinement du Printemps 2020 sur la Composition Atmosphérique. Les outils de la Recherche et l’expertise de la Communauté Scientifique au Service du Suivi des Effets de la Gestion de Crise. ALLEnvi Alliance Nationale de Recherche Pour l’environnement. Available online: https://www.allenvi.fr/groupes-thematiques/atmosphere/actions (accessed on 4 February 2022).
- Morinello, S.; Lolli, F.; Gamberini, R. The Impact of the COVID-19 Emergency on Local Vehicular Traffic and Its Consequences for the Environment: The Case of the City of Reggio Emilia (Italy). Sustainability 2021, 13, 118. [Google Scholar] [CrossRef]


Publisher’s Note: MDPI stays neutral with regard to jurisdictional claims in published maps and institutional affiliations. |
© 2022 by the authors. Licensee MDPI, Basel, Switzerland. This article is an open access article distributed under the terms and conditions of the Creative Commons Attribution (CC BY) license (https://creativecommons.org/licenses/by/4.0/).
Share and Cite
Dahech, S.; Abdmouleh, M.A.; Lagmiri, S. Spatiotemporal Variation of Air Quality (PM and NO2) in Southern Paris during COVID-19 Lockdown Periods. Atmosphere 2022, 13, 289. https://doi.org/10.3390/atmos13020289
Dahech S, Abdmouleh MA, Lagmiri S. Spatiotemporal Variation of Air Quality (PM and NO2) in Southern Paris during COVID-19 Lockdown Periods. Atmosphere. 2022; 13(2):289. https://doi.org/10.3390/atmos13020289
Chicago/Turabian StyleDahech, Salem, Mohamed Ali Abdmouleh, and Souad Lagmiri. 2022. "Spatiotemporal Variation of Air Quality (PM and NO2) in Southern Paris during COVID-19 Lockdown Periods" Atmosphere 13, no. 2: 289. https://doi.org/10.3390/atmos13020289
APA StyleDahech, S., Abdmouleh, M. A., & Lagmiri, S. (2022). Spatiotemporal Variation of Air Quality (PM and NO2) in Southern Paris during COVID-19 Lockdown Periods. Atmosphere, 13(2), 289. https://doi.org/10.3390/atmos13020289