Error in Authors Name
In the original publication [
1], there was a mistake in the Name published. Ana-Maria Trunfio-Sfarghiu. The corrected Ana-Maria Trunfio-Sfarghiu appears below.
Aishatu Abubakar Sadiq 1,2,*, Salah Khardi 1,2, Adina-Nicoleta Lazar 1, Imam Wada Bello 3, Samson Polycarp Salam 4, Aisha Faruk 3, Mitchell A. Alao 4, Mickaël Catinon 5, Michel Vincent 5 and Ana-Maria Trunfio-Sfarghiu 1
Error in Affiliation
In the published publication [
1], there was an error regarding the second affiliation for “Aishatu Abubakar Sadiq
1,2 and Salah Khardi
1,2”. Affiliation 2 should correctly be “EASE Laboratories, Universitie Gustave Eiffel (UGE), Lyon-Campus, 25 Avenue Francois Mitterand, 69500 Lyon, France”.
Error in Abstract
In the original publication [
1], there was an error in the abstract due to a data error, which we detected recently. The abstract has been corrected to read.
“Emerging African countries are characterized by explosive population growth and urbanization, which threaten environmental sustainability. This study comparatively characterized ambient aerosols and assessed cytotoxicity to facilitate improving health and environmental policy. Twenty-four air samples were collected at high and low-density traffic sites in Kano State using polysulfone and stainless steel filters attached to an automated pump. The physico-chemical properties of particulate matter were determined using scanning electron microscopy and energy dispersive X-ray analysis (SEM-EDX). In vitro, their potential toxicity was assessed using macrophages and cell fixation with staining. Results showed 51.7% of particles as PM2.5, with the highest particle concentration in mixed sites (urban and industrial). Particle classification into four groups by elemental composition and structure showed: sand particles (Si, Al, Fe, Ca, Mg, K, Na, Mo, Sr, Zr) 30–51%; other fibers 0–3%; other particles (Si, Fe, S, Mo, Zn, and other metals) 22–40%; and silicone-based fibres 23–34%. The abundant elements are: Si, Al, Ca, Ce, Ti, Fe, Cl, Pb, and Mn. The lowest viability on cytotoxicity assessment was recorded in mixed site M2. The majority of households were located within 50 m of air sampling sites. Proximity to traffic sites worsens health, as evidenced in cytotoxicity findings. We recommend improved urban planning and intensification of emissions control.”
Missing Citation
In the original publication [
1], “Number 61” was not cited. The citation has now been inserted under “3. Results, 3.1 Scanning Electron Microscopy and EDX Results, Paragraph 20” and should read:
Text Correction
There was an error in the original publication. The detected data error and recalculation have changed multiple paragraphs in the results section to accommodate the corrected values shown in the updated figures contained here.
A correction has been made to “3. Results, 3.1. Scanning Electron Microscopy and EDX Results, Paragraph 20–Paragraph 29”:
3. Results
3.1. Scanning Electron Microscopy and EDX Results
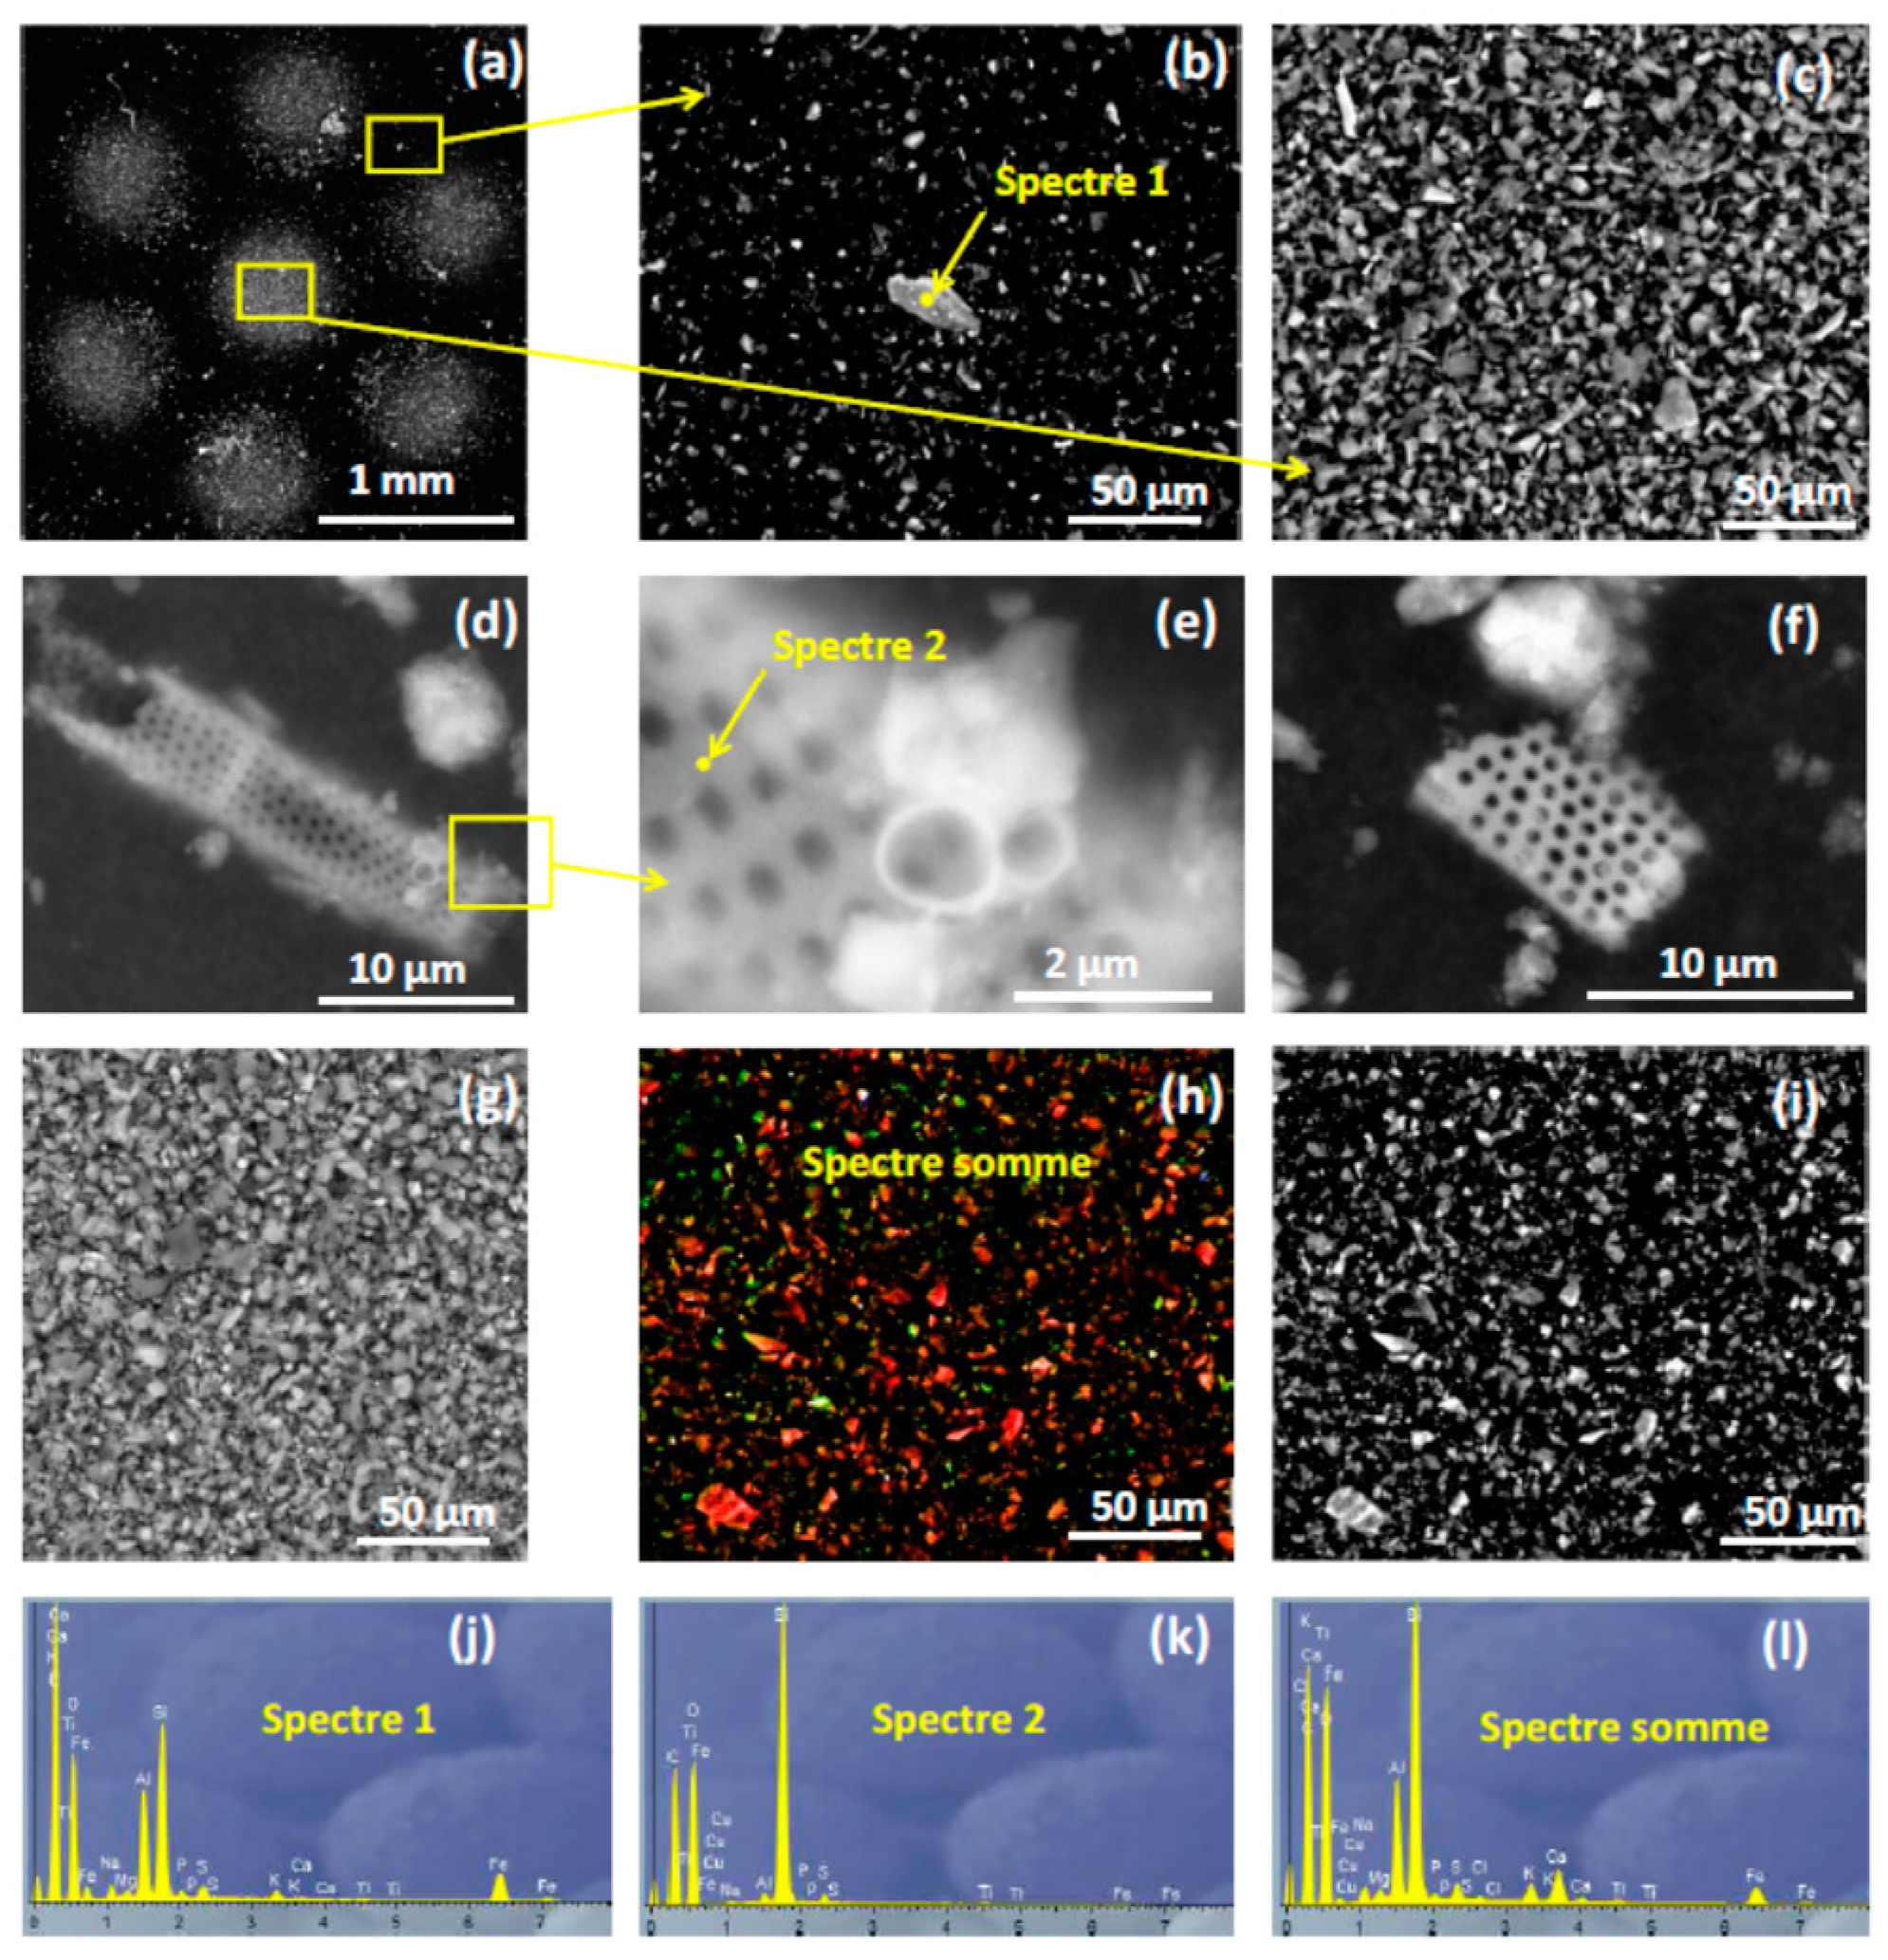
Figure 3a shows the SEM overall appearance of the carbon adhesive discs. A large particle in the peripheral zone is highlighted in
Figure 3b. The central areas are seen in
Figure 3c,g,i with high particle saturation.
Figure 3d–f show multiple views of Si wicks which are common in construction sites (used for insulation). At urban roadside sampling sites, larger silicone wicks were identified, with a reduction in size (
Figure 3f) seen in rural sites. The images SEM-EDX of the central areas (concentrated with particles) of the carbon collecting discs show similar aspects in urban and rural areas, while mixed areas (
Figure 3h) show a predominance of Si-based mineral elements (in red) over organic elements (carbon sand). The EDX sum spectrum (
Figure 3l) consists mainly of inorganic particles, particularly silicone (Si), aluminum (Al), and calcium (Ca). These elements can come from sand particles (spectrum 1–
Figure 3j) or silicon fibers (spectrum 2–
Figure 3k). Saharan sand particles are known [61] to consist of calcite, quartz, and iron-rich particles. Therefore, these sand particles can have sizes ranging between a few hundred nanometers and can contain Si, Al, Fe, Ca, Mg, K, Na, Mo, Sr, Zr and it will therefore be difficult to differentiate them from particles like silicon fiber. In order to be able to differentiate these two compounds, we carried out a more complete size and morphology analysis by analyzing 1000 particles on each peripheral zone of each carbon adhesive discs. For this we used the individual SEM-EDX analysis and automatic which allowed us to go back for each site to the parameters of: size (equivalent circle diameter ECD), shape (equivalent surface ratio ESR) and EDX elementary composition for each particle. Thanks to the automatic recording of the position of each particle, we were also able to obtain the scanned surface in order to obtain 1000 particles. This allowed us to plot
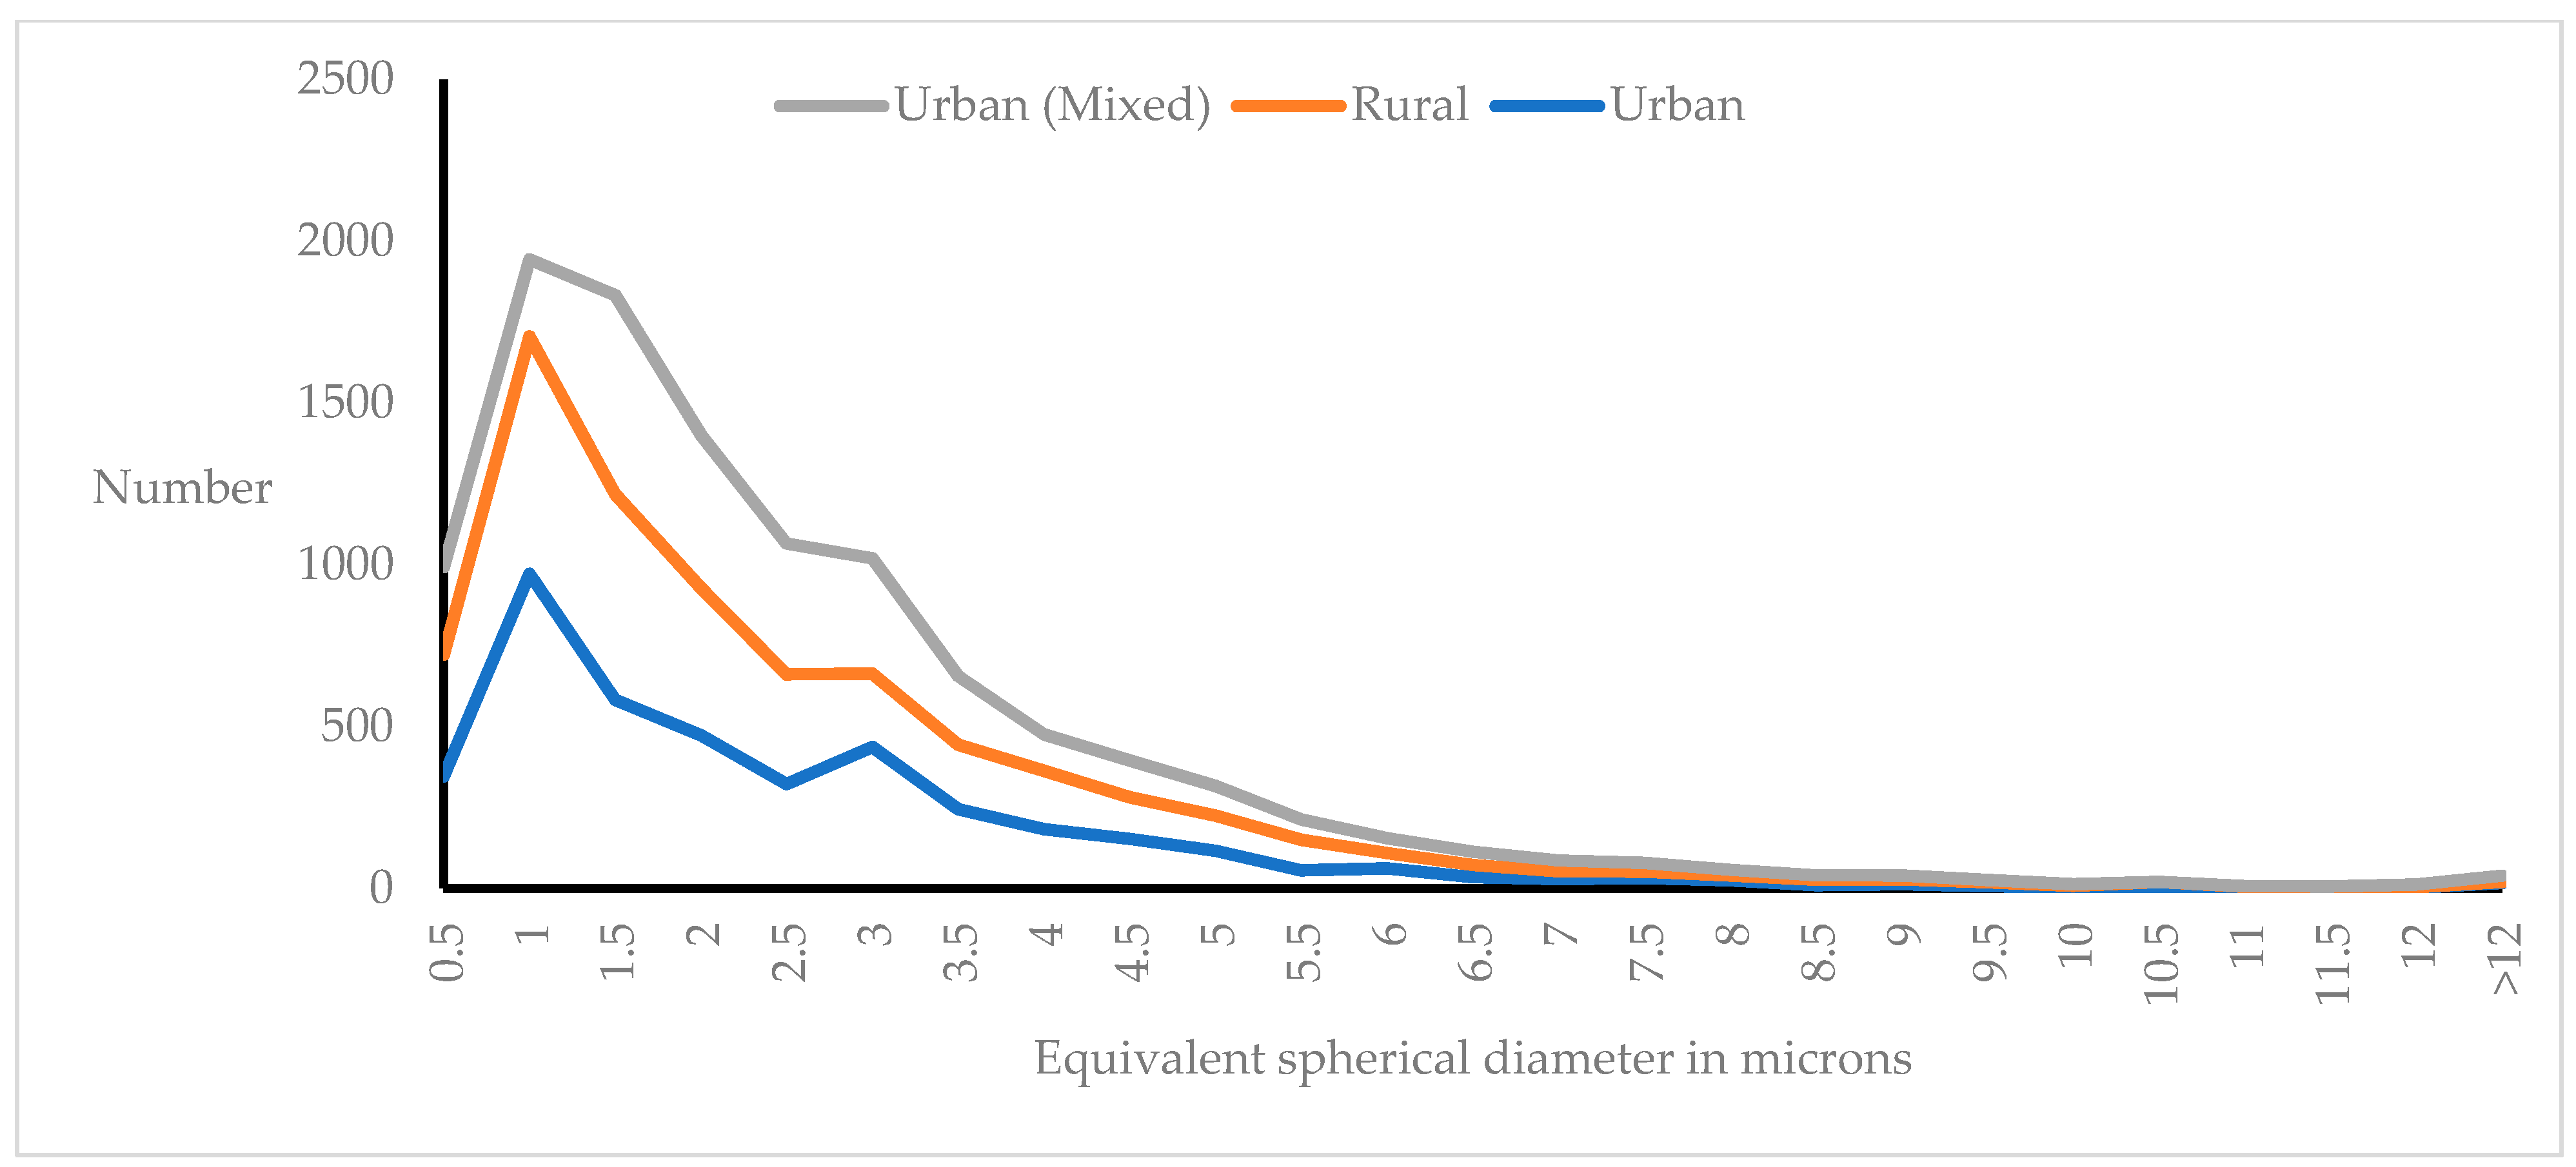
Figure 4 which gives us in addition to the particle size distribution, a rough estimate of the particle concentration per mm
2 for each type of site.
Figure/Table Legend
In the original publication, there was a mistake in the figure and legend for “
Figure 3”. “The spectroscopic findings were missing and point spectra not shown”. The correct figure and legend appears above.
A total of 12,313 particles were seen on scanning electron microscopy from all sites, with the highest number of particles, 33.4%, in mixed settlements.
Figure 4 below illustrates a Gaussian showing the main size of particles as 0.5 µm to 3.0 µm. Notably, larger-sized particles were scarce in all sites, with a marked reduction in particle number at ≥5 µm.
Figure/Table Legend
In the original publication, there was a mistake in the figure and legend for “
Figure 4”. The figure was
Figure 3 the original, but should be correctly placed as “
Figure 4”. The correct figure and legend appears below (as
Figure 4 now).
In
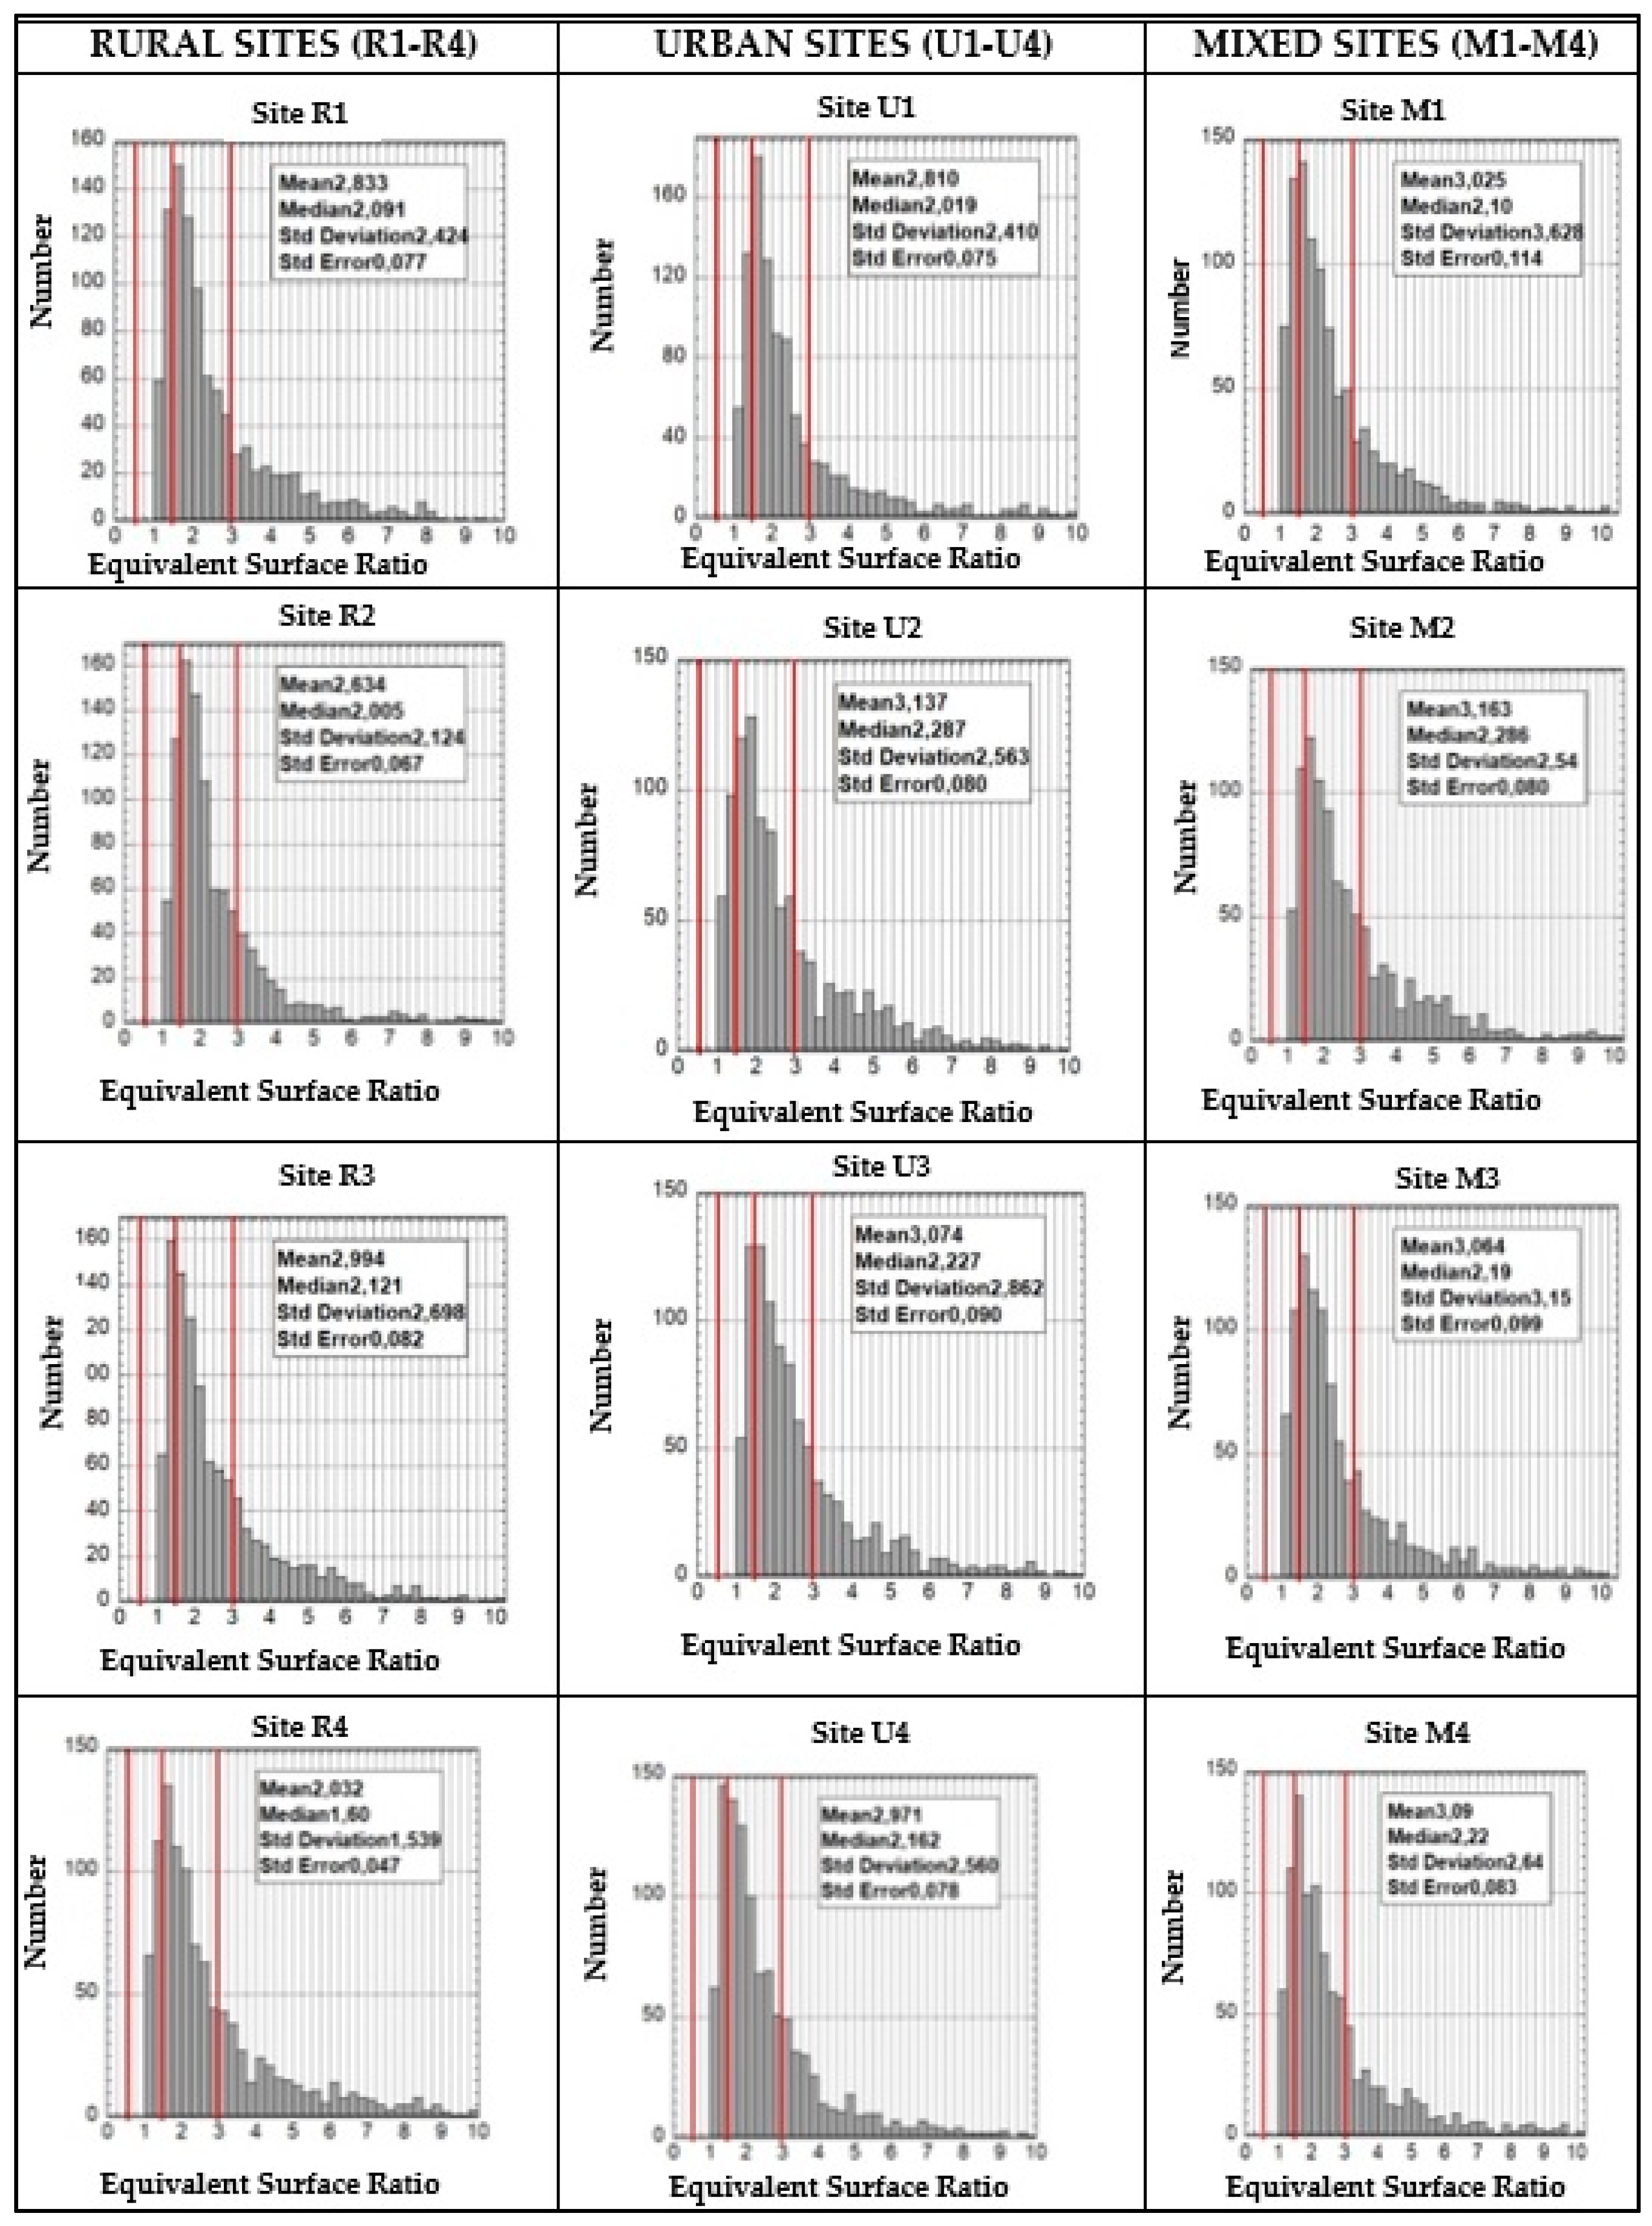
Figure 5 and
Figure 6 below, site-specific histograms are shown, illustrating the size distribution using ECD and morphology using ESR. The distributions show a peak number of particles between 1.5 μm to 2.5 μm (ECD median value of the histogram), with more guaranteed values present more or less often in the sites.
Insert
Figure 5 and
Figure 6 as contained in original article and sent tables and figures file here.
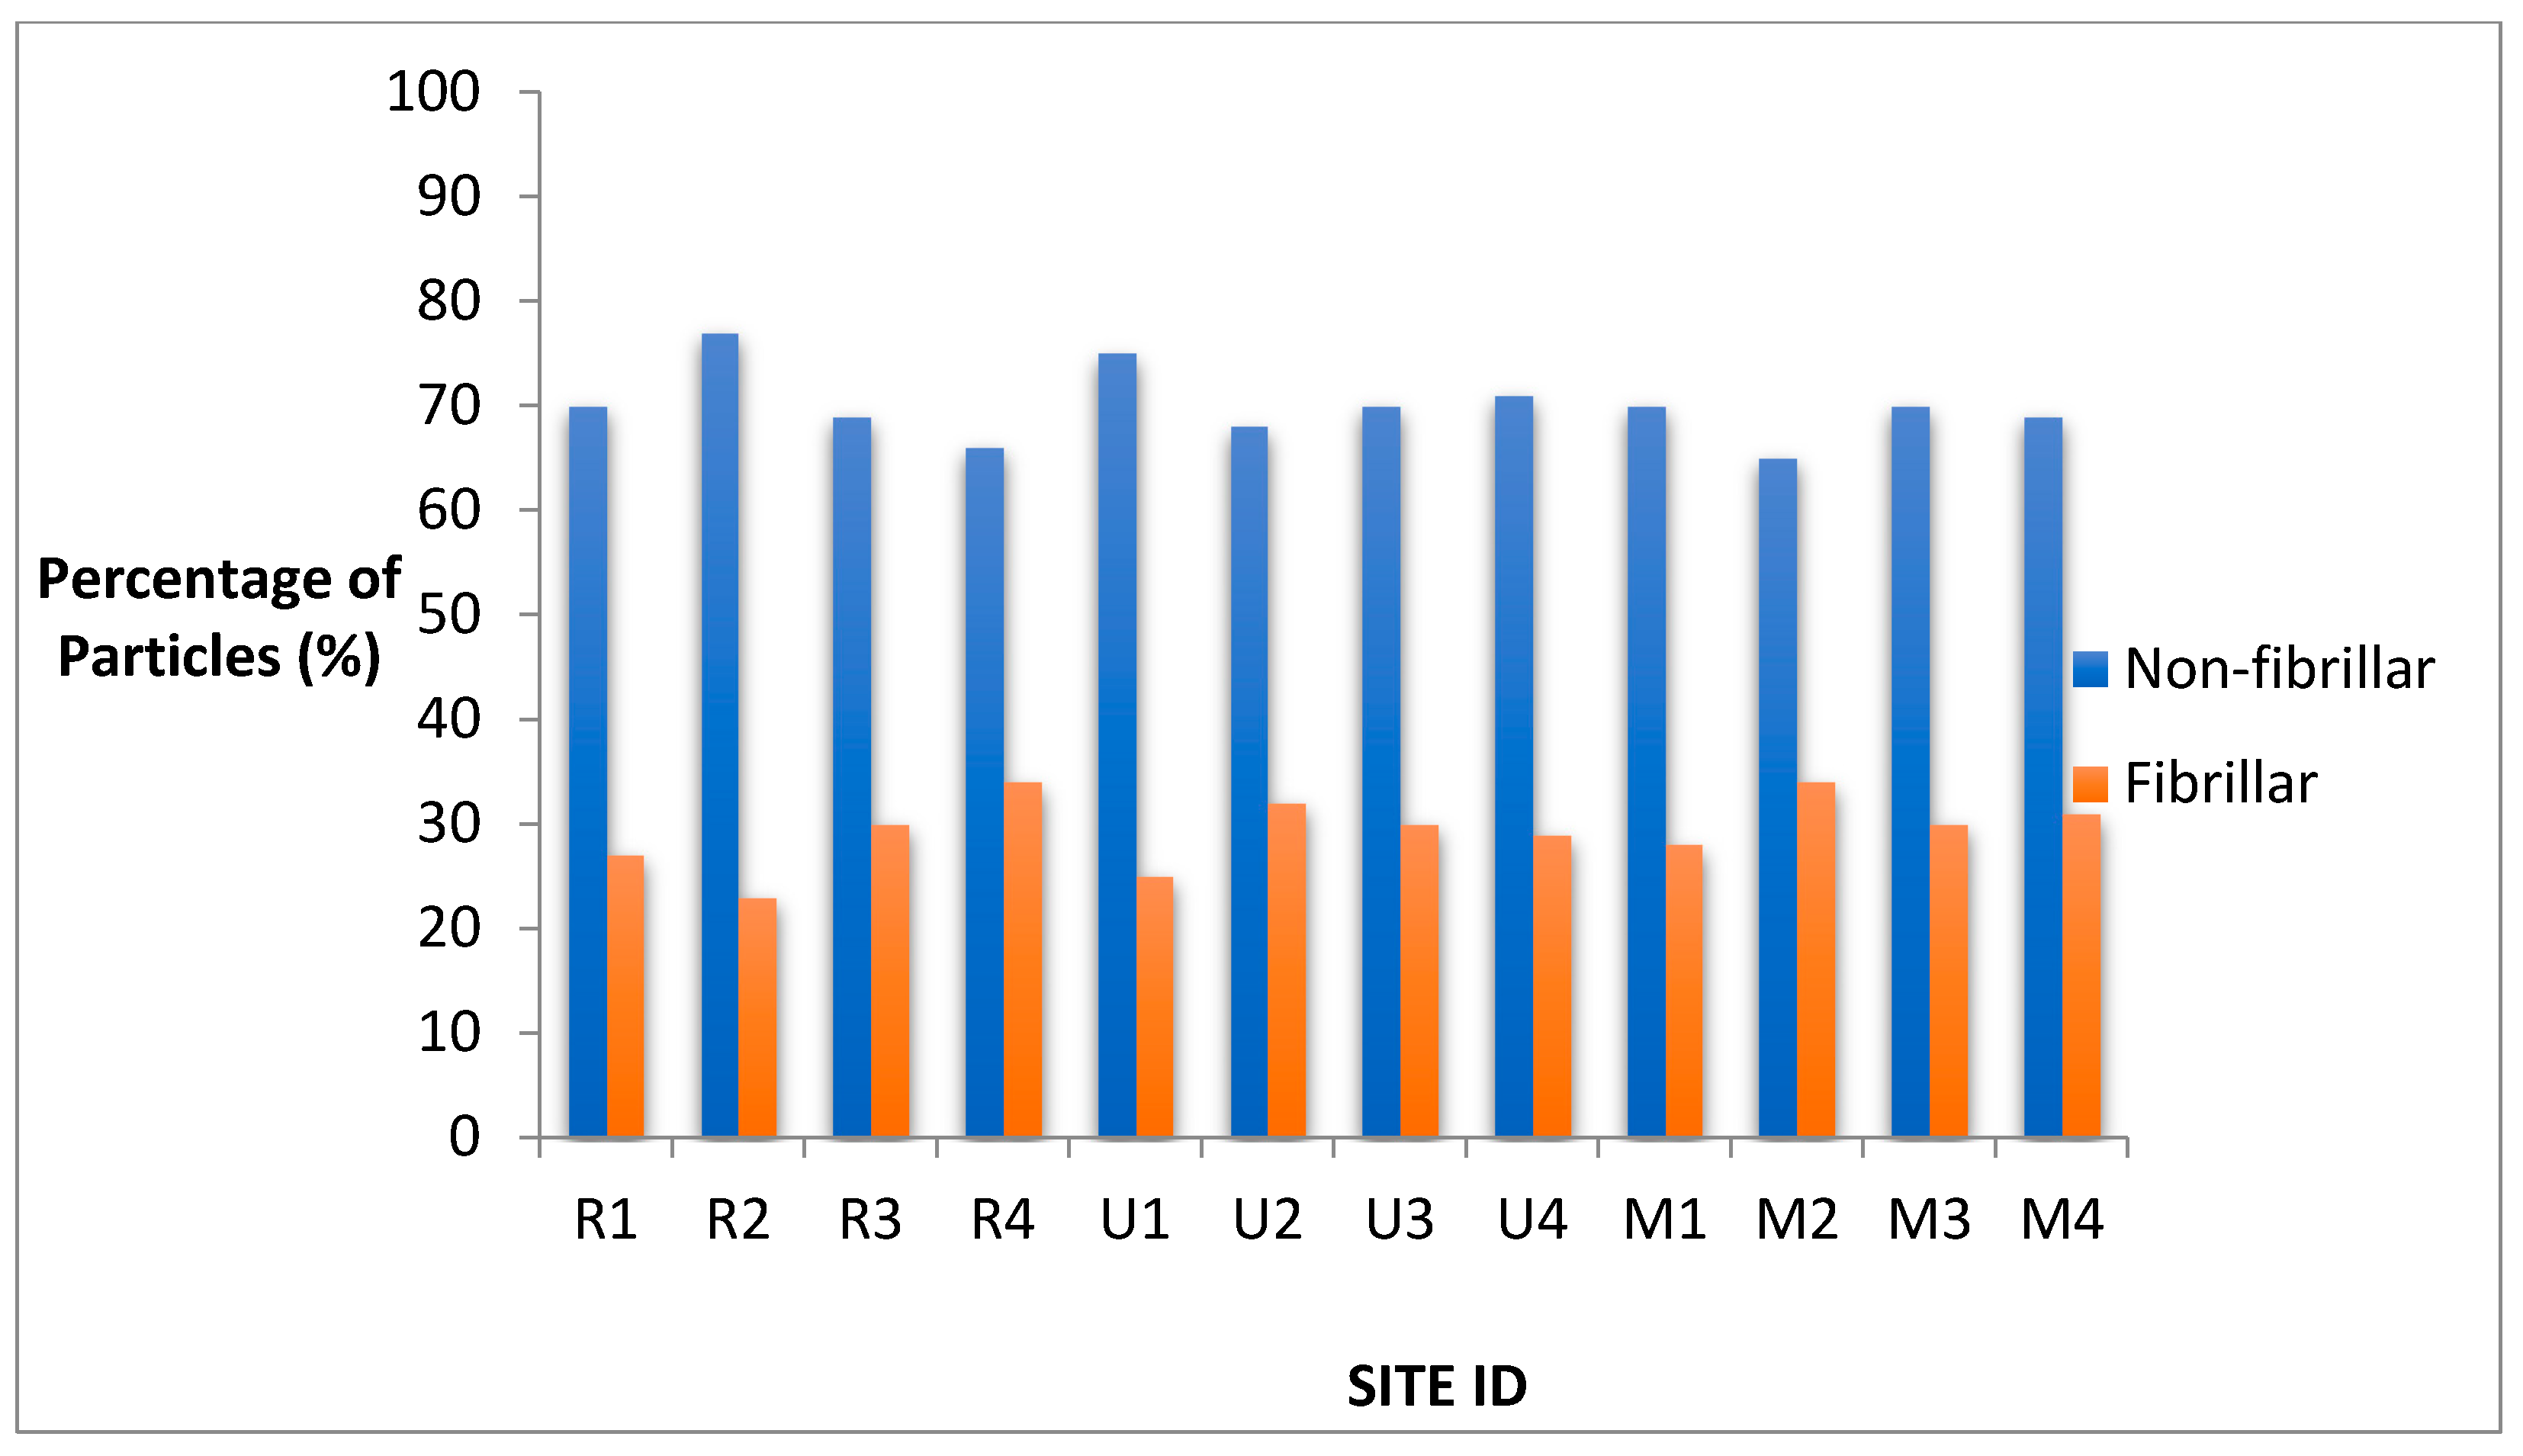
A review of the total particle structure from all sites (rural: sites R1–R4, mixed: sites M1–M4 and urban: sites U1–U4) in
Figure 7 depicts a predominance of non-fibrillar particles of up to 75%, despite the prevalence of a high number of fibrillar particles in all sites.
Figure/Table Legend
In the original publication, there was a mistake in the figure and legend for “
Figure 7”. The figure was
Figure 4 the original, but contained data errors mentioned earlier as corrected in our recalculation. The figure showing classification of particles by equivalent surface ratio (ESR) is now in its corrected form below. The correct figure and legend appears above (as
Figure 7 now).
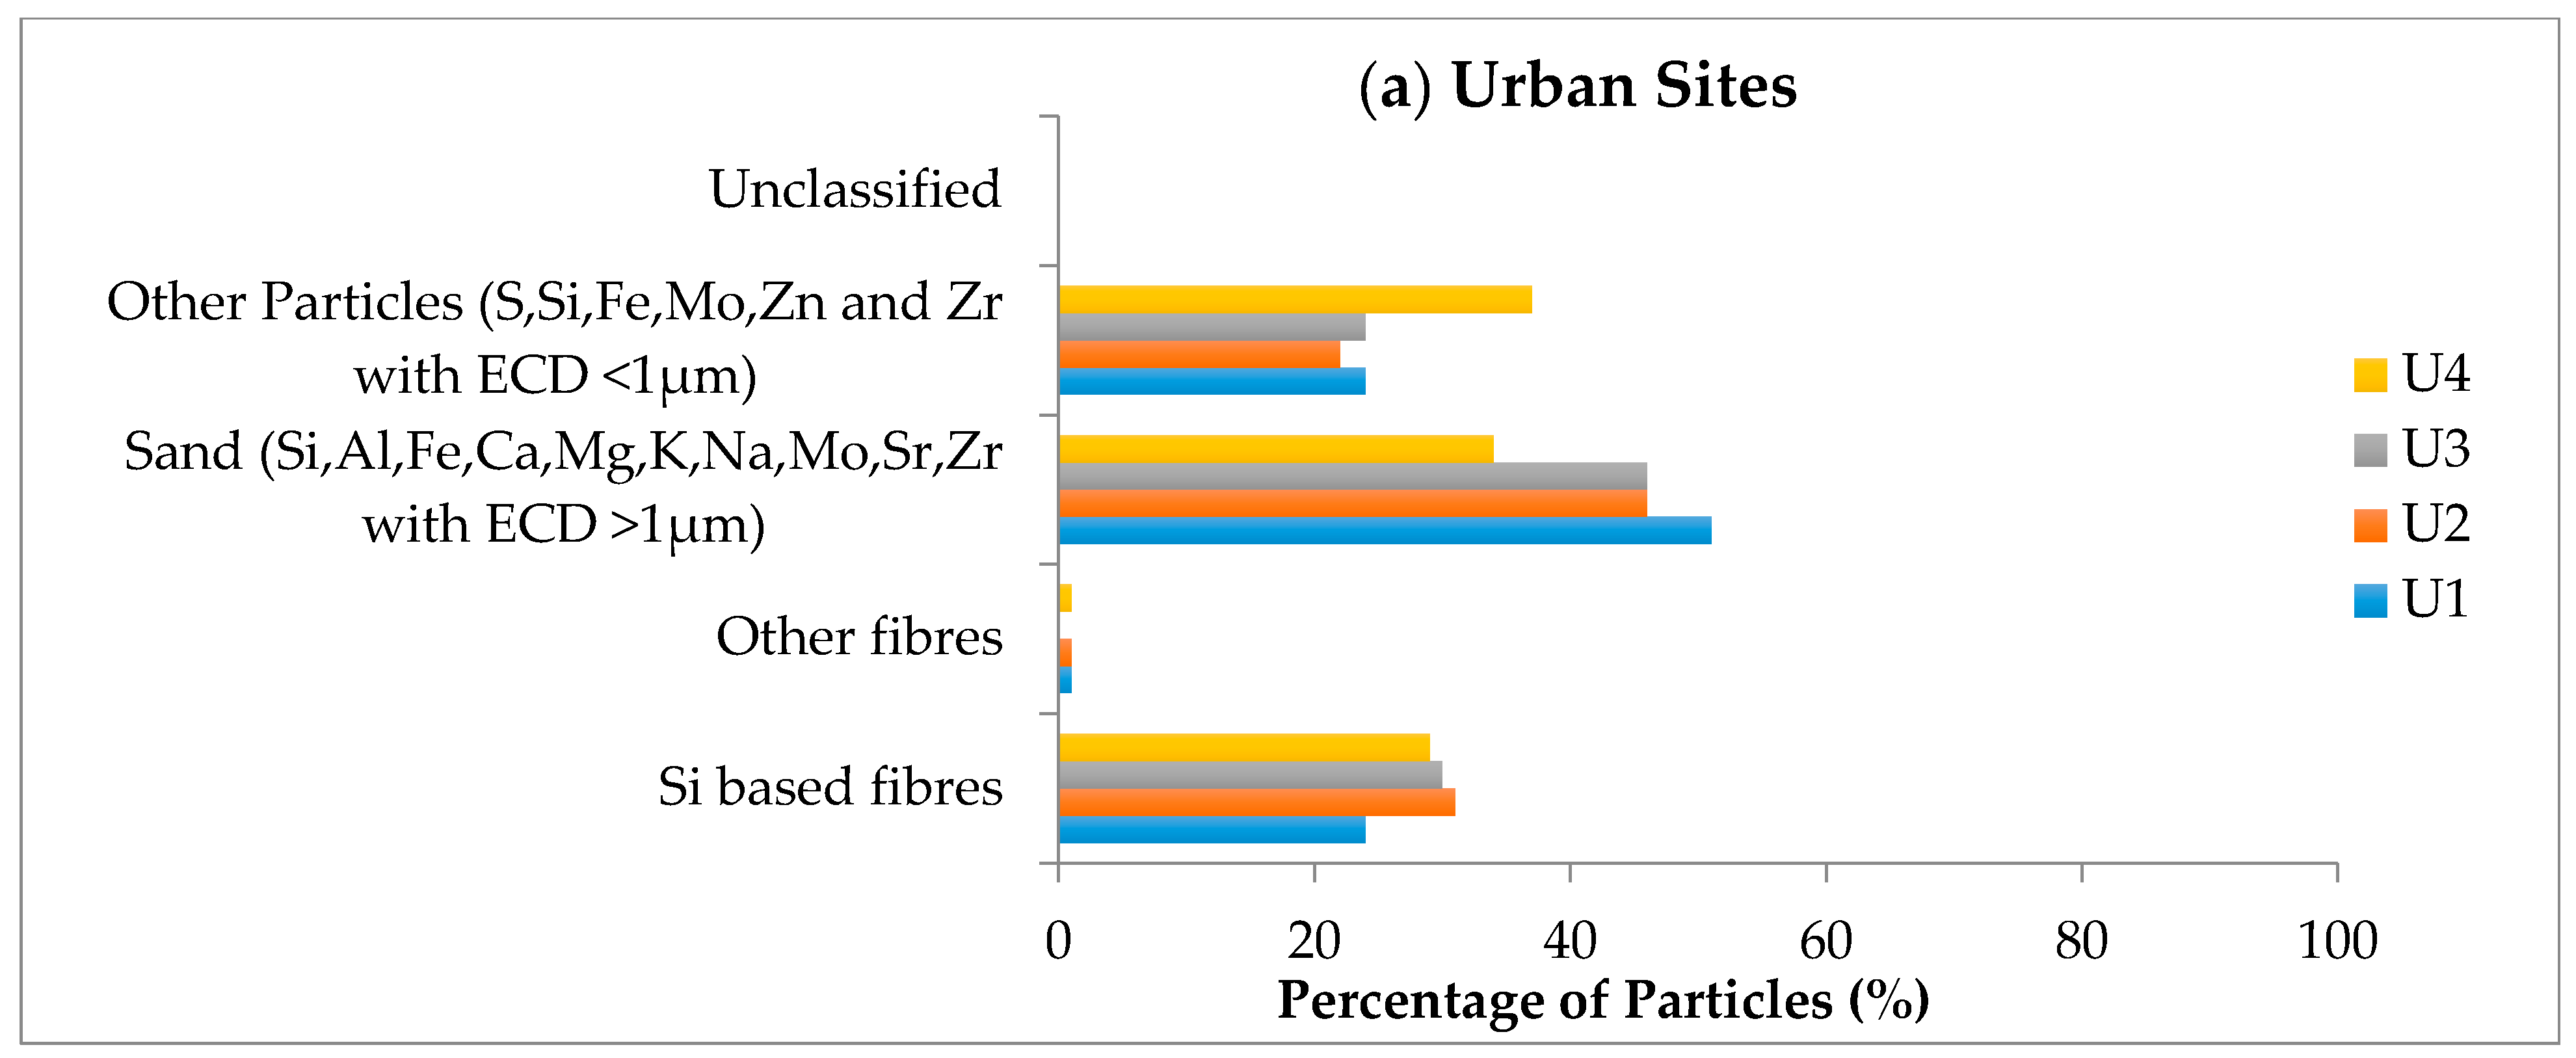
In order to more precisely classify the particles according to their chemical nature, we have grouped the particles according to their own basic chemical composition into 4 categories: silicone (Si) based fibers (particles with an ESR value greater than 3 and containing Si), other fibers (particles with an ESR value greater than 3 and without Si), sand: (particles with an ESR value smaller than 3, ECD greater than 1, and containing Si, Al, Fe, Ca, Mg, K, Na, Mo, Sr, Zr) and lastly, non-sand non-fibres. This enabled the confirmation of strata-specific differences between settlement types. The findings shown in
Figure 8 revealed higher values of non-sand non-fibres. This is why we have looked more closely at the elementary chemical composition of these particles and we have found that the majority contain sulfur, a chemical element which may be linked to the combustion of transport. This is why we have transformed this class of particles into an applied class of “other particles” (S, Si, Fe, Mo, Zn, and other metals). The values encountered for sand are largely attributable to the north-easterly Harmattan winds, characterized by dust storms that occur in the region during the dry season.
High percentages of sand particles were recorded in all sites sampled near roads, in both high and low traffic density locations (see
Figure 8a). In the urban sites, the bulk of the identified particles have values ranging from 34 to 51%. Mixed sites showed values of 30–41% and rural settlements 41–51%.
Differing values for this category are attributable to vegetation cover, building heights, and wind speed, which affect particle dispersion over land areas. The major identified source of this particle group is the dust-laden Harmattan winds, which characterize the dry season in Northern Nigeria. Re-suspension of road dust has also been linked to calcium (Ca) levels at roadsides. Additionally, elements in this group have been identified in tyre pavement generated particles and non-exhaust emissions. Non-exhaust emissions originate from abrasion and re-suspension sources. Re-suspension includes corrosion of vehicle components, mechanical processes of driving, brake and tyre wear, and re-suspension of road dust from road wear [62].
Silicone-based fibers: In samples analyzed by SEM-EDX at all sites 23–34 percent of fibrillar particles with a silicone base were identified. Although silicone parti-cles are usually non-fibrillar, our results indicate the possibility of meteorological conditions prevalent in the study area, including high temperatures and low humidity, resulting in the formation of such secondary particles. An additional source of these particles is industrial emissions. A cement factory, a bottling plant, a plastics factory, and a wood processing plant were located in the mixed settlement. The distance between these industries was greater than 100 m from the air sampling sites. In the urban site, values ranged from 25–34%, in the mixed site, 23–34%, and in the rural site, 24–31%.
Other fiber particles: Iron (Fe), sulfur (S), molybdenum (Mo) and zinc (Zn) very low percentage (0–3%) in all sites. Fibres grouped here have been linked globally to transportation origins in source apportionment studies.
Non-sand and non-fiber particles: these particles contain S, Si, Fe, Mo, Zn, and Zr with an ECD of <1 µm. Heavy minerals like zircon have been identified as sources of aerosolized zirconium particles [63], but these particles have an ECD greater than 1µm and we have counted them in the sand particle category. High levels are recorded in areas associated with open quarry activities and ongoing construction, which characterize the urban landscape of metropolitan areas in Kano State. The brake parts of old and expended vehicles commonly used for public transportation [57] also release zirconia powder, which is used to modify the friction coefficient and reduce brake pad wear [64]. Particles from road transportation vehicles, exhaust and non-exhaust, are also contained in this category. Values obtained ranged from 22–37% in urban areas, 29–40% in mixed areas, and 22–29% in rural areas.
Error in Figure/Table
In the original publication, there was a mistake in “
Figure 8 which showed SEM-EDX imaging” as published. “The figure has been moved due to the recalculated data correction within the article”. The corrected “
Figure 8” appears below. It now shows the classified particles as divided into groups.
Reference
Added reference no (61) contained within the updated text above is shown below:
61. Marmureanu, L.; Marin, C.; Andrei, S.; Antonescu, B.; Ene, D.; Boldeanu, M.; Vasilescu, J.; Vitelaru, C.; Cadar, O.; Levei, E-A. Orange Snow—A Saharan Dust Intrusion over Romania During Winter Conditions Remote Sens.
2019,
11, 2466.
https://doi.org/10.3390/atmos13010080.
The authors apologize for any inconvenience caused and state that the scientific conclusions are unaffected. The original publication has also been updated.


 ,
, 