Abstract
As a prime circulation system, the western Pacific subtropical high (WPSH) significantly impacts tropical cyclone (TC) activities over the western North Pacific (WNP), especially TCs landing on the east coast of China; however, the associated mechanism is not firmly established. This study investigates the underlying dynamic impact of the first two empirical orthogonal function (EOF) modes of the WPSH on the interannual variability in the genesis and number of TCs landing over the WNP. The results show that these two dominant modes control the WNP TC activity over different subregions via different environmental factors. The first mode (EOF1) affects the TC genesis number over region I (105°–128° E, 5°–30° N) (r = −0.49) and region II (130°–175° E, 17°–30° N) (r = −0.5) and controls the TCs landing on the east coast of China, while the second mode (EOF2) affects the TC genesis number over region III (128°–175° E, 5°–17° N) (r = −0.69). The EOF1 mode, a southwest-northeast-oriented enhanced pattern, causes the WPSH to expand (retreat) along the southwest-northeast direction, which makes both mid-low-level relative humidity and low-level vorticity unfavorable (favorable) for TC genesis in region I and region II and steers fewer (more) TC tracks to land on the coast of China. The EOF2 mode features a strengthened WPSH over the southeast quarter of the WNP region. The active (inactive) phases of this mode control the low-level vorticity and vertical wind shear in region III, which lead to less (more) TC genesis over this region. The prediction equations combining the two modes of the WPSH for the total number of TCs and TCs that make landfall show high correlation coefficients. Our findings verify the high prediction skill of the WPSH on WNP TC activities, provide a new way to predict TCs that will make landfall on the east coast of China, and help to improve the future projection of WNP TC activity.
1. Introduction
Tropical cyclones (TCs), among the severest of natural disasters, cause strong winds and torrential rain damage where they arrive [1,2]. Over the western North Pacific (WNP), approximately one-third of total global TCs are generated, which has great impacts on society and the economy in the coastal regions of China. Therefore, the assessment and prediction of TCs in the WNP is particularly important.
Studies have indicated that the remote effects caused by sea surface temperature (SST) and local general circulation are the most important factors affecting TC activities [3,4,5,6]. For example, on an interannual time scale, the El Niño–Southern Oscillation (ENSO) was identified as having an important contribution to TCs in the WNP and TCs landing on the coast [3,7,8,9,10,11,12,13,14,15,16,17,18,19]. Moreover, SSTAs in the Indian Ocean can also influence TC genesis in the WNP [20,21,22,23].
From the perspective of a long time scale, global warming can cause an eastward withdrawal of westward TC tracks and a westward shift in recurved tracks [24,25]. Regarding the abrupt decrease in TC genesis over the WNP since the late 1990s, the Atlantic Multidecadal Oscillation (AMO), Pacific Decadal Oscillation (PDO), and asymmetric central Pacific ENSO are all considered to be responsible [26,27,28].
In addition to the impact of remote SST anomalies on TCs, the local general circulation can essentially modulate TC activities [29]. The WPSH has significant effects on WNP TC activities [5,14,30,31,32,33,34]. Both the position and the strength of the WPSH play key roles in the movement of TCs [25,35]. The ridge at 500 hPa over the WNP controls the typhoon tracks as the main steering flow [4,5]. The anomalous variation at 850 hPa has a significant influence on TC formation and intensity [14,29]. The large-scale descending motion and anticyclonic vorticity associated with the WPSH are the most responsible for the total TC genesis frequency over the WNP and the number of TCs landing along the East Asia coast [36]. Additionally, expansion of the WPSH also caused interdecadal changes in typhoon tracks over the tropical WNP between 1980 and 2001 and 1951 and 1979 [5,25]. The abrupt shift in typhoon count and northward shift in typhoon tracks over the western North Pacific-East Asian region and increase in typhoon count over the Taiwan-East China Sea region around 2000 are related to the eastward and northward retreat of the WPSH [37].
Xiang et al. [38] showed that the two leading modes of the WPSH have a close relationship with the total TC days over the subtropical WNP (r = −0.81). These modes can shift TC formations southeastward/northwestward (EOF1) and control the total TC genesis number (EOF2) in the WNP [14,29]. Wang and Wang [29] introduced a new statistical model to make a seasonal prediction of the genesis number and storm days of the TCs over the WNP using these two modes. According to the results, the cross-validated reforecast for genesis number and tropical storm days shows a temporal correlation coefficient over 0.5.
Previous studies focused on influences of the WPSH on the TC genesis number and storm days without resolving the location of TC genesis. In addition, the relationship between the landing TCs and the WPSH was not shown. Therefore, in this paper, we aim to investigate the TC genesis in sub-regions of WNP which is caused by the two leading modes of the WPSH. The impacts of the two leading modes on the landing TCs are investigated ate the same time. Furthermore, a statistical model is used to predict total and landing TC number and TC days.
2. Data and Method
We used the best-track data from the Regional Specialized Meteorological Center (RSMC) Tokyo-Typhoon Center (Tokyo, Japan), for the period of 1979–2020. The dataset consists of TC information, such as the location, intensity, and minimum surface pressure at 6-hourly intervals.
Several atmospheric and oceanic variables were used to examine the large-scale environmental conditions: monthly mean zonal and meridional wind components at 850 hPa and 200 hPa, 700 hPa relative humidity, and geopotential height at 850 hPa from the ERA5 Reanalysis [39] on a 1-degree latitude–longitude grid; monthly mean SST from version 3b of the Extended Reconstructed Sea Surface Temperature (ERSST V3b) [40] on a 2-degree grid. The years used in the two abovementioned reanalysis datasets are consistent with the TC data.
Consistent with the study by Xiang et al. [38], we performed an empirical orthogonal function (EOF) analysis on the 850 hPa geopotential height over the Indo-Pacific Ocean, which is the same domain they used in their study. To further confirm the relationship between the two dominant EOF modes and TC activity, we define positive and negative years separately based on the time series of PC1 and PC2, with six positive years (1979, 1980, 1983, 1987, 1998, and 2010) and six negative years (1984, 1986, 1994, 2001, 2007, and 2012), called high PC1 (PC1–H) years and low PC1 (PC1–L) years. Similarly, six positive years (1995, 2007, 2008, 2010, 2011, and 2013) and six negative years (1982, 1986, 1987, 1997, 2002, and 2004), called high PC2 (PC2–H) years and low PC2 (PC2–L) years, are defined according to PC2 (shown in Figure 1b,d).
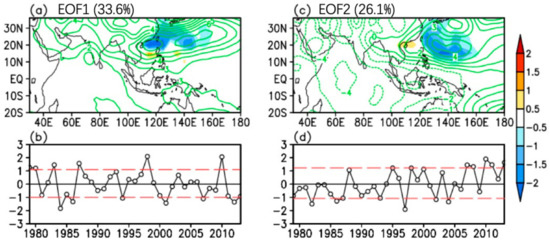
Figure 1.
(a) The regression map of 850-hPa geospatial height (contour) and storm days (shading) with reference to the PC of EOF1 mode (b) derived from the JJA 850-hPa geopotential height over the WNP basin during 1979–2014. Panels (c,d) are the same as in Panels (a,b), respectively, but for the second mode (EOF2). The red dashed line in Panels (b,d) marks six positive years (H) and six negative years (L) for both PC1 and PC2.
3. Dominant Modes of the WPSH and Associations with TC Activity
To better understand the relationship between the landing TC and the dominant modes of the WPSH, the whole picture of the regression between the storm days and leading modes is shown (Figure 1). In order to set aside some data to do independent cross-validation, the EOF modes are obtained from the data during 1979–2014. The results show that EOF1 of the WPSH contributes 33.6% to the total variance and exhibits a positive anomaly over the entire Indo-Pacific warm pool region with the maximum center north of 20°N, while EOF2 contributes 26.1% to the total variance and exhibits a dipole pattern between the Indian Ocean and the Pacific Ocean. The results show that EOF1 of the WPSH exhibits a positive anomaly over the entire Indo-Pacific warm pool region with the maximum center north of 20°N, while EOF2 exhibits a dipole pattern between the Indian Ocean and the Pacific Ocean. The storm days significantly influenced by EOF1 (PC1) are located along the east coast of China, from the South China Sea (SCS) to south Japan, and exhibit a uniform negative regression (Figure 1a). The regressions for PC2 show a dipole pattern, and the storm days over the SCS and over the region from east of the Philippine Sea to Japan show the opposite variation (Figure 1c).
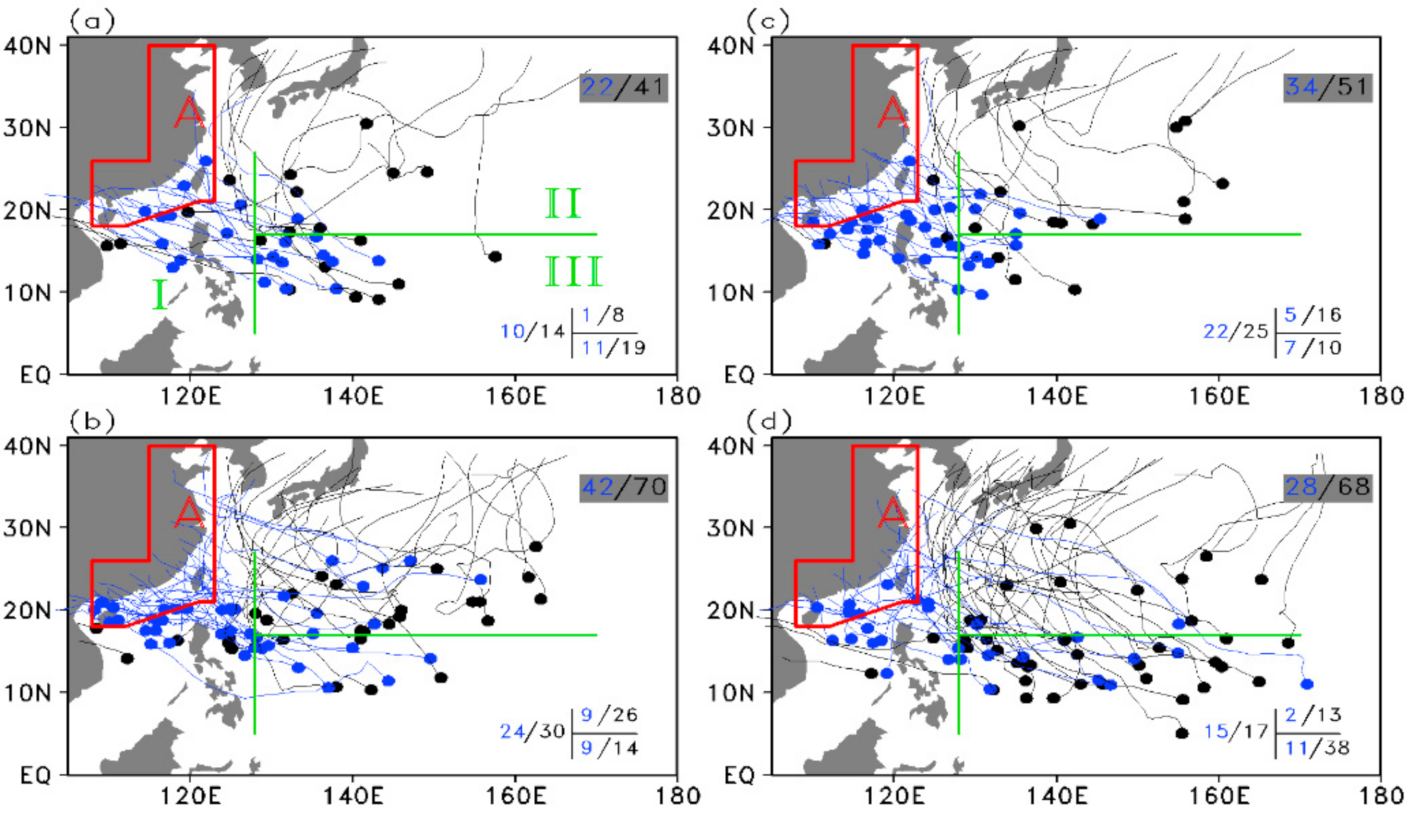
To further confirm the relationship between the two dominant EOF modes and TC activity, we compared the composite of TC genesis for the above one standard deviation of the normalized PCs (shown in Figure 2; the selected years are listed in Section 2) and calculated their correlation coefficients (Table 1). The results show that the two EOF modes imply significantly different spatial distributions of TC genesis. For visual comparison, we refer to the area west of 130° E as region I, the area east of 130° E and north of 17° N as region II, the area east of 130° E and south of 17° N as region III, and the red boxes represent the east coast of China (hereafter region A). Here, we also count the total number of TCs over the whole WNP region and these three subregions for the selected years, which are listed on the right-top and right-bottom, respectively. The blue numbers indicate the number of TCs that reached the east coast of China.
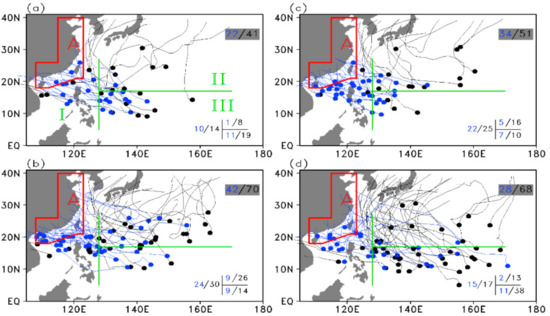
Figure 2.
The genesis locations (dots) and tracks (curves) of TCs during (a) PC1–H, (b) PC1–L, (c) PC2–H, and (d) PC2–L over the WNP basin. Two green lines divide the whole WNP basin into three subregions (regions I, II, III), and the red box marks the east coast of China. The number on the top-right indicates the total TC number (black is the TC genesis number over the WNP basin, blue is the landing TCs that reached region A), and the numbers on the bottom-right indicate the TC number in these three subregions. See text for detailed information about the three subregions.

Table 1.
Correlation coefficients of the TC number (including TC genesis number over the whole WNP basin and three individual subregions and landing TCs) with the first two leading modes of the WPSH based on the 1979–2014 period.
For EOF1, there were more TCs over the WNP region during the negative phase of EOF1 (hereafter PC1–L). Specifically, more TCs are found over region I and region II during the PC1–L events, and the numbers are 30 and 26, respectively, which is twice or three times the number of TCs occurring during the PC1–H events. We calculated the temporal correlation coefficients between the two EOF PCs and the TC genesis number in the whole WNP and in the three sub-regions, and also calculated the temporal correlation coefficients between the two EOF PCs and the Landing TC number (Table 1). The correlation coefficients of the TC genesis number in the three subregions with PC1 are −0.49, −0.50 and 0.18, and they are significant at the 95% confidence level over regions I and II. Therefore, EOF1 mainly affects TC genesis in region I and region II. Furthermore, we counted 42 TCs over region A during the PC1–L events and 22 TCs during the PC1–H events, which suggested that more landing TCs reached the east coast of China during the PC1–L events. Here, a landing rate is defined, and it is the percentage between the landing TC number and the genesis number over each region. For EOF1, the landing rate over the WNP increases from 53% (PC1–H events) to 60% (PC1–L events). The landing rate in region I increases from 71% (PC1–H events) to 80% (PC1–L events), and in region II, it increases from 12.5% (PC1–H events) to 34.6% (PC1–L events). Over region III, the landing rate changed from 57.9% (PC1–H events) to 64.3% (PC1–L events). Therefore, EOF1 has significant control of the landing TC in the WNP with a correlation coefficient of −0.54. Each of the three subregions plays an important role in the whole subregion.
For EOF2, more TCs are found during the negative phase of EOF2, similar to EOF1. The total TC number is approximately 68 during the PC2–L events, while that during the PC2–H events is only 51 TCs. However, unlike EOF1, a significant difference between the PC2–L and PC2–H years appears in region III. The TC number generated in region III decreases from 38 during the PC2–L events to 10 during the PC2–H events. In turn, PC2 shows a strong negative correlation with the TC genesis number in region III (r = −0.69). It is clear that EOF2 mainly influences TC genesis in region III. Additionally, we counted the landing TCs over region A. Between the PC2–H and PC2–L events, the change in the landing TC was not significant; from 34 to 28, the landing rate ranged from 41 to 66.7%. The correlation coefficient between the landing TC number over region A and PC2 is only 0.10 and not significant.
Collectively, the two dominant modes of the WPSH show negative correlations with the TC genesis number over the WNP basin, and only the EOF1 mode can influence the landing TCs reaching the east coast of China. Different enhanced modes of the WPSH cause different spatial patterns of TC genesis. Specifically, EOF1 features an intense southwest-northeast oriented WPSH, which strongly influences the TC genesis numbers in region I and region II, and EOF2 is characterized by a strong north-southeast WPSH, which will affect the TC genesis number in region III.
4. Thermodynamic and Dynamic Factors Associated with the Two Leading Modes of WPSH Affect TC Genesis
TC genesis is substantially affected by thermodynamic and dynamic factors, so the genesis potential index (GPI) [41] was used to examine how various environmental factors contribute to the WPSH variation influence on the TC genesis number. The GPI is defined as the following function:
where VOR is the absolute vorticity at 850 hPa, RH is the relative humidity at 700 hPa, PI is the potential intensity of TC, and VWS is the vertical wind shear between 850 hPa and 200 hPa.
Here, we investigate the GPI to diagnose the impact of two dominant modes of the WPSH on the WNP TC activities, especially the landing TCs. Figure 3 shows the differences in GPI between the positive and negative phases of the principal component of the two leading WPSH modes (PC1 for Figure 3a and PC2 for Figure 3b). For both modes, the GPI shows negative values over most of the WNP basin, confirming more TCs during the negative phases of EOF1 and EOF2 discussed above. For EOF1, negative GPI values are found in region I and region II, while for EOF2, a negative GPI is evident over most of region III.

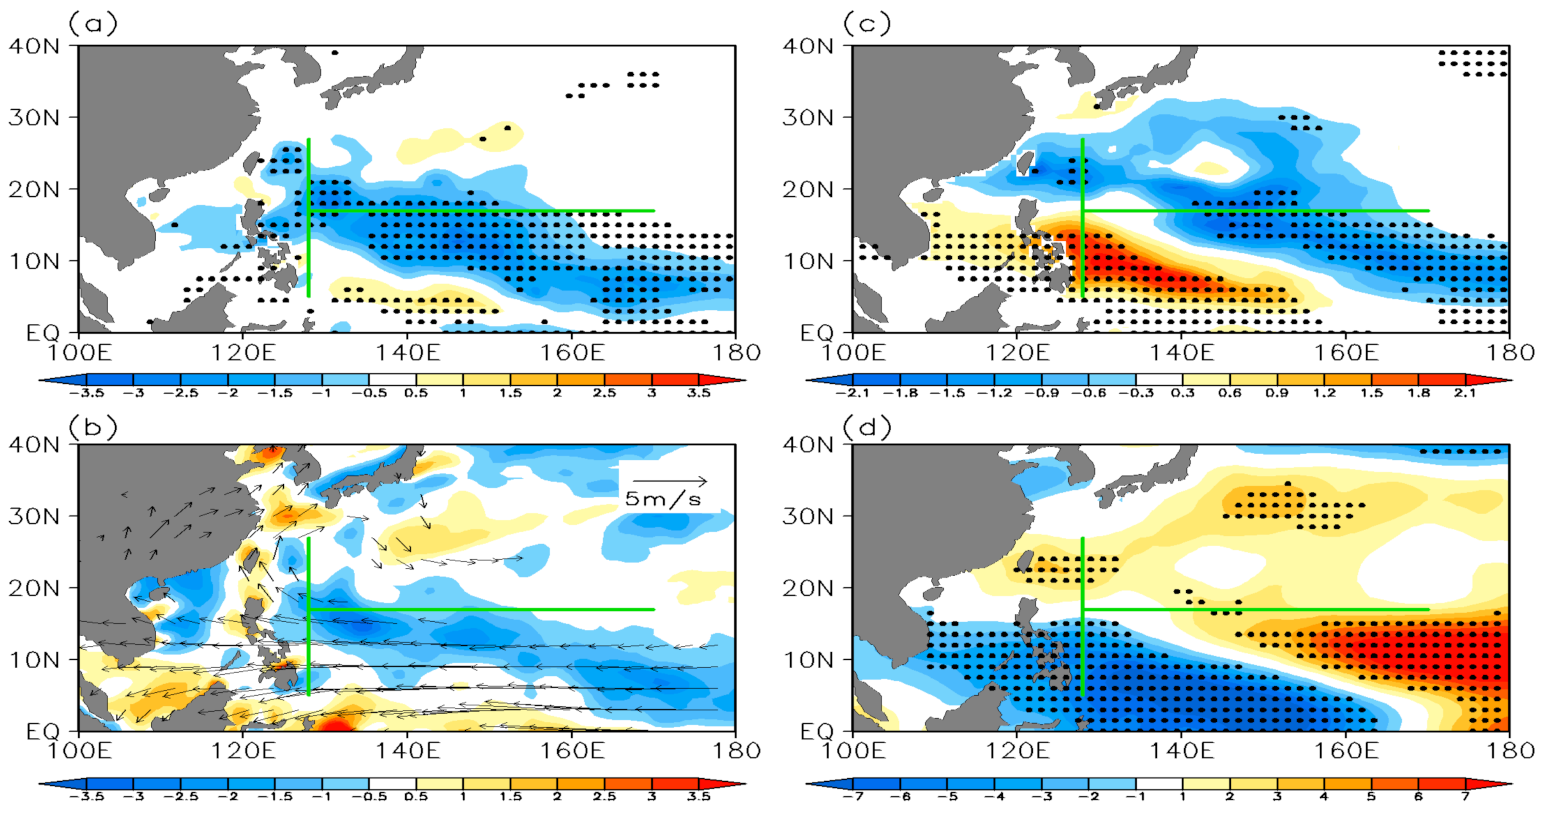
Figure 3.
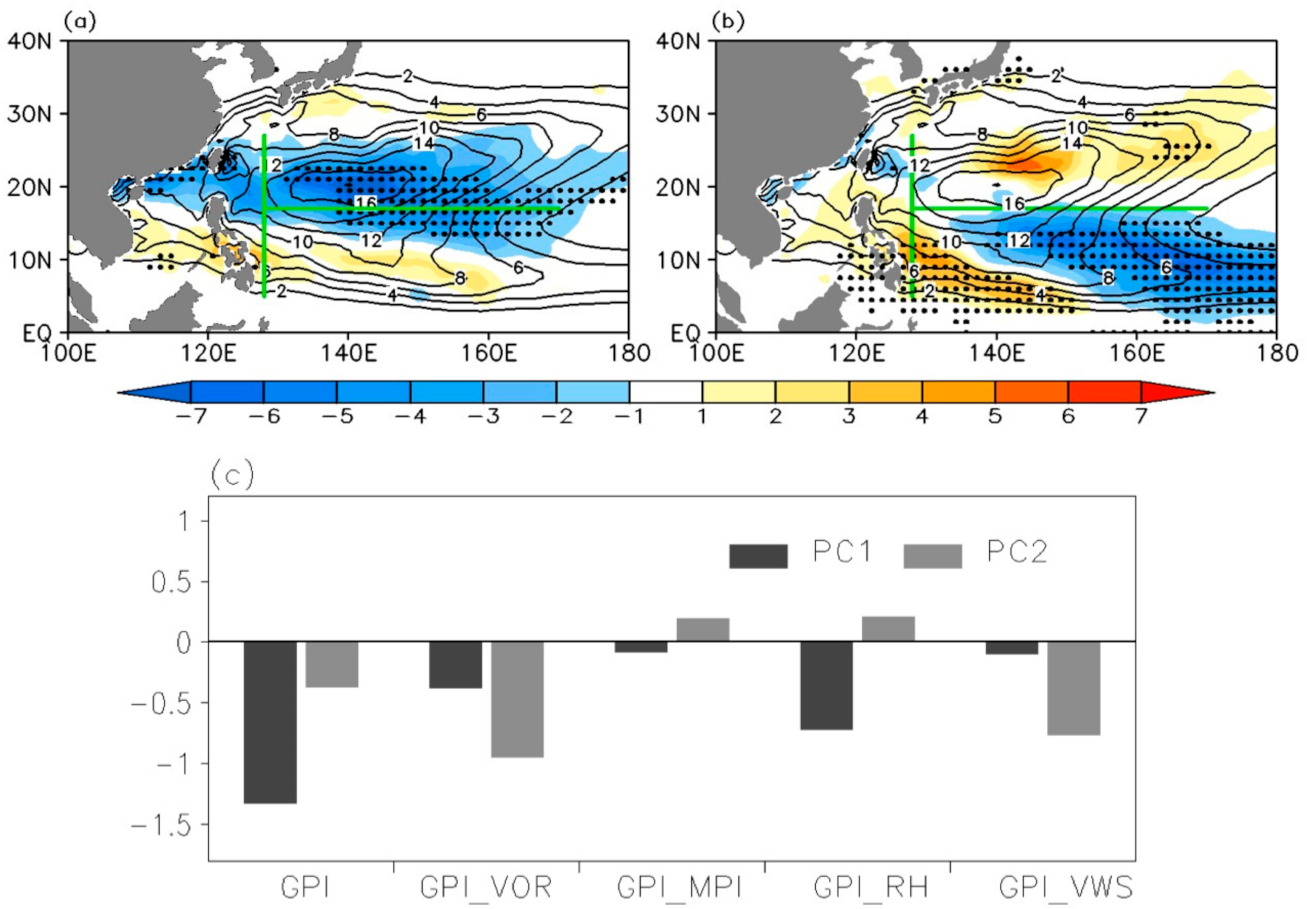
The difference in the GPI between the positive and negative phases of (a) PC1 and (b) PC2 (shading). The black contour is the long-term mean (1979–2020) of GPI in JJA. The dots mark regions where the differences are significant at the 95% confidence level. (c) Changes in the total GPI and each constituent term (i.e., low-level vorticity (VOR), maximum potential intensity (MPI), relative humidity (RH), and vertical wind shear (VWS)) between the positive and negative phases of PC1 and PC2.
Furthermore, the contribution of each constituent term to the entire GPI change is computed (Figure 3c). To compare the importance of the four variables that are used in the GPI calculation, we calculated GPI using the climatology of three of the variables and original value of the fourth variable. This process was repeated for all variables. Among all dynamic and thermodynamic effects, VOR and RH change the dominant contributions to the GPI in EOF1. For EOF2, VOR and VWS are the two dominant contributors. MPI appears to be less important in both modes of the WPSH, which is consistent with Chan [42], suggesting that the local SST is less important to TC genesis than atmospheric conditions in the WNP.
Figure 4 shows the composite maps of the GPI differences during the PC1–H and PC1–L events based on the main contributors discussed above, the 850 hPa winds, and the 700 hPa vertical velocity. The significant negative GPI difference due to VOR is shown over region I and region II and that due to the 700 hPa RH is over most of region II, which resembles the composite map of GPI based on EOF1 (Figure 3a). An anomalous anticyclonic wind pattern accompanied by negative vorticity appears over the WNP basin (Figure 4b), which will in turn reduce the GPI by VOR. In addition, anticyclonic circulation induces subduction motion. Then, this subduction air motion will further dry the air and reduce the RH (Figure 4d). Collectively, the anomalous anticyclonic circulation reduces the low-level vorticity and humidity of the air, which will in turn reduce the GPI by VOR (Figure 4a) and RH (Figure 4c).
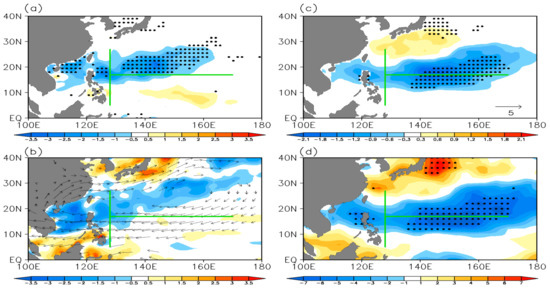
Figure 4.
The difference in (a) GPI changes induced by VOR, (b) 850 hPa relative vorticity (shading) and wind fields (vectors), (c) GPI changes induced by RH, and (d) the RH at 700 hPa between the positive and negative phases of PC1. The dots mark regions where the differences are significant at the 95% confidence level. For the changes in wind fields at 850 hPa in (b), only areas where the differences are statistically significant at the 95% confidence level are shown.
For EOF2, Figure 5 shows the composite maps of the GPI based on the main contributors (VOR and VWS), the 850 hPa winds, and the vertical wind shear for EOF2. Consistent with the composite map of GPI based on EOF2 (Figure 3b), the GPI due to VOR and VWS shows large negative values over most of region III. There is an obvious band of easterly winds throughout the tropical region, which will in turn induce negative vorticity and strong vertical wind shear and then reduce the GPI by VOR and VWS. This result is consistent with previous studies, which indicated that El Niño enhanced the TC frequency in the southeastern portion of the WNP and reduced the TC frequency in the northwestern portion [3,4].
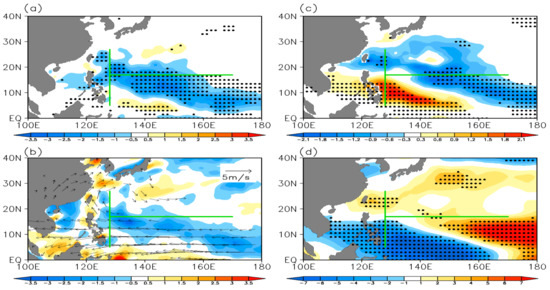
Figure 5.
The difference in (a) GPI changes induced by VOR, (b) 850 hPa relative vorticity (shading) and wind fields (vectors), (c) GPI changes induced by VWS, and (d) the vertical wind shear between the positive and negative phases of PC2. The dots mark regions where the differences are significant at the 95% confidence level. For the changes in the wind fields at 850 hPa in (b), only areas where the differences are statistically significant at the 95% confidence level are shown.
5. The Steering Flows Associated with the Two Leading Modes of the WPSH Affect Landing TCs
The first mode (EOF1) shows a stronger correlation (r = −0.54) with the landing TCs reaching the east coast of China, which implies a stronger WPSH accompanied by fewer TCs making landfall. Even though the second mode (EOF2) shows a lower correlation (r = 0.10, see Table 1) with the landing TCs reaching the east coast of China, it has a large landing rate (66.7%) for the landing TCs compared with the total TCs during the PC2–H events. TC tracks are essentially controlled by large-scale atmospheric circulation patterns [3,7,8,43]. Here, we examined the climatological mean steering flow to discuss the impact of the WPSH on the landing TCs. The large-scale steering flow is defined in this study as the pressure-weighted mean flow from 800 to 300 hPa [44]. Figure 6a,b shows the composite map of the mean steering flow and the climatological mean geopotential height at 850 hPa for EOF1 and EOF2, respectively. The red solid lines denote the mean state of the WPSH for the PC1(2)–H events, and the blue solid lines denote the mean state of the WPSH for the PC1(2)–L events. The dashed line indicates the ridge line of the WPSH. The vectors show differences in the mean flows between the positive phase and the negative phase of the WPSH.
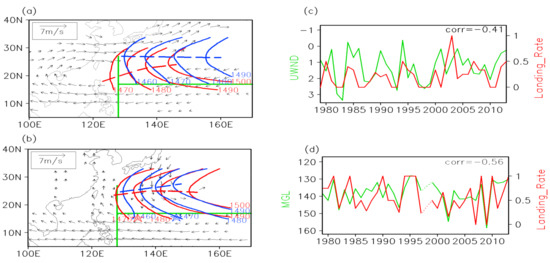
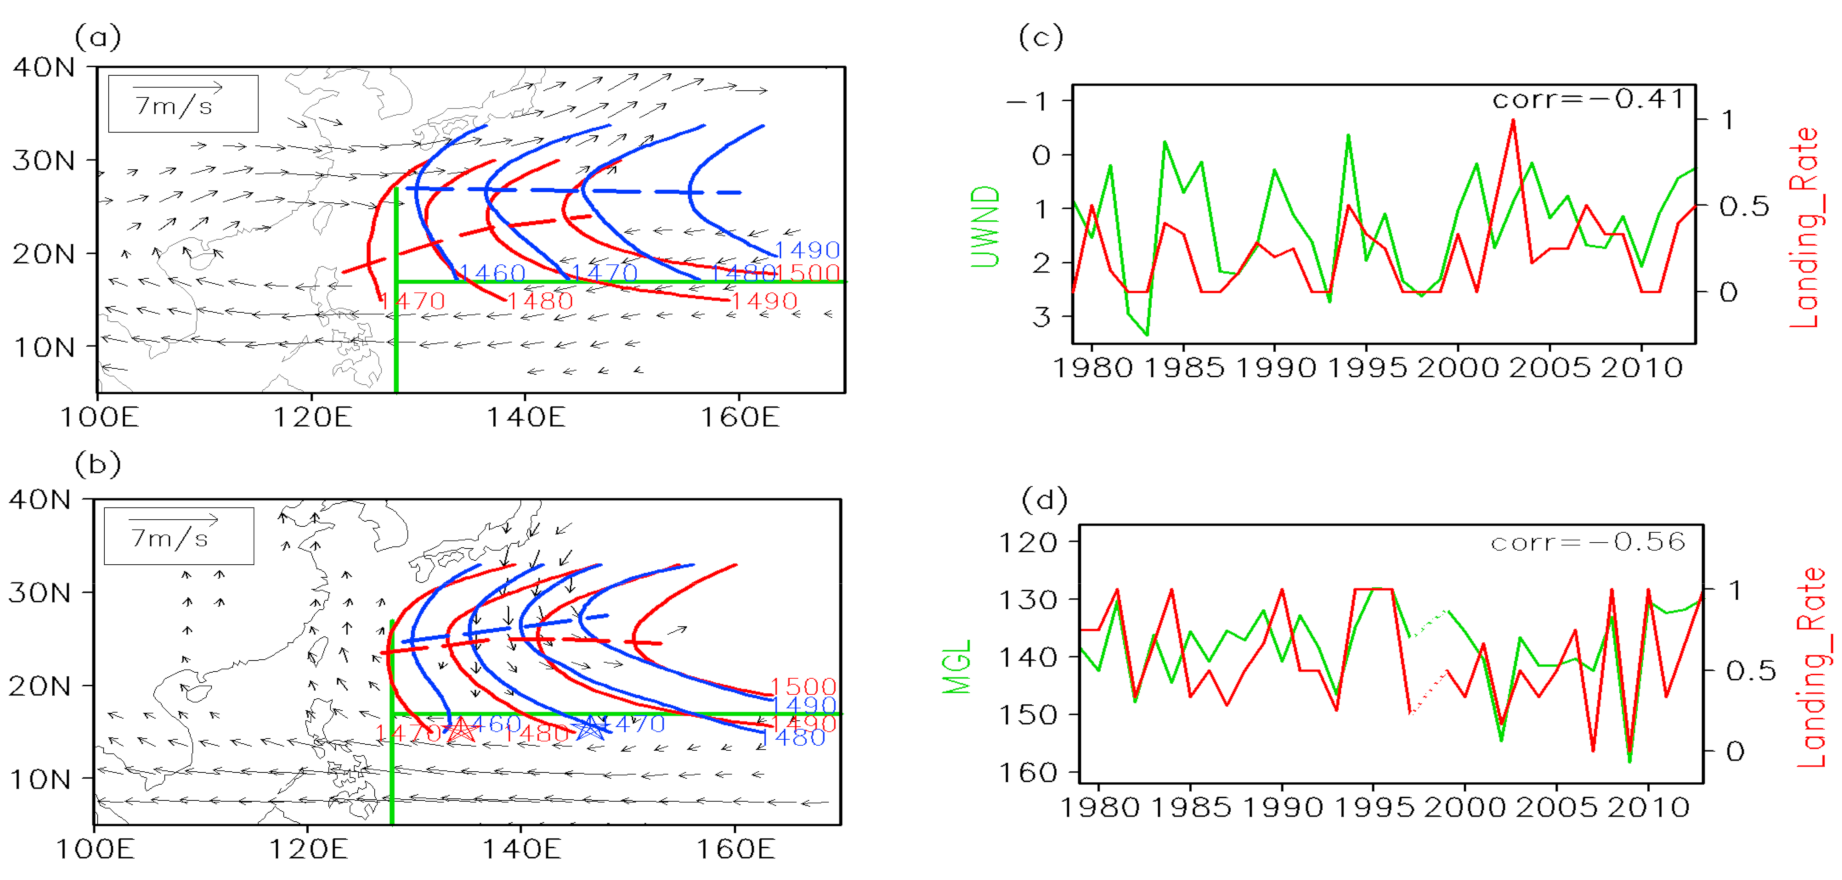
Figure 6.
Maps of the differences in mean steering flows (vectors) between the positive and negative phases of PC1 (a) and PC2 (b), superposed with the climatological mean geopotential height at 850 hPa (contour) for the positive phase (red) and negative phase (blue). The dashed line indicates the ridge line of the subtropical high. The filled star in (b) represents the mean genesis location (red for positive and blue for negative). (c) The time series of area-averaged 850-hPa zonal wind (UWND; 20–30° N, 120–140° E) and TC landing rate in region II. (d) Time series of TC landing rate and mean TC genesis longitude in region III. The Landing_Rate in (c,d) are defined as landing TC numbers divided by total TC numbers.
For EOF1, the ridge line for the positive phase shifts to the south compared with the ridge line for the negative phase, corresponding to anomalous westerly winds crossing the east coast of China, which will lead to suppression of the TCs landing along coastal China and the landing rate’s being reduced. However, for EOF2, there are no significant differences in ridge lines between the positive and negative phases of the second mode of the WPSH, as well as the mean flow changes over the east coast of China. The obvious change in the TC landing rate between the PC2–H and PC2–L events may be related to the change in the mean location of TC genesis in region III. The star indicates the mean location of TC genesis, the red star is for the positive phase, and the blue star is for the negative phase. It is clear that the mean location of TC genesis for the positive phase is far westward compared with the mean location of TC genesis for the negative phase. Thus, the steering flow will favor the TC’s reaching coastal China, so the landing rate tends to increase.
Next, the relationship between the landing rate of TCs reaching the east coast of China and the westerly winds or mean genesis location is discussed. Figure 6c,d shows the time series of the area-averaged westerly wind over the region (20–30° N, 120–140° E) and the mean genesis longitude of TCs in region III, accompanied by the landing rate of TCs for each mode of the WPSH. Correlation coefficients between each pair of time series are also computed. It is clear that the landing rate of TC reached the east coast of China because EOF1 shows a significant negative correlation (r = −0.41) with the westerly winds, which verifies that the westerly winds suppress the TCs reaching the east coast of China discussed above. The landing rate for EOF2 exhibits a strong negative correlation (r = −0.56) with the mean genesis longitude of TCs in region III, implying a more westward shift in the mean genesis location with a higher landing rate of TCs reaching the east coast of China, which is consistent with the composite map (Figure 6b) discussed above. However, what causes the enhanced westerly steering flows to cross the east coast of China (Figure 6a) is an important issue that deserves further investigation.
6. Reproduction and Forecasting of Landing TCs by the Two Leading WPSH Modes
Seasonal forecasting and interannual predictions of TCs are very important for the coastal region of East Asia. Wang and Wang [29], using physically meaningful predictors corresponding to the two leading modes of the WPSH, created a seasonal forecast of the TC genesis number over the WNP. The PCs of WPSH can also predict the TC landing number and landing days.
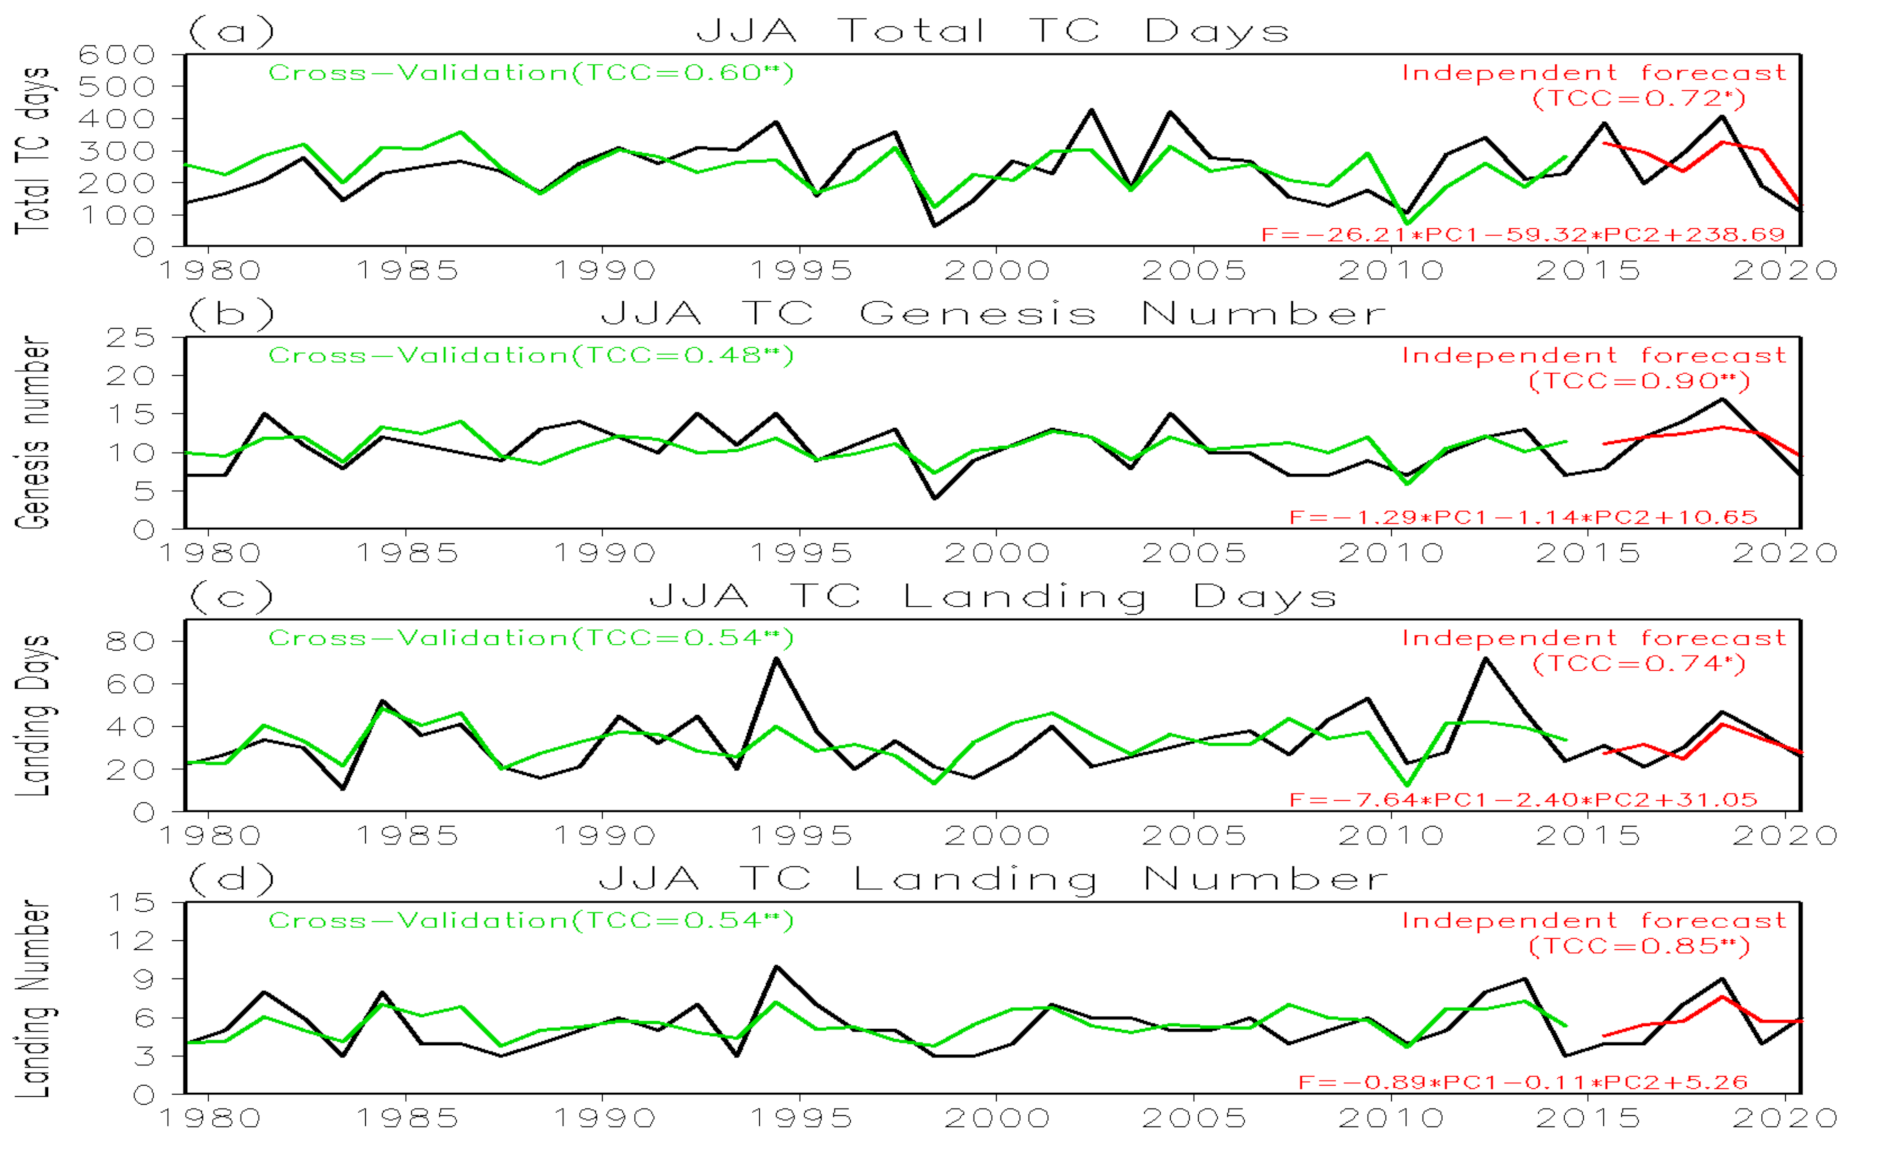
A leave-three-out cross-validated reforecast is performed by taking 3 years out around the predicted year for 1979–2014. The temporal correlation coefficient between cross-validated reforecast and the observed total TC days, TC genesis number, TC landing days, and TC landing number are 0.60, 0.48, 0.54, and 0.54, respectively (Figure 7). All of them achieve a coefficient level at 99%. To confirm the stability of their relationship, we used the data from the years 1979–2014 as training data and derived equations through linear regression to do independent forecast for the years 2015–2020. As shown in Figure 7, the independent forecast for the total TC days and landing TC days shows correlation coefficients of 0.72 and 0.74, respectively, which are significant at the 95% confidence level. The independent forecast for the total TC genesis number and landing TC number shows correlation coefficients of 0.90 and 0.85, respectively, which are significant at the 99% confidence level. In addition, the PC1 is more important than PC2 in the forecast of the landing TC days and the landing TC number, which is consistent with the previous conclusion in Section 3.
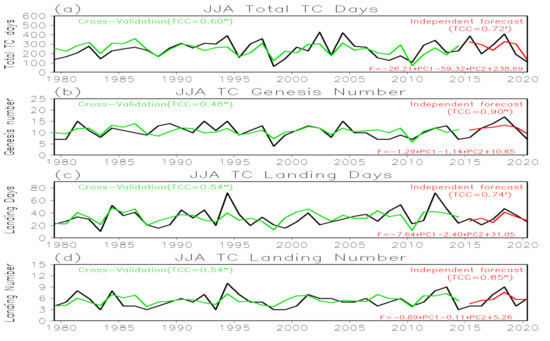
Figure 7.
(a) The total TC days and (b) the total TC genesis number over the WNP and the TC days (c) and TC number (d) landing on the coast of China. Black lines are observations based on best-track data from the Tokyo-Typhoon Center. The green lines are cross-validated reforecast. The red lines are the independent forecasts for the period of 2016–2020. The time correlation confidence with * (**) are significant at the 95% (99%) level.
7. Summary and Discussion
In this paper, we compared the influence of the two leading modes of the WPSH on the spatial pattern of the WNP TC activities using the best-track data from the RSMC Tokyo-Typhoon Center for the period of 1979–2020, with a particular focus on the TCs landing on the Chinese coast. Consistent with Wang et al. [14], the first two dominant modes of the WPSH show strong negative correlations with the TC genesis number over the WNP basin. The variance in the different modes of the WPSH can result in different spatial patterns of TC genesis. The first mode features an intense southwest-northeast oriented WPSH, which strongly affects the TC genesis numbers in region I and region II, and the correlations are −0.49 and −0.50, respectively. Moreover, this mode significantly controls TC landings on the east coast of China. The correlation coefficient between PC1 and the TC number in region A can reach −0.54. The second leading mode is characterized by a strong north-southeast WPSH, which significantly affects the TC genesis number in region III, and the correlation is −0.69.
Then, the key factors of the impacts of the two dominant modes of the WPSH on the WNP TC activities were determined by GPI. The results show that the low-level vorticity (VOR) and 700-hPa RH play key roles in the changes in TCs associated with the first mode of the WPSH. The southwestward expansion (northeastward retreating) during the positive (negative) phase of EOF1 of the WPSH can cause a significant anticyclonic (cyclonic) circulation anomaly at the low-level and downward (upward) motion over region I and region II, which leads to negative (positive) relative vorticity and divergence (convergence) of the water vapor flux that suppresses (enhance) TC genesis in regions I and II during PC1–H (PC1–L) events. For this mode, the ridge of the WPSH shows an obvious shift between the strong phase and the weak phase. The significant anticyclone over the WNP caused the WPSH ridge to shift northward with a strong first WPSH mode; therefore, the obvious westerly wind anomalies over regions I and II are strong against TC tracks landing on the east coast of China. However, in the weak phase of EOF1, the mean location of the WPSH was significantly southward. Furthermore, the TCs will be steered westward or northeastward and then land in southern and eastern China.
As discussed in previous studies [14,29,45], the first mode of the WPSH was significantly impacted by the SST anomalies in the Pacific and Atlantic. On the one hand, the variation of WPSH has been significantly influenced by SST anomalies in the Pacific and Atlantic. For example, the WPSH in summer has clearly been enhanced since the 1980s, which were not only associated with the SST in the North Indian Ocean and the equatorial eastern Pacific, but also the SST in the tropical Atlantic [46]. On the other hand, the TC activities in the WNP are also impacted by the zonal circulation anomalies induced by the SST anomalies in the Atlantic [47,48,49,50]. The effects of transoceanic processes in large scale circulation on the WPSH and associate TC activities need further investigation.
For the second mode of the WPSH, the change in the VOR and the VWS caused by this mode make the dominant contribution to the variation in TC genesis in region III. The strengthened WPSH will induce anomalous easterly winds that cross the tropical region, which will in turn reduce the low-level vorticity, enhance the VWS and ultimately not favor TC genesis over region III.
This mode has no significant impact on the TCs that landed on the east coast of China. However, the landing rate in region III shows an obvious increase from the negative phase of EOF2 to the positive phase. This finding may be because the mean location of TC genesis is far westward compared with the negative phase, which has a strong westward steering flow associated with the second mode of the WPSH. This steering flow will promote TCs’ making landfall and increase the landing rate.
Using these dominant modes of the WPSH, a physical–empirical model is created to obtain interannual predictions of total TC days and landing TC days in region A. The derived prediction functions show high-quality skills. The correlation coefficient of the hindcast results for total TC days and landing TC days can reach 0.67 and 0.63, respectively. Since seasonal and interannual predictions of TCs are still difficult for coupled models [51,52,53], improving the prediction skills is very useful for the interannual prediction of TCs over the WNP, especially TCs landing along the coast of China.
Author Contributions
Data curation, S.X.; Methodology, Y.Y.; Supervision, Y.Y.; Visualization, T.F.; Writing—original draft, T.F.; Writing—review & editing, Y.Y. All authors have read and agreed to the published version of the manuscript.
Funding
This research was funded by the National Key Research and Development Program of China (No. 2017YFA0604102) and the National Natural Science Foundation of China (No.41975061 and 41676007).
Institutional Review Board Statement
Not applicable.
Informed Consent Statement
Not applicable.
Data Availability Statement
The TC best track data was downloaded from the website of RSMC Tokyo-center: http://www.jma.go.jp/jma/jma-eng/jma-center/rsmc-hp-pub-eg/besttrack.html (accessed on 25 November 2021). The atmospheric reanalysis data was downloaded from the website of European Center for Medium Weather Forecasting: https://www.ecmwf.int/en/forecasts/datasets/reanalysis-datasets/era5 (accessed on 25 November 2021). The SST data was downloaded from the website of NOAA: https://www.ncei.noaa.gov/products/extended-reconstructed-sst (accessed on 25 November 2021).
Acknowledgments
We thank Bin Wang and Baoqiang Xiang for their kindly help in this work.
Conflicts of Interest
The authors declare no conflict of interest.
References
- Zhang, Q.; Wu, L.; Liu, Q. Tropical cyclone damages in China 1983–2006. Bull. Am. Meteorol. Soc. 2009, 90, 489–495. [Google Scholar] [CrossRef] [Green Version]
- Peduzzi, P.; Chatenoux, B.; Dao, H.; De Bono, A.; Herold, C.; Kossin, J.; Mouton, F.; Nordbeck, O. Global trends in tropical cyclone risk. Nat. Clim. Change 2012, 2, 289–294. [Google Scholar] [CrossRef]
- Wang, B.; Chan, J.C.L. How strong ENSO events affect tropical storm activity over the western North Pacific. J. Clim. 2002, 15, 1643–1658. [Google Scholar] [CrossRef]
- Wu, M.C.; Chang, W.L.; Leung, W.M. Impacts of El Nino-Southern Oscillation events on tropical cyclone landfalling activity in the western North Pacific. J. Clim. 2004, 17, 1419–1428. [Google Scholar] [CrossRef] [Green Version]
- Ho, C.H.; Baik, J.J.; Kim, J.H.; Gong, D.Y.; Sui, C.H. Interdecadal changes in summertime typhoon tracks. J. Clim. 2004, 17, 1767–1776. [Google Scholar] [CrossRef]
- He, H.; Yang, J.; Gong, R.; Wang, Y.; Gao, M. Decadal changes in tropical cyclone activity over the western North Pacific in the late 1990s. Clim. Dyn. 2015, 45, 3317–3329. [Google Scholar] [CrossRef]
- Chan, J.C.L. Tropical cyclone activity in the northwest Pacific in relation to the El Nino/Southern Oscillation phenomenon. Mon. Weather Rev. 1985, 113, 599–606. [Google Scholar] [CrossRef]
- Chan, J.C.L. Tropical cyclone activity over the western North Pacific associated with El Nino and La Nina events. J. Clim. 2000, 13, 2960–2972. [Google Scholar] [CrossRef]
- Lander, M.A. An exploratory analysis of the relationship between tropical storm formation in the western North Pacific and ENSO. Mon. Weather Rev. 1994, 122, 636–651. [Google Scholar] [CrossRef]
- Camargo, S.J.; Sobel, A.H. Western North Pacific tropical cyclone intensity and ENSO. J. Clim. 2005, 18, 2996–3006. [Google Scholar] [CrossRef]
- Chen, G.; Tam, C.-Y. Different impacts of two kinds of Pacific Ocean warming on tropical cyclone frequency over the western North Pacific. Geophys. Res. Lett. 2010, 37, L01803. [Google Scholar] [CrossRef] [Green Version]
- Zhao, H.; Wu, L.; Zhou, W. Assessing the influence of the ENSO on tropical cyclone prevailing tracks in the western North Pacific. Adv. Atmos. Sci. 2010, 27, 1361–1371. [Google Scholar] [CrossRef]
- Kim, H.-M.; Webster, P.J.; Curry, J.A. Modulation of North Pacific tropical cyclone activity by three phases of ENSO. J. Clim. 2011, 24, 1839–1849. [Google Scholar] [CrossRef] [Green Version]
- Wang, B.; Xiang, B.; Lee, J. Subtropical High predictability establishes a promising way for monsoon and tropical storm predictions. Proc. Natl. Acad. Sci. USA 2013, 110, 2718–2722. [Google Scholar] [CrossRef] [Green Version]
- Zhang, W.; Li, H.; Jin, F.-F.; Stuecker, M.F.; Turner, A.G.; Klingaman, N.P. The annual-cycle modulation of meridional asymmetry in ENSO’s atmospheric response and its dependence on ENSO zonal structure. J. Clim. 2015, 28, 5795–5812. [Google Scholar] [CrossRef] [Green Version]
- Wang, C.; Wu, L. Interannual shift of the tropical upper-tropospheric trough and its influence on tropical cyclone formation over the Western North Pacific. J. Clim. 2016, 29, 4203–4211. [Google Scholar] [CrossRef]
- Yang, Y.X.; Xie, R.H.; Wang, F.M.; Huang, F. Impacts of decaying eastern and central Pacific El Nino on tropical cyclone activities over the western North Pacific in summer. Theor. Appl. Climtol. 2017, 125, 175–185. [Google Scholar] [CrossRef]
- Wang, C.; Li, C.; Mu, M.; Duan, W. Seasonal modulations of different impacts of two types of ENSO events on tropical cyclone activity in the western North Pacific. Clim. Dyn. 2013, 40, 2887–2902. [Google Scholar] [CrossRef]
- Wang, C.; Wu, L.; Zhao, H.; Cao, J.; Tian, W. Is there a quiescent typhoon season over the western North Pacific following a strong El Niño event? Int. J. Climatol. 2018, 39, 61–73. [Google Scholar] [CrossRef] [Green Version]
- Du, Y.; Yang, L.; Xie, S.-P. Tropical Indian Ocean influence on Northwest Pacific tropical cyclones in summer following strong El Niño. J. Clim. 2011, 24, 315–322. [Google Scholar] [CrossRef]
- Ha, Y.; Zhong, Z.; Yang, X.; Sun, Y. Contribution of East Indian Ocean SSTA to Western North Pacific tropical cyclone activity under El Niño/La Niña conditions. Int. J. Climatol. 2015, 35, 506–519. [Google Scholar] [CrossRef]
- Zhan, R.; Wang, Y.; Lei, X. Contributions of ENSO and East Indian Ocean SSTA to the interannual variability of Northwest Pacific tropical cyclone frequency. J. Clim. 2011, 24, 509–521. [Google Scholar] [CrossRef]
- Zhan, R.; Wang, Y.; Tao, L. Intensified impact of East Indian Ocean SST anomaly on tropical cyclone genesis frequency over the Western North Pacific. J. Clim. 2014, 27, 8724–8739. [Google Scholar] [CrossRef]
- Wu, L.; Wang, B.; Geng, S. Growing typhoon influence on east Asia. Geophys. Res. Lett. 2005, 32, L18703. [Google Scholar] [CrossRef] [Green Version]
- Liu, K.S.; Chan, J.C.L. Interdecadal variability of Western North Pacific tropical cyclone tracks. J. Clim. 2008, 21, 4464–4476. [Google Scholar] [CrossRef]
- Zhang, W.; Vecchi, G.A.; Murakami, H.; Villarini, G.; Delworth, T.L.; Yang, X.; Jia, L. Dominant Role of Atlantic Multidecadal Oscillation in the recent decadal changes in western North Pacific tropical cyclone activity. Geophys. Res. Lett. 2018, 45, 354–362. [Google Scholar] [CrossRef]
- Zhao, J.; Zhan, R.; Wang, Y.; Xu, H. Contribution of Interdecadal Pacific Oscillation to the recent abrupt decrease in tropical cyclone genesis frequency over the western North Pacific since 1998. J. Clim. 2018, 31, 8211–8224. [Google Scholar] [CrossRef]
- Kim, H.-M.; Seo, K.-H.; Veh, S.-W.; Kang, N.-Y.; Moon, B.-K. Asymmetric impact of Central Pacific ENSO on the reduction of tropical cyclone genesis frequency over the western North Pacific since the late 1990s. Clim. Dyn. 2020, 54, 661–673. [Google Scholar] [CrossRef]
- Wang, C.; Wang, B. Tropical cyclone predictability shaped by western Pacific subtropical high: Integration of trans-basin sea surface temperature effects. Clim. Dyn. 2019, 53, 2697–2714. [Google Scholar] [CrossRef]
- Liu, Y.; Wu, G. Progress in the study on the formation of the summertime subtropical anticyclone. Adv. Atmos. Sci. 2004, 14, 289–308. [Google Scholar] [CrossRef]
- Miyasaka, T.; Nakamura, H. Structure and formation mechanisms of the northern hemisphere summertime subtropical highs. J. Clim. 2005, 18, 5046–5065. [Google Scholar] [CrossRef]
- Zhou, T.; Yu, R. Atmospheric water vapor transport associated with typical anomalous summer rainfall patterns in China. J. Geophys. Res. 2005, 110, D08104. [Google Scholar] [CrossRef] [Green Version]
- Zhou, T.; Yu, R.; Zhang, J.; Drange, H.; Cassou, C.; Deser, C.; Hodson, D.L.; Sanchez-Gomez, E.; Li, J.; Keenlyside, N.; et al. Why the western Pacific subtropical high has extended westward since the late 1970s. J. Clim. 2009, 22, 2199–2215. [Google Scholar] [CrossRef] [Green Version]
- Sun, Y.; Zhong, Z.; Yi, L.; Li, T.; Chen, M.; Wan, H.; Wang, Y.; Zhong, K. Dependence of the Relationship between the Tropical Cyclone Track and Western Pacific Subtropical High Intensity on Initial Storm Size: A Numerical Investigation. J. Geophys. Res. 2015, 120, 11451–11467. [Google Scholar] [CrossRef]
- Chen, T.C.; Wang, S.Y.; Yen, M.C.; Clark, A.J. Impact of the interseasonal variability of the Western North Pacific large-scale circulation on tropical cyclone tracks. J. Clim. 2009, 24, 646–666. [Google Scholar] [CrossRef]
- Liu, K.S.; Chan, J.C.L. Inactive period of Western North Pacific tropical cyclone activity in 1998–2011. J. Clim. 2013, 26, 2614–2630. [Google Scholar] [CrossRef]
- Tu, J.; Chou, C.; Chu, P. The abrupt shift of typhoon activity in the vicinity of Taiwan and its association with Western North Pacific–East Asian climate change. J. Clim. 2009, 22, 3616–3628. [Google Scholar] [CrossRef]
- Xiang, B.; Wang, B.; Yu, W.; Xu, S. How can anomalous western North Pacific Subtropical High intensify in late summer? Geophys. Res. Lett. 2013, 40, 2349–2354. [Google Scholar] [CrossRef]
- Hersbach, H.; Bell, B.; Berrisford, P.; Hirahara, S.; Horányi, A.; Muñoz-Sabater, J.; Nicolas, J.; Peubey, C.; Radu, R.; Schepers, D.; et al. The ERA5 global reanalysis. Q. J. R. Meteorol. Soc. 2020, 146, 1999–2049. [Google Scholar] [CrossRef]
- Smith, T.M.; Reynolds, R.W.; Peterson, T.C.; Lawrimore, J. Improvements to NOAA’s historical merged land ocean surface temperature analysis (1880–2006). J. Clim. 2008, 21, 2283–2296. [Google Scholar] [CrossRef]
- Emanuel, K.; Nolan, D.S. Tropical cyclone activity and the global climate system. In Proceedings of the 26th Conference on Hurricanes and Tropical Meteorolgy, Miami, FL, USA, 3–7 May 2004; pp. 141–240. [Google Scholar]
- Chan, J.C.L. Thermodynamic control on the climate of intense tropical cyclones. Proc. Roy. Soc. A 2009, 465, 3011–3021. [Google Scholar] [CrossRef]
- Chen, T.C.; Weng, S.P.; Yamamzaki, N.; Kiehne, S. Interannual variation in the tropical cyclone formation over the western North Pacific. Mon. Weather Rev. 1998, 126, 1080–1090. [Google Scholar] [CrossRef]
- Holland, G.J. Chaper 3: Tropical Cyclone Motion. In Global Guide to Tropical Cyclone Forecasting, 1st ed.; WMO: Geneva, Switzerland, 1993. Available online: http://www.bom.gov.au/bmrc/pubs/tcguide/ch3/ch3_tableofcontents.htm (accessed on 3 January 2018).
- Wang, L.; Yu, J.Y.; Paek, H. Enhanced biennial variability in the Pacific due to Atlantic capacitor effect. Nat. Commun. 2017, 8, 1–7. [Google Scholar] [CrossRef]
- Hong, C.C.; Chang, T.C.; Hsu, H.H. Enhanced relationship between the tropical Atlantic SST and the summertime estern North Pacific subtropical high after the early 1980s. J. Geophys. Res. Atmos. 2014, 119, 3715–3722. [Google Scholar] [CrossRef]
- Cao, X.; Wu, R.G.; Xiao, X. A new perspective of intensified impact of El Niño−Southern Oscillation Modoki on tropical cyclogenesis over the western North Pacific around 1990s. Int. J. Climatol. 2018, 38, 4262–4275. [Google Scholar] [CrossRef]
- Cao, X.; Chen, S.F.; Chen, G.H.; Wu, R.G. Intensified Impact of Northern Tropical Atlantic SST on Tropical Cyclogenesis Frequency over the Western North Pacific after the Late 1980s. Adv. Atmos. Sci. 2016, 33, 919–930. [Google Scholar] [CrossRef]
- Wu, M.M.; Wang, L.; Chen, B.Y. Recent weakening in interannual variability of mean tropical cyclogenesis latitude over the western North Pacific during boreal summer. J. Meteor. Res. 2020, 34, 1183–1198. [Google Scholar] [CrossRef]
- Gao, S.; Chen, Z.; Zhang, W.; Shen, X. Effects of tropical North Atlantic sea surface temperature on intense tropical cyclones landfalling in China. Int. J. Climatol. 2021, 41, 1056–1065. [Google Scholar] [CrossRef]
- Camargo, S.J. Global and regional aspects of tropical cyclone activity in the CMIP5 models. J. Clim. 2013, 26, 9880–9902. [Google Scholar] [CrossRef] [Green Version]
- Davis, C.A. Resolving tropical cyclone intensity in models. Geophys. Res. Lett. 2018, 45, 2082–2087. [Google Scholar] [CrossRef]
- Tory, K.J.; Chand, S.S.; McBride, J.L.; Ye, H.; Dare, R.A. Projected changes in late-twenty-first-century tropical cyclone frequency in 13 coupled climate models from phase 5 of the coupled model intercomparison project. J. Clim. 2013, 26, 9946–9959. [Google Scholar] [CrossRef]


Publisher’s Note: MDPI stays neutral with regard to jurisdictional claims in published maps and institutional affiliations. |
© 2022 by the authors. Licensee MDPI, Basel, Switzerland. This article is an open access article distributed under the terms and conditions of the Creative Commons Attribution (CC BY) license (https://creativecommons.org/licenses/by/4.0/).