Article

Nitrous Oxide Emissions from an Alpine Grassland as Affected by Nitrogen Addition

1
State Key Laboratory of Desert and Oasis Ecology, Xinjiang Institute of Ecology and Geography, Chinese Academy of Sciences, Urumqi 830011, China
2
Xinjiang Key Laboratory of Desert Plant Roots Ecology and Vegetation Restoration, & Cele National Station of Observation and Research for Desert-Grassland Ecosystem, Cele 848300, China
3
University of Chinese Academy of Sciences, Beijing 100049, China
4
Department of Soil Science, University of Manitoba, Winnipeg, MB R3T 2N2, Canada
*
Authors to whom correspondence should be addressed.
Atmosphere 2021, 12(8), 976; https://doi.org/10.3390/atmos12080976
Submission received: 3 June 2021 / Revised: 8 July 2021 / Accepted: 27 July 2021 / Published: 29 July 2021
(This article belongs to the Special Issue Agricultural Greenhouse Gas Emissions)

Abstract

:
Nitrogen (N) addition is an important nutrient strategy for alpine grassland in northwestern China to improve productivity for livestock needs. A field experiment was conducted in a semi-arid alpine grassland in northwestern China to investigate the effect of N addition rates on soil N2O emissions over the growing seasons of 2017 and 2018. Treatments included six N addition rates (0, 10, 30, 60, 120, 240 kg N ha−1 y−1), which were applied before each growing season. The N2O fluxes increased with N addition rates and showed different episodic changes between the two growing seasons. In 2017, the maximum N2O flux rate occurred within 2 weeks following N addition. In 2018, however, the maximum N2O flux rate occurred later in the growing season due to a heavy rainfall event. Growing season cumulative N2O emissions ranged between 0.32 and 1.11 kg N ha−1, and increased linearly with N addition rates. Increasing N addition rates over 60 kg N ha−1 yr−1 did not further increase plant above-ground biomass. The inter-annual variability of N2O flux suggests the importance of soil moisture in affecting N2O emissions. It is particularly important to avoid over-applying N nutrients beyond plant needs to reduce its negative effect on the environment while maintaining livestock productivity. The N2O flux rate increased with soil dissolved organic carbon (DOC) and soil pH. These results suggest the optimal N addition rate to the livestock grassland in this region should be 60 kg N ha−1 yr−1.

1. Introduction

Nitrous oxide (N2O) is one of the most important greenhouse gases (GHGs), with a substantial contribution of 7.9% to the global warming effect [1]. The concentration of atmospheric N2O has increased from 270 ppb in the preindustrial period to 330 ppb in recent years, mainly due to anthropogenic industrial and agricultural activities. About one-third of N2O is mainly derived from human activities, of which agricultural activities are one of the main driving forces. Nearly 50% of N2O emissions are related to the application of soil nitrogen (N) fertilizers to agricultural ecosystems [2,3].
Grassland is one of the most widely distributed vegetation types on the land ecosystem. Grassland covers about one-fifth of the world’s land [4]. In China, grassland accounts for about 40% of land area [5,6]. In the recent decade, grassland has been the largest source of N2O emissions after forests and cultivated land [7]. Quantification of N2O emissions from grassland is necessary to assess the N2O budgets at the regional or global scales [8]. Nitrogen addition is a conventional means to increase grassland productivity for animal livestock production, especially for alpine grassland where N commonly limits plant biomass production. Understanding the mechanism of how N addition affects N2O emission from alpine grassland is of great importance for developing reasonable nutrient management strategies.
The N2O production in the soil is mainly associated with two microbial-driven mechanisms: nitrification under aerobic conditions and denitrification under anaerobic conditions [9,10]. Nitrification is the oxidation of ammonium ions by NH2OH aerobic microorganisms to nitrite and then oxidation to nitrate process. When oxygen is limited, ammonia oxidants can use NO2 as an alternative electron acceptor to produce nitrous oxide. Denitrification is the sequential reduction of nitrate by anaerobic microorganisms (mainly bacteria) to nitrite, which is then converted to NO, N2O, and N2 [11]. Environmental factors such as soil N and C availability, soil temperature, moisture and pH can affect these biological processes and further soil N2O emissions [12,13]. Soil moisture dynamics determine the biogeochemical environment of microorganisms and affect the availability of soluble nutrients such as organic carbon, ammonium, and nitrate [14]. Soil temperature affects the activity of related microorganisms during N2O production [15]. Moreover, human activities, such as the addition of fertilizers, can also have significant impacts [16,17]. As people increasingly consider reducing GHG emissions and reaching net zero-emission goals [18], the ability to quantify emissions and sources becomes increasingly important. Many studies with grassland ecosystems have shown that N addition increased soil N2O emission [4,19,20]. For example, for an alpine grassland in the southern Tian Shan Mountains of Central Asia, Li et al. [21] found that N addition increased N2O emissions over the non-fertilized control, but there was no significant difference between different N rate treatments. Due to different environmental factors, such as inorganic nitrogen, soil moisture, altitude, and temperature, the response of N2O to N addition varied with alpine grassland [20,21,22]. Some studies have shown that N addition had limited effect on N2O emission in alpine steppe in Tibetan Plateau and semi-arid temperate steppe in Inner Mongolia [23,24,25]. Therefore, there is still some controversy about the response of grassland N2O emission to N addition.
Numerous studies have investigated the relationship between the fertilizer N rates and N2O emissions. Previous studies found that N2O emissions increased linearly with the increase of N addition rate [26,27]. In recent years, more and more experiments have proved that the N2O emission is in a nonlinear exponential relationship with the increasing N addition rate [2,28,29]. For example, Kim et al. [30] conducted a meta-analysis with 26 published studies, and found that the relationship between N2O direct emissions and N input was nonlinear (exponential or hyperbolic) for 18 datasets, whereas the relationship was linear for four datasets. They further suggest that the response of N2O emissions to N input rate could be divided into three stages: (1) linear (N limited soil condition); (2) exponential; and (3) steady-state (carbon limited soil condition). Shcherbak et al. [2] also reached the same conclusion after conducting mate-analysis on the data of 78 published articles. However, these studies were based on agricultural ecosystems or temperate grasslands. Peng et al. [31] reported that N2O emission increased linearly with N fertilizer input in a Tibetan alpine steppe. The low temperature on the alpine grassland could limit the abundance and activity of N2O -producing microorganisms, which further limits the response of N2O emissions to N supply. Therefore, the exponential N2O emission-N rate relationship observed in warm regions may not be extrapolated to alpine ecosystems. More field experiments in different ecosystems are needed to clarify the relationship between N2O emissions with N addition.
The grassland in the north slope of the Kunlun Mountains is the primary pastoral area and plays a key role in maintaining the local livestock production and ecological balance [32]. This grassland ecosystem is located in the transition zone from humid to extremely arid climate in the mountain area and has a distinct vertical zonal distribution. Such an alpine grassland ecosystem is characterized by high altitude, low temperature, and low N availability. The ecosystem is susceptible to global climate and environmental changes [33]. However, in recent years, due to the expansion of grazing and global climate change, grassland degradation has resulted in the decline of herbage yield. Nutrient addition, especially N addition, has been recommended as an effective strategy to increase grassland productivity. However, a suitable N addition rate is to be determined to achieve the win-win goal of livestock production and environmental protection. Previous studies on N2O emissions from grassland ecosystems in China mainly focused on the semi-arid grasslands in Inner Mongolia and the alpine grasslands on the Qinghai–Tibet Plateau. The grassland ecosystem in the current study is unique as it locates in the transition zones from desert to oasis, and is particularly fragile to environmental changes. So far, few studies have investigated N2O emissions from the grassland ecosystem on Kunlun Mountains.
This study aimed to find out the optimal N addition rate at which the highest grassland production can be achieved with less N2O emissions. The specific objectives were (1) to explore the linear or non-linear relationship between N2O emission and N addition rates; and (2) to identify the key environmental factors that determine N2O emissions for the semi-arid alpine grassland on Kunlun Mountain.

2. Materials and Methods

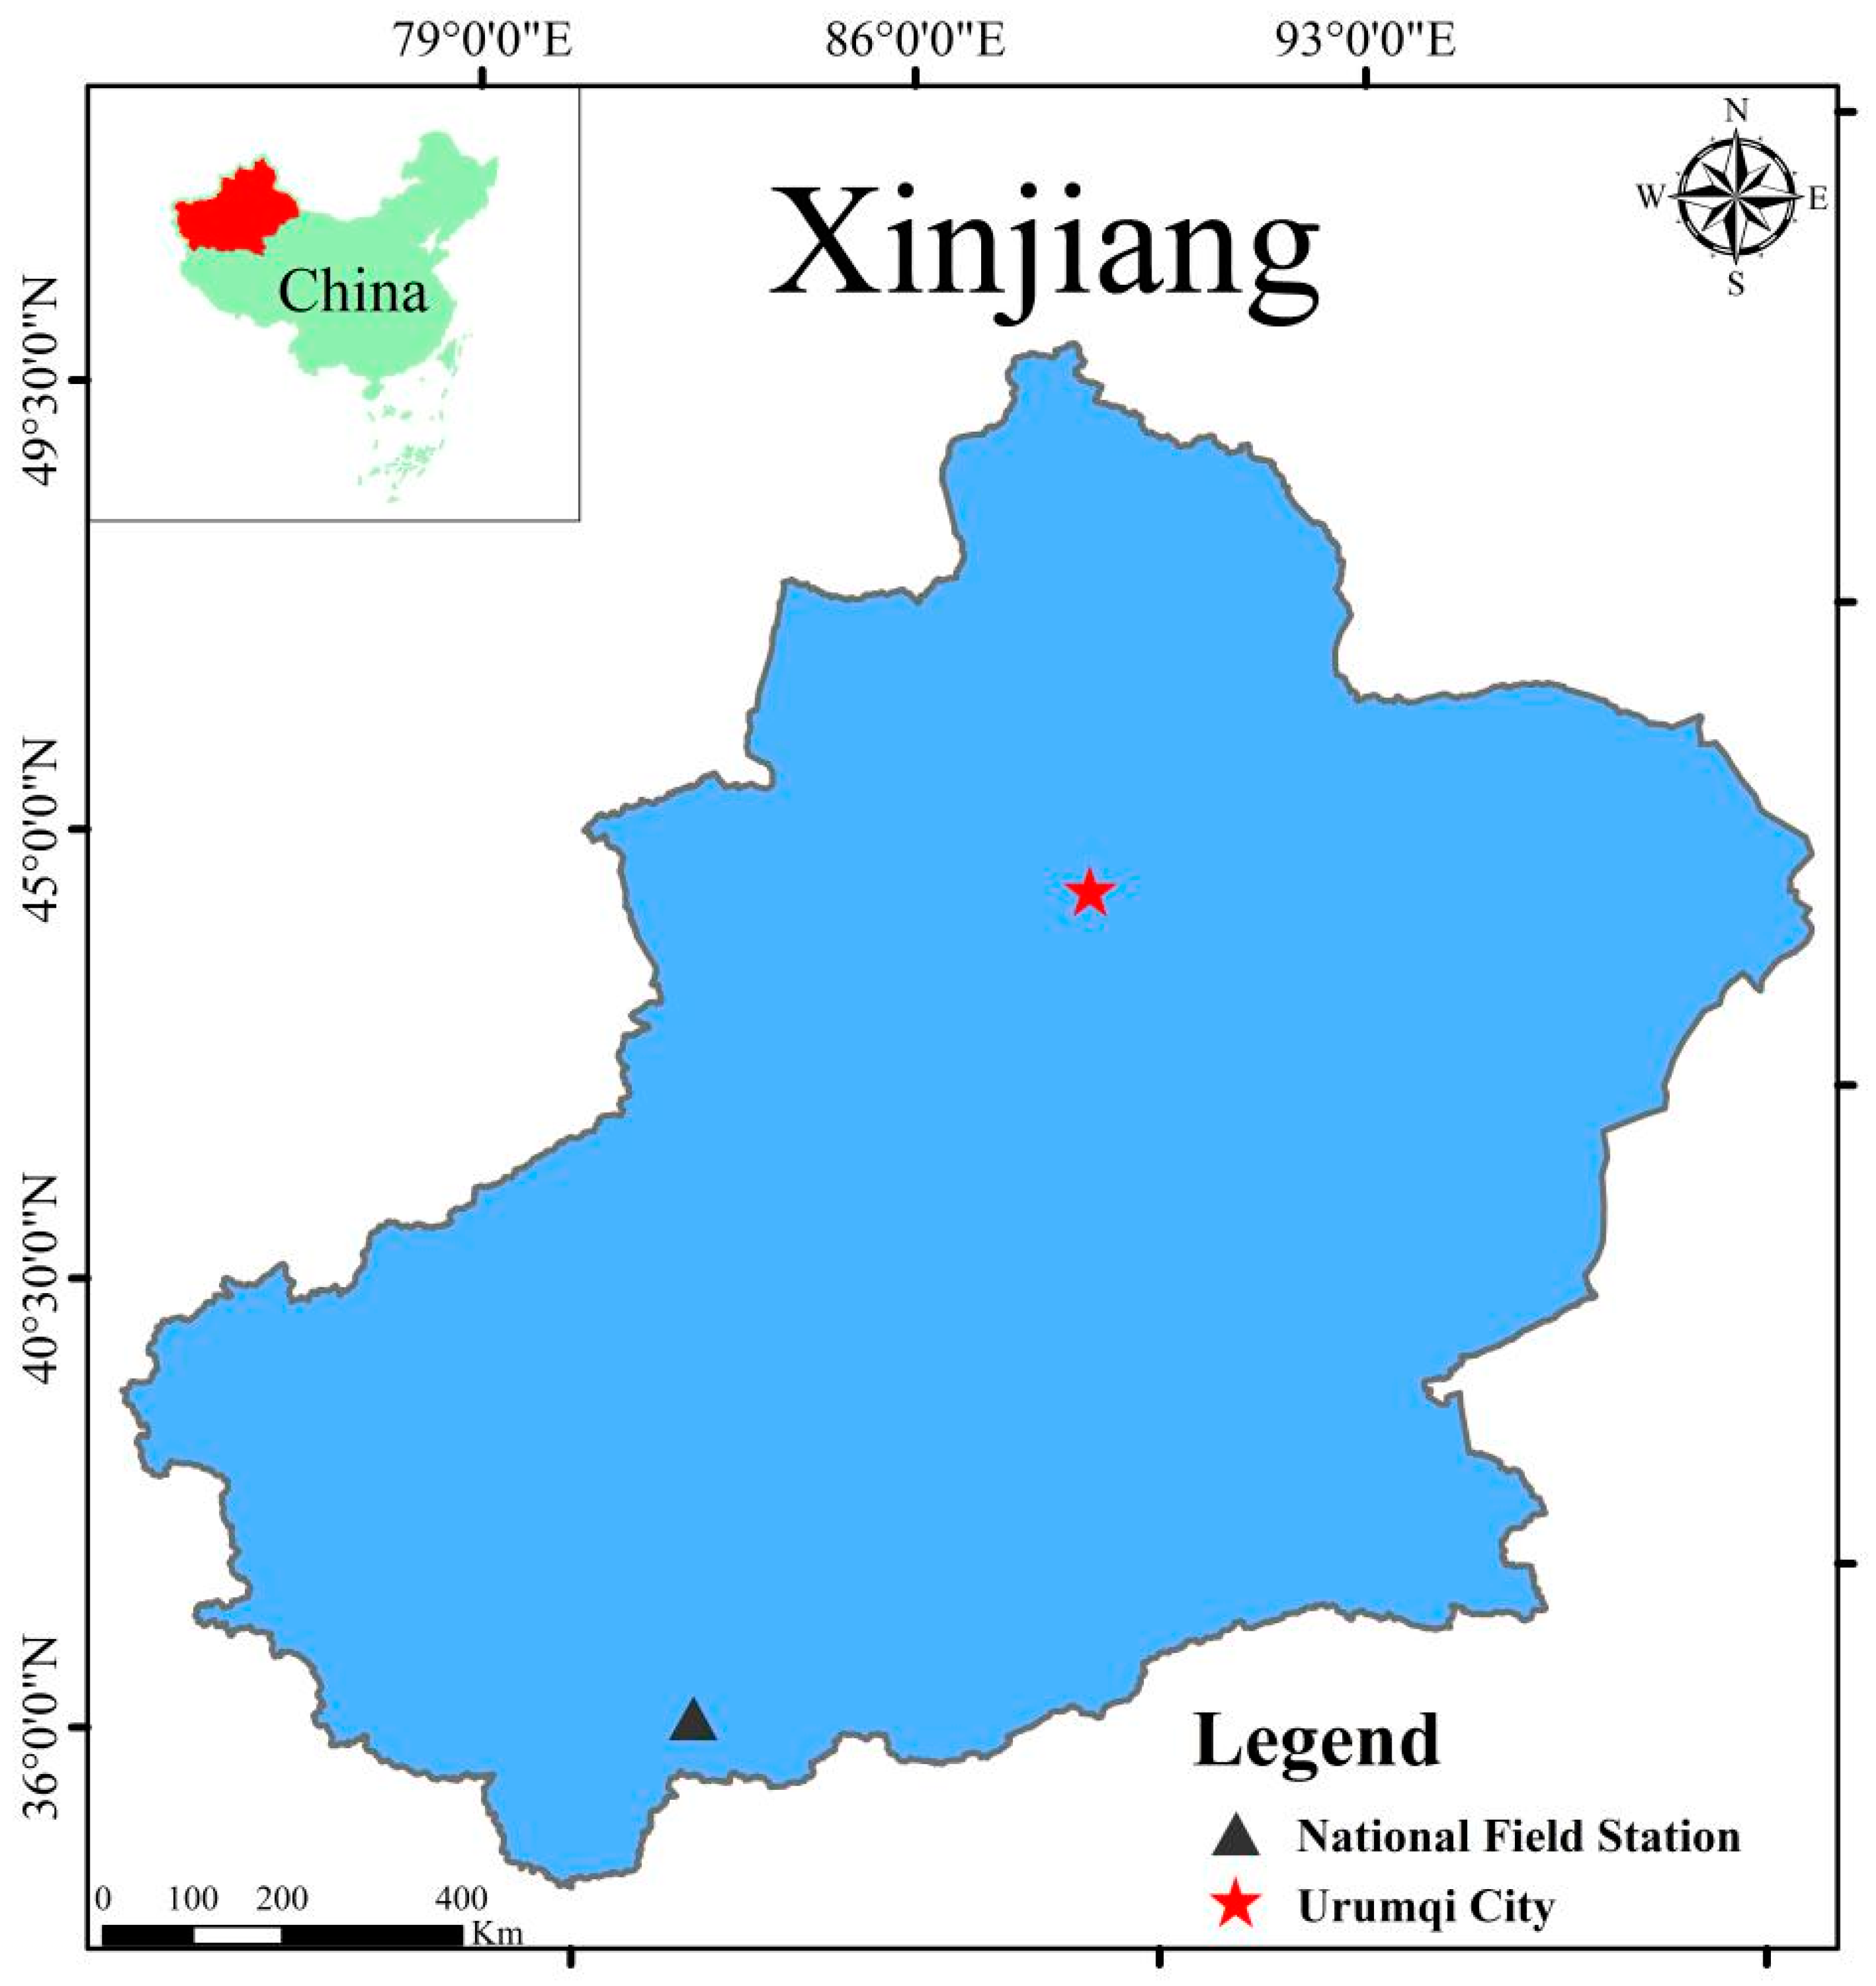
2.1. Field Site and Experimental Design

This study was performed from 2017 to 2018 on the National Field Observation and Research Station of Grassland Ecosystem in Xinjiang of China. The experimental site (80°35′08″ E, 36°08′02″ N) is a long-term grassland study site established in 2007 and located at the northern slope of Kunlun Mountain (Figure 1). The study site has an altitude of 3236 m and belongs to an alpine grassland. The climate is semi-arid with a mean annual air temperature of 8.5 °C and annual precipitation of 350 mm, which mainly occurs in May–September. The study site is entirely populated by indigenous vegetation and without exposure to animal grazing since 2007. A native and non-grazed grassland site was selected in this study to focus on the impact of N addition and avoid any potential interactions from animal grazing. The vegetation coverage rate is 60–80%, with the dominant species being Stipa capillata and Alpine silk, and the main associated species being Allium ramosum, Astragalus membranaceus, and Leymus chinensis [32]. Before the study in 2017, soil core samples (0–20 cm depth, 2.5 cm diameter) were collected and analyzed to determine the basic characteristics. The soil had a texture of sandy loam (clay 96, silt 579, and sand 326 g kg−1), organic matter content 10.8 g kg1, total N content 0.57 g kg1, total phosphorus (P) 0.67 g kg1, and total potassium (K) 18.5 g kg1, NaHCO3 extractable P (Olsen-P) 2.7 mg kg1, NH4OAc extractable K 121 mg kg1, pH 8.0, dissolved organic carbon (DOC) 0.23 mg g1, bulk density 1.23 g cm3, NO3-N 22.4 mg kg1, and NH4+-N 9.1 mg kg1. Analyses of soil were based on Carter [34]. Weather data of precipitation and air temperature were obtained using an onsite weather station.
Treatments were six N addition rates (0, 10, 30, 60, 120, 240 kg N ha1 yr1), which were arranged in a randomized block design with four replicates, for a total of 24 plots. These addition rates were adopted from a previous study in an alpine grassland in northwestern China and covered a range of levels used for the local grassland management [35]. The area of each plot is 2 × 3 m, with a 1-m buffer zone being set between every two plots to avoid the marginal effects. Nitrogen was broadcasted on soil surface in the form of urea (46-0-0) on 22 April 2017, and 20 April 2018, respectively. According to the local weather forecast, the application dates were set 1–2 d before an expected rainfall.

2.2. N2O Flux Determination

The N2O gas sampling was conducted using the static vented chamber method [36]. The chamber was composed of a polyvinyl chloride cylinder base collar (0.18 m i.d. and 0.12 m deep) and a fitting lid. A small hole was drilled on the lid to connect with a three-way valve for gas collection. In each plot, one chamber was installed in the center area by inserting the base collar into the soil at 5 cm depth, and left open through the growing seasons except for gas sampling. The sampling frequency was usually once a week following N addition, and decreased to once every two weeks in late growing seasons. During gas sampling, the chamber was sealed by fastening the lid into the bottom collar, and reinforced with rubber bands to ensure closure. A 30-mL syringe was used to collect gas samples manually through the three-way valve at 0, 15, 30, and 45 min after closing. The syringe was pumped back and forth for three times before each collection to mix the gas. Gas sample was then transferred into a 12-mL pre-evacuated vial until analysis. A gas chromatograph (Shimadzu GC-2014C, Shimadzu Scientific, Kyoto, Japan) fitted with an electron capture detector was then used to analyze N2O concentration in the gas sample. When measuring gas samples, the standard gas (purity of 99.999%, Dalian Date Gas Co., Ltd., Dalian, China) was used for instrument calibration.
The N2O flux rate was calculated using the HMR package in the R program by linear or non-linear simulations of the N2O concentration over the sampling times [37,38]. The linear interpolation gap-filling method was used to calculate the N2O flux rate for the missing sampling days. The growing season cumulative N2O emission (ΣN2O, kg N ha1) for each chamber was then calculated as the summation of daily estimates over the monitoring periods, assuming that the measured or linear-interpolated N2O emission rate was representative of the average daily N2O emission rate on that day. The N2O emission factors (EF, %) for the N receiving treatments represents the percentage of N input emitted as N2O gas, and was calculated as:
EF ( % ) = E N E C A p p l i e d   N × 100
where EN and EC are the ΣN2O (kg N2O-N ha1) from N addition treatments and unfertilized control, respectively, and the Applied N is the N addition rate (kg N ha1).

2.3. Soil and Plant Sampling

In each growing season of 2017 and 2018, soil core samples of 0–20 cm were collected once a month. In each plot, three core samples were collected and composited into one sample for analysis. The fresh samples were screened (2-mm) to remove impurities of roots and stones and then analyzed for NO3, NH4+, pH, and DOC. Soil NO3 and NH4+ concentrations were determined using a continuous flow analyzer (Auto analyzer 3 SEAL, Bran and Luebbe, Norderstedt, Germany) after being extracted using 0.1 M CaCl2. Soil pH was determined on soil: water ratio of 1:5. Soil DOC was determined using a total organic carbon analyzer (Aurora1030, OI Analytical, College Station, TX, USA) after being extracted in a 1:5 soil: water solution.
In each plot, plant above-ground biomass of four 0.5 × 0.5 m quadrats was obtained in June, July, and August in 2017. At each sampling, the above-ground plants in a different quadrat were clipped at ground level and oven-dried at 80 °C to a constant weight. Biomass determination was not done 2018 due to lack of labor.
Soil temperature and moisture contents were continuously monitored by installing sensors (5TM-Sensors, Decagon Devices, Pullman, DC, USA) at the 20 cm depth and connected to a data collector (Em50G Decagon Devices, Pullman, DC, USA). Moreover, at each gas sampling occasion, soil temperature and volumetric water content (VWC) at 5 cm depth were also measured using a portable soil sensor (WET-2, Delta-T Devices, Cambridge, UK). Soil water-filled pore space (WFPS) was then calculated as:
WFPS ( % ) = V M C 1 B D / P D × 100
where, VMC is the soil volumetric water content (%), BD is the soil bulk density, and PD is the soil density (assuming 2.65 g cm3).

2.4. Data Analysis

The Shapiro–Wilk method was used to test the normality and homogeneity of variance of all data before analysis. Log(10) was used to transform the N2O flux data to meet the requirements for normality of residuals. A two-way analysis of variance (ANOVA) was conducted to investigate the main and interactive effects of N treatment and year on cumulative N2O emission and plant above-ground biomass. Where treatment effect was significant, means were compared using the least significant difference (LSD) method. For a specific sampling occasion, means of daily N2O flux rate, soil concentrations of NH4+-N, NO3-N, and DOC, and soil pH were also compared using the LSD. Pearson correlation analysis was used to analyze the relationship between daily N2O flux rate and environmental factors (NH4+-N, NO3-N, pH, DOC, precipitation, air temperature, WFPS, soil temperature). Multiple stepwise regression analysis was further performed to identify the environmental factors that significantly contributed to the variation in N2O flux. The differences were considered significant at p < 0.05 level. Data analyses were conducted using R software and SPSS 20.0 software.

3. Results

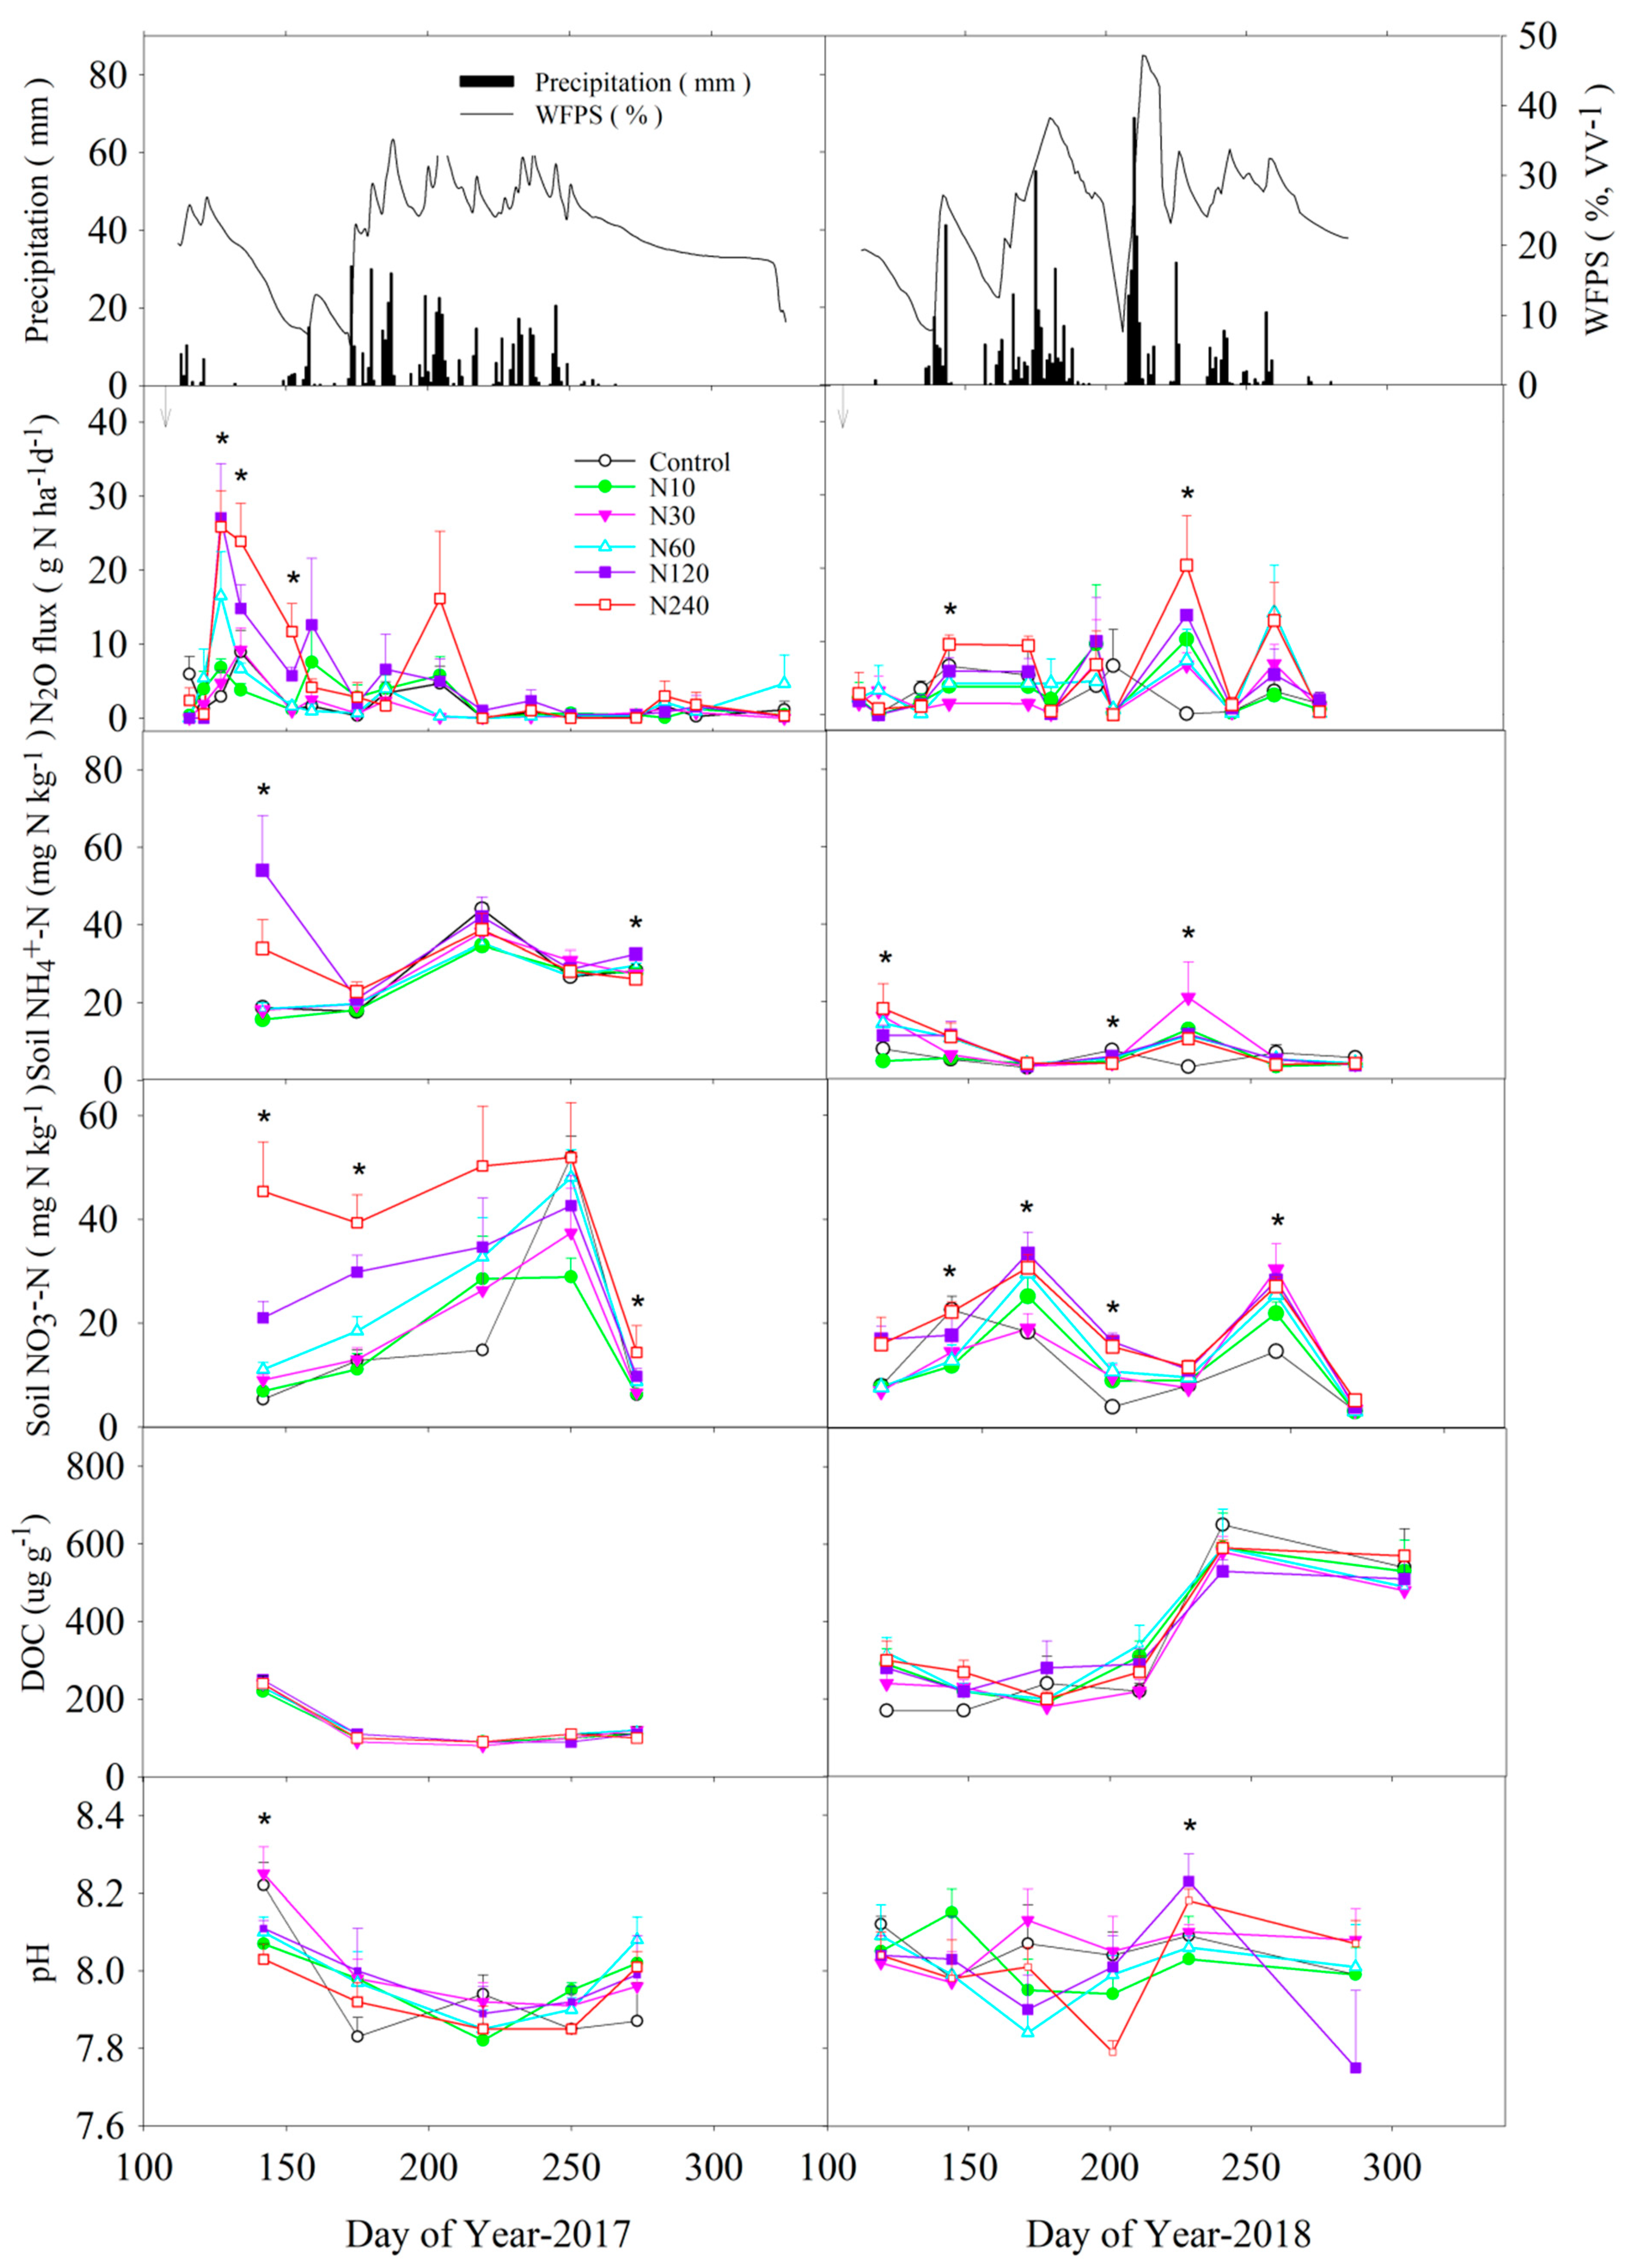
3.1. Environmental Conditions

The growing season (April–October) total precipitation was 535 mm in 2017 and 813 mm in 2018, which was mainly distributed in June-August. Soil WFPS showed corresponding temporal changes to rainfall events. Soil WFPS was at 30–45% from June to August in 2017 when most rainfall events occurred. In 2018, the heavy rainfall on day of year (DOY) 143, 175, 210 resulted in substantial increases of WFPS up to 40–50% (Figure 2). Over the experimental period, soil temperature generally followed the trend of air temperature, being increased from April to August, and decreased thereafter. The average soil temperature in the growing season (April–October) was 8.5 °C in 2017 and 5.0 °C in 2018. The meteorological data of the experimental site were obtained from nearby weather stations, and the rainfall and temperature data referred to our team’s article [36].

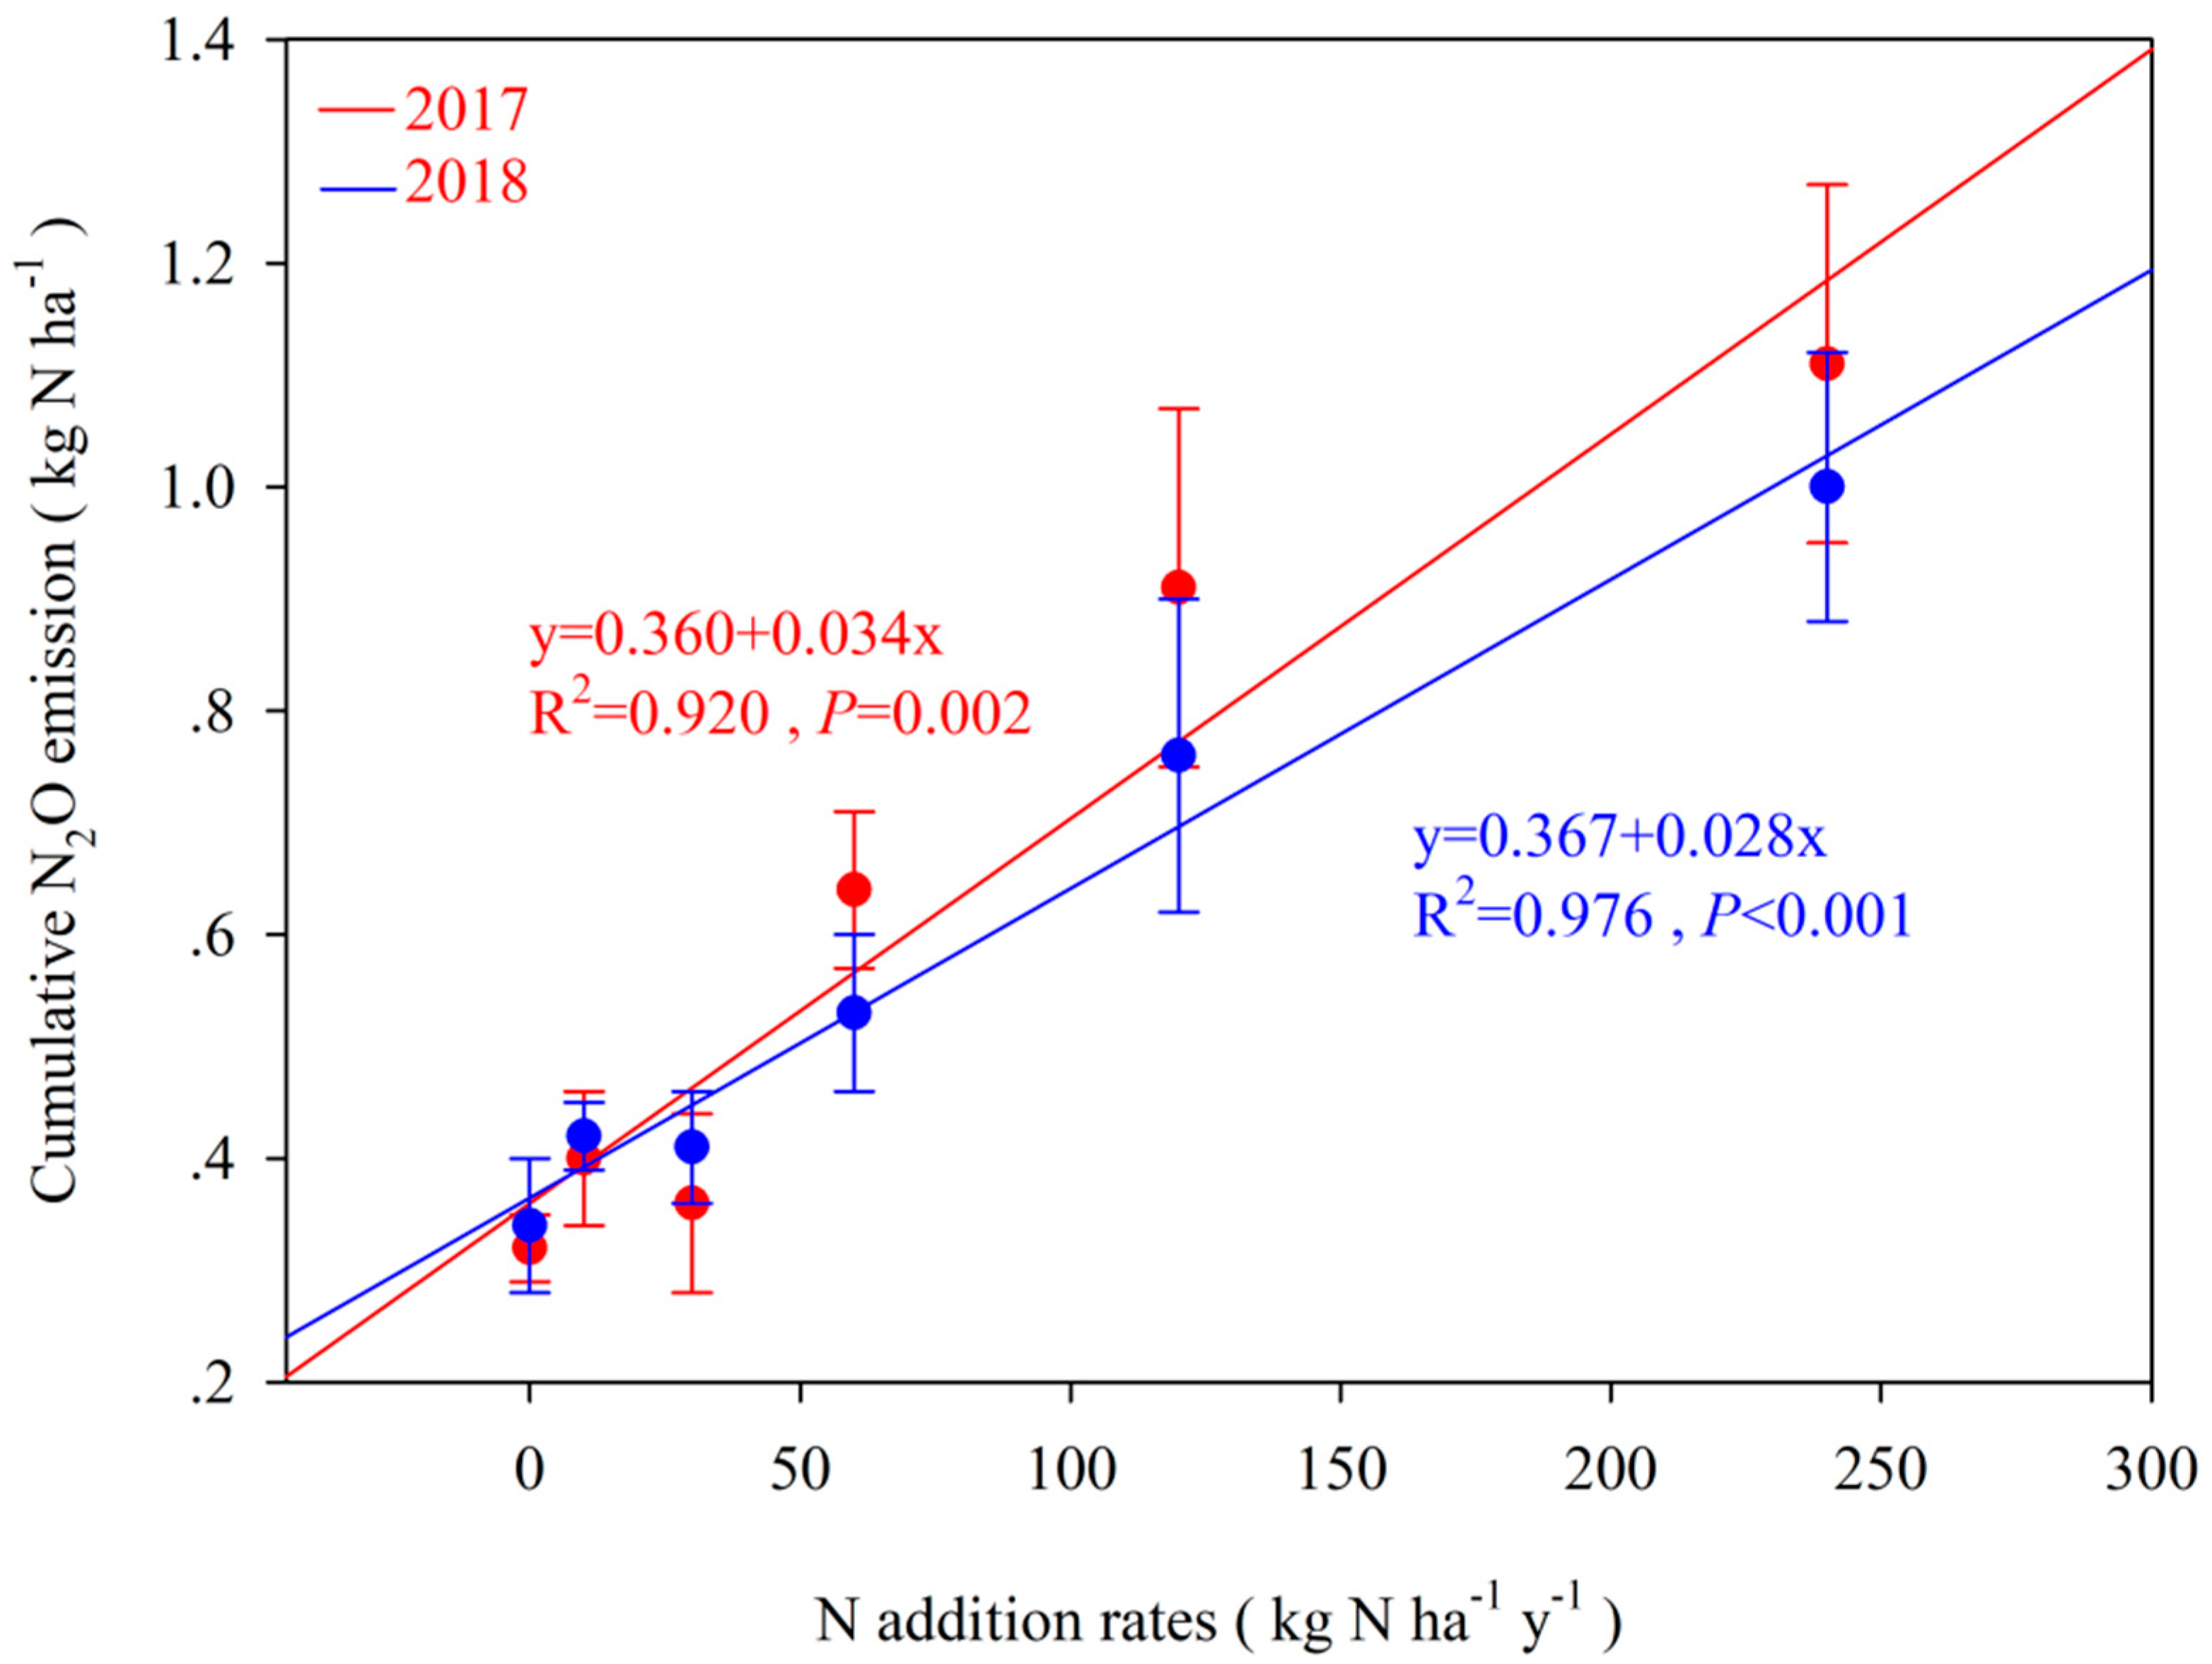
3.2. Daily N2O Flux Rate and Cumulative Emissions

In 2017, N2O flux rate increased and reached a peak two weeks after N addition (Figure 2). In 2018, the maximum N2O flux rate occurred in late growing seasons, which was induced by several large rainfall events between DOY 200 and 220, corresponding with a high soil moisture content. Significant (p < 0.05) treatment effects were observed on 3 of 16 measurement occasions in 2017, and 2 of 12 measurement occasions in 2018, where high N additions of 120 and 240 kg N ha−1 resulted in higher N2O flux rates compared to low additions of 10 to 60 kg N ha−1. Over the 2-yr period, the average daily N2O flux rate was 5.8, 4.6, 3.2, 2.3, 2.8, and 2.4 g N ha1 d1 for the N240, N120, N60, N30, N10, and control, respectively.
The ƩN2O showed a similar response to N addition in both years, values with high N inputs of N120 and N240 doubled or nearly tripled that of the low N inputs of N10 and N30 (Table 1). In each year, the ƩN2O increased linearly with N addition rates, with high R2 of 0.920 in 2017 and 0.976 in 2018 (Figure 3). Meanwhile, the average background emission inferred from the y-intercept (0 kg N ha1 fertilizer) was 0.364 kg N ha1 yr1. The EF over the two growing seasons ranged from 0.15% to 0.86%, with an average value of 0.44%. The EF was not affected by N treatment in either year. Both ƩN2O and EF were not affected by an interaction between year and N treatments.
Pearson correlation analysis showed that the N2O flux rate correlated with soil DOC (r = 0.370) and pH (r = 0.273), but not with other environmental variables, including soil NO3, NH4+, air or soil temperature, precipitation, and WFPS (Table 2). We further conducted stepwise linear multiple regression to identify additional explanatory power for the N2O flux. Other than soil pH and DOC, soil NO3, soil temperature, and WFPS was identified as significant factors contributing to variation in N2O flux. Still, the coefficients (r2) of these variables were low, being 0.098 for pH, 0.048 for DOC, 0.052 for soil NO3, 0.055 for WFPS and 0.020 for soil temperature, resulting in an overall R2 of 0.273.

3.3. Soil Chemical Characteristics

During the whole observation period, N addition treatments increased concentrations of extractable NH4+ and NO3 compared to the control (Figure 2). The N240 and N120 addition treatments had generally higher NH4+ and NO3 concentrations than other N addition rates, whereas low N addition rates of N10 and N30 did not significantly increase NH4+ and NO3 concentrations compared to the control. Over the two growing seasons, N addition generally did not affect soil pH and DOC concentration (Figure 2).

3.4. Plant Biomass under Different N Addition Rates

In 2017, the effect of N treatment on plants above-ground biomass differed between sampling times (Table 3). In June, there was no significant difference among the treatments. In July and August, high N addition rates of N120 and N240, but not other treatments, resulted in significantly (p < 0.05) higher biomass than the control.

4. Discussion

In the present study, the EF ranged between 0.15 and 0.86% with an average of 0.42%, which is comparable to those of the alpine grassland on the Qinghai–Tibet Plateau (range: 0.16–0.85%) [39], and the semi-arid temperate grassland of Inner Mongolia (range: 0.06–0.30%) [23]. In contrast, the EF values in the alpine grassland are lower than the IPCC default value of 1% [40]. The EF values are also far lower than those reported for grassland in the UK with low altitude and wet climate (0.6–2.08%) [41]. Lower EFs are associated with very low soil water content, low available carbon, and alkaline soil in the experimental area (Figure 2). Lower water content and DOC can limit the growth and reproduction of nitrification and denitrification bacteria; thus, reducing the production of N2O [42,43]. These results suggest that applying IPCC default EF will overestimate the N2O emission for the alpine grassland in semi-arid regions. Therefore, the establishment of EF for grassland under different climate regions is conducive to the accuracy of N2O emission estimation.
The seasonal change in N2O emissions varied between the two years in this study, which could be attributed to the variation in soil moisture. In 2017, the maximum N2O flux rate occurred two weeks following N addition, this might be due to lower soil moisture content (30–45%) in 2017, which favored the nitrification process for N2O emission rather than denitrification. Previous studies suggest nitrification is the main source of N2O production at soil WFPS less than 60% [44]. In 2018, several N2O emission peaks occurred in late growing seasons, which were mainly stimulated by an increasing soil WFPS in response to rainfall events. Similar to our results, in the UK North Wyke grassland, Cardenas et al. [41] found that N fertilizer and rainfall resulted in the different N2O emission peaks between the two years. Moreover, a temporary peak in N2O emissions after N addition was observed in Scotland and the south east of Ireland temperature grasslands [45,46]. This is because the increase of soil moisture after rainfall increases the activity of microorganisms, which increases the emission rate of N2O and causes the emission peak [47]. These results highlight the importance of soil moisture in affecting soil N2O emissions from the grassland ecosystems.
In this study, there was a linear relationship between N2O emissions and N fertilizer rate (y = 0.360 + 0.034x, R2 = 0.920, p = 0.002 in 2017, y = 0.36 + 0.028x, R2 = 0.976, p < 0.001 in 2018), confirming previous findings of Peng et al. [31] in the Qinghai–Tibet Plateau. Similarly, Cardenas et al. [41] also reported a linear increase of N2O emissions with N fertilizer rates for grassland in UK. In contrast, other studies have reported a non-linear (exponential) increasing N2O emissions as N inputs exceeded crop needs [2,28,48]. The linear rather than a nonlinear exponential relationship between N2O emission and N addition rates in this study could be attributed to two factors. First, the range of N rates in this study is relatively narrower than that reported with an exponential relationship. It is likely the highest N rate in this study (240 kg N ha−1) provided sufficient N supply to meet crop needs, but did not result in a high accumulation of soil NO3/NH4+ to stimulate the nitrification/denitrification processes. This assumption is confirmed by the fact that soil NO3/NH4+ concentrations at high N rates were only slightly higher than those at low N rates. Second, our recent study at the same site found that soil environmental factors, such as soil moisture and carbon availability, were limiting factors for nitrification/denitrification processes in this grassland ecosystem [36]. In this study, soil WFPS was approximately at 25–40% during the majority of experimental periods, which are lower than the optimal levels for nitrification (60% WFPS) and denitrification (80% WFPS) [23]. The low WFPS could have limited the activities of N2O producing microbials [14]. The DOC content in the test site of this study was low (0.06–0.75 mg g−1), which could be additional limiting factor for denitrification [49,50]. It is noted that soil NO3 and NH4+ concentrations were not associated with N2O flux in the simple correlation analysis. However, the multiple stepwise regression analysis revealed that soil NO3 is an additional contributor to the variation in N2O flux. There was a clear increasing trend of soil NO3 concentrations with N addition rates, indicating the accumulation of soil NO3 in response to N input.
In this study, N addition at 60 kg N ha−1 yr−1 significantly increased the plant above-ground biomass over control. Increasing N rate over this level did not further significantly increase grassland productivity. We also did not observe any visual changes in plant species composition as affected by N addition. Considering the linear increase of N2O emissions in response to N rates, we recommended 60 kg N ha−1 as the optimal N addition rate for maintaining the grassland productivity on Kunlun Mountains. Gu et al. [25] showed that plant N use efficiency was highest when the N was added at 20 kg N ha−1, and the biomass increment was small in semi-arid grassland of Inner Mongolia. Bai et al. [51] showed—for a degraded grassland in Inner Mongolia—that N addition up to 105 kg N ha−1 increased biomass productivity. This study evaluated the impact of N addition, which is only one component of the potential N2O emission sources. In the same area, Yin et al. (2020) reported that N2O emissions were significantly higher at the grazed than non-grazed grassland, which was mainly attributed to the soil environmental factors, such as the increasing soil WFPS, temperature and DOC. An overall evaluation on N2O emission from grazing grassland should consider other sources, such as the deposition of animal excreta.
N2O flux rate showed a clear increasing trend with pH and DOC. Chen et al. [52] found that soil N2O fluxes peak at pH 7.0 or 8.0, indicating that fungi and bacteria prefer to produce N2O under neutral or slightly alkaline conditions. Wang et al. [53] found that soil pH was the primary environmental factor affecting soil N2O emission in nitro-fertilized farmland except for N application amount. Han et al. [54] analyzed in-situ field observations of 38 forest ecosystems in the world and found that soil pH was the most important factor affecting soil N2O emission. Soil pH can affect the production of N2O in the soil through the influence of soil microorganisms and enzyme activities [55]. As such, nitrification and denitrification are sensitive to soil pH. Source of N input is also important as it may affect pH in the rhizosphere. Our results also demonstrate that soil C availability can moderate the effect of N addition on N2O emissions from the alpine grassland soils. Similarly, Domeignoz-Horta et al. [56] found that soil properties such as pH and organic matter content were major contributing factors for variation in N2O emissions. Although the Pearson correlation analysis showed that N2O flux was not significantly correlated with soil WFPS, there was a clear pattern for the concurrence of N2O flux peaks and rainfall events or increasing WFPS. The linear multiple regression identified soil WFPS and temperature as contributing factors for variation in soil N2O flux in this study. Soil moisture could indirectly affect N2O emissions through its effect on soil DOC and N availability. Together, these results confirm that soil DOC, pH and moisture are important factors affecting N2O emissions from grassland soils. Future studies should focus on how the changes of these soil environmental factors affect the microbial processes of production and reduction of N2O in soils.

5. Conclusions

In the present study, we evaluated the effect of different N fertilizer rates on soil N2O emission from alpine grassland on Kunlun Mountain. Results showed that the N2O fluxes increased with N addition rates and showed different episodic changes between the two growing seasons. The seasonal variation was attributed to differences in soil moisture conditions and N availability. Increasing N rates over 60 kg N ha−1 yr−1 did not further significantly increase grassland biomass production. Therefore, the optimal N addition rate for semi-arid alpine grassland on Kunlun Mountains should be 60 kg N ha−1 yr−1. Our results demonstrated a linear increase of the cumulative N2O emission in response to N addition rates, suggesting a proper level of N addition plays a key role in ensuring grassland production while reducing greenhouse gas emissions. Future work is required to investigate the environmental effect of long-term N addition and its interaction with other nutrients, such as phosphorus.

Author Contributions

Conceptualization and methodology, X.G.; investigation, D.C.; data curation, Y.W.; writing—original draft preparation, Y.W.; writing—review and editing, Y.W. and X.G.; visualization, L.L.; supervision, F.Z.; project administration, D.C.; funding acquisition, X.G. and X.L. All authors have read and agreed to the published version of the manuscript.

Funding

This research was funded by the National Natural Science Foundation of China (no. 31870499), and the Poverty Alleviation Program of the Chinese Academy of Sciences (KFJFP-201903).

Institutional Review Board Statement

Not applicable.

Informed Consent Statement

Not applicable.

Data Availability Statement

The data presented in this study are available on request from the corresponding author.

Conflicts of Interest

The authors declare no conflict of interest.

References

  1. Intergovernmental Panel on Climate Change-IPCC. Climate Change 2013: The Physical Science Basis. Contribution of Working Group I to the Fifth Assessment Report of the Intergovernmental Panel on Climate Change; Cambridge University Press: New York, NY, USA, 2013. [Google Scholar]
  2. Shcherbak, I.; Millar, N.; Robertson, G. Global metaanalysis of the nonlinear response of soil nitrous oxide (N2O) emissions to fertilizer nitrogen. Proc. Natl. Acad. Sci. USA 2014, 111, 9199–9204. [Google Scholar] [CrossRef] [Green Version]
  3. Xu, R.; Tian, H.; Pan, S.; Prior, S.A.; Dangal, S. Global N2O emissions from cropland driven by nitrogen addition and envi-ronmental factors: Comparison and uncertainty analysis. Glob. Biogeochem. Cycles 2020, 34, e2020GB006698. [Google Scholar] [CrossRef]
  4. Du, R.; Lu, D.; Wang, G. Diurnal, seasonal, and inter-annual variations of N2O fluxes from native semi-arid grassland soils of inner Mongolia. Soil Biol. Biochem. 2006, 38, 3474–3482. [Google Scholar] [CrossRef]
  5. Allard, V.; Soussana, J.-F.; Falcimagne, R.; Berbigier, P.; Bonnefond, J.; Ceschia, E.; D’Hour, P.; Hénault, C.; Laville, P.; Martin, C.; et al. The role of grazing management for the net biome productivity and greenhouse gas budget (CO2, N2O and CH4) of semi-natural grassland. Agric. Ecosyst. Environ. 2007, 121, 47–58. [Google Scholar] [CrossRef]
  6. Kang, L.; Han, X.; Zhang, Z.; Sun, O. Grassland ecosystems in China: Review of current knowledge and research advancement. Philos. Trans. R. Soc. B Biol. Sci. 2007, 362, 997–1008. [Google Scholar] [CrossRef]
  7. Tian, H.; Yang, J.; Xu, R.; Lu, C.; Canadell, J.G.; Davidson, E.A.; Jackson, R.B.; Arneth, A.; Chang, J.; Ciais, P.; et al. Global soil nitrous oxide emissions since the preindustrial era estimated by an ensemble of terrestrial biosphere models: Magnitude, attribution, and uncertainty. Glob. Chang. Biol. 2018, 25, 640–659. [Google Scholar] [CrossRef] [Green Version]
  8. Mummey, D.L.; Smith, J.L.; Bluhm, G. Estimation of Nitrous Oxide Emissions from US Grasslands. Environ. Manag. 2000, 25, 169–175. [Google Scholar] [CrossRef] [PubMed]
  9. Smith, K.A.; Conen, F. Impacts of land management on fluxes of trace greenhouse gases. Soil Use Manag. 2006, 20, 255–263. [Google Scholar] [CrossRef]
  10. Zhang, J.; Müller, C.; Cai, Z. Heterotrophic nitrification of organic N and its contribution to nitrous oxide emissions in soils. Soil Biol. Biochem. 2015, 84, 199–209. [Google Scholar] [CrossRef]
  11. Granli, T.; Bockman, O.C. Nitrous Oxide from Agriculture. Available online: https://agris.fao.org/agris-search/search.do?recordID=NO9500232 (accessed on 25 July 2021).
  12. Yan, Y.; Ganjurjav, H.; Hu, G.; Liang, Y.; Li, Y.; He, S.; Danjiu, L.; Yang, J.; Gao, Q. Nitrogen deposition induced significant increase of N2O emissions in an dry alpine meadow on the central Qinghai–Tibetan Plateau. Agric. Ecosyst. Environ. 2018, 265, 45–53. [Google Scholar] [CrossRef]
  13. Dangal, S.R.S.; Tian, H.; Xu, R.; Chang, J.; Canadell, J.G.; Ciais, P.; Pan, S.; Yang, J.; Zhang, B. Global Nitrous Oxide Emissions From Pasturelands and Rangelands: Magnitude, Spatiotemporal Patterns, and Attribution. Glob. Biogeochem. Cycles 2019, 33, 200–222. [Google Scholar] [CrossRef]
  14. Weitz, A.; Linder, E.; Frolking, S.; Crill, P.; Keller, M. N2O emissions from humid tropical agricultural soils: Effects of soil moisture, texture and nitrogen availability. Soil Biol. Biochem. 2001, 33, 1077–1093. [Google Scholar] [CrossRef]
  15. Erguder, T.H.; Boon, N.; Wittebolle, L.; Marzorati, M.; Verstraete, W. Environmental factors shaping the ecological niches of ammonia-oxidizing archaea. FEMS Microbiol. Rev. 2009, 33, 855–869. [Google Scholar] [CrossRef] [PubMed] [Green Version]
  16. Kroeze, C.; Mosier, A.; Bouwman, L. Closing the global N2O budget: A retrospective analysis 1500–1994. Glob. Biogeochem. Cycles 1999, 13, 1–8. [Google Scholar] [CrossRef]
  17. Van Lent, J.; Hergoualc’H, K.; Verchot, L.V. Reviews and syntheses: Soil N2O and NO emissions from land use and land-use change in the tropics and subtropics: A meta-analysis. Biogeosciences 2015, 12, 7299–7313. [Google Scholar] [CrossRef] [Green Version]
  18. Bell, M.J.; Cloy, J.M.; Topp, C.; Ball, B.C.; Bagnall, A.; Rees, R.; Chadwick, D.R. Quantifying N2O emissions from intensive grassland production: The role of synthetic fertilizer type, application rate, timing and nitrification inhibitors. J. Agric. Sci. 2016, 154, 812–827. [Google Scholar] [CrossRef] [Green Version]
  19. Geng, F.; Li, K.; Liu, X.; Gong, Y.; Yue, P.; Li, Y.; Han, W. Long-term effects of N deposition on N2O emission in an alpine grassland of Central Asia. Catena 2019, 182, 104100. [Google Scholar] [CrossRef]
  20. Luo, C.; Wang, S.; Zhang, L.; Wilkes, A.; Zhao, L.; Zhao, X.; Xu, S.; Xu, B. CO2, CH4 and N2O fluxes in an alpine meadow on the Tibetan Plateau as affected by N-addition and grazing exclusion. Nutr. Cycl. Agroecosyst. 2020, 117, 29–42. [Google Scholar] [CrossRef] [Green Version]
  21. Li, K.; Gong, Y.; Song, W.; He, G.; Hu, Y.; Tian, C.; Liu, X. Responses of CH4, CO2 and N2O fluxes to increasing nitrogen deposition in alpine grassland of the Tianshan Mountains. Chemosphere 2012, 88, 140–143. [Google Scholar] [CrossRef] [PubMed]
  22. Zhao, Z.; Dong, S.; Jiang, X.; Liu, S.; Ji, H.; Li, Y.; Han, Y.; Sha, W. Effects of warming and nitrogen deposition on CH4, CO2 and N2O emissions in alpine grassland ecosystems of the Qinghai-Tibetan Plateau. Sci. Total. Environ. 2017, 592, 565–572. [Google Scholar] [CrossRef]
  23. Peng, Q.; Qi, Y.; Dong, Y.; Xiao, S.; He, Y. Soil nitrous oxide emissions from a typical semiarid temperate steppe in inner Mongolia: Effects of mineral nitrogen fertilizer levels and forms. Plant Soil 2011, 342, 345–357. [Google Scholar] [CrossRef] [Green Version]
  24. Wei, D.; Xu, R.; Liu, Y.; Wang, Y.; Wang, Y. Three-year study of CO2 efflux and CH4/N2O fluxes at an alpine steppe site on the central Tibetan Plateau and their responses to simulated N deposition. Geoderma 2014, 232, 88–96. [Google Scholar] [CrossRef]
  25. Gu, X.; Wang, Y.; Laanbroek, H.J.; Xu, X.; Song, B.; Huo, Y.; Chen, S.; Li, L.; Zhang, L. Saturated N2O emission rates occur above the nitrogen deposition level predicted for the semi-arid grasslands of Inner Mongolia, China. Geoderma 2019, 341, 18–25. [Google Scholar] [CrossRef]
  26. Bouwman, L. Direct emission of nitrous oxide from agricultural soils. Nutr. Cycl. Agroecosyst. 1996, 46, 53–70. [Google Scholar] [CrossRef]
  27. Dobbie, K.E.; McTaggart, I.P.; Smith, K.A. Nitrous oxide emissions from intensive agricultural systems: Variations between crops and seasons, key driving variables, and mean emission factors. J. Geophys. Res. Space Phys. 1999, 104, 26891–26899. [Google Scholar] [CrossRef]
  28. Cardenas, L.; Thorman, R.; Ashlee, N.; Butler, M.; Chadwick, D.; Chambers, B.; Cuttle, S.; Donovan, N.; Kingston, H.; Lane, S. Quantifying annual N2O emission fluxes from grazed grassland under a range of inorganic fertiliser nitrogen inputs. Agric. Ecosyst. Environ. 2010, 136, 218–226. [Google Scholar] [CrossRef]
  29. Kim, D.-G.; Mishurov, M.; Kiely, G. Effect of increased N use and dry periods on N2O emission from a fertilized grassland. Nutr. Cycl. Agroecosyst. 2010, 88, 397–410. [Google Scholar] [CrossRef]
  30. Kim, D.-G.; Ramirez, G.H.; Giltrap, D. Linear and nonlinear dependency of direct nitrous oxide emissions on fertilizer nitrogen input: A meta-analysis. Agric. Ecosyst. Environ. 2013, 168, 53–65. [Google Scholar] [CrossRef]
  31. Peng, Y.; Wang, G.; Li, F.; Zhou, G.; Yang, G.; Fang, K.; Liu, L.; Qin, S.; Zhang, D.; Yang, Y. Soil Temperature Dynamics Modulate N2O Flux Response to Multiple Nitrogen Additions in an Alpine Steppe. J. Geophys. Res. Biogeosci. 2018, 123, 3308–3319. [Google Scholar] [CrossRef]
  32. Li, L.; Gao, X.; Li, X.; Lin, L.; Zeng, F.; Gui, D.; Lu, Y. Nitrogen (N) and phosphorus (P) resorption of two dominant alpine perennial grass species in response to contrasting N and P availability. Environ. Exp. Bot. 2016, 127, 37–44. [Google Scholar] [CrossRef]
  33. Fang, S.; Yan, J.; Che, M.; Zhu, Y.; Liu, Z.; Pei, H.; Zhang, H.; Xu, G.; Lin, X. Climate change and the ecological responses in Xinjiang, China: Model simulations and data analyses. Quat. Int. 2013, 311, 108–116. [Google Scholar] [CrossRef]
  34. Carter, M.R. Soil sampling and methods of analysis. J. Environ. Qual. 1993, 38, 15–24. [Google Scholar]
  35. Yue, P.; Li, K.; Gong, Y.; Hu, Y.; Mohammat, A.; Christie, P.; Liu, X. A five-year study of the impact of nitrogen addition on methane uptake in alpine grassland. Sci. Rep. 2016, 6, 32064. [Google Scholar] [CrossRef] [PubMed] [Green Version]
  36. Yin, M.; Gao, X.; Tenuta, M.; Li, L.; Gui, D.; Li, X.; Zeng, F. Enhancement of N2O emissions by grazing is related to soil physicochemical characteristics rather than nitrifier and denitrifier abundances in alpine grassland. Geoderma 2020, 375, 114511. [Google Scholar] [CrossRef]
  37. Pedersen, A.R. HMR: Flux Estimation with Static Chamber Data. R Package Version 0.3.1. 2011. Available online: https://cran.r-project.org/web/packages/HMR/index.html (accessed on 10 February 2018).
  38. Kuang, W.; Gao, X.; Gui, D.; Tenuta, M.; Flaten, D.N.; Yin, M.; Zeng, F. Effects of fertilizer and irrigation management on nitrous oxide emission from cotton fields in an extremely arid region of northwestern China. Field Crop. Res. 2018, 229, 17–26. [Google Scholar] [CrossRef]
  39. Jiang, C.; Yu, G.; Fang, H.; Cao, G.; Li, Y. Short-term effect of increasing nitrogen deposition on CO2, CH4 and N2O fluxes in an alpine meadow on the Qinghai-Tibetan Plateau, China. Atmos. Environ. 2010, 44, 2920–2926. [Google Scholar] [CrossRef]
  40. IPCC. IPCC Guidelines for National Greenhouse Gas Inventories; IPCC/IGES: Hayama, Japan, 2006. [Google Scholar]
  41. Cardenas, L.; Bhogal, A.; Chadwick, D.; McGeough, K.; Misselbrook, T.; Rees, R.; Thorman, R.; Watson, C.; Williams, J.; Smith, K.; et al. Nitrogen use efficiency and nitrous oxide emissions from five UK fertilised grasslands. Sci. Total Environ. 2019, 661, 696–710. [Google Scholar] [CrossRef] [PubMed]
  42. Patten, D.K.; Bremner, J.M.; Blackmer, A.M. Effects of Drying and Air-dry Storage of Soils on Their Capacity for Denitrification of Nitrate. Soil Sci. Soc. Am. J. 1980, 44, 67–70. [Google Scholar] [CrossRef]
  43. Zheng, X.; Wang, M.; Wang, Y.; Shen, R.; Gou, J.; Li, J.; Jin, J.; Li, L. Impacts of soil moisture on nitrous oxide emission from croplands: A case study on the rice-based agro-ecosystem in Southeast China. Chemosphere Glob. Chang. Sci. 2000, 2, 207–224. [Google Scholar] [CrossRef]
  44. Davidson, E.A. Soil Water Content and the Ratio of Nitrous Oxide to Nitric Oxide Emitted from Soil. In Biogeochemistry of Global Change; Oremland, R.S., Ed.; Springer: Boston, MA, USA, 1993. [Google Scholar] [CrossRef]
  45. Hyde, B.P.; Hawkins, M.J.; Fanning, A.F.; Noonan, D.; Ryan, M.; Toole, P.O.; Carton, O.T. Nitrous Oxide Emissions from a Fertilized and Grazed Grassland in the South East of Ireland. Nutr. Cycl. Agroecosyst. 2006, 75, 187–200. [Google Scholar] [CrossRef]
  46. Jones, S.; Rees, R.; Skiba, U.; Ball, B. Influence of organic and mineral N fertiliser on N2O fluxes from a temperate grassland. Agric. Ecosyst. Environ. 2007, 121, 74–83. [Google Scholar] [CrossRef]
  47. Kitzler, B.; Zechmeisterboltenstern, S.; Holtermann, C.; Skiba, U.M.; Butterbach-Bahl, K. Controls over N2O, NOx and CO2 fluxes in a calcareous mountain forest soil. Biogeosciences 2006, 3, 383–395. [Google Scholar] [CrossRef] [Green Version]
  48. Grant, R.F.; Pattey, E.; Goddard, T.W.; Kryzanowski, L.M.; Puurveen, H. Modeling the Effects of Fertilizer Application Rate on Nitrous Oxide Emissions. Soil Sci. Soc. Am. J. 2006, 70, 235–248. [Google Scholar] [CrossRef]
  49. Frunzke, K.; Meyer, O. Nitrate respiration, denitrification, and utilization of nitrogen sources by aerobic carbon monoxide-oxidizing bacteria. Arch. Microbiol. 1990, 154, 168–174. [Google Scholar] [CrossRef]
  50. Malghani, S.; Kim, J.; Lee, S.-H.; Yoo, G.-Y.; Kang, H. Application of two contrasting rice-residue-based biochars triggered gaseous loss of nitrogen under denitrification-favoring conditions: A short-term study based on acetylene inhibition technique. Appl. Soil Ecol. 2018, 127, 112–119. [Google Scholar] [CrossRef]
  51. Bai, Y.; Wu, J.; Clark, C.M.; Naeem, S.; Pan, Q.; Huang, J.; Zhang, L.; Han, X. Tradeoffs and thresholds in the effects of nitrogen addition on biodiversity and ecosystem functioning: Evidence from inner Mongolia Grasslands. Glob. Chang. Biol. 2010, 16, 358–372. [Google Scholar] [CrossRef]
  52. Chen, H.; Mothapo, N.V.; Shi, W. Soil Moisture and pH Control Relative Contributions of Fungi and Bacteria to N2O Production. Microb. Ecol. 2014, 69, 180–191. [Google Scholar] [CrossRef]
  53. Wang, Y.; Guo, J.; Vogt, R.D.; Mulder, J.; Wang, J.; Zhang, X. Soil pH as the chief modifier for regional nitrous oxide emissions: New evidence and implications for global estimates and mitigation. Glob. Chang. Biol. 2017, 24, e617–e626. [Google Scholar] [CrossRef] [PubMed]
  54. Han, L.; Wang, G.; Wang, W.; Zhao, X. Factors affecting global forest soil N2O emission flux. Chin. J. Ecol. 2012, 31, 446–452. (In Chinese) [Google Scholar]
  55. He, M.; Dijkstra, F.A. Phosphorus addition enhances loss of nitrogen in a phosphorus-poor soil. Soil Biol. Biochem. 2015, 82, 99–106. [Google Scholar] [CrossRef]
  56. Horta, L.A.D.; Philippot, L.; Peyrard, C.; Bru, D.; Breuil, M.-C.; Bizouard, F.; Justes, E.; Mary, B.; Leonard, J.; Spor, A. Peaks of in situ N2O emissions are influenced by N2O-producing and reducing microbial communities across arable soils. Glob. Chang. Biol. 2017, 24, 360–370. [Google Scholar] [CrossRef] [PubMed]
Figure 1. Location of field station.
Atmosphere 12 00976 g001
Figure 2. Daily soil N2O flux rate, soil concentrations of NO3-N, NH4+-N, and dissolved organic carbon (DOC), and pH as affected by N addition treatments, and daily precipitation, and WFPS at 5 cm soil depth in 2017 and 2018. * indicates significant treatment effect at p < 0.05. Arrows indicate the dates of N addition.
Atmosphere 12 00976 g002
Figure 3. Relationship between cumulative N2O emissions and N addition rates over the 2017 and 2018 growing seasons (n = 6). Mean ± standard error (n = 4) is presented.
Atmosphere 12 00976 g003
Table 1. Cumulative N2O emissions (ƩN2O) and applied-N scaled emission factors (EF) as affected by N addition treatments in 2017 and 2018 growing seasons.
TreatmentƩN2O (kg N ha−1)EF (%)
20172018Total20172018Average
Control0.3 ± 0.1 b0.3 ± 0.1 c0.7---
N100.4 ± 0.1 b0.4 ± 0.1 bc0.80.9 ± 0.6 a0.8 ± 0.3 a0.8 ± 0.5 a
N300.4 ± 0.1 b0.4 ± 0.1 bc0.80.2 ± 0.3 a0.2 ± 0.2 a0.2 ± 0.2 a
N600.6 ± 0.1 ab0.5 ± 0.1 abc1.20.5 ± 0.1 a0.3 ± 0.1 a0.5 ± 0.2 a
N1200.9 ± 0.2 a0.8 ± 0.1 ab1.70.5 ± 0.1 a0.4 ± 0.1 a0.4 ± 0.1 a
N2401.1 ± 0.2 a1.0 ± 0.1 a2.10.3 ± 0.1 a0.3 ± 0.1 a0.3 ± 0.1 a
Mean ± standard error (n = 4) is presented. Means within a column followed by different letters are significantly different at p < 0.05.
Table 2. Pearson correlation of daily N2O flux rate with environmental variables.
NO3-NNH4+-NDOCpHAir Temp.Soil Temp.PrecipitationWFPS
N2O flux−0.016−0.0120.370 **0.273 *−0.0350.0270.0580.051
*, ** Indicates significance at p < 0.05 and <0.001, respectively.
Table 3. Plant above-ground biomass as affected by different N addition rates in 2017.
TreatmentPlant Above-Ground Biomass (g m−2)
JuneJulyAugust
Control100 ± 11a158 ± 13 c259 ± 6 d
N10105 ± 9 a166 ± 13 bc274 ± 4 cd
N3095 ± 8 b177 ± 9 abc291 ± 5 bc
N60100 ± 6 a201 ± 34 abc313 ± 22 ab
N120107 ± 2 a224 ± 8 a342 ± 14 a
N240119 ± 10 a216 ± 12 ab325 ± 7 ab
Mean ± standard error (n = 4) is presented. Means within a column followed by different letters are significantly different at p < 0.05.
Publisher’s Note: MDPI stays neutral with regard to jurisdictional claims in published maps and institutional affiliations.

