Article

Short-Term Assessment of Nitrous Oxide and Methane Emissions on a Crop Yield Basis in Response to Different Organic Amendment Types in Sichuan Basin

1
Key Laboratory of Mountain Surface Processes and Ecological Regulation, Institute of Mountain Hazards and Environment, Chinese Academy of Sciences, Chengdu 610041, China
2
University of Chinese Academy of Sciences, Beijing 100049, China
3
School of Science and the Environment, Grenfell Campus, Memorial University of Newfoundland, Corner Brook, NL A2H 5G4, Canada
4
Institut Supérieur Agronomique et Vétérinaire de Faranah (ISAV/F), Faranah 131, Guinea
*
Authors to whom correspondence should be addressed.
Atmosphere 2021, 12(9), 1104; https://doi.org/10.3390/atmos12091104
Submission received: 2 July 2021 / Revised: 20 August 2021 / Accepted: 24 August 2021 / Published: 26 August 2021
(This article belongs to the Special Issue Agricultural Greenhouse Gas Emissions)

Abstract

:
Agriculture’s goal to meet the needs of the increasing world population while reducing the environmental impacts of nitrogen (N) fertilizer use without compromising output has proven to be a challenge. Manure and composts have displayed the potential to increase soil fertility. However, their potential effects on nitrous oxide (N2O) and methane (CH4) emissions have not been properly understood. Using field-scaled lysimeter experiments, we conducted a one-year study to investigate N2O and CH4 emissions, their combined global warming potential (GWP: N2O + CH4) and yield-scaled GWP in a wheat-maize system. One control and six different organic fertilizer treatments receiving different types but equal amounts of N fertilization were used: synthetic N fertilizer (NPK), 30% pig manure + 70% synthetic N fertilizer (PM30), 50% pig manure + 50% synthetic N fertilizer (PM50), 70% pig manure + 30% synthetic N fertilizer (PM70), 100% pig manure (PM100), 50% cow manure-crop residue compost + 50% synthetic N fertilizer (CMRC), and 50% pig manure-crop residue compost + 50% synthetic N fertilizer (PMRC). Seasonal cumulative N2O emissions ranged from 0.39 kg N ha−1 for the PMRC treatment to 0.93 kg N ha−1 for the NPK treatment. Similar CH4 uptakes were recorded across all treatments, with values ranging from −0.68 kg C ha−1 for the PM50 treatment to −0.52 kg C ha−1 for the PM30 treatment. Compared to the NPK treatment, all the organic-amended treatments significantly decreased N2O emission by 32–58% and GWP by 30–61%. However, among the manure-amended treatments, only treatments that consisted of inorganic N with lower or equal proportions of organic manure N treatments were found to reduce N2O emissions while maintaining crop yields at high levels. Moreover, of all the organic-amended treatments, PMRC had the lowest yield-scaled GWP, owing to its ability to significantly reduce N2O emissions while maintaining high crop yields, highlighting it as the most suitable organic fertilization treatment in Sichuan basin wheat-maize systems.

1. Introduction

Greenhouse gas (GHG) emissions from agricultural ecosystems continue to remain a major source of concern due to agriculture’s net contribution to global radiative forcing. The contribution of agriculture to atmospheric GHG emissions accounts for about one-third of the total emissions when direct energy use, fertilizer and pesticide manufacturing, indirect livestock emissions, the use of machinery and equipment, land degradation, harvest and residue management, and land-use change are taken into consideration [1]. Nowadays, agricultural GHG emissions are continually on the increase due to the intensification of conventional agricultural practices, which seek to meet the increasing demand for global food production to feed the teeming world population [2]. However, with proper management, greenhouse gas emissions associated with agriculture can be reduced significantly [3,4]. In order to overcome the triple issues of food sustainability, environmental degradation, and global warming, the application of organic amendment on farmlands could present the opportunity to reduce the intensive reliance on synthetic fertilizers, protect the environment, further improve crop yields, retain soil fertility, and ultimately mitigate GHG emissions [3,5].
China has a massive potential for mainstreaming organic amendment application to farmland [1]. The country produces over 600 Tg of crop residues and has the capacity to generate more than 3.8 Tg of nitrogen annually [6]. Similarly, China produces about 3.8 Tg of manure annually, which has the potential of generating up to 262 billion RMB (40.5 billion USD) in yearly revenue and can satisfy its current nitrogen (N) demands by as much as 50% [7,8]. China’s massive potential for organic amendment application has necessitated a wide range of studies seeking to understand the agronomic and environmental impacts of organic amendments on agricultural soils [8,9,10]. For example, Zhou et al. (2013) have found out that organic amended soils could produce yields similar to that of the conventional N fertilizer treatments in Sichuan wheat-maize systems [5]. Yao et al. (2009) observed that applying organic amendments could decrease GHG emissions by up to 32% compared to conventional N fertilizers while showing the same, or even an increase in crop yields with respect to conventional N fertilizer treatments [11].
Nitrous oxide (N2O) and methane (CH4) are important greenhouse gasses, most especially in agriculture, [12] as agriculture contributes about 60% and 47% to the overall anthropogenic emissions for N2O and CH4, respectively, primarily from soils and N inputs to soil systems [12]. An increasing number of studies are beginning to explore the dynamics of N2O and CH4 emissions and the processes that control them in fertilizer-amended soils. However, there remains a lot to be understood, most especially in organic-amended soils. N2O in agricultural soils is mainly produced through two microbial-mediated processes: nitrification and denitrification. Nitrification is the aerobic oxidation of ammonium (NH4+) to nitrate (NO3) via nitrite (NO2), with the production of nitric oxide (NO) and N2O as by-products. Denitrification is a process (or a series of processes) that converts NO3 to nitrogen gas (N2) through NO2, with NO and N2O as intermediates [13]. Environmental factors such as soil temperature, moisture, aeration, available C and N contents could significantly impact the microbial processes that drive N2O production in agricultural systems [14]. Similarly, the magnitude and direction of CH4 emissions could also be dependent on these factors [5,15]. Studies have demonstrated that the choice of fertilizer could have a significant impact on these soil conditions and, consequently, on N2O and CH4 emissions in soil systems [11,12,15]. However, at present, there is a wide range of contrasting reports about the effects of soil organic amendment on N2O and CH4 emission. As for N2O emissions in agricultural ecosystems, some studies have observed that soils amended with organic manures tend to boost N2O emissions in the soil [16,17,18], while others have noted that the integration of organic amendments such as animal manure with high quantities of labile carbon (C) into the soil could result in a decrease in N2O emissions, owing to the drop in N2O:N2 ratio during the denitrification process [19,20,21]. This is usually apparent in high-moisture environments, particularly under high precipitation or irrigation conditions [19,20,21]. As for CH4 fluxes, some reports have identified the role of N fertilization on soil’s CH4 uptake capacity [22]. Aronson and Helliker (2010) and Hütsch (2001) noted that N application could inhibit soil’s CH4 uptake capacity [23,24], while Bodelier et al. (2004), on the other hand, pointed out in their study that the CH4 uptake capacity of soils could be increased with N fertilizer inputs [25]. Different from the above results, Zhou et al. (2013) observed no significant difference in the CH4 uptake capacities of soils receiving the same amount but different types of N fertilizer [5]. However, it is unclear how differential increases in manure N ratio would influence N2O and CH4 emissions in upland soils if the same amount of total N in a fertilization combination is maintained. Conducting such research could help to properly understand how GHGs fluxes respond to differential increases in the ratio of manure N in fertilization treatments receiving the same quantity of N fertilizer, which could also guide in understanding the threshold above or below which organic amendment application would have a negative impact on crop productivity and atmospheric GHG emissions in Sichuan basin agroecosystems.
Additionally, some important research in agricultural waste management has studied the use of composts [26,27], digestates [28,29], biochars [30], and the direct application of organic wastes such as raw crop residues and manures to the soil [31,32]. While there have been extensive research studies on agricultural waste utilization, particularly in terms of how the incorporation of crop residues and organic manure contributes to air and water pollution, to date there is still a sparsity of studies on how compost utilization affects N2O and CH4 emissions, particularly in the Sichuan basin region of southwest China, which is an intensive agrarian region, responsible for up to 10% of China’s food production [33]. A location-specific investigation is essential because N2O and CH4 fluxes of different systems in one region could vary from another region due to differences in environmental factors and soil management practices [34]. Therefore, it is pertinent to understand how these GHG emissions respond to different organic amendments in a given cropping system.
The goals of the present article are to: (1) quantify the amount of N2O and CH4 emissions associated with different types of organic amendments in the Sichuan basin region of southwest China, (2) identify the drivers controlling GHG emissions in organic-amended wheat-maize purple soil systems in the Sichuan basin region of southwest China, and (3) assess the impact of N fertilizer types, and differential increase in the ratio of organic manure N on N2O and CH4 emissions on a crop-yield basis in the wheat-maize systems and to identify best management practices (BMPs) for N fertilization in the Sichuan basin region of southwest China. For this purpose, we utilized the static chamber-gas chromatography (GC) technique to account for the greenhouse gas fluxes associated with each fertilization treatment. Then we evaluated the yield-scaled global warming potential (GWP) associated with the N2O and CH4 emissions of each treatment. This is an important metric for accounting for agronomic efficiency and determining the BMPs that would reduce agricultural greenhouse emissions whilst maintaining high crop grain yields for a given agricultural system.

2. Materials and Methods

2.1. Experimental Site Description

The experimental study was carried out between November 2019 and September 2020 at the Yanting Agroecological Station of Purple Soil, in Yanting Sichuan, China (31°16′ N, 105°28′ E, and 420 m altitude, Figure 1). The study area has a moderate subtropical monsoon climate with a mean annual temperature of 16.6 °C and annual precipitation of 846.4 mm. The soil used in this study was the Eutric Regosols (FAO Soil Taxonomy), also known as Pup-Orthic-Entisols (Chinese Soil Taxonomy) [33], which is native to the agroecosystem in the area. The soil has a clay loam texture, a pH (H2O: soil of 2.5:1 w/w) of 8.22, a bulk density of 1.33 kg m−3, organic C content of 8.75 g kg−1 and a total N of 0.62 g kg−1 [35].
The experimental study site lies at the heart of the Sichuan Basin, an agrarian region with high agricultural potential. The region is suitable for wheat (Triticum aestivum L.), rice (Oryza sativa L.), maize (Zea mays L.), among other crops [5,9,35]. Most cropping systems around the zone are wheat-maize rotation-based, with wheat cultivation in the winter season and maize cultivation during summer around early June.

2.2. Experimental Design

The fertilization experiment was initiated in November 2019, and a winter wheat–summer maize cropping rotation was used. The experiment was laid out as a randomized complete block design consisting of seven treatments replicated four times. Each experimental plot was 1 m by 1 m in size. The winter wheat was sown at a plant density of 7,400,000 plants per hectare, while the summer maize season was sown at a plant density of 50,000 plants per hectare, with a plant spacing of 0.3 m.
A full synthetic fertilizer (NPK) was used as the control treatment, with all the fertilization treatments receiving the same amount but different types of N fertilization. For four of the treatments, pig manure was added in different proportions: 30%, 50%, 70% and 100%. Two different compost treatments were also applied. The composts were made by co-composting wheat straw and rapeseed residues with pig or cow manure, and were prepared according to the steps highlighted by Raza et al. (2020) [26]. N fertilization rate was kept constant across all the treatments at a rate of 280 kg N ha−1 yr−1, with 130 kg N ha−1 being applied for the winter wheat season and 150 kg N ha−1 for the summer maize season. The urea (46-0-0) was used as the chemical N fertilizer in our study.
Additionally, calcium superphosphate and potassium chloride were applied to each plot at the rate of 90 kg P2O5 ha−1 and 36 kg K2O ha−1, respectively. The fertilizers were added as basal fertilization at the beginning of each planting season. Planting and fertilization were undertaken on 7 November 2019 for the wheat season and on 5 June 2020 for the maize season, while harvesting took place on 9 May 2020 for the wheat season and on 29 September 2020 for the maize season. A scheme of the N fertilization plan is highlighted in Table 1, and the total C, N, phosphorus (P) and potassium (K) contents of the organic amendments used are given in Table 2.

2.3. Gas Sampling and Flux Measurement

The soil greenhouse gas fluxes associated with each treatment were measured using the static chamber-GC method from November 2019 to September 2020 [36,37]. The manual chambers had two components: the base collar and the chamber cover, all of which were made of stainless steel. The base collars were inserted at the center of each field plot at a depth of 0.1 m and held in place for the entire measurement duration. The chambers were wrapped with an insulating material to prevent the fluctuation of internal air temperature during sampling. For every GHG sampling session during the wheat season, the covers (0.5 m by 0.5 m by 0.5 m, length by width by height, respectively) were manually placed on the base collars and removed after each measurement session. The same chamber was used for the gas flux measurements during the early growth stages of the maize season. The chambers were then replaced when the maize plants grew beyond 45 cm. New bases were installed at the center of each plot, and smaller chamber covers (0.5 m by 0.5 m by 0.25 m, length by width by height, respectively) consisting of two parts were fixed around the growing maize plant at the center of the chamber base during every sampling session.
The gas samples were taken between 08:00 am–11:00 am, when the temperature was close to the average daily temperature, in order to reduce the effects of diurnal variations in GHG flux patterns [38].
In each field plot, GHG flux measurements were taken every day for the first week following fertilization, every other day during the second week, and twice a week for the rest of the planting season. For the wheat season, the collection of gas samples was shortened due to the coronavirus outbreak in January.
For the GHG flux measurements, five gas samples were taken from the chamber using 60 mL plastic syringes equipped with three-way stopcocks through a Teflon tube linked to the chamber every 7 min after closing the chamber during each sampling session, similar to the process described in Zhou et al. (2013) [5]. After gas collection, the gas samples were transported to the laboratory at the Yanting Agro-ecological Station of Purple Soil. Then the gas concentrations were analyzed within 24 h using a gas chromatograph (GC) (HP 5890II, Hewlett-Packard, Palo Alto, CA, USA) fitted with an electron capture detector (ECD) for N2O analysis and flame ionization detector (FID) for CH4 analysis. The comprehensive GC configurations used to evaluate the gases in this study are as described by Yuesi et al. (2003) [36].
The GHG concentration was converted to mass per volume accounting for auxiliary measurements such as actual air temperature, chamber volume, and ambient pressure per ideal gas law following Pelster et al. (2007) [39] as described in Equation (1).
F = b × M w × V ch × 60 × 10 6 A ch × V m × 10 9
where F is the flux rate (μg N m−2 day−1 or μg C m−2 day−1) for N2O and CH4, respectively, b (ppm min−1) is the slope of increase/decrease in concentration, Mw is the molecular weight of gas (g mol−1), VCh is chamber volume (m3), Ach is chamber area (m2), Vm is the corrected standard gaseous molar volume (m3 mol−1) given by Equation (2).
V m = 22.4 × 10 3   m 3   mol 1 × 273.15 + Temp 273.15 × air   pressure 1013
where Temp (°C) is the chamber air temperature at the time of sampling, and air pressure (hPa) is the atmospheric pressure recorded from the nearby meteorological station.
In this study, we adopted both linear and non-linear models for N2O and CH4 flux calculations. The choice of the model was informed by the degree of correlation. When there was a strong correlation (R2 > 0.95) for the nonlinear model, the second-order polynomial model was used; otherwise, the linear model was maintained, with at least three sampling points, similar to the method used in Pelster et al. (2012) [40]. The seasonal cumulative GHG fluxes were then obtained from the fluxes using a linear interpolation process.

2.4. Soil Analysis and Environmental Variable Measurements

We obtained soil samples at a depth of 5 cm and recorded soil temperatures using a manual thermoelectric thermometer (model JM624, Tianjin Jinming Instrument Co. Ltd., Tianjin, China). The moisture content of the soil (at a depth of 5 cm) was then determined using the simple drying method as described by Hillel (1971) [41].
The soil available N (NH4+ and NO3) was extracted by adding 6 g of soil samples to 30 mL 2 M potassium chloride (KCl) solution, and the extracts were stored at 4 °C until analysis. The dissolved organic C (DOC) in the soil was extracted by adding 6 g of each soil sample to 30 mL of distilled water and shaken for one hour, after which the supernatant was filtered with a 45 µm filter. Filtrates for DOC, NH4+, and NO3 were analyzed using a continuous flow autoanalyzer (model AA3, Bran + Luebbe, Norderstedt, Germany). The NH4+ concentrations were measured by heating with salicylate and hypochlorite in an alkaline phosphate buffer. Ethylenediaminetetraacetic acid (EDTA) was used in order to prevent the precipitation of calcium and magnesium. Sodium nitroprusside was added to improve sensitivity. The absorbance of the reaction product was measured at 660 nm and is directly proportional to the initial ammonia concentration. Soil NO3 concentrations in the filtrates were measured by reduction to NO2 using a copperized cadmium column. The NO2 content was then detected by diazotizing with sulfanilamide followed by coupling with N-(1-naphthyl) ethylenediamine dihydrochloride. The absorbance of the reaction product was then measured at 520 nm. Soil DOC contents were measured by converting all the DOC in the supernatant into CO2 by ultraviolet digestion, which was then measured at 254 nm.
Precipitation and other environmental data were obtained from the meteorological unit of the Yanting Agro-ecological Station of Purple Soil, approximately 50 m from the experimental plots. More information about this is available in the Supplementary Material section.

2.5. Crop Performance and Global Warming Potential

In addition to the GHG flux measurements, we also calculated the agronomic output on a dry yield basis from all treatments. At the end of the season, harvesting took place, and four replicates for each treatment were collected to measure crop grain yields after oven-drying the harvested grains at 70 °C for two days. The combined GWP (kg CO2 eq ha−1) associated with the soil N2O and CH4 fluxes for each treatment were obtained by adding the partial GWP of each greenhouse gas. The partial GWP (kg CO2 eq ha−1) for each gas was obtained according to Equation (3) below:
GWP partial = F cumm × C f × GWP 100
where Fcumm (kg N ha−1 or kg C ha−1) is the cumulative N2O or CH4 flux, Cf is the unit stoichiometric conversion factor associated with each gas (44/28 for N2O and 16/12 for CH4) to convert the weight of nitrogen to the weight of N2O and the weight of C to the weight of CH4, and GWP100 is the 100-year horizon GWP of each greenhouse gas relative to CO2 over a 100-year horizon (N2O: 298; CH4: 25) [12].
Changes in soil organic C (SOC) stocks following seven years of fertilization with organic manure (from 2003 to 2010) were not statistically significant (p > 0.05) [5]. Therefore, changes in soil SOC supplies were not accounted for in our estimates of GWP.
Furthermore, we scaled the combined GWP for N2O and CH4 from each fertilization treatment with crop grain yields as suggested by Linquist et al. (2012) [42] to determine how different fertilizer management techniques influence product-related GHG fluxes. That is, soil N2O and CH4 fluxes for each fertilized treatment were evaluated on the basis of the ratio of their GWP to grain yield [43].

2.6. Statistical Analysis

SPSS 16.0 (SPSS, Inc., Chicago, IL, USA) and Sigma plot 12.5 (Systat Software Inc., Chicago, IL, USA) were used for the statistical analyses and graphical presentation of our data, respectively. The cumulative N2O and CH4 emissions, combined GWP, yields and yield-scaled GWP associated with each fertilization treatment were compared using a one-way ANOVA. N2O flux data were log-transformed (y = log (x + 1)) before analysis. The value 1 was added to prevent negative log-transformed values from being produced. Similarly, soil NH4+, NO3 and DOC concentrations were log-transformed and compared using a one-way ANOVA. The differences between treatments were considered significant at p < 0.05. The association between weather and soil variables and N2O and CH4 fluxes were examined using Pearson’s correlation test.

3. Results

3.1. Environmental Variables

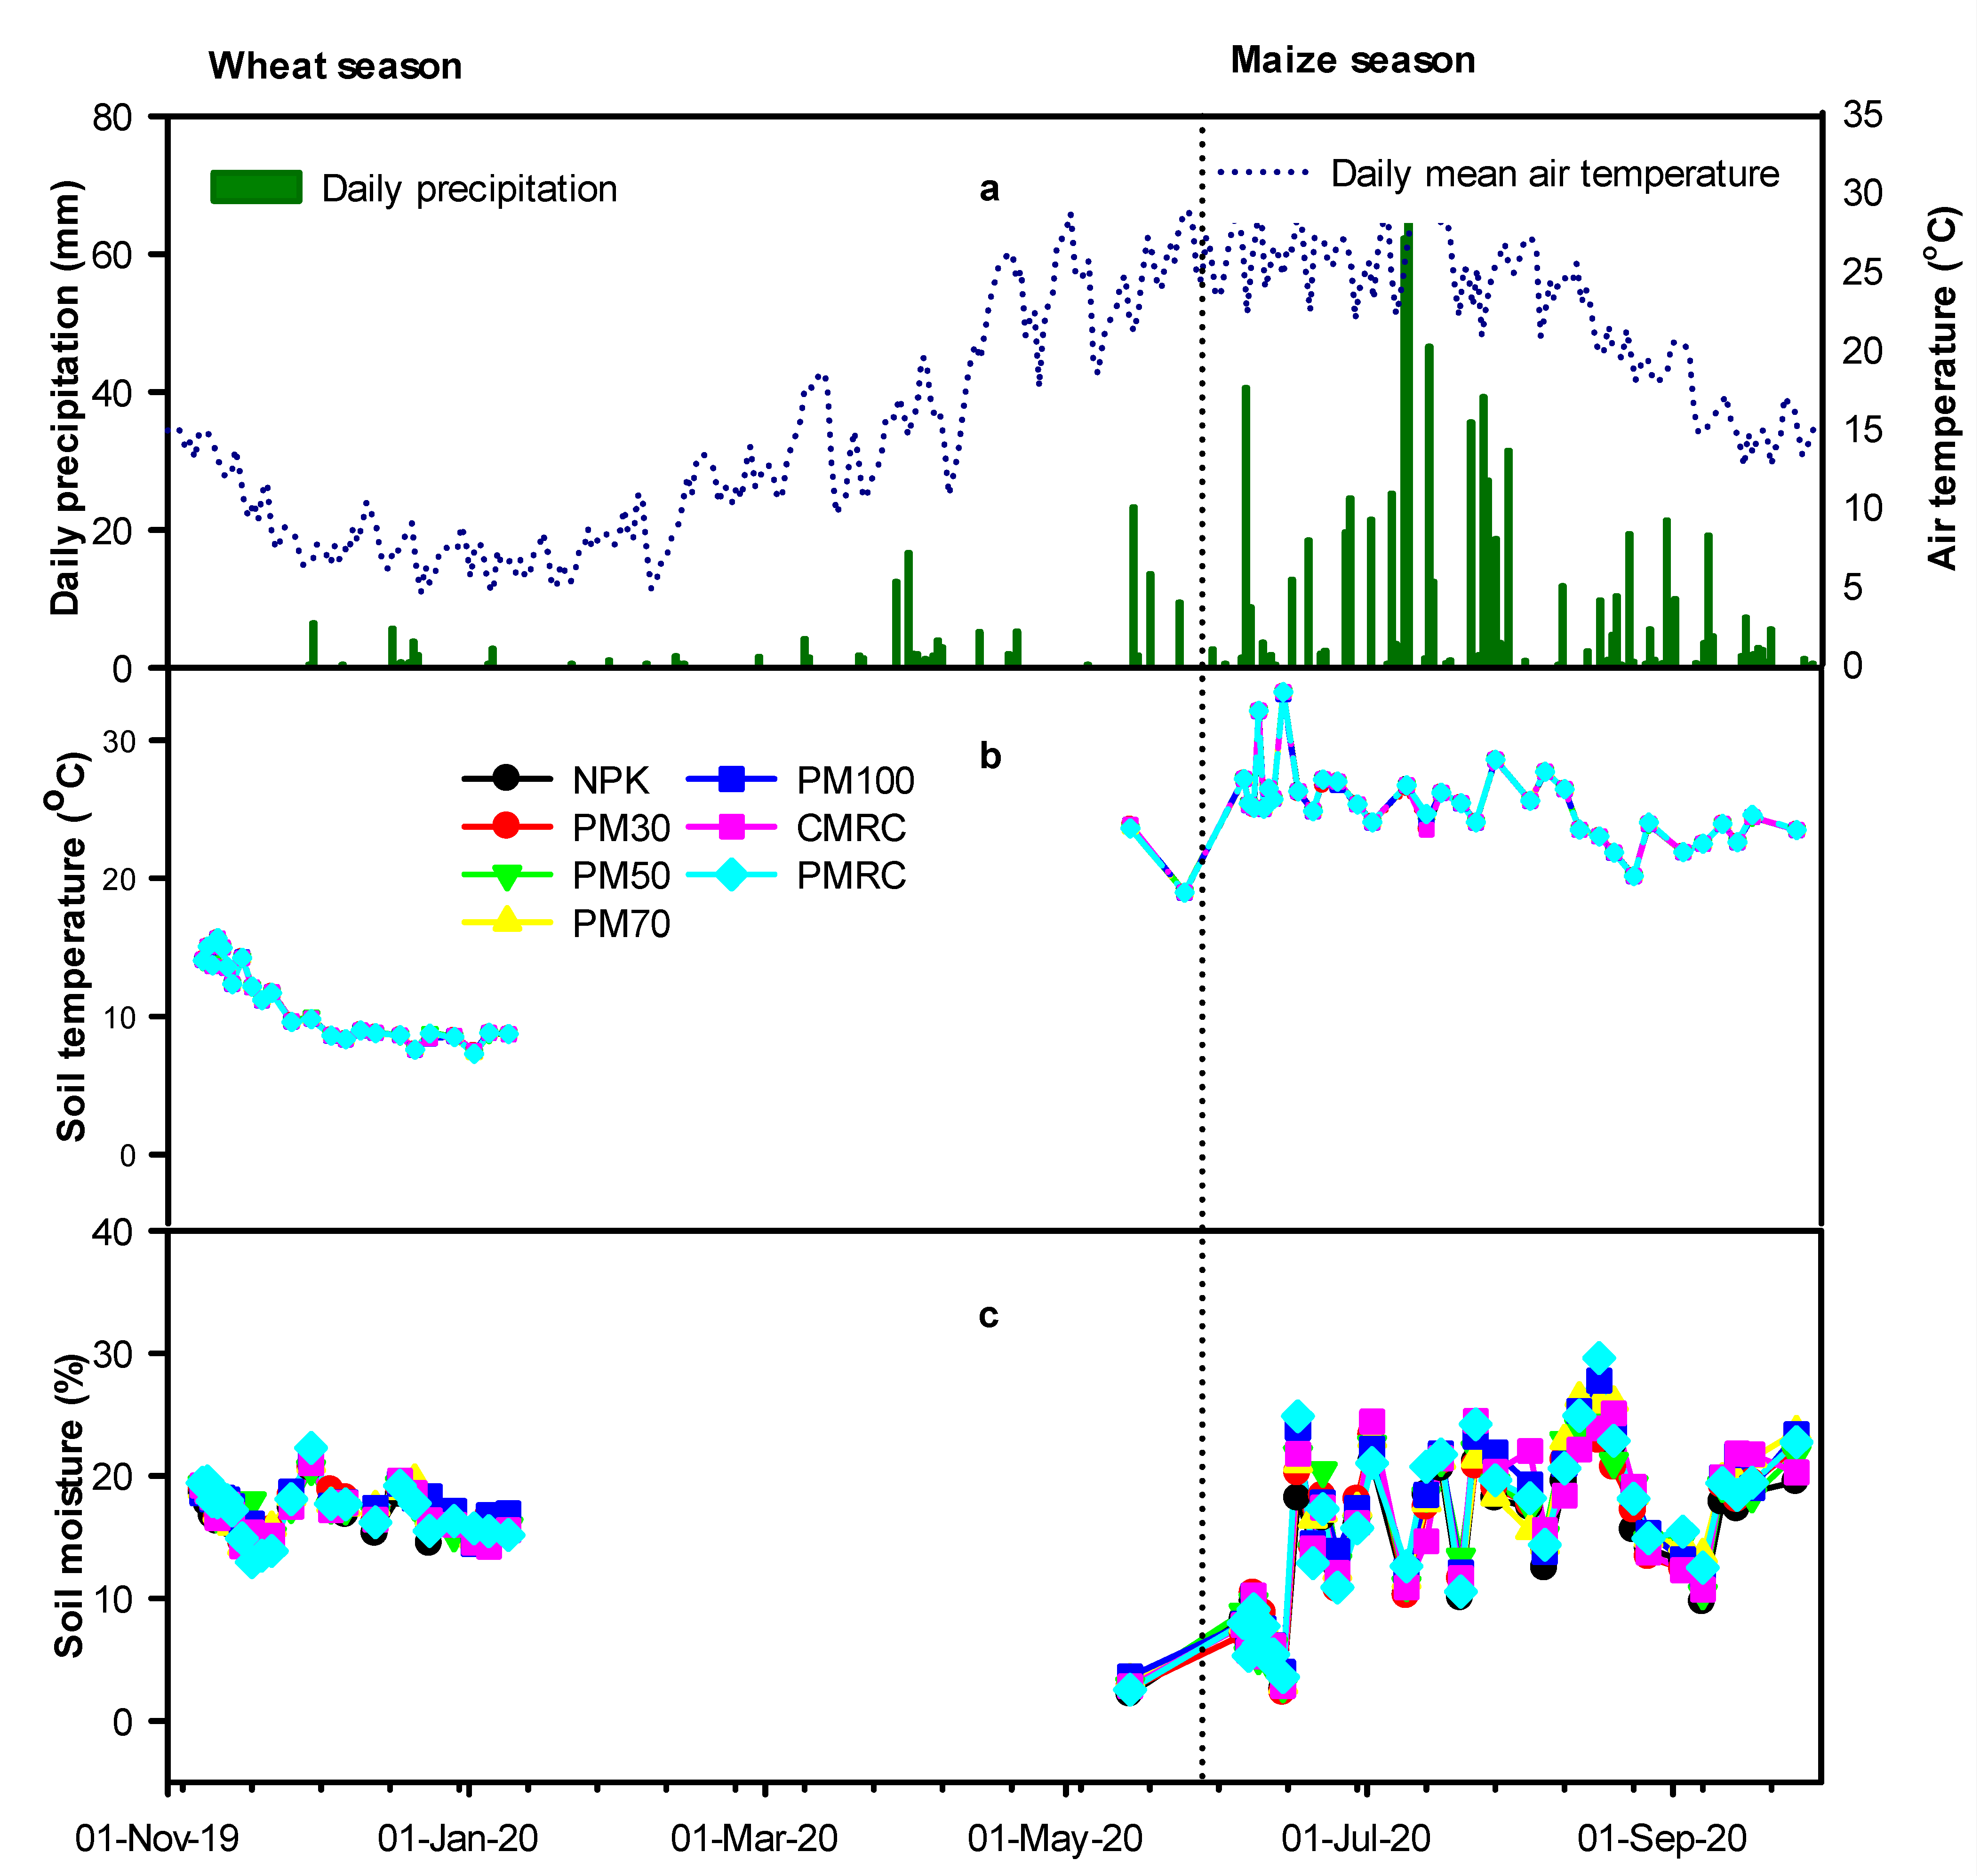
A total precipitation of 792 mm was recorded during the experimental period (Figure 2a), which was about 93% of the total precipitation throughout the year, and within the long-term normal values for the average annual precipitation observed in the area. The mean air temperature (17 °C) during the observation period was close to the long-term normal values for the mean annual temperature (Figure 2a). During the wheat season, the average air temperature was 12 °C with a range of 5 °C to 29 °C, and the average soil temperature at 5 cm depth was 12 °C (Figure 2b). Cumulative precipitation was only around 141.1 mm during the wheat season, and soil moisture ranged from 3% to 22% (Figure 2c). However, the cumulative precipitation during the maize season was 651 mm, accounting for close to 82% of cumulative precipitation observed throughout the experimental period. The average air temperature was 25 °C with a range of 18 °C to 30 °C, and the average soil temperature at 5 cm depth was 25 °C. The soil moisture varied greatly, ranging from 3% to 25%. There were no significant differences in soil temperature or moisture between the treatments during the experimental period (Figure 2b,c).

3.2. Effects of Different Fertilization Treatments on Soil Chemical Properties

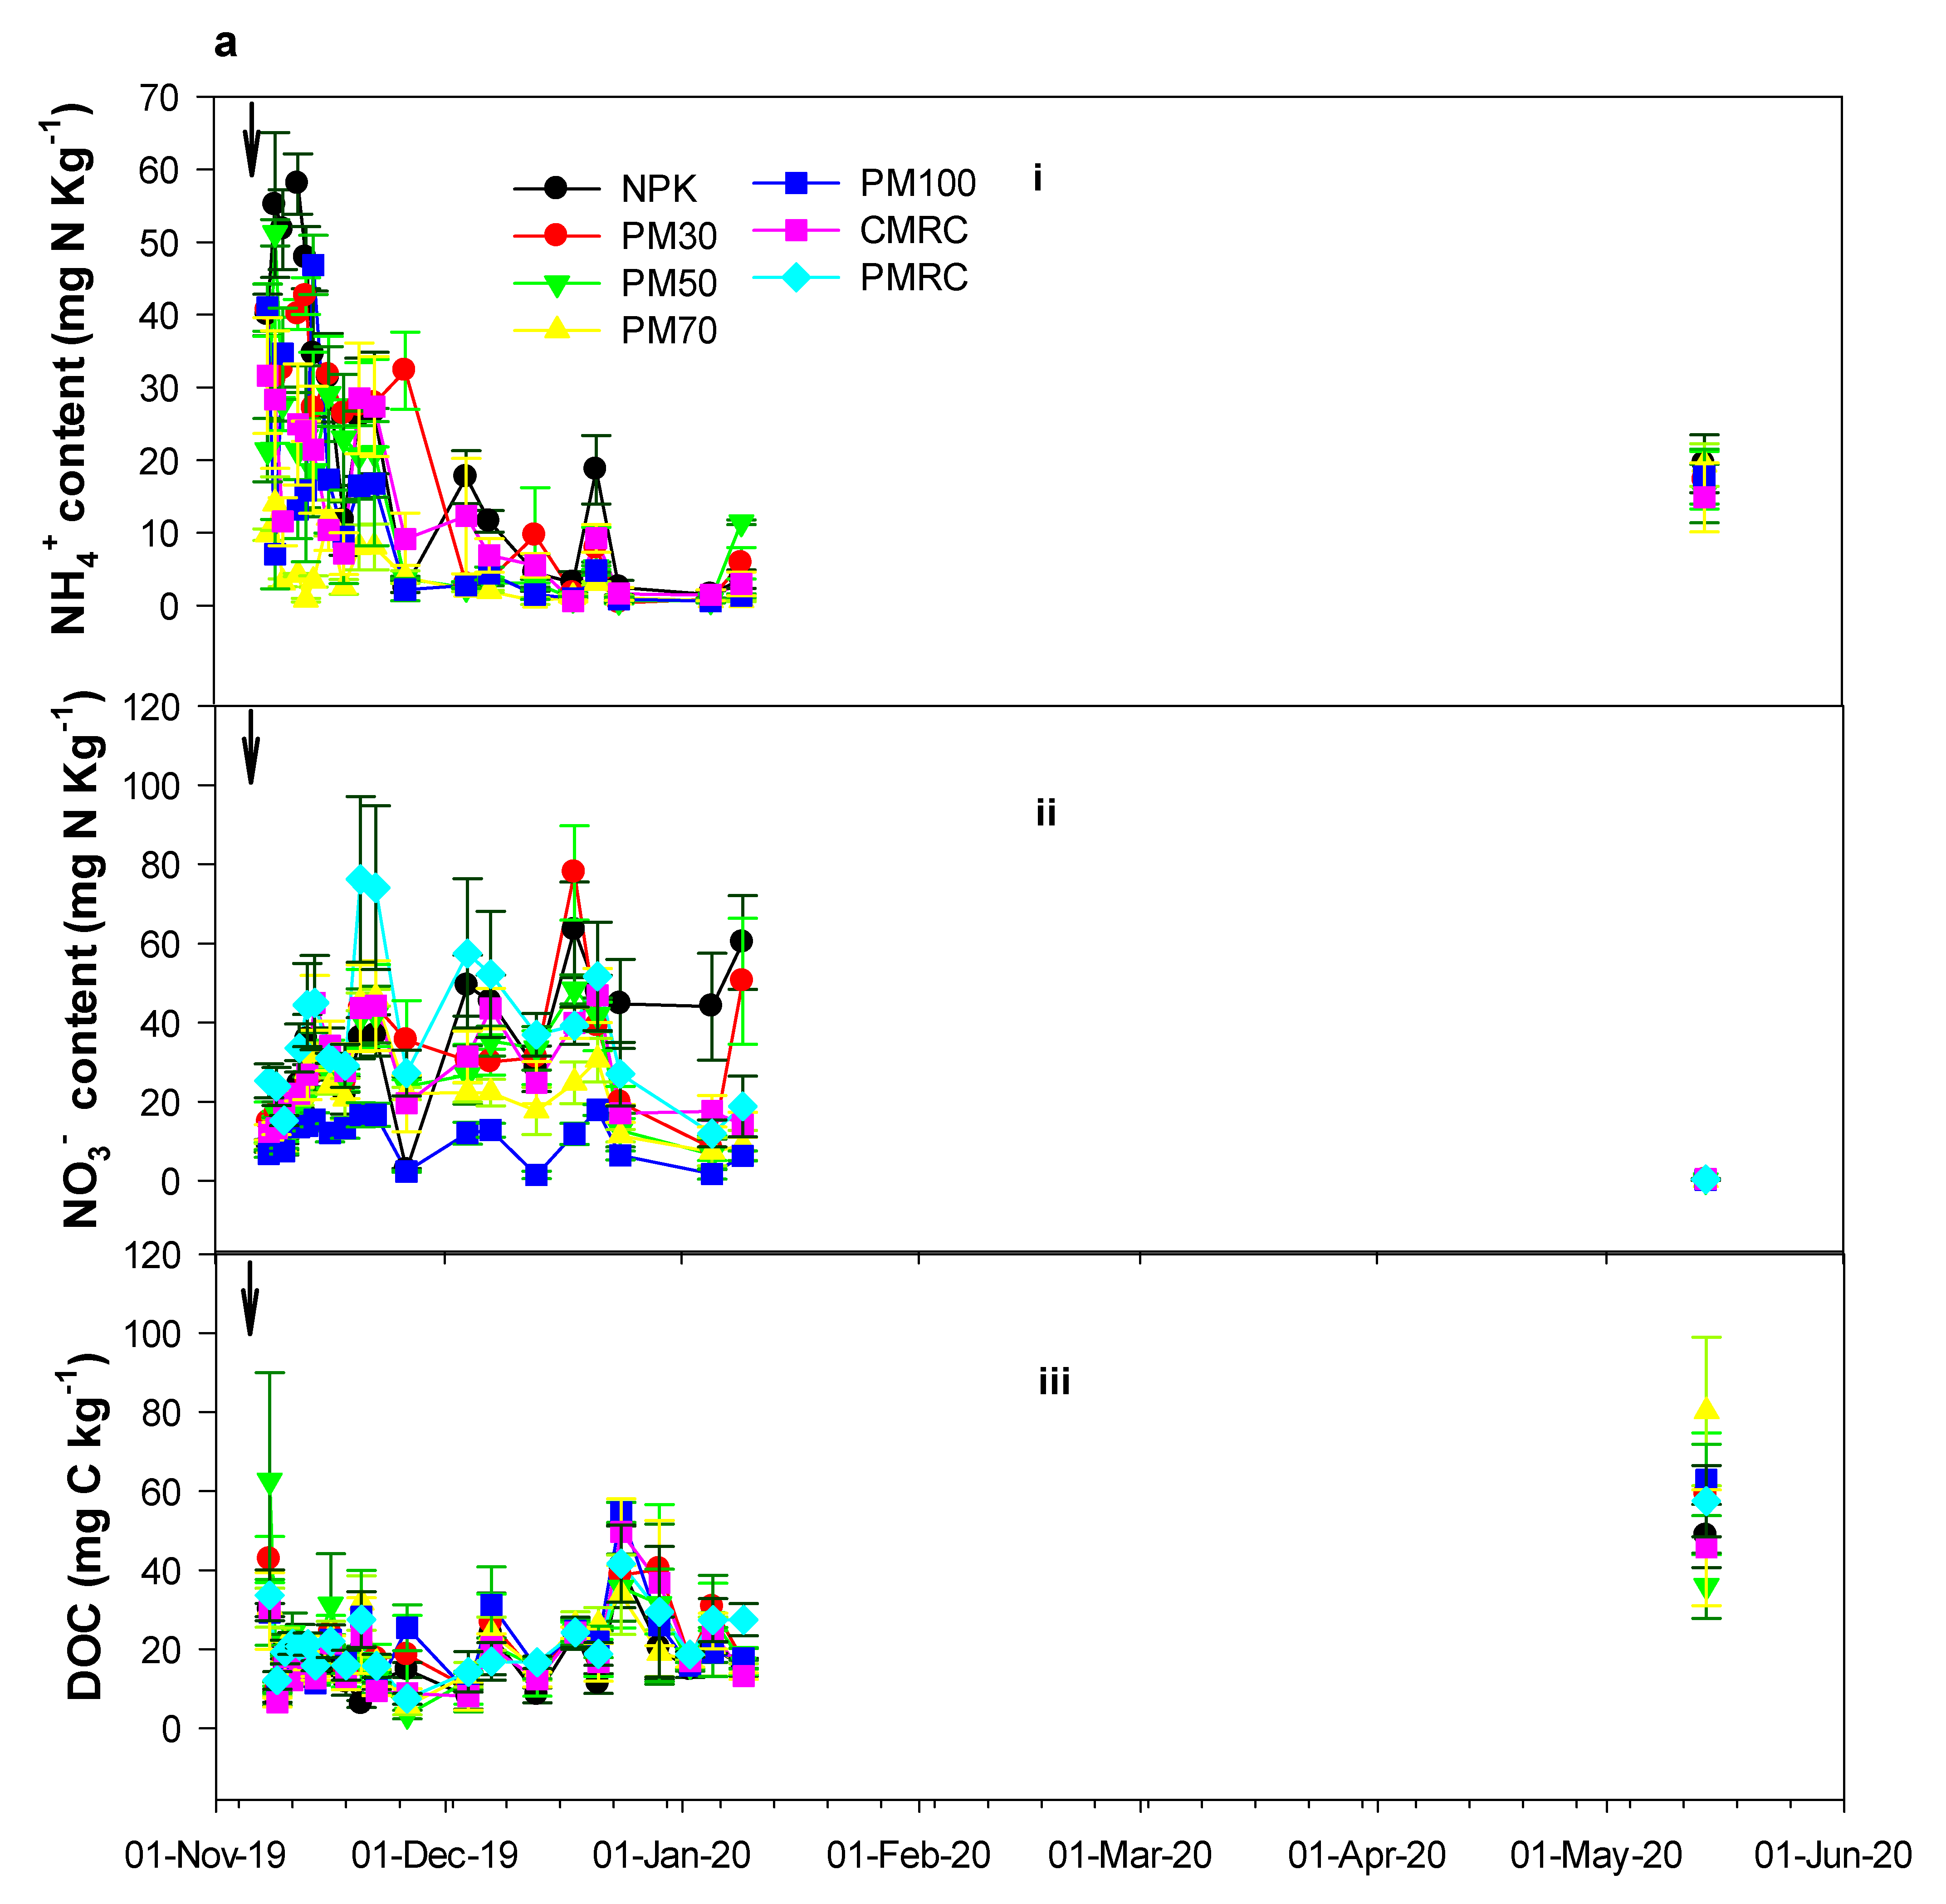
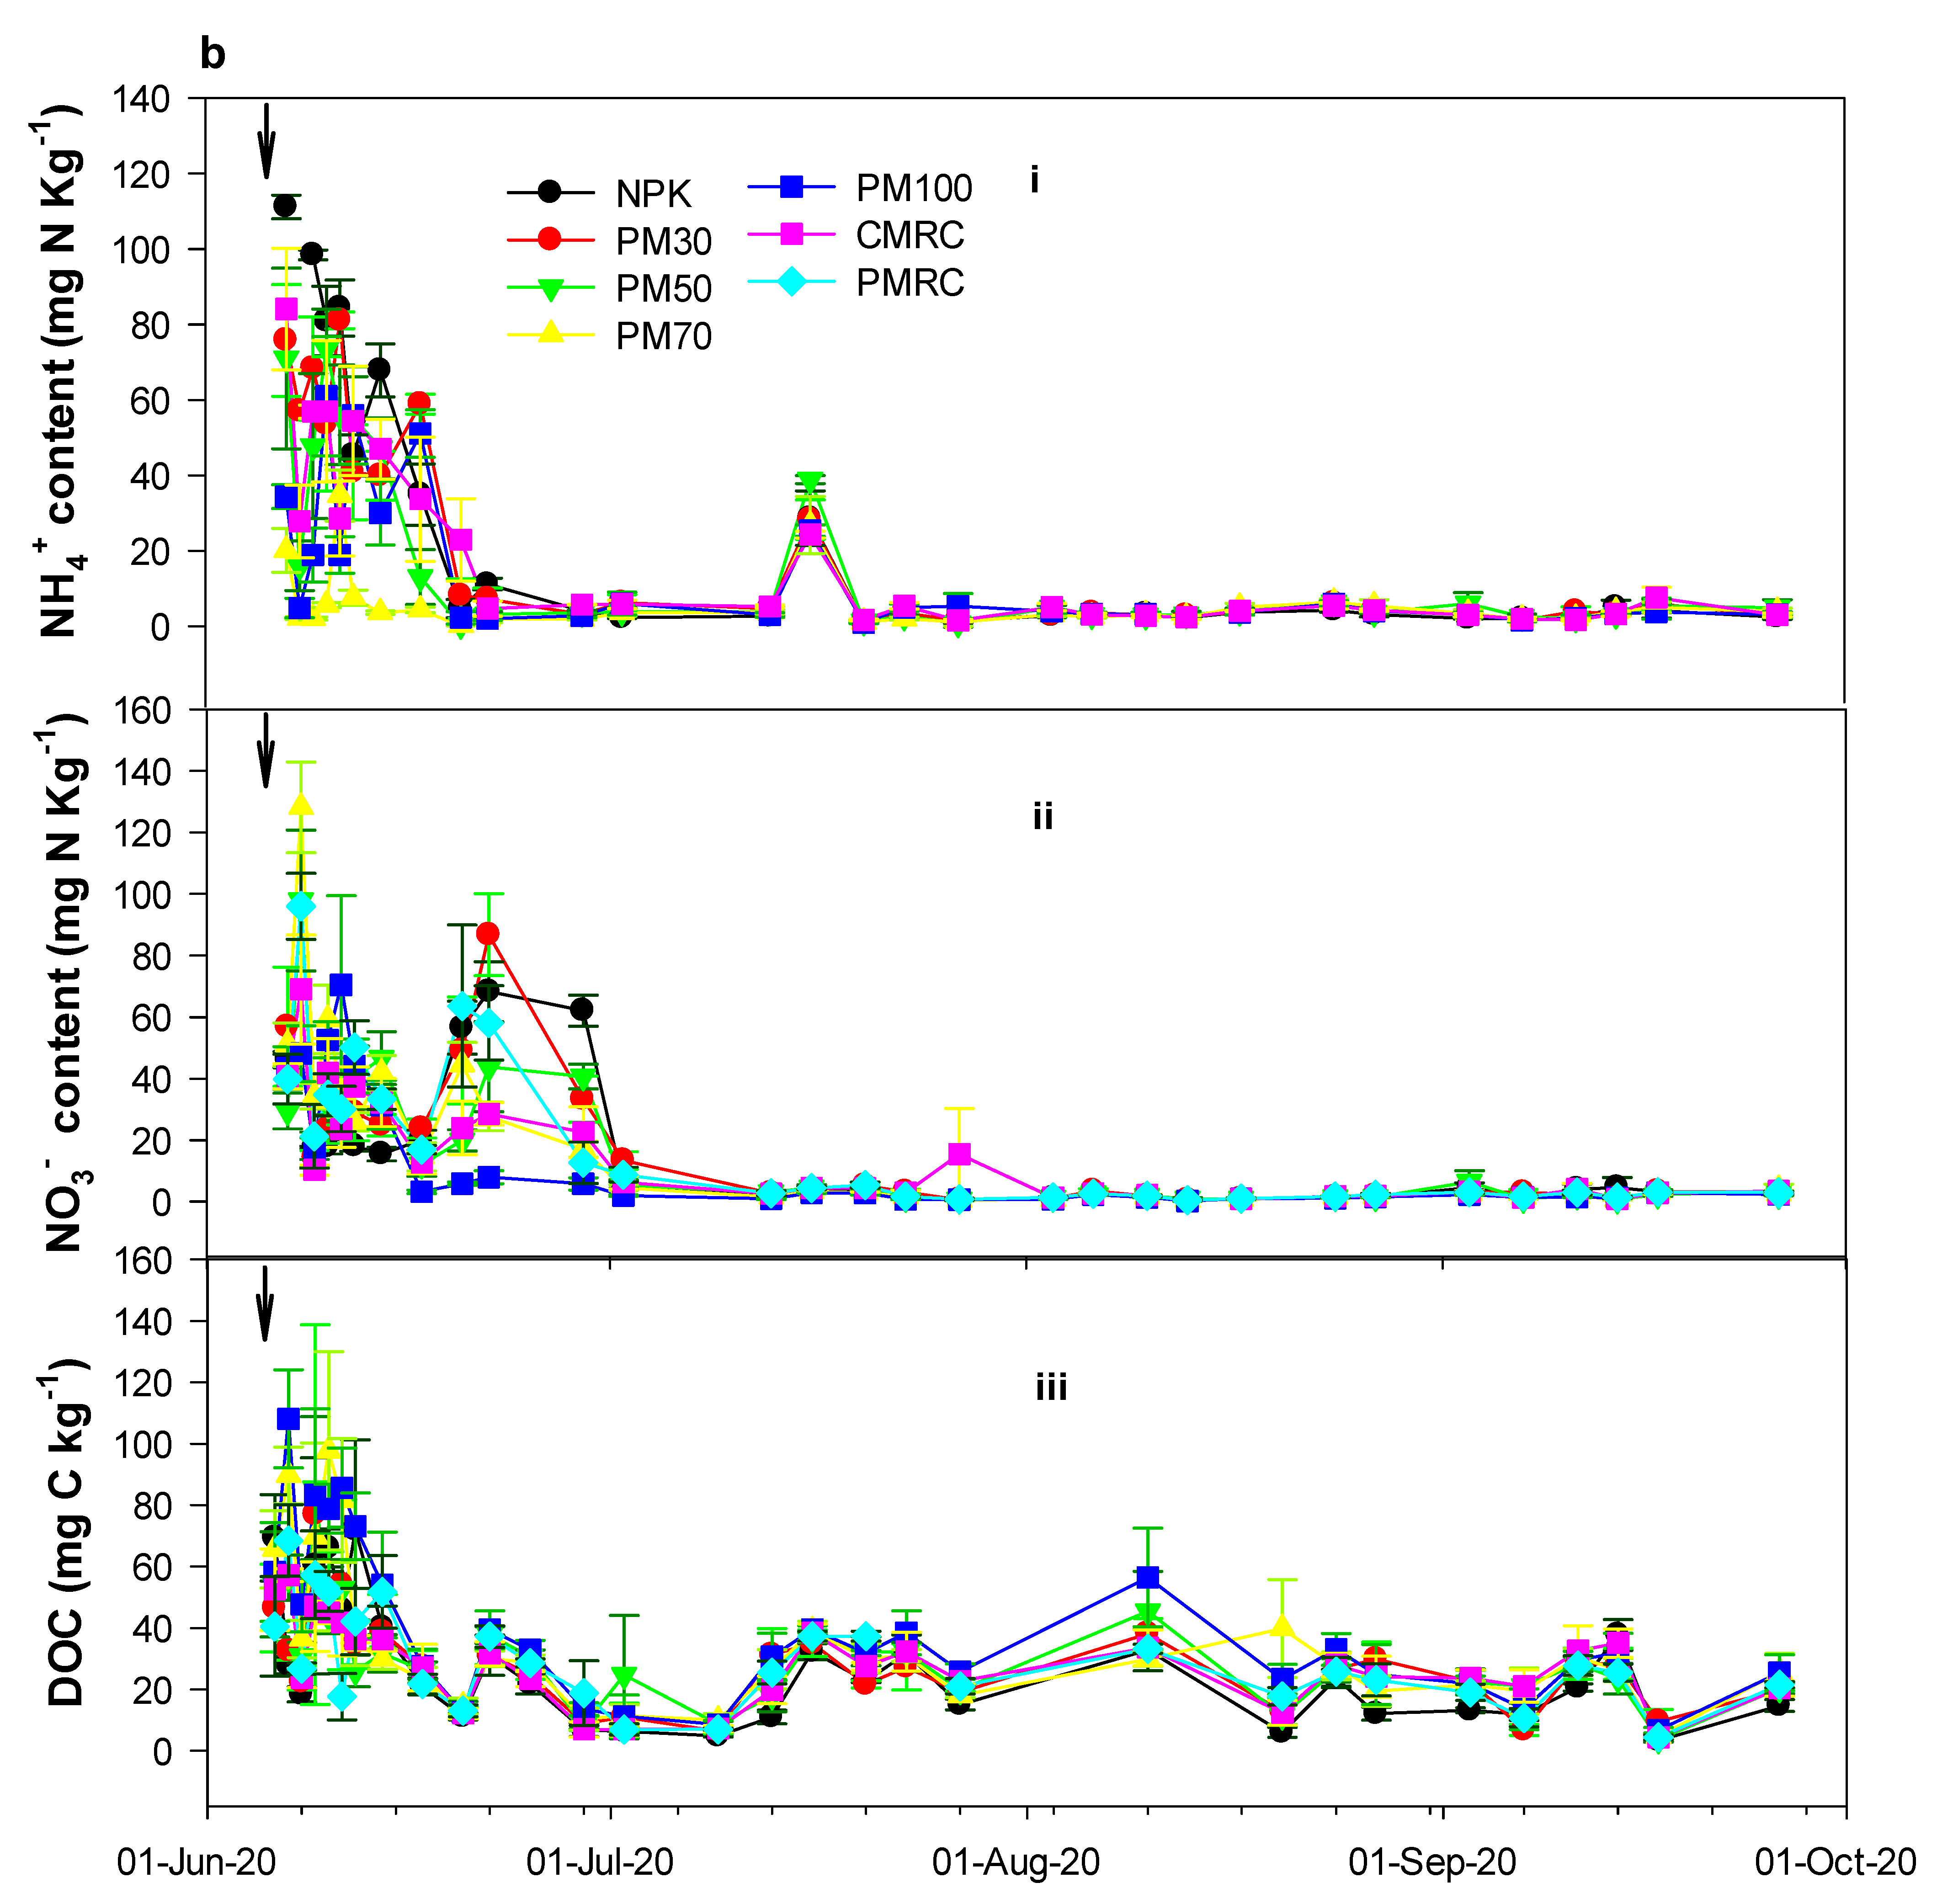
The fertilization treatments significantly impacted the concentration of available N in the soil (p < 0.05). N availability varied across different periods of the growing season, with a high concentration of both NH4+ and NO3 being recorded during the first week after fertilization (Figure 3(ai,aii,bi,bii)). However, soil NH4+ and NO3 were significantly higher (p < 0.05) during the maize season than in the wheat season, with NPK treatments containing relatively higher peaks of both NH4+ and NO3 throughout both growing seasons, while PM100 exhibited the consistently low levels of NH4+ and NO3 throughout both seasons (Figure 3(ai,aii,bi,bii)).
The soil DOC contents for the organic amended treatments were significantly higher than the NPK (p < 0.05) during the maize season, with the observation of a substantially higher DOC in the PM100 treatments immediately after fertilization (Figure 3(aiii,biii)).

3.3. Direct N2O and CH4 Emissions under Different Fertilization Treatments

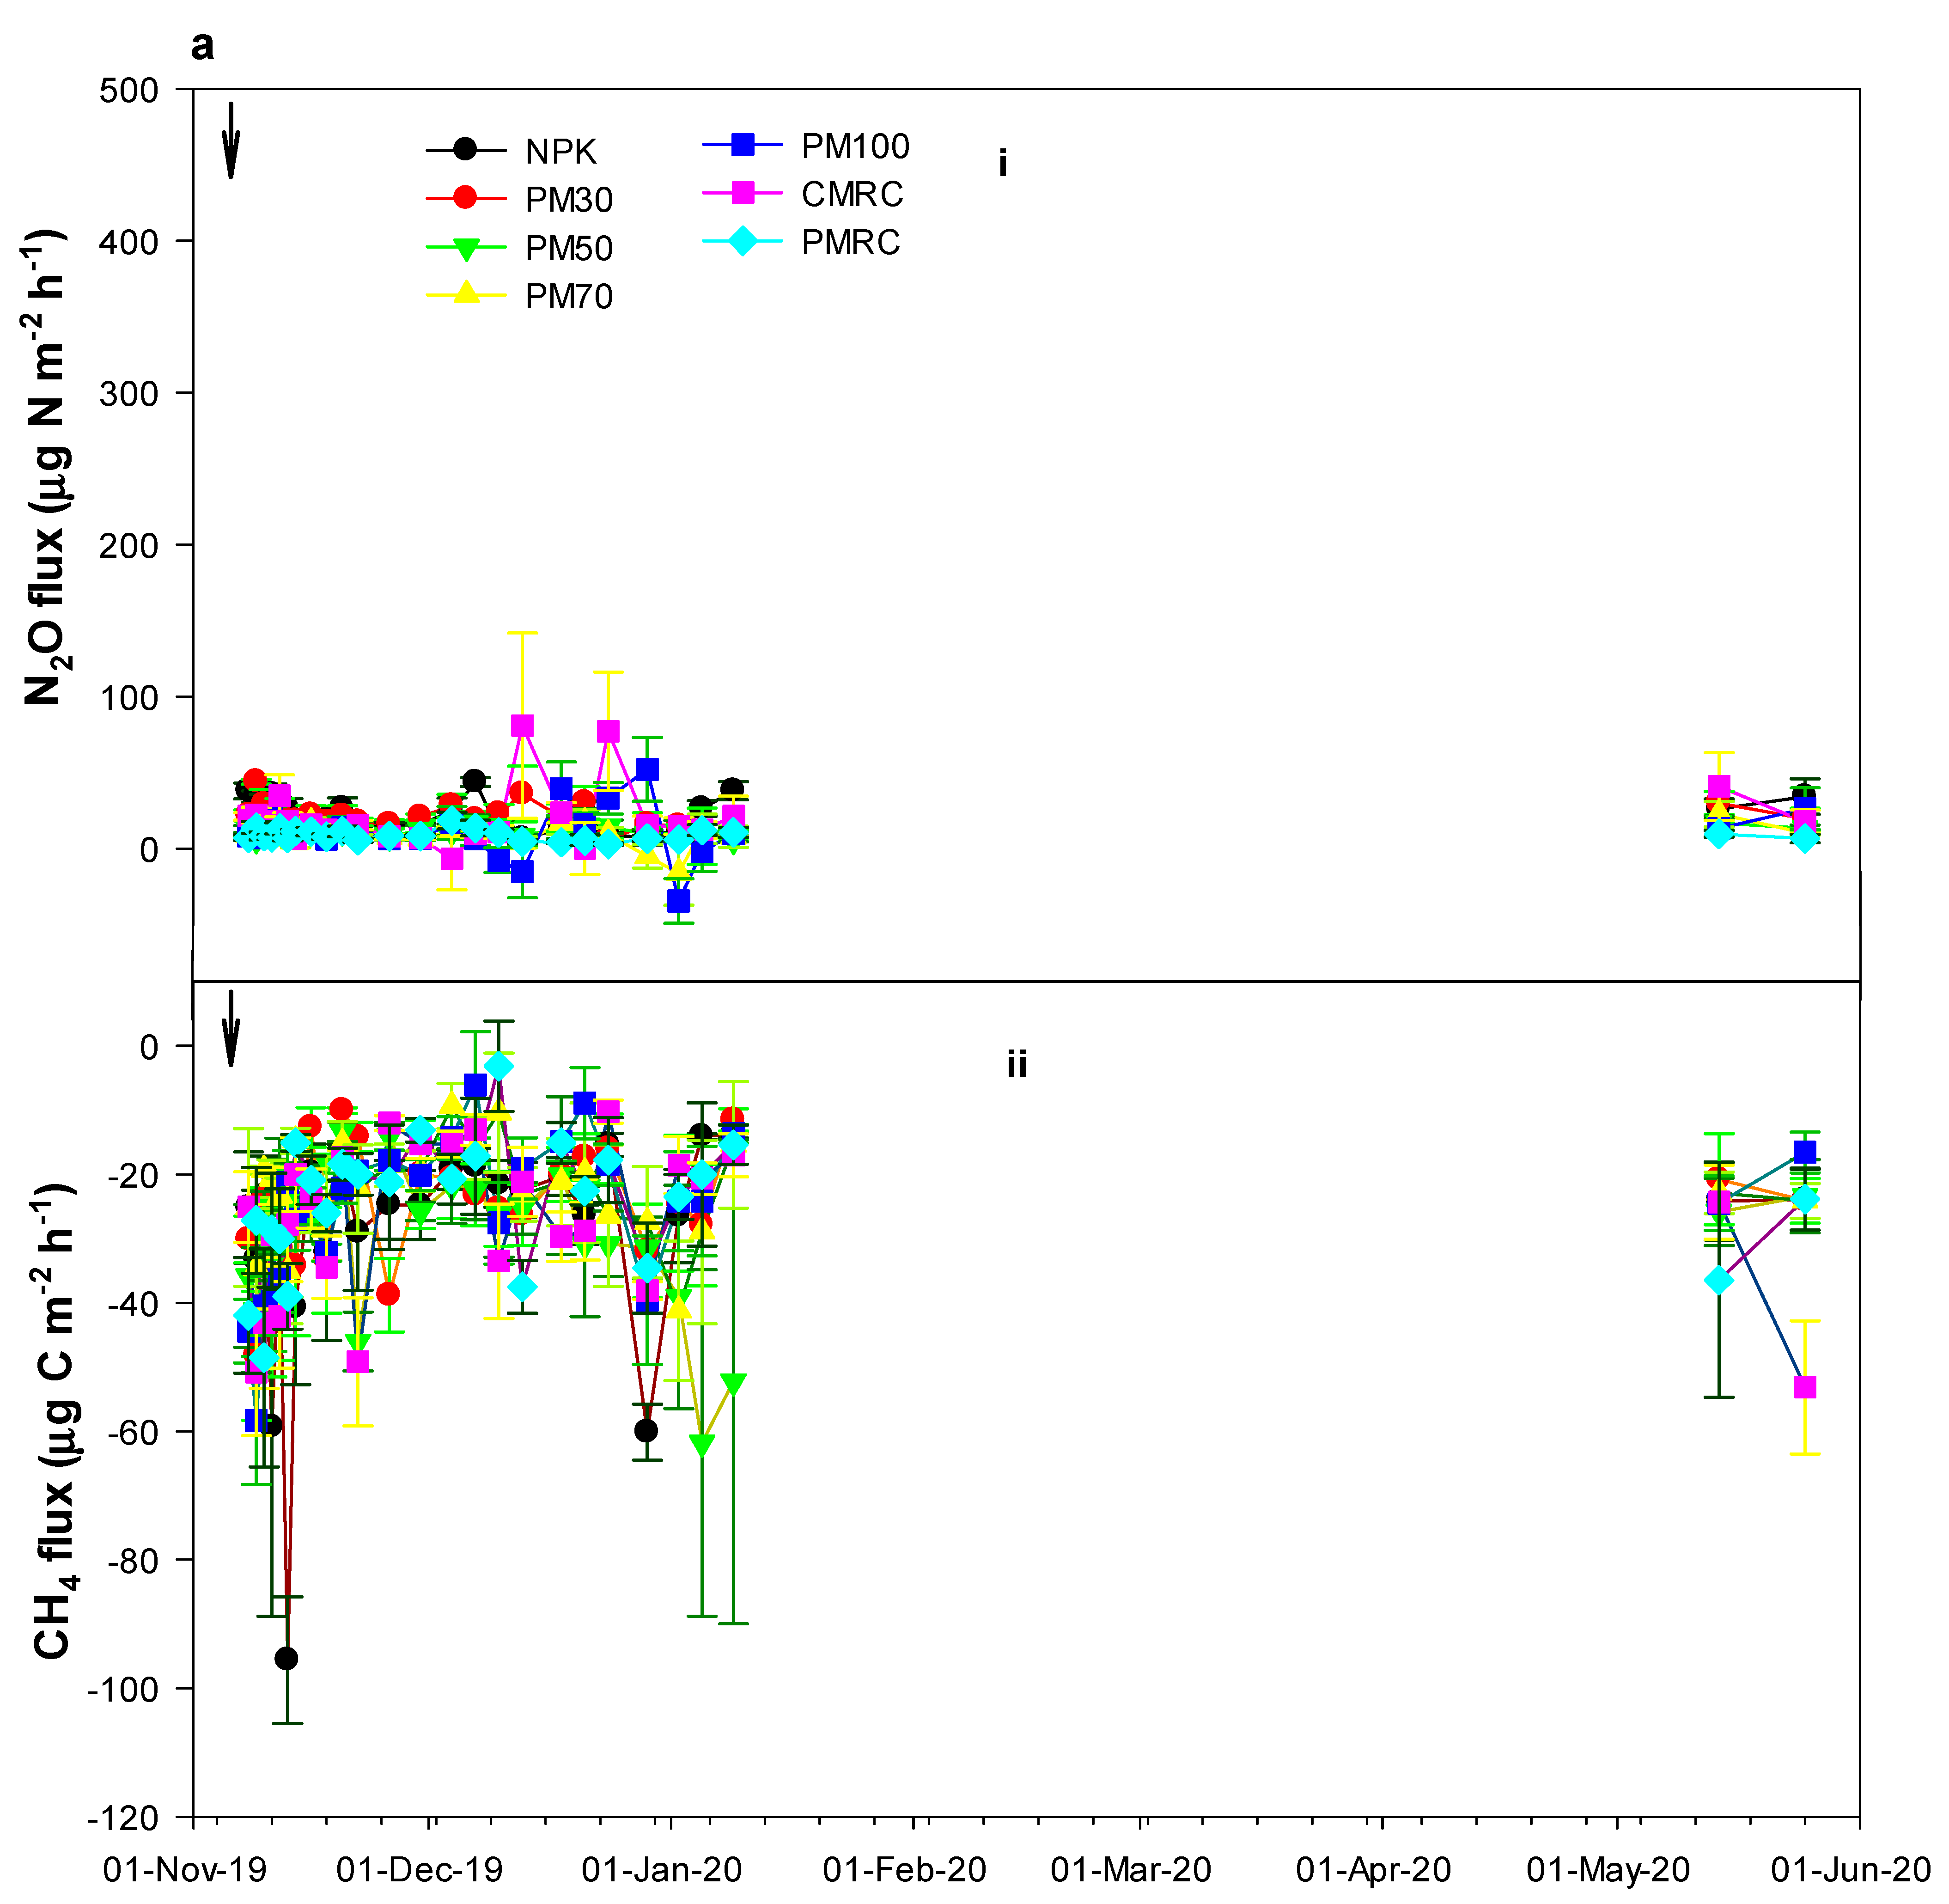
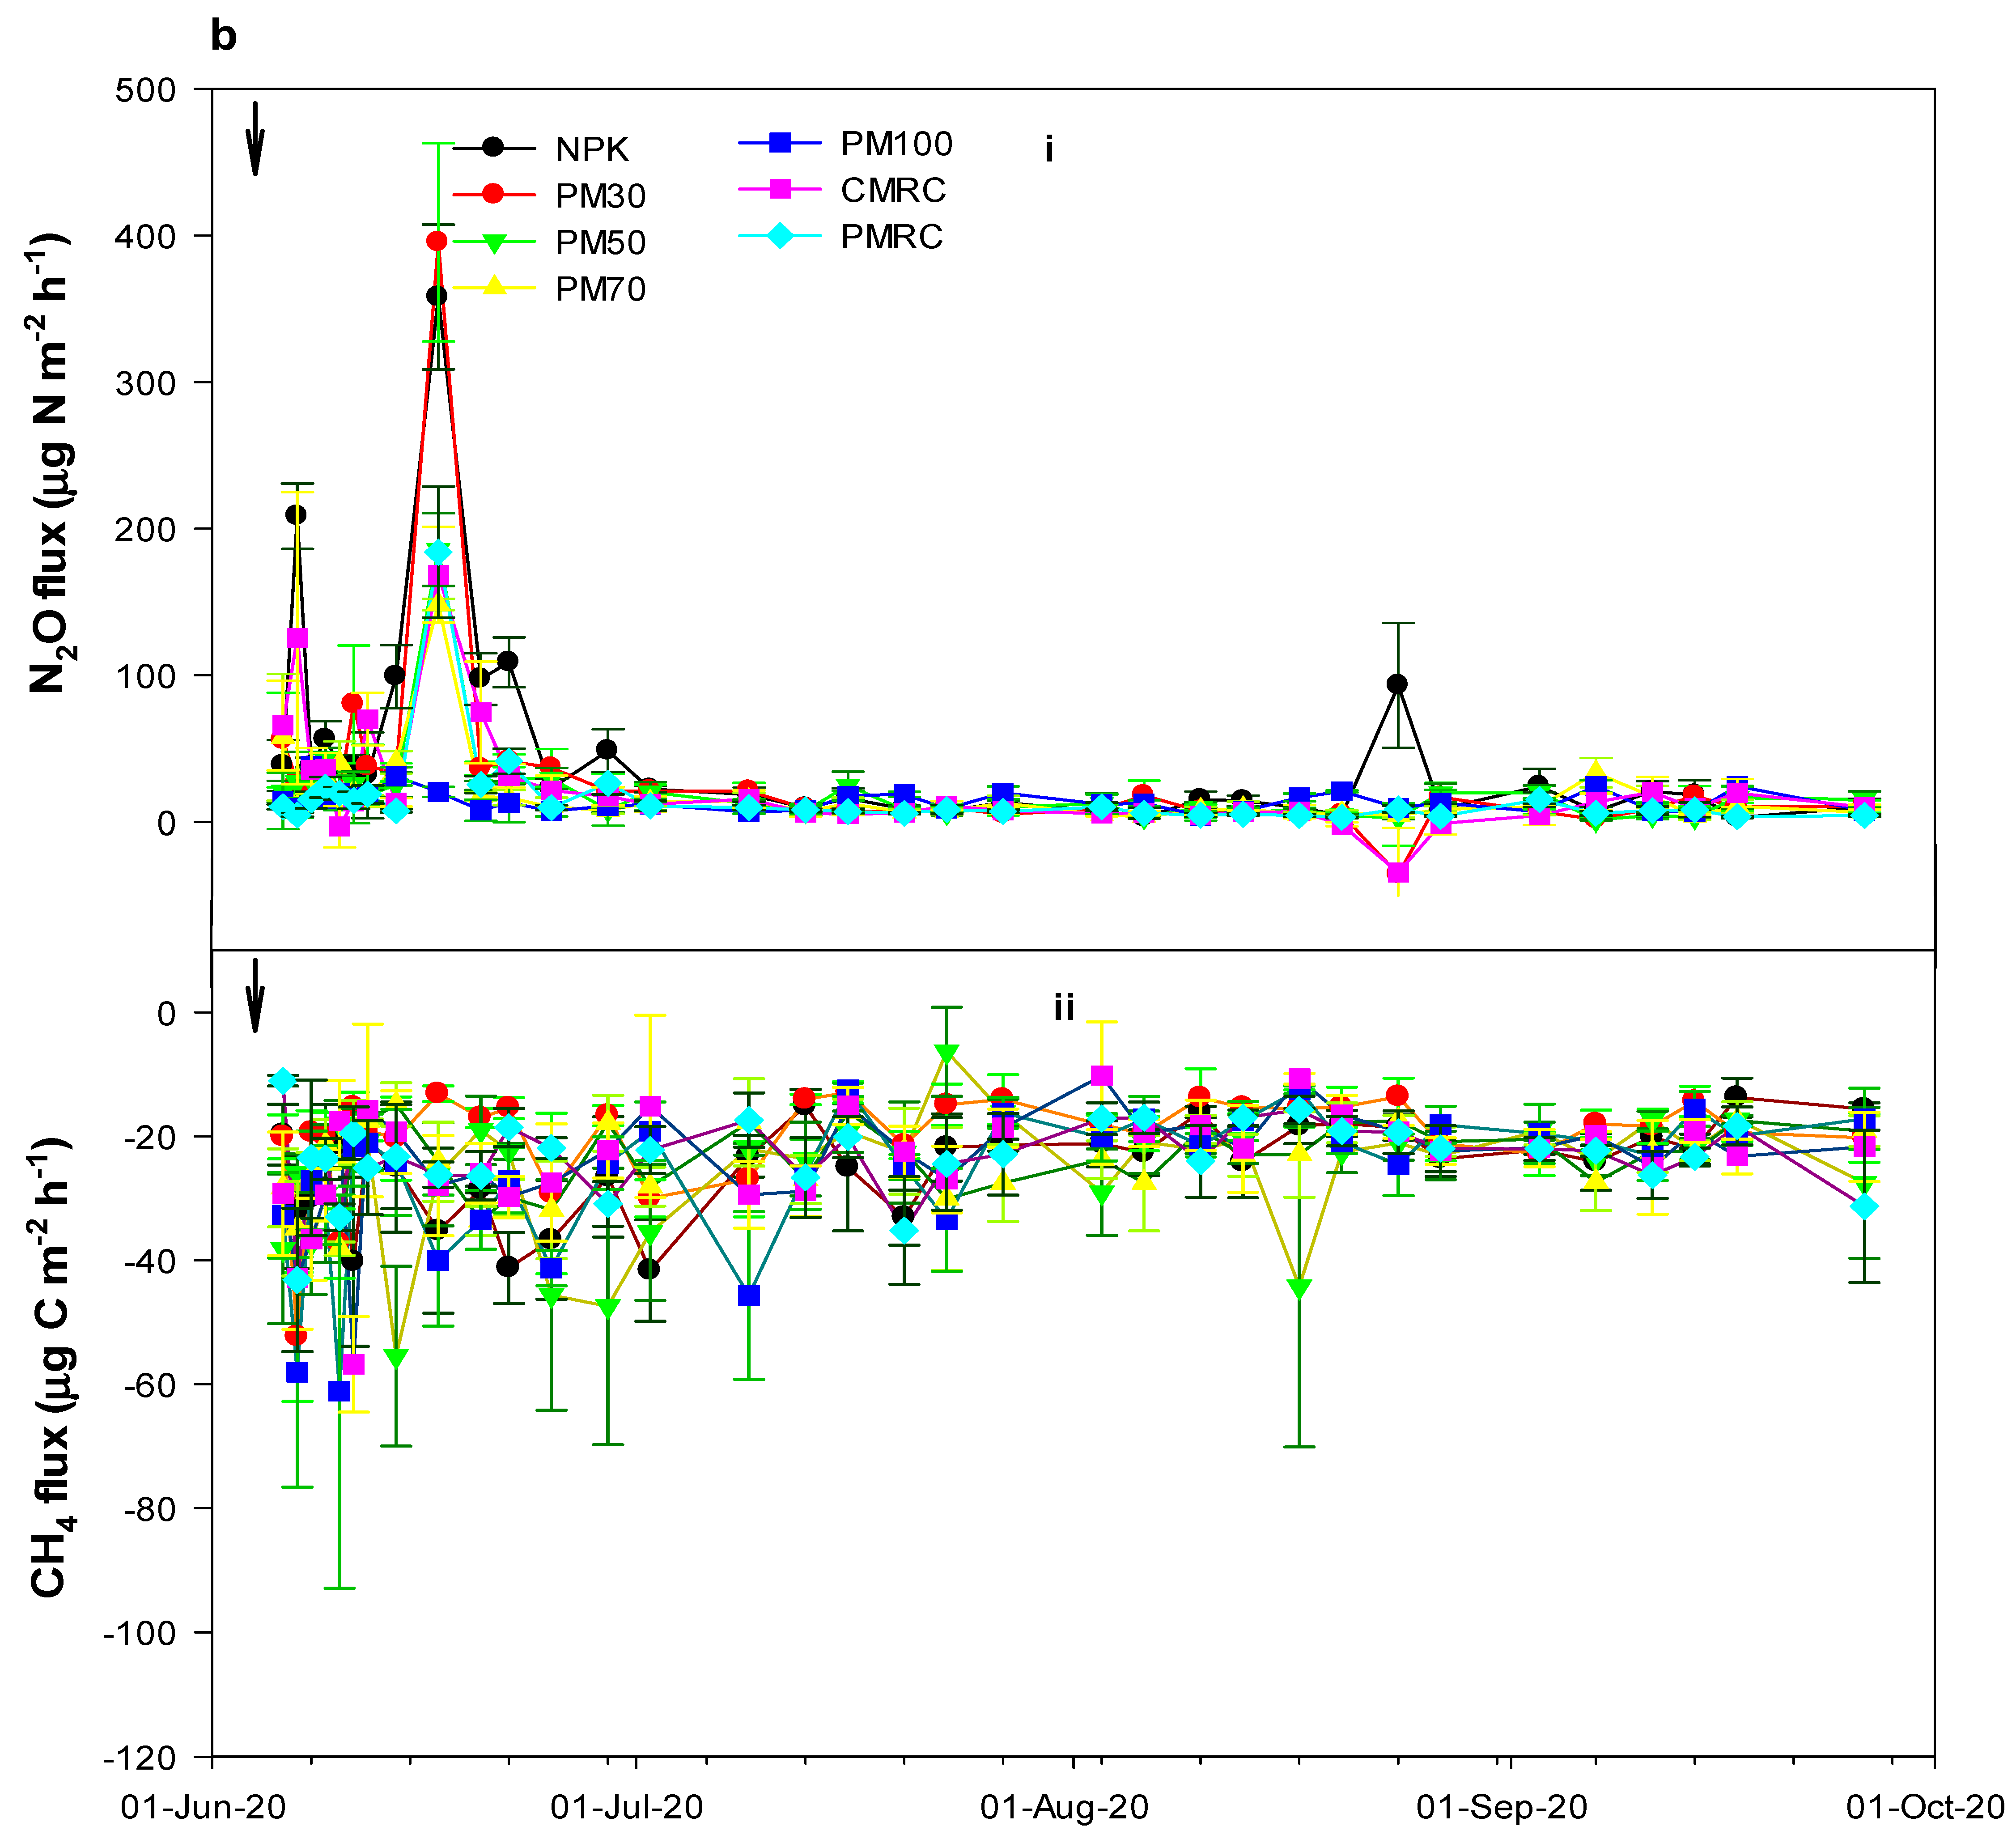
N2O fluxes were mostly positive across all treatments (Figure 4(ai,bi)). However, a few negative N2O emissions were recorded in the PM70 and PM100 treatments during the winter wheat and in the PM30 treatment during the summer maize season. The N2O fluxes ranged between −34.44 µg N m−2 hr−1 and 52.07 µg N m−2 hr−1 during the observation period of the winter wheat season and −35.56 µg N m−2 hr−1 to 395.30 µg N m−2 hr−1 during the summer maize season (Figure 4(bi)). Rapid N2O emissions occurred immediately after fertilization, which was more pronounced during the summer maize season when most of the N2O were emitted within the first two weeks after fertilization. Afterwards, N2O emissions mostly remained below 20 µg N m−2 hr−1 throughout the observation period (Figure 4(bi)). As shown in Table 3, the cumulative soil N2O emissions for all organic amended soils were significantly lower than the NPK treatment during the maize season (p < 0.01). The lowest cumulative N2O emission was recorded under the PMRC treatment (Table 3). However, due to high temporal intraseasonal variations in greenhouse gas fluxes, the cumulative emissions for the winter wheat season were not extrapolated.
Soil CH4 fluxes were mostly negative across all treatments, ranging between −96.61 µg C m−2 hr−1 to −3.17 µg C m−2 hr−1 during the wheat season observation period (Figure 4(aii)) and from −65.46 µg C m−2 hr−1 to −6.34 µg C m−2 hr−1 during the entire summer maize season (Figure 4ii). As shown in Table 3, the cumulative CH4 emissions for the summer maize season were not significantly different across all treatments.

3.4. Crop Yield and Yield-Scaled Global Warming Potential (GWP) under Different Fertilization Treatments

The grain yields for both seasons for the various treatments were as shown in Table 3. For the winter wheat season, only the yields from the PM70 and PM100 were significantly lower than the conventional NPK treatment (p < 0.01). Similar yield patterns were also observed during the summer maize season, with the PM70 and PM100 having significantly lower (p < 0.01) maize yields than the conventional NPK fertilizer treatments.
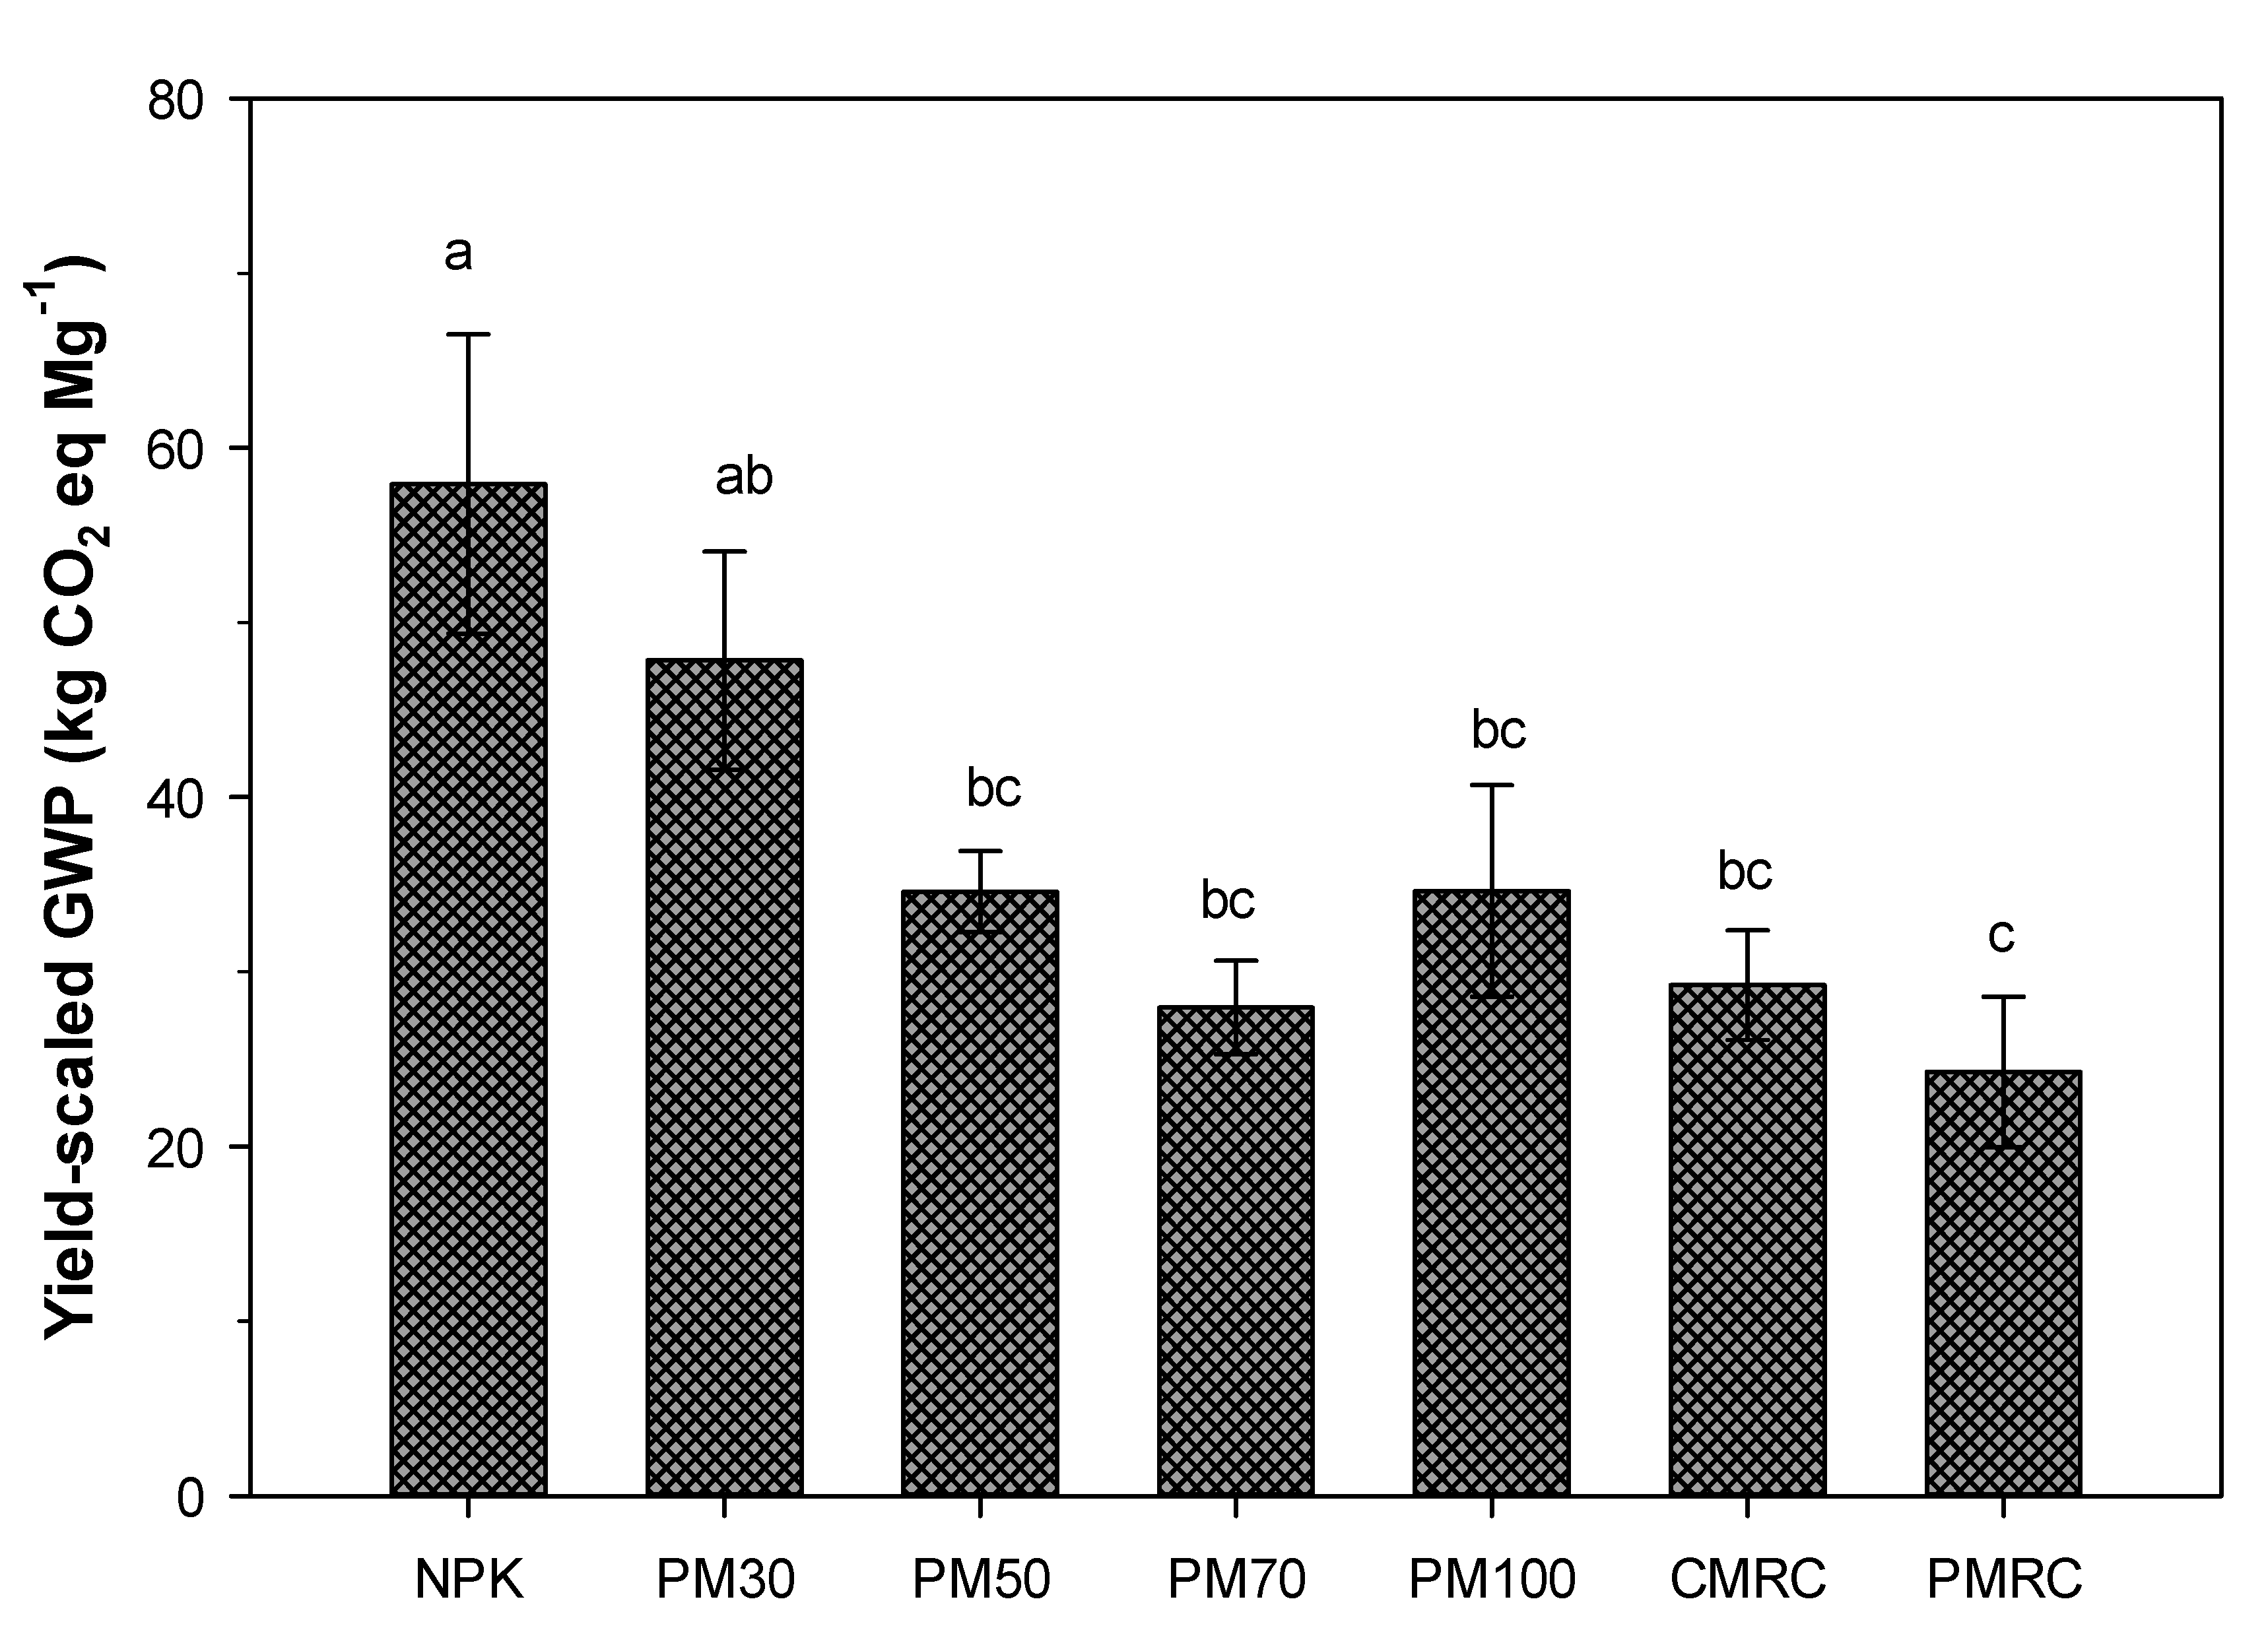
For the maize season, a combined GWP of 412 kg CO2 eq ha−1 was recorded for the NPK treatments, which was significantly higher than that of the organic-amended treatments (p < 0.01, Table 3). Among the treatments in this study, the PMRC treatment showed the lowest GWP of 162 kg CO2 eq ha−1 (Table 3). Due to similar CH4 fluxes among all the fertilization treatments, the combined GWP followed a similar pattern as the cumulative N2O emission, as shown in Table 3. As for the yield-scaled GWP, except for the PM30 treatment, the yield-scaled GWP for the organically amended soils were significantly lower than the NPK treatment (p < 0.01, Figure 5).

3.5. Correlations between Greenhouse Gas and Soil Properties

The N2O fluxes had significant positive correlations with soil NO3 concentration under all the treatments and were also significantly positively correlated with NH4+ concentration under NPK, PM30, PM50, PM70 and PMRC treatments (Table 4). Additionally, N2O fluxes were significantly positively correlated with available N under all treatments. Moreover, N2O fluxes also had significant positive correlations with soil temperature under PM30, PM50, CMRC treatments and were also significantly positively correlated with DOC under NPK and PM30 treatments. However, N2O fluxes had significant negative correlations with the soil moisture under NPK, PM30, PM70 and PM100 treatments (Table 4).
Similarly, as shown in Table 4, CH4 fluxes showed significant positive correlations with soil moisture under PM30, PM100, CMRC and PMRC treatments, and significant negative correlations with soil NO3 concentration were observed under NPK, PM30, PM50, PM100, CMRC and PMRC treatments.

4. Discussion

4.1. Factors Controlling N2O and CH4 Emissions

According to our study, NO3 concentrations were strongly significantly and positively correlated with N2O emissions (p < 0.01), while NH4+ concentrations showed partial correlations with N2O emissions in some treatments. This observation implies that an increase in soil available N content resulted in higher N2O emissions, which is consistent with observations made by Liu et al. (2020) and Miller et al. (2008) [18,44]. Moreover, the positive correlation of soil available N with N2O emissions (p < 0.05) was also reported by other researchers who concluded that soil available N are substrates for microbial nitrification and denitrification, which can result in the production of N2O [40,45,46,47]. This finding could also explain the reason why the highest N2O pulses for all treatments occurred within the first two weeks following the fertilizers’ application during the maize season, when more than 50% of the N2O emissions occurred; since there was high soil available N content during the first few weeks following fertilizer application.
The period of high pulses of N2O also coincided with the early event of high precipitation, as shown in Figure 2a and Figure 3b. Interestingly, although apparent negative correlations were found between soil moisture content and N2O emissions, signifying that soil moisture content could have a negative influence on soil N2O emissions in this study, high N2O emissions for the treatments were observed during periods of high precipitation, at the start of the maize season when the amount of soil available N contents were high. A number of studies have observed significant positive correlations between soil moisture content and N2O emissions, implying that soil moisture content could stimulate microbial activities, thereby resulting in increased N2O production [3,48,49]. As demonstrated by Bateman et al. (2005) and Kusa et al. (2002), precipitation could enhance N2O emission when the concentration of available N is very high due to the increase in substrate diffusivity and the stimulation of microbial activity with increased soil moisture content [48,49] thereby resulting in increased denitrification rates [50,51]. The negative correlation observed, which was apparent after the first episode of high precipitation on 17 June 2020 where increases in soil moisture content were found to result in lower N2O emissions, could be attributed to the stimulation of complete denitrification by high soil moisture in N-limited systems with high amounts of labile C [52]. As observed in Figure 3b and Figure 4b, by shifting towards an N-limited system after high pulses of N2O emissions and significant decreases in available N in the system (possibly lost through leaching), the high quantities of labile C relative to NO3 might have promoted complete denitrification [53,54], thereby resulting in decreased N2O emissions. Similar results were also observed by Ball et al. (2004), Meijide et al. (2007) and Meijide et al. (2009), who noted that high quantities of labile C and relatively lower amounts of available N could suppress N2O emissions by lowering the N2O:N2 ratio during the denitrification process [19,20,21].
Although temperature only showed partial significant correlations with both N2O and CH4 fluxes, it may have had an enormous influence on N2O and CH4 fluxes between both wheat and maize seasons. According to our study, the average soil temperature during the wheat season was 12 °C, while the average soil temperature during the maize season was 25 °C. These large temperature changes could probably account for the enormous differences in N2O peaks in the first two weeks of fertilization in both wheat and maize seasons, with most treatments showing three- to six-fold differences in N2O flux pulse intensity. Additionally, the highest peak flux recorded for most of the treatments occurred on the date of our soil temperature maxima (~33.5 °C), indicating that high temperatures during the maize season could stimulate microbial processes of nitrification and denitrification, resulting in high amounts of soil available N, and therefore producing abundant substrates for soil N2O emissions [55].
Our study indicates significant positive correlations between CH4 emissions and soil moisture content (p < 0.05) for most of the organic amended treatments under study. This agrees with reports from previous studies indicating that soil moisture content could exert a strong control on fertilizer-amended soils [56,57,58]. In their study, Dasselaar et al. (1998) observed that soil moisture accounted for up to 73% of the variability in CH4 from two aerobic sandy soils. As observed in our study, the apparent positive correlation between soil moisture content and CH4 emissions signifies the inhibition of CH4 uptake by increases in soil moisture content. This phenomenon could be due to gas transport limitations which occurs as a consequence of increased moisture content, consequently resulting in lower CH4 oxidation [25,59]. Moreover, as observed in our study, soil NO3 content was also found to have a significant negative correlation with CH4 emissions (p < 0.05), indicating that soil NO3 was positively correlated with CH4 uptakes. This agrees with the observations of Castro et al. (1995), who noted that soil NO3 content could be a strong controller of CH4 consumption at low levels of soil moisture [59]. Additionally, fertilization can also affect CH4 oxidation by influencing the activities of methanotrophic microbes since fertilization can result in the increase in the concentration of NO3 in soils, and NO3 can facilitate cell growth of the methanotrophic microbes [25].

4.2. Effects of Different Fertilization Treatments on N2O and CH4 Fluxes

Studies involving the use of organic amendments on agricultural soils have reported conflicting findings regarding their influence on N2O emissions in relation to N fertilizer application. While some studies have reported that organic amendments have a stimulating effect on N2O emissions compared to synthetic N fertilizers [18,60], others have reported a suppressing effect [61,62]. Our study showed significantly lower soil N2O emissions in both wheat and maize seasons during the first few weeks following fertilization and significantly lower cumulative N2O emissions during the maize season from plots amended with organic amendments compared to the synthetic N treatment (p < 0.05). The findings were consistent with the results reported by Nyamadzawo et al. (2017) and Mukumbuta et al. (2017), who also noted that partial substitution of organic amendments resulted in lower N2O in organic amended soils when compared to full synthetic N fertilizer treatments [63,64]. Nyamadzawo et al. (2017) observed between 15% to 37% N2O emission reduction in soils amended with different proportions of cattle manure in a Hapilic Lixisol maize system [63]. However, our results were contrary to the observations of Jin et al. (2010), who observed an increased level of N2O emissions in a Mollic Andosol reed canary grassland amended with beef cattle manure [65]. This discrepancy could be attributed to the difference in the physicochemical nature of the organic amendments used in their study and our study. It has been reported that the N2O stimulating or suppressing effects of an organic amendment could be influenced by its C/N ratio [66]. The authors reported a threshold value of approximately 8.6, a C/N ratio below which organic amendments tended to cause a stimulating effect on N2O emissions [66]. As observed in Table 2, the C/N ratio of the amendments used was higher than this threshold, indicating that the N2O emissions can be suppressed in the organic amended soils studied here. Moreover, another possible explanation for the relatively lower N2O fluxes in organic-amended treatments could be due to the slow release of mineralized N in organic amended soils [67], which results in the lower substrates available for N2O production. This assumption can also be supported by the distribution patterns of available N among treatments in Figure 3.
Previous studies have reported that the use of organic amendments such as manures, composts, and crop residues could affect the CH4 uptake capacity of soils [68]. In our study, however, such a relationship was not found. Similarly, we did not observe any significant difference in the CH4 uptake capacities of soils with different organic amendment types, which is in agreement with the previous results observed in the area [5]. Also, we did not observe any significant impact of the differential increase in manure N ratio on soil’s CH4 uptake capacity. This phenomenon could be explained by the comparable soil moisture content across all treatments in this study since soil moisture has been shown to be an important controller of CH4 consumption based on its significant correlation with CH4 emissions, which probably accounts for the similar CH4 flux values in the soils under study.
Additionally, as seen in our study, based on the variations in the N2O and CH4 emission as well as the crop yields among treatments, combining inorganic N with lower or equal proportions of organic manure N or compost can be used as a mitigation option for reducing N2O emissions while retaining similar crop yields. However, if manure is the main or only source of N, the yield loss may be up to 36%. A similar observation was observed by Nyamadzawo et al. (2017) in Chinese and Zimbabwean cereal systems [63].

4.3. Impact of Different Fertilization Treatments on Yield-Scaled GWP

Analyzing the global warming potential associated with fertilization treatments in agricultural systems provides interesting information for estimating the environmental impacts of intensive agricultural production. A few studies have directly reported the combined GWP for N2O and CH4 emissions in grain production systems [5,42,69]. These studies report a range of values varying over approximately one order of magnitude. In this study, the combined GWP across all the treatments ranged from 161.2 kg CO2 eq ha−1 for PMRC to 412.0 kg CO2 eq ha−1 for the NPK treatment, which was within the range of GWP reported by Linquist et al. (2012) from a meta-analysis of 62 studies and 328 global observations [42], and similar to the values obtained during the maize season within the area, and from previous studies in wheat systems reported in the area [5,68,70]. The combined GWP for N2O and CH4 observed during the maize season were significantly lower for all the organically amended treatments than the NPK treatment, as seen in Table 3. These observations were similar to the findings of Liu et al. (2020), López-Fernández et al. (2007) and Musafiri et al. (2020) [44,62,71]. Due to similar CH4 emissions recorded across all fertilization treatments, the variation in GWP in this study was mainly accounted for by the differences in cumulative N2O emissions for the various treatments.
In addition, several reports have recommended using yield-scaled GWP as an important metric to finding the most suitable fertilization strategy that would lower the environmental impacts of fertilizer use without resulting in yield penalties [5,42,72]. For a sustainable fertilizer management option, a pragmatic approach to finding an environmentally friendly amendment involves taking grain yields into account in order to juxtapose both the environmental and economic impacts of different fertilizer management strategies. In our study, except for the PM30 treatment, the yield-scaled GWP of the organic-amended treatments were significantly lower than the NPK treatment (p < 0.05), demonstrating the suitability of organic fertilizer-synthetic N combination as a suitable alternative for the NPK-only treatment. The lower yield-scaled GWP observed in the organic-amended treatments studied here were attributed to the lower cumulative N2O fluxes and similar yields with respect to the NPK treatment.
Our study focused on the influence of the application of organic amendments on N2O and CH4 fluxes and their impact on crop yields in a Sichuan basin wheat-maize system. The application of organic amendments could significantly impact SOC pools in agricultural soils and could, therefore, influence their CO2 emissions [73,74,75,76,77]. However, we did not integrate soil organic carbon changes and associated CO2 emissions in our estimates of GWP. Therefore, long-term observation of SOC changes and their associated CO2, CH4 and N2O emissions are required to fully characterize the net GWP in organic-amended Sichuan basin wheat-maize system.

5. Conclusions

This paper explores the effects of organic amendment types and increasing differential manure N ratios on greenhouse gas emissions, GWP and yield-scaled GWP in a wheat-maize system in southwest China as well as the drivers controlling greenhouse gas emissions. In this study, the conventional NPK fertilizer had the highest N2O emission and consequently the highest GWP and yield-scaled GWP among the fertilization treatments, while a balanced N fertilization (synthetic N + low or equal proportions of pig manure/compost) could maintain relatively high grain yield and reduce the risk of high N2O emissions while not significantly affecting CH4 fluxes in wheat-maize systems. Therefore, up to 50% of the synthetic N fertilizer can be substituted by pig manure or compost in this area. As for the driver controlling greenhouse gas emissions, we found that available N exerts strong control on N2O and CH4 emissions. Additionally, among the organic-amended treatments, our study revealed that the PMRC treatment had the lowest yield-scaled GWP, owing to its ability to significantly reduce N2O emissions while maintaining high crop yields, thereby highlighting it as the most suitable of the organic fertilization treatments under our study, which could reduce the GWP associated with fertilizer use in wheat-maize systems.

Supplementary Materials

The following are available online at https://www.mdpi.com/article/10.3390/atmos12091104/s1.

Author Contributions

Conceptualization, D.G.O., K.W. and B.Z.; methodology, D.G.O. and K.W.; software, D.G.O., L.H. and H.B.; validation, K.W., B.Z.; formal analysis, D.G.O., L.H.; investigation, D.G.O.; resources, B.Z.; data curation, D.G.O.; writing—original draft preparation, D.G.O.; writing—review and editing, K.W., A.M., L.A.G.; visualization, A.M. and H.B.; supervision, B.Z.; project administration, K.W. and B.Z.; funding acquisition, K.W. and B.Z. All authors have read and agreed to the published version of the manuscript.

Funding

This research was funded by the National Natural Science Foundation of China, grant number U20A20107; the Youth Innovation Promotion Association, CAS, grant number 2021374; the Sichuan provincial department of agriculture and rural affairs, China; the Mianyang Municipal Science and Technology Bureau, China; CAS the ‘Belt and Road’ Master Fellowship Program and CAS President’s International Fellowship Initiative (PIFI).

Institutional Review Board Statement

Not applicable.

Informed Consent Statement

Not applicable.

Data Availability Statement

The data presented in this study are available on request from the corresponding authors.

Acknowledgments

We are thankful to all members of staff at the Yanting Agro-ecological Station of Purple Soil for their contribution during the field experiments.

Conflicts of Interest

The authors declare no conflict of interest.

References

  1. Food and Agriculture Organization of the United Nations (FAO). Organic Agriculture and Climate Change Mitigation—A Report of the Round Table on Organic Agriculture and Climate Change; FAO: Rome, Italy, 2011. [Google Scholar]
  2. Smith, P.; Martino, D.; Cai, Z.; Gwary, D.; Janzen, H.; Kumar, P.; McCarl, B.; Ogle, S.; O’Mara, F.; Rice, C.; et al. Agriculture. In Climate Change 2007: Mitigation. Contribution of Working Group III to the Fourth Assessment Report of the Intergovernmental Panel on Climate Change; Cambridge University Press: Cambridge, UK; New York, NY, USA, 2007. [Google Scholar]
  3. Liu, H.; Li, J.; Li, X.; Zheng, Y.; Feng, S.; Jiang, G. Mitigating greenhouse gas emissions through replacement of chemical fertilizer with organic manure in a temperate farmland. Sci. Bull. 2015, 60, 598–606. [Google Scholar] [CrossRef] [Green Version]
  4. Nayak, D.R.; Saetnan, E.; Cheng, K.; Wang, W.; Koslowski, F.; Cheng, Y.-F.; Zhu, W.Y.; Wang, J.-K.; Liu, J.-X.; Moran, D.; et al. Management opportunities to mitigate greenhouse gas emissions from Chinese agriculture. Agric. Ecosyst. Environ. 2015, 209, 108–124. [Google Scholar] [CrossRef] [Green Version]
  5. Zhou, M.; Zhu, B.; Brüggemann, N.; Bergmann, J.; Wang, Y.; Butterbach-Bahl, K. N2O and CH4 Emissions, and NO3—Leaching on a Crop-Yield Basis from a Subtropical Rain-fed Wheat–Maize Rotation in Response to Different Types of Nitrogen Fertilizer. Ecosystems 2013, 17, 286–301. [Google Scholar] [CrossRef]
  6. Xiu, Y.; Cheng, Y. The Comprehensive Utilization of Crops Straw Stalk and the Rural Circulation Economy. J. Agric. Mech. Res. 2006, 10, 31–33. (In Chinese) [Google Scholar]
  7. Bai, Z.; Ma, L.; Jin, S.; Ma, W.; Velthof, G.L.; Oenema, O.; Liu, L.; Chadwick, D.; Zhang, F. Nitrogen, Phosphorus, and Potassium Flows through the Manure Management Chain in China. Environ. Sci. Technol. 2016, 50, 13409–13418. [Google Scholar] [CrossRef] [Green Version]
  8. Chadwick, D.; Wei, J.; Yan’An, T.; Guanghui, Y.; Qirong, S.; Qing, C. Improving manure nutrient management towards sustainable agricultural intensification in China. Agric. Ecosyst. Environ. 2015, 209, 34–46. [Google Scholar] [CrossRef]
  9. Zhou, M.; Zhu, B.; Wang, X.; Wang, Y. Long-term field measurements of annual methane and nitrous oxide emissions from a Chinese subtropical wheat-rice rotation system. Soil Biol. Biochem. 2017, 115, 21–34. [Google Scholar] [CrossRef]
  10. Shan, J.; Yan, X. Effects of crop residue returning on nitrous oxide emissions in agricultural soils. Atmos. Environ. 2013, 71, 170–175. [Google Scholar] [CrossRef]
  11. Yao, Z.; Zheng, X.; Xie, B.; Mei, B.; Wang, R.; Butterbach-Bahl, K.; Zhu, J.; Yin, R. Tillage and crop residue management significantly affects N-trace gas emissions during the non-rice season of a subtropical rice-wheat rotation. Soil Biol. Biochem. 2009, 41, 2131–2140. [Google Scholar] [CrossRef]
  12. Intergovernmental Panel Climate Change. Fourth Assessment Report: Climate Change 2007: The AR4 Synthesis Report; IPCC: Geneva, Switzerland, 2007. [Google Scholar]
  13. Firestone, M.K.; Davidson, E.A. Microbiological basis of NO and N2O production and consumption in soil. In Exchange of Trace Gases Between Terrestrial Ecosystems and the Atmosphere, 1st ed.; Andreae, M., Schimel, D., Eds.; John Wiley and Sons Ltd Chichester: New York, NY, USA, 1990; Volume 47, pp. 7–21. [Google Scholar]
  14. Malhi, S.S.; Lemke, R. Tillage, Crop Residue and N Fertilizer Effects on Crop Yield, Nutrient Uptake, Soil Quality and Nitrous Oxide Gas Emissions in a Second 4-Yr Rotation Cycle. Soil Tillage Res. 2007, 96, 269–283. [Google Scholar] [CrossRef]
  15. Rowlings, D.W.; Grace, P.R.; Kiese, R.; Weier, K.L. Environmental factors controlling temporal and spatial variability in the soil-atmosphere exchange of CO2, CH4 and N2O from an Australian subtropical rainforest. Glob. Chang. Biol. 2012, 18, 726–738. [Google Scholar] [CrossRef]
  16. Vallejo, A.; Skiba, U.M.; Garcia, A.V.; Arce, A.; Lopez-Fernandez, S.; Sanchez-Martin, L. Nitrogen oxides emission from soils bearing a potato crop as influenced by fertilization with treated pig slurries and composts. Soil Biol. Biochem. 2006, 38, 2782–2793. [Google Scholar] [CrossRef]
  17. Jones, S.; Rees, R.; Skiba, U.; Ball, B. Influence of organic and mineral N fertiliser on N2O fluxes from a temperate grassland. Agric. Ecosyst. Environ. 2007, 121, 74–83. [Google Scholar] [CrossRef]
  18. Miller, M.; Zebarth, B.; Dandie, C.; Burton, D.; Goyer, C.; Trevors, J. Crop residue influence on denitrification, N2O emissions and denitrifier community abundance in soil. Soil Biol. Biochem. 2008, 40, 2553–2562. [Google Scholar] [CrossRef]
  19. Meijide, A.; Díez, J.A.; Sanchez-Martin, L.; López-Fernández, S.; Vallejo, A. Nitrogen oxide emissions from an irrigated maize crop amended with treated pig slurries and composts in a Mediterranean climate. Agric. Ecosyst. Environ. 2007, 121, 383–394. [Google Scholar] [CrossRef] [Green Version]
  20. Meijide, A.; García-Torres, L.; Arce, A.; Vallejo, A. Nitrogen oxide emissions affected by organic fertilization in a non-irrigated Mediterranean barley field. Agric. Ecosyst. Environ. 2009, 132, 106–115. [Google Scholar] [CrossRef]
  21. Ball, B.; McTaggart, I.; Scott, A. Mitigation of greenhouse gas emissions from soil under silage production by use of organic manures or slow-release fertilizer. Soil Use Manag. 2006, 20, 287–295. [Google Scholar] [CrossRef]
  22. Snyder, C.; Bruulsema, T.; Jensen, T.; Fixen, P. Review of greenhouse gas emissions from crop production systems and fertilizer management effects. Agric. Ecosyst. Environ. 2009, 133, 247–266. [Google Scholar] [CrossRef]
  23. Aronson, E.L.; Helliker, B.R. Methane flux in non-wetland soils in response to nitrogen addition: A meta-analysis. Ecology 2010, 91, 3242–3251. [Google Scholar] [CrossRef] [PubMed]
  24. Hütsch, B.W. Methane oxidation in non-flooded soils as affected by crop production—Invited paper. Eur. J. Agron. 2001, 14, 237–260. [Google Scholar] [CrossRef]
  25. Bodelier, P.L.; Laanbroek, H. Nitrogen as a regulatory factor of methane oxidation in soils and sediments. FEMS Microbiol. Ecol. 2004, 47, 265–277. [Google Scholar] [CrossRef]
  26. Raza, S.T.; Zhu, B.; Tang, J.L.; Ali, Z.; Anjum, R.; Bah, H.; Iqbal, H.; Ren, X.; Ahmad, R. Nutrients Recovery during Vermicomposting of Cow Dung, Pig Manure, and Biochar for Agricultural Sustainability with Gases Emissions. Appl. Sci. 2020, 10, 8956. [Google Scholar] [CrossRef]
  27. Zhang, J.; Zeng, G.; Chen, Y.; Yu, M.; Yu, Z.; Li, H.; Yu, Y.; Huang, H. Effects of physico-chemical parameters on the bacterial and fungal communities during agricultural waste composting. Bioresour. Technol. 2011, 102, 2950–2956. [Google Scholar] [CrossRef]
  28. Magrí, A. Research Trends on Nutrient Management From Digestates Assessed Using a Bibliometric Approach. Front. Sustain. Food Syst. 2018, 2. [Google Scholar] [CrossRef]
  29. Walsh, J.J.; Jones, D.L.; Edwards-Jones, G.; Williams, A.P. Replacing inorganic fertilizer with anaerobic digestate may maintain agricultural productivity at less environmental cost. J. Plant Nutr. Soil Sci. 2012, 175, 840–845. [Google Scholar] [CrossRef]
  30. Cui, Y.-F.; Meng, J.; Wang, Q.-X.; Zhang, W.-M.; Cheng, X.-Y.; Chen, W.-F. Effects of straw and biochar addition on soil nitrogen, carbon, and super rice yield in cold waterlogged paddy soils of North China. J. Integr. Agric. 2017, 16, 1064–1074. [Google Scholar] [CrossRef]
  31. Bah, H.; Zhou, M.; Ren, X.; Hu, L.; Dong, Z.; Zhu, B. Effects of organic amendment applications on nitrogen and phosphorus losses from sloping cropland in the upper Yangtze River. Agric. Ecosyst. Environ. 2020, 302, 107086. [Google Scholar] [CrossRef]
  32. Zhang, B.; Zhou, M.; Lin, H.; Ntacyabukura, T.; Wang, Y.; Zhu, B. Effects of different long-term crop straw management practices on ammonia volatilization from subtropical calcareous agricultural soil. Atmos. Ocean. Sci. Lett. 2020, 13, 232–239. [Google Scholar] [CrossRef] [Green Version]
  33. Zhu, B.; Wang, T.; Kuang, F.; Luo, Z.; Tang, J.; Xu, T. Measurements of Nitrate Leaching from a Hillslope Cropland in the Central Sichuan Basin, China. Soil Sci. Soc. Am. J. 2009, 73, 1419–1426. [Google Scholar] [CrossRef]
  34. Omirou, M.; Anastopoulos, I.; Fasoula, D.A.; Ioannides, I.M. The effect of chemical and organic N inputs on N2O emission from rain-fed crops in Eastern Mediterranean. J. Environ. Manag. 2020, 270, 110755. [Google Scholar] [CrossRef]
  35. Wang, J.; Zhu, B.; Zhang, J.; Müller, C.; Cai, Z. Mechanisms of soil N dynamics following long-term application of organic fertilizers to subtropical rain-fed purple soil in China. Soil Biol. Biochem. 2015, 91, 222–231. [Google Scholar] [CrossRef]
  36. Yuesi, W.; Yinghong, W. Quick measurement of CH4, CO2 and N2O emissions from a short-plant ecosystem. Adv. Atmos. Sci. 2003, 20, 842–844. [Google Scholar] [CrossRef]
  37. Zheng, X.; Xie, B.; Liu, C.; Zhou, Z.; Yao, Z.; Wang, Y.; Wang, Y.; Yang, L.; Zhu, J.; Huang, Y.; et al. Quantifying net ecosystem carbon dioxide exchange of a short-plant cropland with intermittent chamber measurements. Glob. Biogeochem. Cycles 2008, 22. [Google Scholar] [CrossRef]
  38. Parkin, T.B.; Venterea, R.T. USDA-ARS GRACEnet Project Protocols, Chapter 3. Chamber-Based Trace Gas Flux Measure-ments. In Sampling Protocols; USDA-ARS: Beltsville, MD, USA, 2010; pp. 1–39. [Google Scholar]
  39. Pelster, D.; Rufino, M.; Rosenstock, T.; Mango, J.; Saiz, G.; Diaz-Pines, E.; Baldi, G.; Butterbach-Bahl, K. Smallholder farms in eastern African tropical highlands have low soil greenhouse gas fluxes. Biogeosciences 2017, 14, 187–202. [Google Scholar] [CrossRef] [Green Version]
  40. Pelster, D.; Chantigny, M.H.; Rochette, P.; Angers, D.A.; Rieux, C.; Vanasse, A. Nitrous Oxide Emissions Respond Differently to Mineral and Organic Nitrogen Sources in Contrasting Soil Types. J. Environ. Qual. 2012, 41, 427–435. [Google Scholar] [CrossRef]
  41. Hillel, D. Soil and Water. In Physical Principles and Processes; Academic Press: Cambridge, MA, USA, 1971. [Google Scholar]
  42. Linquist, B.; van Groenigen, K.J.; Adviento-Borbe, M.A.; Pittelkow, C.; Van Kessel, C. An agronomic assessment of greenhouse gas emissions from major cereal crops. Glob. Chang. Biol. 2011, 18, 194–209. [Google Scholar] [CrossRef]
  43. Grassini, P.; Cassman, K.G. High-yield maize with large net energy yield and small global warming intensity. Proc. Natl. Acad. Sci. USA 2012, 109, 1074–1079. [Google Scholar] [CrossRef] [PubMed] [Green Version]
  44. Liu, D.; Sun, H.; Liao, X.; Luo, J.; Lindsey, S.; Yuan, J.; He, T.; Zaman, M.; Ding, W. N2O and NO Emissions as Affected by the Continuous Combined Application of Organic and Mineral N Fertilizer to a Soil on the North China Plain. Agronomy 2020, 10, 1965. [Google Scholar] [CrossRef]
  45. Liu, L.; Estiarte, M.; Peñuelas, J. Soil moisture as the key factor of atmospheric CH4 uptake in forest soils under environmental change. Geoderma 2019, 355, 113920. [Google Scholar] [CrossRef]
  46. Shimizu, M.; Hatano, R.; Arita, T.; Kouda, Y.; Mori, A.; Matsuura, S.; Niimi, M.; Jin, T.; Desyatkin, A.R.; Kawamura, O.; et al. The effect of fertilizer and manure application on CH4 and N2O emissions from managed grasslands in Japan. Soil Sci. Plant Nutr. 2013, 59, 69–86. [Google Scholar] [CrossRef] [Green Version]
  47. Hu, X.-K.; Su, F.; Ju, X.-T.; Gao, B.; Oenema, O.; Christie, P.; Huang, B.-X.; Jiang, R.-F.; Zhang, F.-S. Greenhouse gas emissions from a wheat–maize double cropping system with different nitrogen fertilization regimes. Environ. Pollut. 2013, 176, 198–207. [Google Scholar] [CrossRef] [PubMed]
  48. Bateman, E.J.; Baggs, E.M. Contributions of nitrification and denitrification to N2O emissions from soils at different water-filled pore space. Biol. Fertil. Soils 2005, 41, 379–388. [Google Scholar] [CrossRef]
  49. Kusa, K.; Sawamoto, T.; Hatano, R. Nitrous oxide emissions for 6 years from a gray lowland soil cultivated with onions in Hokkaido, Japan. Nutr. Cycl. Agroecosyst. 2002, 63, 239–247. [Google Scholar] [CrossRef]
  50. Saggar, S.; Jha, N.; Deslippe, J.; Bolan, N.; Luo, J.; Giltrap, D.; Kim, D.-G.; Zaman, M.; Tillman, R. Denitrification and N2O:N2 production in temperate grasslands: Processes, measurements, modelling and mitigating negative impacts. Sci. Total. Environ. 2012, 465, 173–195. [Google Scholar] [CrossRef]
  51. Li, M.; Shimizu, M.; Hatano, R. Evaluation of N2O and CO2 hot moments in managed grassland and cornfield, southern Hokkaido, Japan. Catena 2015, 133, 1–13. [Google Scholar] [CrossRef]
  52. Millar, N.; Robertson, G.; Grace, P.R.; Gehl, R.J.; Hoben, J.P. Nitrogen fertilizer management for nitrous oxide (N2O) mitigation in intensive corn (Maize) production: An emissions reduction protocol for US Midwest agriculture. Mitig. Adapt. Strat. Glob. Chang. 2010, 15, 185–204. [Google Scholar] [CrossRef] [Green Version]
  53. Iqbal, J.; Parkin, T.B.; Helmers, M.J.; Zhou, X.; Castellano, M. Denitrification and Nitrous Oxide Emissions in Annual Croplands, Perennial Grass Buffers, and Restored Perennial Grasslands. Soil Sci. Soc. Am. J. 2014, 79, 239–250. [Google Scholar] [CrossRef] [Green Version]
  54. Burchill, W.; Li, D.; Lanigan, G.J.; Williams, M.; Humphreys, J. Interannual variation in nitrous oxide emissions from perennial ryegrass/white clover grassland used for dairy production. Glob. Chang. Biol. 2014, 20, 3137–3146. [Google Scholar] [CrossRef] [PubMed] [Green Version]
  55. Butterbach-Bahl, K.; Baggs, L.; Dannenmann, M.; Kiese, R.; Zechmeister-Boltenstern, S. Nitrous oxide emissions from soils: How well do we understand the processes and their controls? Philos. Trans. R. Soc. B Biol. Sci. 2013, 368, 20130122. [Google Scholar] [CrossRef]
  56. Dasselaar, A.V.D.P.-V.; Van Beusichem, M.L.; Oenema, O. Effects of soil moisture content and temperature on methane uptake by grasslands on sandy soils. Plant Soil 1998, 204, 213–222. [Google Scholar] [CrossRef]
  57. Wu, X.; Wang, F.; Li, T.; Fu, B.; Lv, Y.; Liu, G. Nitrogen additions increase N2O emissions but reduce soil respiration and CH4 uptake during freeze–thaw cycles in an alpine meadow. Geoderma 2020, 363, 114157. [Google Scholar] [CrossRef]
  58. Wang, Y.; Cheng, S.; Fang, H.; Yu, G.; Xu, M.; Dang, X.; Li, L.; Wang, L. Simulated Nitrogen Deposition Reduces CH4 Uptake and Increases N2O Emission from a Subtropical Plantation Forest Soil in Southern China. PLoS ONE 2014, 9, e93571. [Google Scholar] [CrossRef]
  59. Castro, M.S.; Steudler, P.A.; Melillo, J.M.; Aber, J.D.; Bowden, R.D. Factors controlling atmospheric methane consumption by temperate forest soils. Glob. Biogeochem. Cycles 1995, 9, 1–10. [Google Scholar] [CrossRef]
  60. Zhou, M.; Zhu, B.; Wang, S.; Zhu, X.; Vereecken, H.; Brüggemann, N. Stimulation of N2O emission by manure application to agricultural soils may largely offset carbon benefits: A global meta-analysis. Glob. Chang. Biol. 2017, 23, 4068–4083. [Google Scholar] [CrossRef]
  61. Ren, F.; Zhang, X.; Liu, J.; Sun, N.; Wu, L.; Li, Z.; Xu, M. A synthetic analysis of greenhouse gas emissions from manure amended agricultural soils in China. Sci. Rep. 2017, 7, 1–13. [Google Scholar] [CrossRef]
  62. Musafiri, C.M.; Macharia, J.M.; Kiboi, M.N.; Ng’Etich, O.K.; Shisanya, C.A.; Okeyo, J.M.; Mugendi, D.N.; Okwuosa, E.A.; Ngetich, F.K. Soil greenhouse gas fluxes from maize cropping system under different soil fertility management technologies in Kenya. Agric. Ecosyst. Environ. 2020, 301, 107064. [Google Scholar] [CrossRef]
  63. Nyamadzawo, G.; Shi, Y.; Chirinda, N.; Olesen, J.E.; Mapanda, F.; Wuta, M.; Wu, W.; Meng, F.; Oelofse, M.; de Neergaard, A.; et al. Combining organic and inorganic nitrogen fertilisation reduces N2O emissions from cereal crops: A comparative analysis of China and Zimbabwe. Mitig. Adapt. Strat. Glob. Chang. 2014, 22, 233–245. [Google Scholar] [CrossRef]
  64. Mukumbuta, I.; Shimizu, M.; Hatano, R. Mitigating Global Warming Potential and Greenhouse Gas Intensities by Applying Composted Manure in Cornfield: A 3-Year Field Study in an Andosol Soil. Agriculture 2017, 7, 13. [Google Scholar] [CrossRef] [Green Version]
  65. Jin, T.; Shimizu, M.; Marutani, S.; Desyatkin, A.R.; Iizuka, N.; Hata, H.; Hatano, R. Effect of chemical fertilizer and manure application on N2O emission from reed canary grassland in Hokkaido, Japan. Soil Sci. Plant Nutr. 2010, 56, 53–65. [Google Scholar] [CrossRef] [Green Version]
  66. He, T.; Yuan, J.; Luo, J.; Wang, W.; Fan, J.; Liu, D.; Ding, W. Organic fertilizers have divergent effects on soil N2O emissions. Biol. Fertil. Soils 2019, 55, 685–699. [Google Scholar] [CrossRef]
  67. Masunga, R.H.; Uzokwe, V.N.; Mlay, P.D.; Odeh, I.; Singh, A.; Buchan, D.; De Neve, S. Nitrogen mineralization dynamics of different valuable organic amendments commonly used in agriculture. Appl. Soil Ecol. 2016, 101, 185–193. [Google Scholar] [CrossRef]
  68. Lin, S.; Zhang, S.; Shen, G.; Shaaban, M.; Ju, W.; Cui, Y.; Duan, C.; Fang, L. Effects of inorganic and organic fertilizers on CO2 and CH4 fluxes from tea plantation soil. Elem. Sci. Anth. 2021, 9. [Google Scholar] [CrossRef]
  69. Bah, H.; Ren, X.; Wang, Y.; Tang, J.; Zhu, B. Characterizing Greenhouse Gas Emissions and Global Warming Potential of Wheat-Maize Cropping Systems in Response to Organic Amendments in Eutric Regosols, China. Atmosphere 2020, 11, 614. [Google Scholar] [CrossRef]
  70. Zhou, M.; Zhu, B.; Butterbach-Bahl, K.; Zheng, X.; Wang, T.; Wang, Y. Nitrous oxide emissions and nitrate leaching from a rain-fed wheat-maize rotation in the Sichuan Basin, China. Plant Soil 2012, 362, 149–159. [Google Scholar] [CrossRef]
  71. López-Fernández, S.; Díez, J.A.; Hernáiz, P.; Arce, A.; Garcia, A.V.; Vallejo, A. Effects of fertiliser type and the presence or absence of plants on nitrous oxide emissions from irrigated soils. Nutr. Cycl. Agroecosyst. 2007, 78, 279–289. [Google Scholar] [CrossRef]
  72. Van Groenigen, J.W.; Velthof, G.; Oenema, O.; van Groenigen, K.J.; Van Kessel, C. Towards an agronomic assessment of N2O emissions: A case study for arable crops. Eur. J. Soil Sci. 2010, 61, 903–913. [Google Scholar] [CrossRef]
  73. Rahman, M. Carbon Dioxide Emission from Soil. Agric. Res. 2013, 2, 132–139. [Google Scholar] [CrossRef] [Green Version]
  74. Shrestha, B.M.; Chang, S.X.; Bork, E.W.; Carlyle, C.N. Enrichment Planting and Soil Amendments Enhance Carbon Sequestration and Reduce Greenhouse Gas Emissions in Agroforestry Systems: A Review. Forests 2018, 9, 369. [Google Scholar] [CrossRef] [Green Version]
  75. Kitamura, R.; Sugiyama, C.; Yasuda, K.; Nagatake, A.; Yuan, Y.; Du, J.; Yamaki, N.; Taira, K.; Kawai, M.; Hatano, R. Effects of Three Types of Organic Fertilizers on Greenhouse Gas Emissions in a Grassland on Andosol in Southern Hokkaido, Japan. Front. Sustain. Food Syst. 2021, 5, 100. [Google Scholar] [CrossRef]
  76. Zhang, T.; Liu, H.; Luo, J.; Wang, H.; Zhai, L.; Geng, Y.; Li, J.; Lei, Q.; Bashir, M.A.; Wu, S.; et al. Long-term manure application increased greenhouse gas emissions but had no effect on ammonia volatilization in a Northern China upland field. Sci. Total. Environ. 2018, 633, 230–239. [Google Scholar] [CrossRef] [PubMed]
  77. Adair, E.C.; Barbieri, L.; Schiavone, K.; Darby, H.M. Manure Application Decisions Impact Nitrous Oxide and Carbon Dioxide Emissions during Non-Growing Season Thaws. Soil Sci. Soc. Am. J. 2019, 83, 163–172. [Google Scholar] [CrossRef]
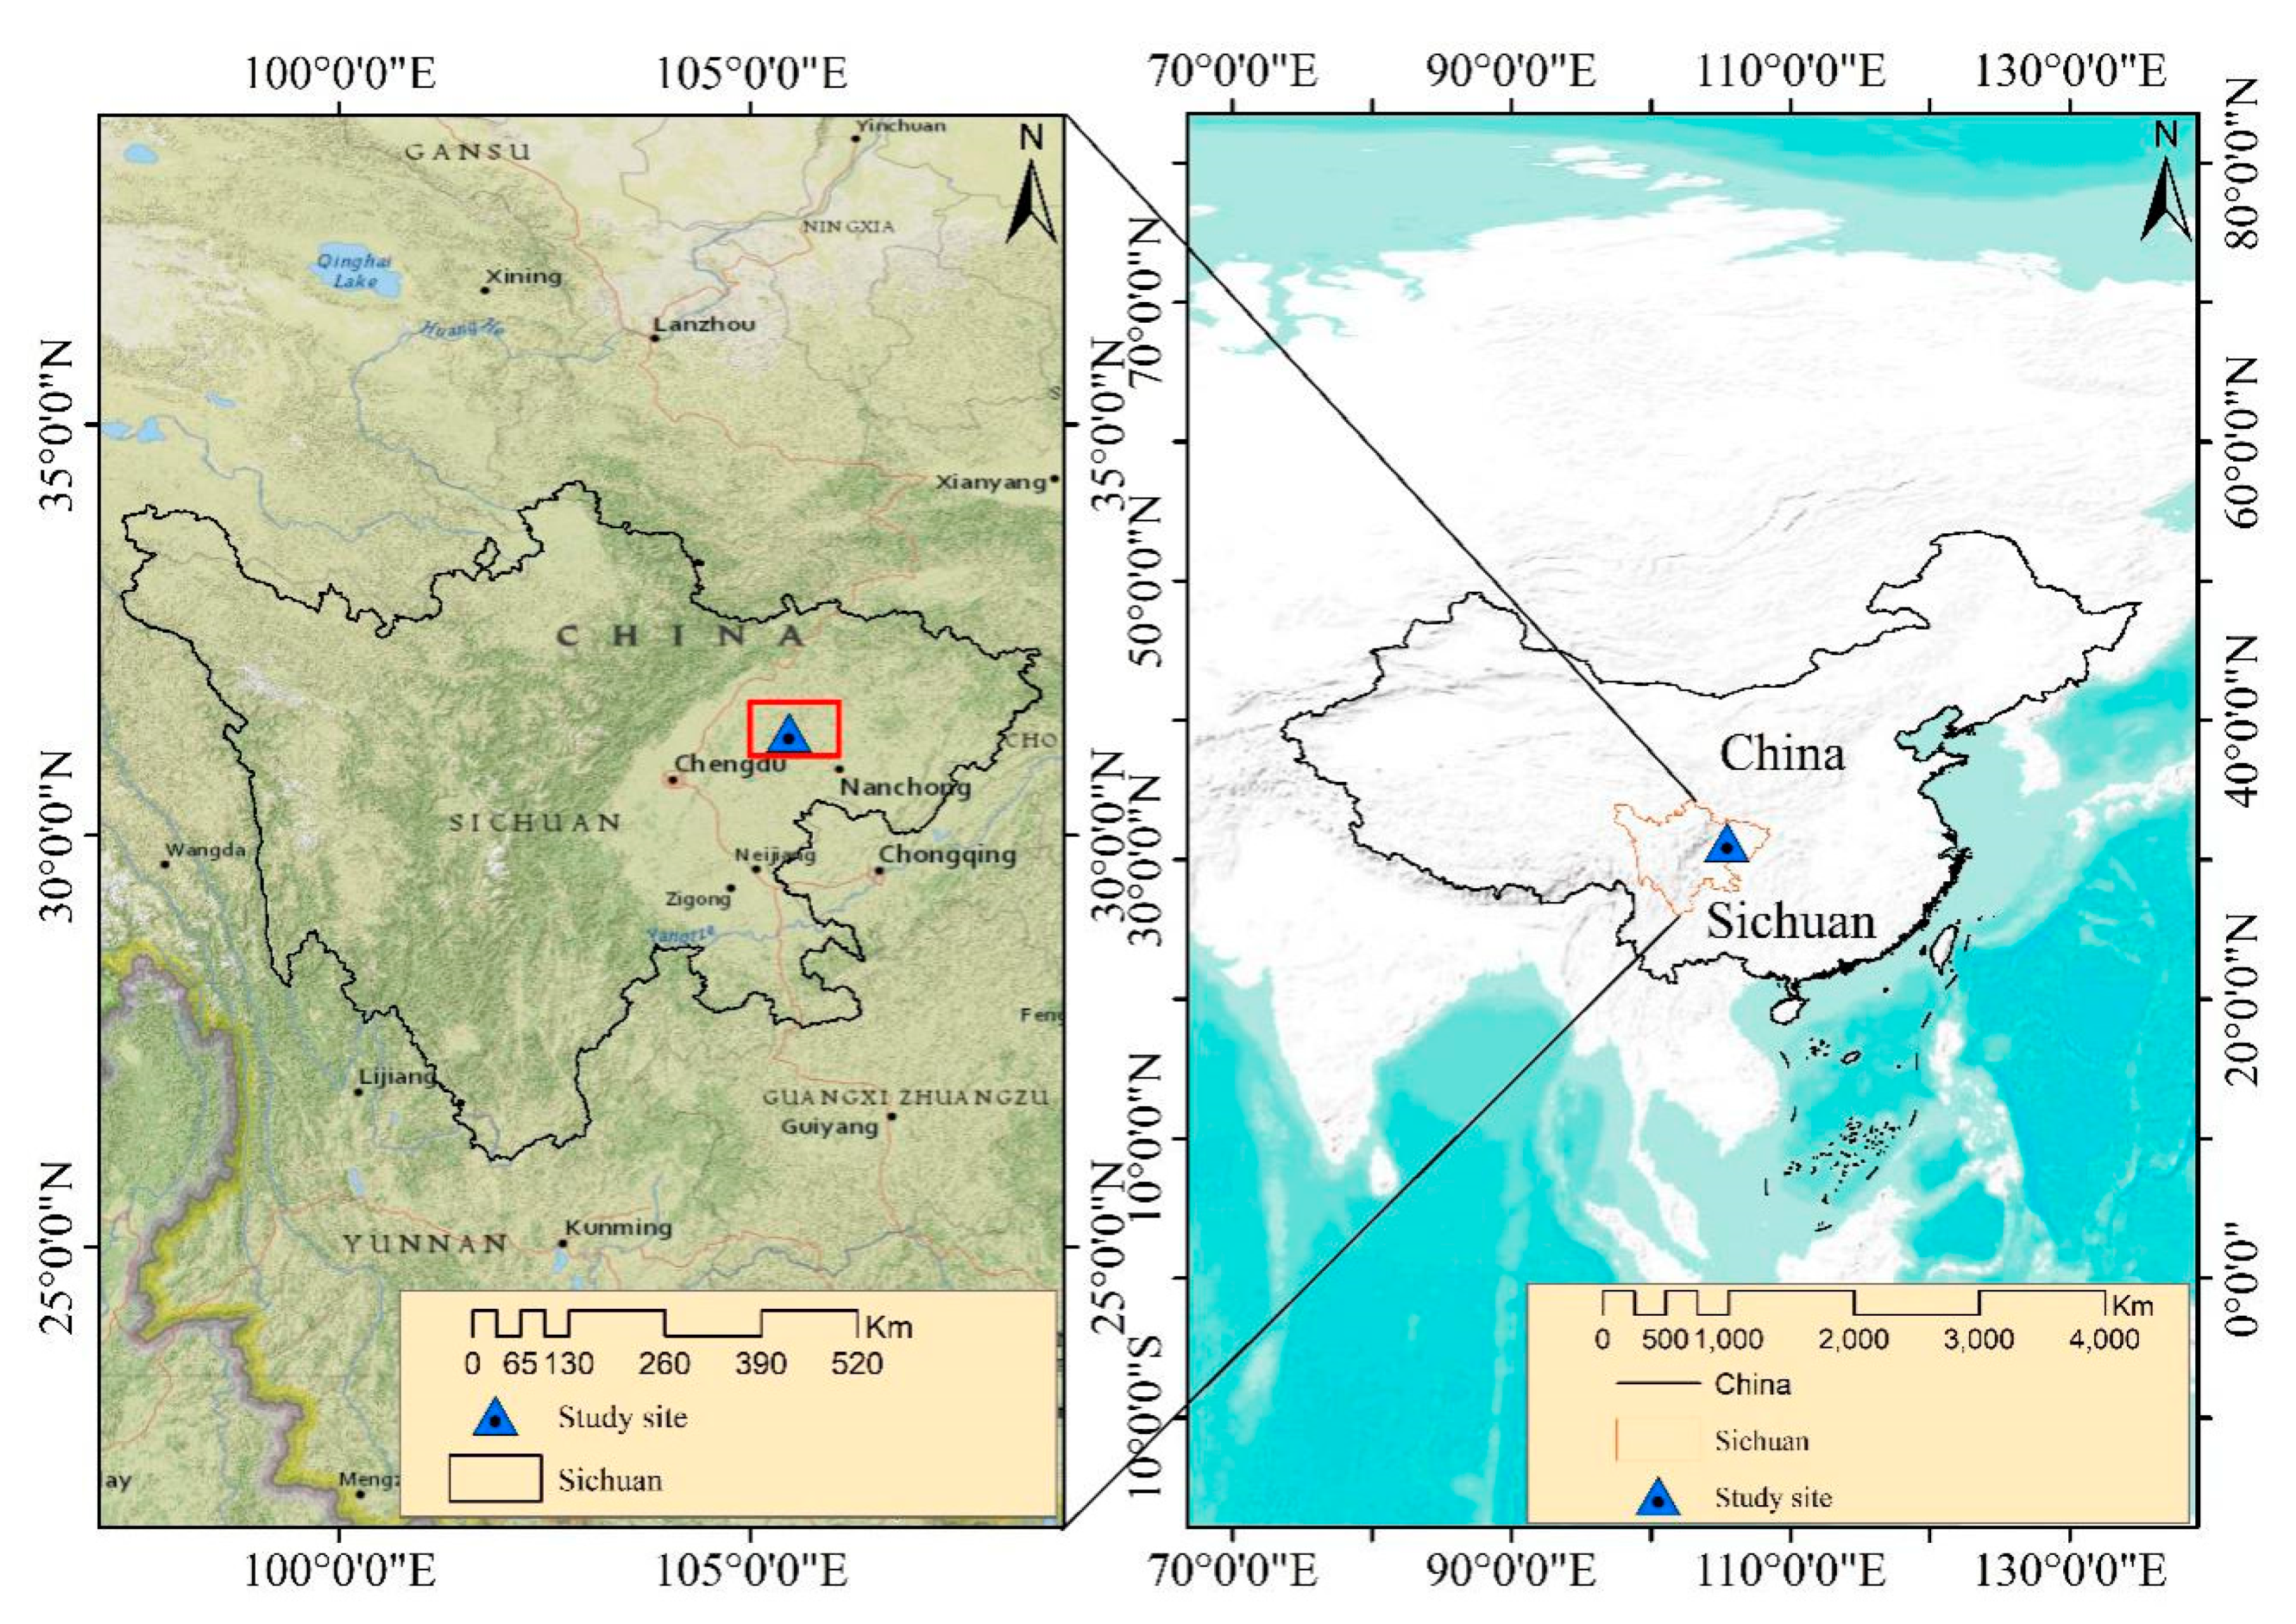
Figure 1. Map of the study area.
Atmosphere 12 01104 g001
Figure 2. Variations in (a) daily precipitation and air temperature, (b) soil temperature at 5 cm, (c) soil moisture. Error bars have been omitted for clarity. The dashed line indicates the transition between planting seasons, and points indicate average measurements.
Atmosphere 12 01104 g002
Figure 3. Seasonal variations in (i) soil ammonium (NH4+) content, (ii) soil nitrate (NO3) content and (iii) soil dissolved organic carbon (DOC) content (a) during wheat season’s experimental period from November 2019 to May 2020 and (b) during maize season’s experimental period from June 2020 to September 2020. The vertical bars indicate the standard errors of different replications (n = 4). The vertical arrows indicate the date of planting and fertilization.
Atmosphere 12 01104 g003aAtmosphere 12 01104 g003b
Figure 4. Seasonal variations in (i) soil methane (CH4) fluxes and (ii) soil nitrous oxide (N2O) emissions (a) during wheat season’s experimental period from November 2019 to May 2020 and (b) during maize season’s experimental period from June 2020 to September 2020. The vertical bars indicate the standard errors of different replications (n = 4). The vertical arrows indicate the date of planting and fertilization.
Atmosphere 12 01104 g004aAtmosphere 12 01104 g004b
Figure 5. Yield-scaled global warming potential associated with each fertilization treatment. The vertical bars indicate the standard errors of different replications (n = 4). Different lower case letters indicate a statistical difference (p < 0.01) among the fertilized treatments.
Atmosphere 12 01104 g005
Table 1. Nitrogen fertilizer forms and application rates.
Winter Wheat SeasonSummer Maize Season
TreatmentUrea
(kg N ha−1)
Pig
Manure
(kg N ha−1)
Compost
(kg N ha−1)
Total N
Applied
(kg N ha−1)
Urea
(kg N ha−1)
Pig
Manure
(kg N ha−1)
Compost
(kg N ha−1)
Total N
Applied
(kg N ha−1)
NPK1300013015000150
PM3091390130105450150
PM506565013075750150
PM7039910130451050150
PM1000130013001500150
CMRC65065 113075075 1150
PMRC65065 213075075 2150
Synthetic N fertilizer (NPK), 30% pig manure + 70% synthetic N fertilizer (PM30), 50% pig manure + 50% synthetic N fertilizer (PM50), 70% pig manure + 30% synthetic N fertilizer (PM70), 100% pig manure (PM100), 50% cow manure-crop residue compost + 50% synthetic N fertilizer (CMRC), and 50% pig manure-crop residue compost + 50% synthetic N fertilizer (PMRC). 1 Cow manure-crop residue compost, 2 Pig manure-crop residue compost.
Table 2. Physicochemical properties of the organic amendments used.
Organic Amendment AddedTotal N
Content 1 (%)
Total C
Content 1 (%)
C:N RatioTotal P
Content 1 (g kg−1)
Total K
Content 1 (g kg−1)
Pig Manure2.2 ± 0.131.4 ± 0.614.1:15.7 ± 0.416.8 ± 0.6
Pig manure-crop residue compost2.0 ± 0.125.1 ± 0.712.5:17.7 ± 0.312.1 ± 2.2
Cow manure-crop residue compost1.9 ± 0.024.9 ± 0.313.1:13.4 ± 0.313.8 ± 2.0
1 Average of four replicates ± standard error.
Table 3. Cumulative soil greenhouse gas (GHG) fluxes, grain yields and combined global warming potential (GWP) as influenced by different fertilization treatments.
TreatmentCumulative N2O Emissions
(kg N ha−1) *
Cumulative CH4 Fluxes
(kg C ha−1) *
Wheat Grain Yield
(kg ha−1)
Maize Grain Yield
(kg ha−1)
Combined GWP
(kg CO2 eq ha−1) *
NPK0.93 ± 0.1 a−0.65 ± 0.1 a3106.6 ± 23.1 a7309.8 ± 46.4 a412.0 ± 38.8 a
PM300.63 ± 0.1 b−0.52 ± 0.0 a2880.7 ± 20.6 a6170.8 ± 38.9 ab289.9 ± 26.7 b
PM500.50 ± 0.1 bc−0.68 ± 0.1 a2894.4 ± 27.1 a5979.0 ± 53.1 ab209.6 ± 29.9 bc
PM700.40 ± 0.0 c−0.62 ± 0.0 a2478.2 ± 13.0 b5866.0 ± 40.3 b162.7 ± 17.0 c
PM1000.43 ± 0.0 c−0.65 ± 0.0 a1997.4 ± 11.6 b5384.5 ± 51.3 b177.8 ± 16.9 c
CMRC0.46 ± 0.1 bc−0.59 ± 0.0 a2706.4 ± 11.5 a6700.0 ± 34.8 ab197.2 ± 27.0 bc
PMRC0.39 ± 0.1c−0.60 ± 0.0 a3030.5 ± 12.2 a6657.3 ± 54.0 ab161.2 ± 28.1 c
Means with the same letter along the column are not significantly different at p < 0.01. * The cumulative N2O, CH4 and combined GWP reported are based on the measurements in the summer maize season.
Table 4. Correlations of greenhouse gas and soil properties under different fertilization treatments.
TreatmentsSoil TemperatureNH4+NO3Available N (NH4+ + NO3)DOCSoil Moisture
N2ONPK0.2480.576 **0.677 **0.634 **0.430 *−0.419 *
PM300.441 *0.716 **0.733 **0.422 *0.383 *−0.393 *
PM500.494 **0.502 **0.605 **0.491 **0.270−0.266
PM700.414 *0.525 **0.586 **0.516 **0.221−0.401 *
PM1000.3330.2050.515 **0.501 **0.307−0.352 *
CMRC0.367 *0.2770.459 *0.420 *0.060−0.241
PMRC0.2190.389 *0.482 **0.406 *0.066−0.209
CH4NPK−0.147−0.222−0.446 *−0.361−0.0730.214
PM30−0.083−0.349−0.383 *−0.405 *−0.0230.427 *
PM50−0.364 *−0.241−0.413 *−0.366 *−0.0660.241
PM70−0.035−0.042−0.288−0.197−0.2910.120
PM100−0.195−0.091−0.421 *−0.444 *−0.2710.439 **
CMRC−0.185−0.192−0.478 **−0.386 *−0.2380.488 **
PMRC0.320−0.361−0.497 **−0.2240.0040.454 **
** Correlation is significant at 0.01 level (2-tailed). * Correlation is significant at 0.05 level (2-tailed).
Publisher’s Note: MDPI stays neutral with regard to jurisdictional claims in published maps and institutional affiliations.