Article

Contrasting Signals of the Westerly Index and North Atlantic Oscillation over the Drought Sensitivity of Tree-Ring Chronologies from the Mediterranean Basin

Physical, Chemical and Natural Systems Department, Faculty of Experimental Sciences, Universidad Pablo de Olavide, 41013 Sevilla, Spain
*
Author to whom correspondence should be addressed.
Atmosphere 2020, 11(6), 644; https://doi.org/10.3390/atmos11060644
Submission received: 2 June 2020 / Revised: 11 June 2020 / Accepted: 15 June 2020 / Published: 17 June 2020
(This article belongs to the Special Issue Long Term Climate Variability in the Mediterranean Region)

Abstract

:
Extreme drought events are becoming increasingly frequent and extended, particularly in Mediterranean drought-prone regions. In this sense, atmospheric oscillations patterns, such as those represented by the North Atlantic Oscillation (NAO) index and the Westerly Index (WI) have been widely proven as reliable proxies of drought trends. Here, we used the Standardized Precipitation–Evapotranspiration Index (SPEI), as a reliable indicator of drought, to investigate the drought sensitivity of tree-ring width data (TRW) from several long-lived tree species (Abies borisii-regis, Abies cilicica, Abies pinsapo, Cedrus atlantica, Cedrus libanii, Pinus nigra, Pinus heldreichii). NAO and WI relations with TRW were also investigated in order to identify potential non-stationary responses among those drought proxies. Our temporal and spatial analyses support contrasting Mediterranean dipole patterns regarding the drought sensitivity of tree growth for each tree species. The spatial assessment of NAO and WI relationships regarding SPEI and TRW showed on average stronger correlations westward with non-stationary correlations between annual WI index and TRW in all species. The results indicate that the drought variability and the inferred drought-sensitive trees species (e.g., C. atlantica) are related to the NAO and the WI, showing that TRW is a feasible proxy to long-term reconstructions of Westerly Index (WI) variability in the Western Mediterranean region. Spatial variability of drought severity suggests a complex association between NAO and WI, likely modulated by an east–west Mediterranean climate dipole.

1. Introduction

Climate change-related drought events are becoming increasingly frequent and extended [1]. The influence of climate change on drought variability is particularly significant in drought-prone regions, such as the Mediterranean Basin, a biodiversity hotspot where warming and increasing droughts frequency are expected over the 21st century [2]. The Mediterranean mountains have a complex climatology due to the situation of transition between arid climates in the south to temperate climates in northern forests [3,4,5,6]. Thus, the predicted changes in drought trends are linked to shifting atmospheric circulation patterns with contrasting impacts at the regional scale, such as the North Atlantic Oscillation (NAO), one of the main atmospheric circulation patterns affecting the surface climate of continental Europe and North Africa [3,4,5,6].
Present and future paleoclimate research should therefore focus more on regional climatic and environmental responses to global or hemispherical changes, as well as on changes specific to the past hydrological cycle [7]. The calibration of future climate scenarios for the Mediterranean region is challenging because local and regional climate fluctuations exhibit a high degree of spatial and temporal variability due to the complex relationships of synoptic nodes [8] and the contrasting seasonal patterns along an east–west Mediterranean dipole [9,10,11]. Large-scale climate indices can help to explain temporal climate variability (e.g., monthly temperature and precipitation) and its associations with local ecological processes [12]. The influence of large-scale atmospheric circulation patterns were discussed in depth for Mediterranean forests [13,14,15]; however, the connection among forest growth, drought variability, and the circulation patterns across the Mediterranean forests is rarely considered [10,11].
In order to provide a more accurate measurement of the local influence of the atmospheric mechanisms driving drought variability across Europe [16], here, we analyze the impact of NAO, the oscillation of an air mass between the Artic and the subtropical Atlantic, that modulates winter and spring precipitation and temperature across the Western Mediterranean [17,18,19] and the Westerly Index (WI), which measures the frequency of the days with westerly winds over the English Channel with records back to the 17th century [20], via the Standardized Precipitation–Evapotranspiration Index (SPEI), which is a composed drought index obtained from different time scales [21]. Previous studies showed that the WI shows a strong signal on local precipitation and temperature and that NAO and SPEI are complementary to large spatial patterns of drought [16,20,22]. However, the heterogeneous climatology of the Mediterranean Basin reveals contrasting eastern and western drought patterns and their influence on regional hydrological cycles [9,11]. For this reason, a better understanding of the variability of large and local mechanisms of drought variability in the Mediterranean is needed in order to improve the resolution of forecasts of the climate change impacts on the Mediterranean Basin [23].
However, to define more accurate future scenarios of drought (SPEI), NAO, WI, and local climate data are needed for calibration to account for low-frequency (multidecadal) variability (cf. [16]). Tree-ring width (TRW) series are used as a proxy to extend back in time the influence of local climate conditions, NAO signal, and drought variability at a high resolution [19,24,25,26]. In fact, recent dendroclimatological studies in the Mediterranean basin have demonstrated a strong coherence between TRW series and large-scale atmospheric circulation patterns, although these studies are largely restricted to the last few centuries and some regions [7,9,27,28]. In this sense, disentangling the controls of instrumental atmospheric indices (e.g., NAO, WI) on long historical drought variability in the Mediterranean area and their associated climate variables is highly desirable to obtain high-resolution and annually resolved climate reconstructions based on long-term dendroclimatological proxies [29].
In this study, we evaluated for the first time the potential of TRW for dendroclimatic reconstructions across the Mediterranean Basin of the interconnected large-scale atmospheric circulation indices (NAO, WI) and drought (SPEI) [5]. Our aims are: (1) to compare the regional climate, NAO, WI, and SPEI signals contained in tree-ring width series across the Mediterranean area, (2) to analyze the temporal stability and changes in the spatial pattern of these relationships over the 20th century, and (3) to explore the potential of these TRW series for dendroclimatic reconstructions of WI, NAO, and drought (SPEI). We hypothesized that western forests subjected to the increasingly drier conditions [10] will be the most responsive to NAO and WI indices, whereas eastern forests will be most sensitive to drought variability and spring precipitation. To test these hypotheses, we examined climate–growth associations and their variability across the Mediterranean Basin.

2. Material and Methods

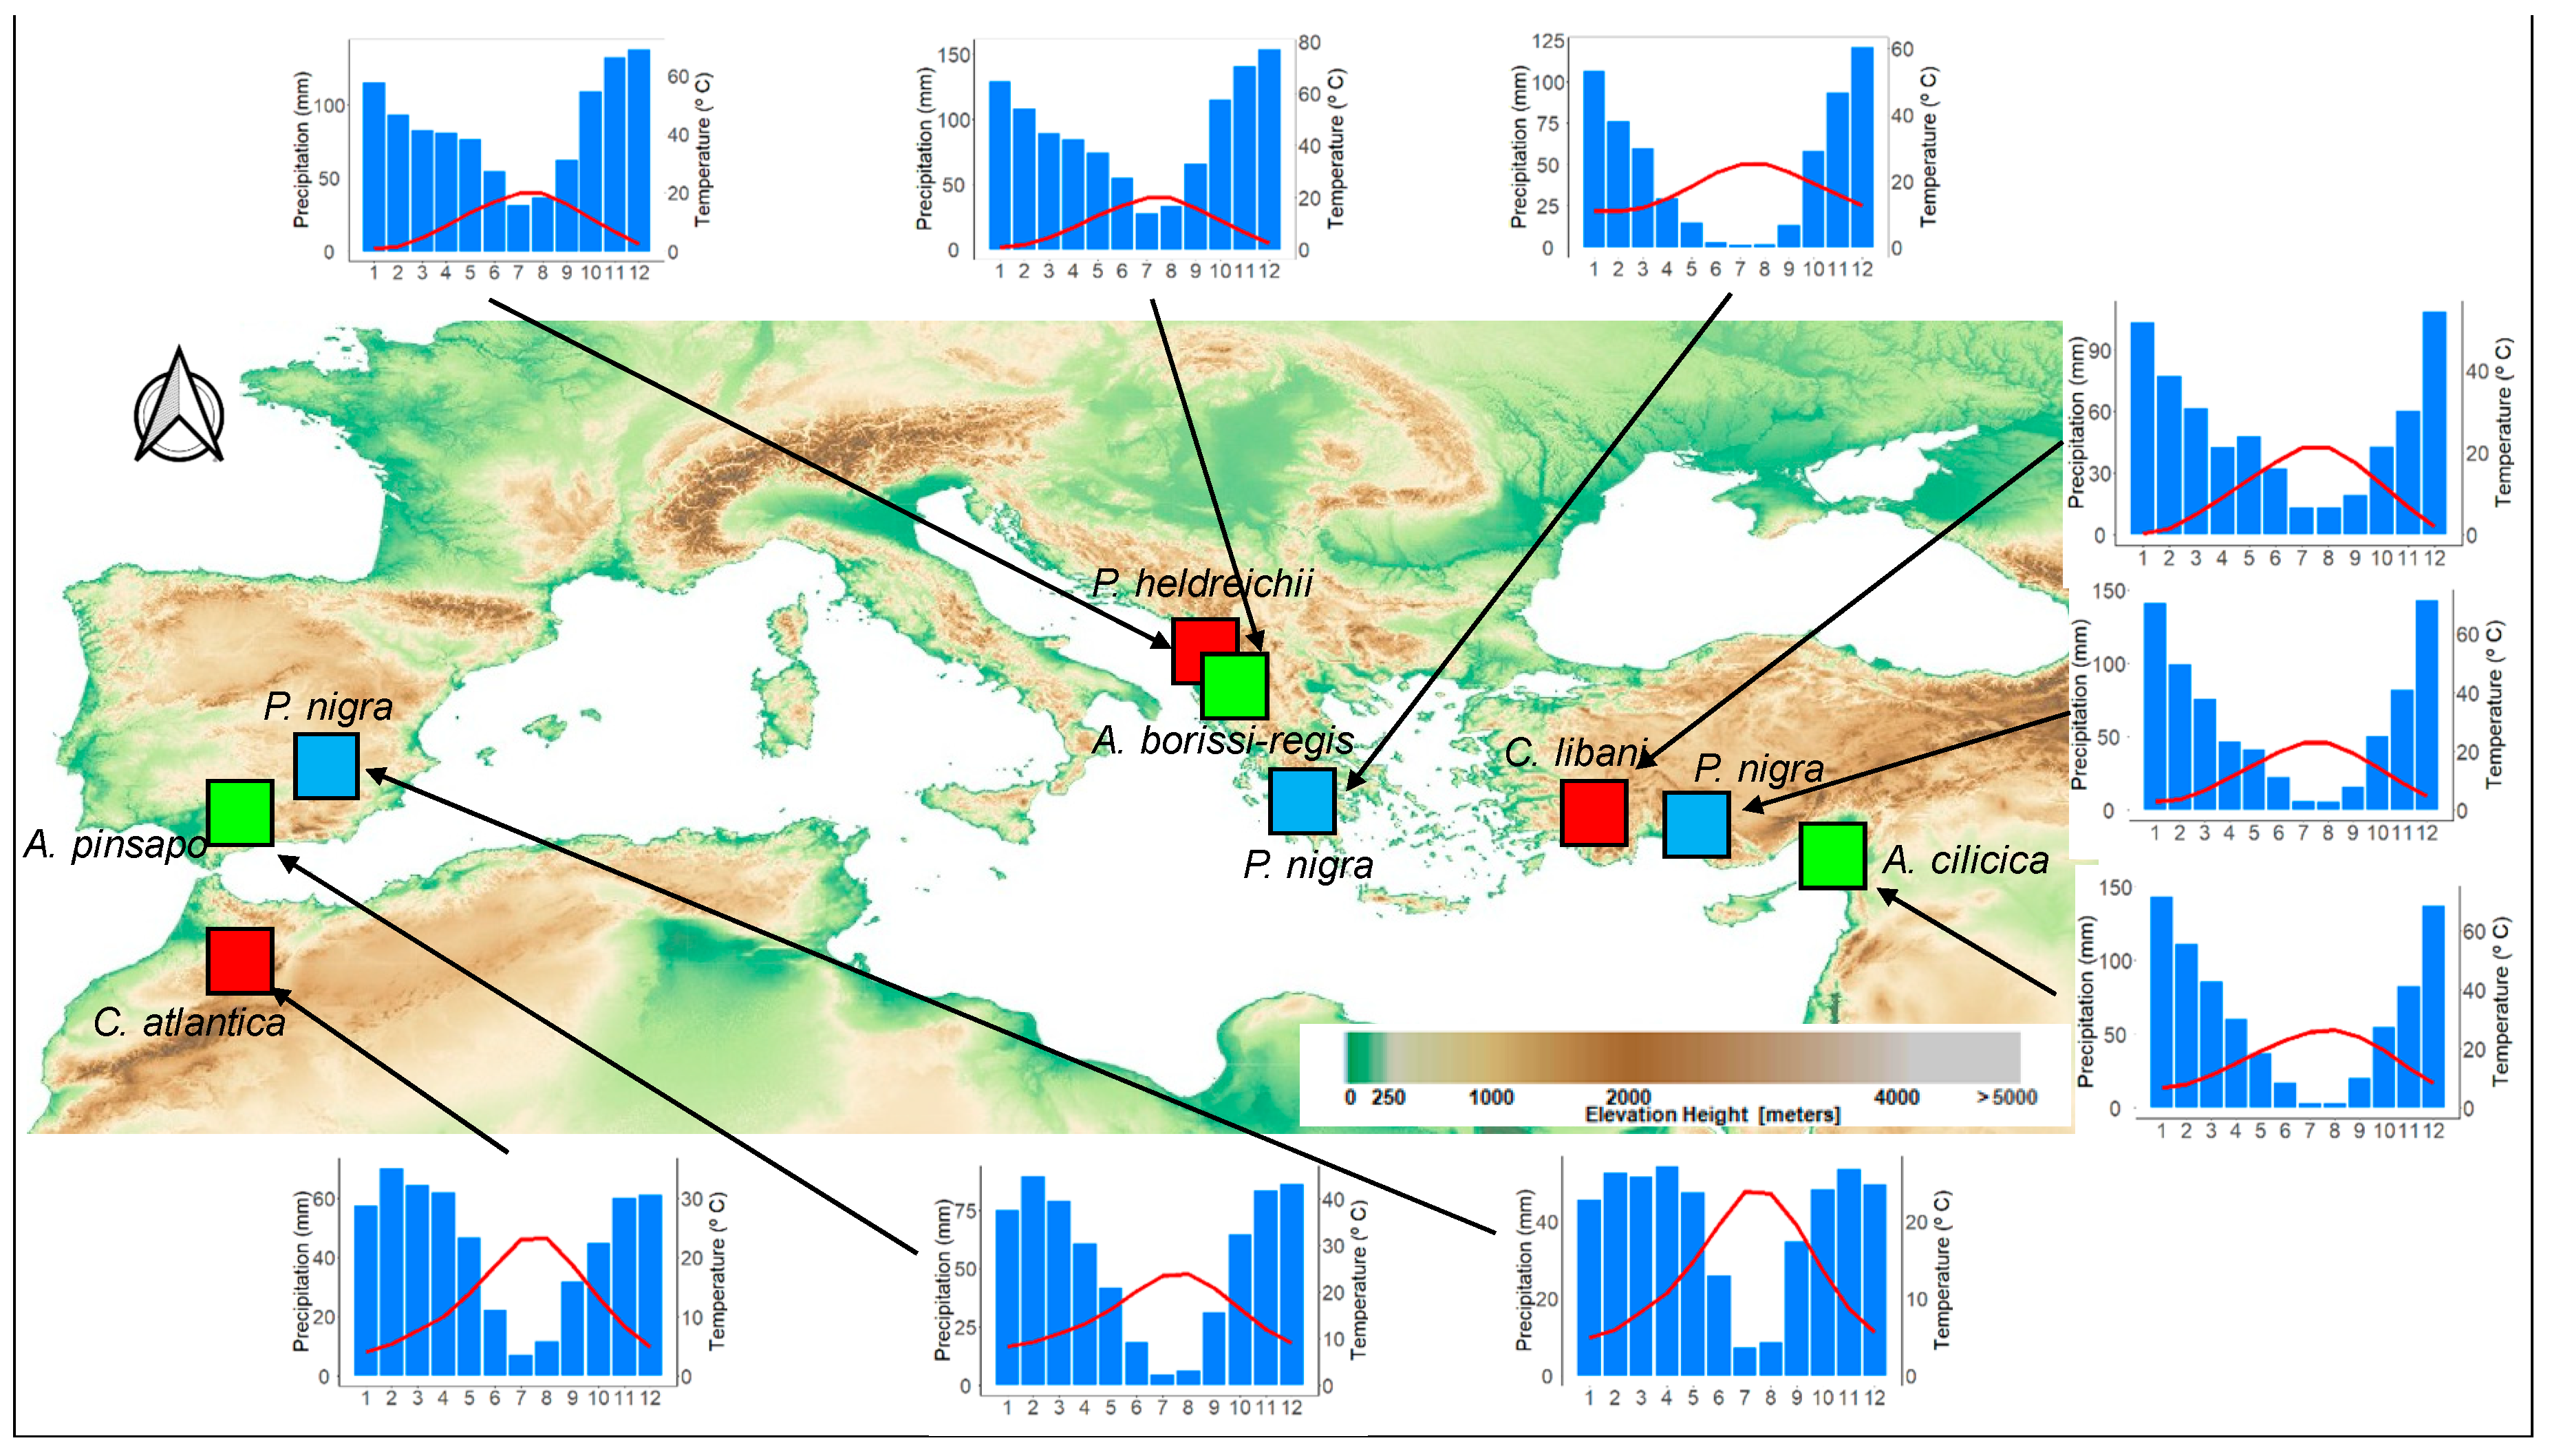
2.1. Study Area and Tree Species

We compiled tree-ring data from 403 trees (513 cores) of seven species from west to east distribution across the Mediterranean region (Figure 1 and Table 1). We selected a network of suitable sites from the International Tree-Ring Databank (ITRDB http://www.ncdc.noaa.gov/paleo/treering.html; [30,31,32,33,34,35,36,37,38]) distributed in three contrasting regions over the Mediterranean Basin, from the west (three sites: Abies pinsapo Boiss.; Pinus nigra Arn.; and Cedrus atlantica (Endl.) Manetti ex Carrière), center (three sites: Abies borisii-regis Mattfeld.; P. nigra; and Pinus heldreichii Christ.), and east (three sites: Abies cilicica (Antoine & Kotschy) Carrière; P. nigra; and Cedrus libanii A. Rich.). Only raw chronologies spanning more than 120 years, with an inter-series correlation (rbt) above 0.45, were considered in this study (Table 2). The studied species belong to diverse forests encompassing a wide climatic gradient (total annual precipitation: 554–890 mm; mean annual temperature: 12.5–13.7 °C) and contrasting elevation gradient (1144–2200 m a.s.l.) (Figure 1).

2.2. Dendrochronological Dataset and Chronology Building

In each site, dominant or codominant living trees from undisturbed sites were sampled (Table 1) following dendrochronological methods [26]. To remove the age-related trend and non-climatic signals (e.g., past management or competition) and to preserve growth variation on inter-annual to multi-decadal timescales, we detrended raw tree-ring width series using a double detrending procedure; first, fitting a negative exponential function followed by 120-year-long splines, which maximized the high-frequency climatic information and minimized the non-climatic variance related to ontogenetic and local disturbance trends [39]. Detrending allowed transforming individual tree-ring series to dimensionless growth indices (hereafter TRWi) by dividing observed ring values by fitted values. The resulting series were pre-whitened by autoregressive models to remove temporal autocorrelation. We performed a variance stabilization technique for every single series for minimizing the effects of changing sample size throughout time. Mean site chronologies were then calculated using a bi-weight robust mean [40]. To assess the statistical quality of tree-ring width series, several dendrochronological parameters were calculated considering the common period 1901–2010 [26]: AC, first-order autocorrelation for raw tree-ring series (a measure of the year-to-year growth similarity); MS, mean sensitivity (a measure of the year-to-year variability in width or other variables over consecutive tree rings); rbt, mean between-trees correlation of indexed values; SNR, signal-to-noise ratio; PC1, the percentage of variance accounted for by the first principal component which accounts for the common variability in growth among all trees at each site; and EPS, expressed population signal (a measure of the statistical quality of the mean site chronology as compared with an infinite perfectly replicated chronology). The chronology segment with EPS > 0.85 was considered as the common interval that was statistically reliable [41].

2.3. Climate Data, Drought Index, and Large-Scale Atmospheric Oscillations

Climate data over the 20th century in each of the nine study sites were obtained from a high-resolution gridded data from CRU TS 3.0 (University of East Anglia Climate Research Unit (CRU)) [42] with 0.5° of resolution. To assess the climate sensitivity of the individual site chronologies with respect to monthly mean temperature and monthly precipitation, the common period of 1930–2010 was considered. To evaluate the effect of drought intensity and duration on tree growth, we used the Standardized Precipitation–Evapotranspiration Index (SPEI), which is calculated using precipitation and temperature data from the same homogeneous and spatially dense dataset of local observatories as the CRU climate data [21] by using the SPEI library in the R environment [43]. The SPEI monthly values were calculated for the studied sites considering the period of 1901–2010 and from 1- to 24-month-long scales, since this is a multi-scalar index to observe the cumulative effects of drought. The SPEI accounts for the negative effect of warmer temperatures on water availability by statistically modelling cumulative water balances. For the SPEI, NAO, and WI comparison, we used 3-month (hereafter SPEI3) scales, since [22,23] showed the higher correlations among atmospheric circulation indices and drought for short-term scales in the Mediterranean.
We assessed spatial and temporal effects of the North Atlantic Oscillation (NAO) and the Westerly Index (WI) on tree radial growth of each site, given their wide spatial scale of influence [44]. The NAO is a north–south dipole that determines the position of the Icelandic low pressure and the Azores high-pressure systems and, therefore, the climatic patterns in Southwestern Europe, which allows extending its record beyond the 19th century [28]. The NAO monthly data were downloaded from the Climate Research Unit webpage (https://crudata.uea.ac.uk/cru/data/pci.htm; [42]). The Westerly Index (WI) quantifies the Atlantic air masses that enter Europe by measuring the frequency of days with westerly winds over the English Channel for each month since 1685. The WI provides information, better in winter and summer than in transition seasons, about temperature and precipitation anomalies over large areas of Europe. Usually, its climatic signal is similar to the one provided by NAO, but its signal is better than that of NAO during summer and very similar during the rest of the year. It is important to notice that even when the climatic signals of NAO and WI tend to be similar, it has been described that both indices were disconnected during some decades of the 20th century and during some longer periods in the previous centuries. It is also important to highlight that the WI has been a completely instrumental index during its whole duration (more than 350 years), and this cannot be said for any equivalent index (NAO reconstructions are mostly based in proxy data for its reconstructions before the 19th century) (see [20] for further information). Thus, the WI seems to be a better index than NAO to calibrate and analyze the climatic signal of climatic records with lengths of several centuries.

2.4. Statistical Analysis

To compare the SPEI, NAO, and WI signals in tree-ring growth, we used Pearson correlations and spatial patterns of the relationships between indices using the KNMI Climate Explorer (http://climexp.knmi.nl/, [45]). Temporal trends of SPEI3 for each site and regional NAO and WI indices were estimated using Mann–Kendall coefficients, respectively. To quantify the influence of monthly climate data (mean temperature and precipitation) and SPEI3, NAO, and WI indices on growth, bootstrapped correlations were carried out for the common period of 1901–2010. These correlations were calculated from previous August to current December, i.e., prior to and during the year of tree-ring formation, based on previous analyses of the study species’ growth responses to climate [11]. To assess whether these relationships were stable through time, we calculated 30-year-long moving correlations, taking into consideration only those climate variables strongly and significantly (p < 0.05) correlated with TRWi. We also calculated Pearson correlations between TRWi and SPEI obtained for 1- to 24-month long scales [46].
Finally, we built a transfer function model using ordinary least square regressions based on significant (p < 0.01) sites’ signals related to mean temperature, total precipitation, SPEI3, NAO, and WI indices. The transfer function model used TRWi as the predictor and the climate variables as the predictands. The skill of TRWi for reconstructing past climate was tested by a split-sample procedure and verified the stability of the model [47]. This procedure divided the study period into two equal subperiods, which were used as calibration and verification periods, respectively. The models were evaluated using regression statistics such as R2, the reduction of error statistic (RE), the coefficient of efficiency (CE), and the Durbin–Watson test (DW). The value of RE theoretically ranges from minus infinity to +1.0, and an RE value greater than 0 is considered positive skill of the model [26]. The calculated transfer function was then applied to the site chronology to obtain the time series of the reconstructed abovementioned climate variables and indices. Bootstrapped and moving correlations, as well as the transfer function model, were calculated using the software treeclim [48]. All stages of chronology building and data analyses were performed using the package dplR [49] in the R environment [50].

3. Results

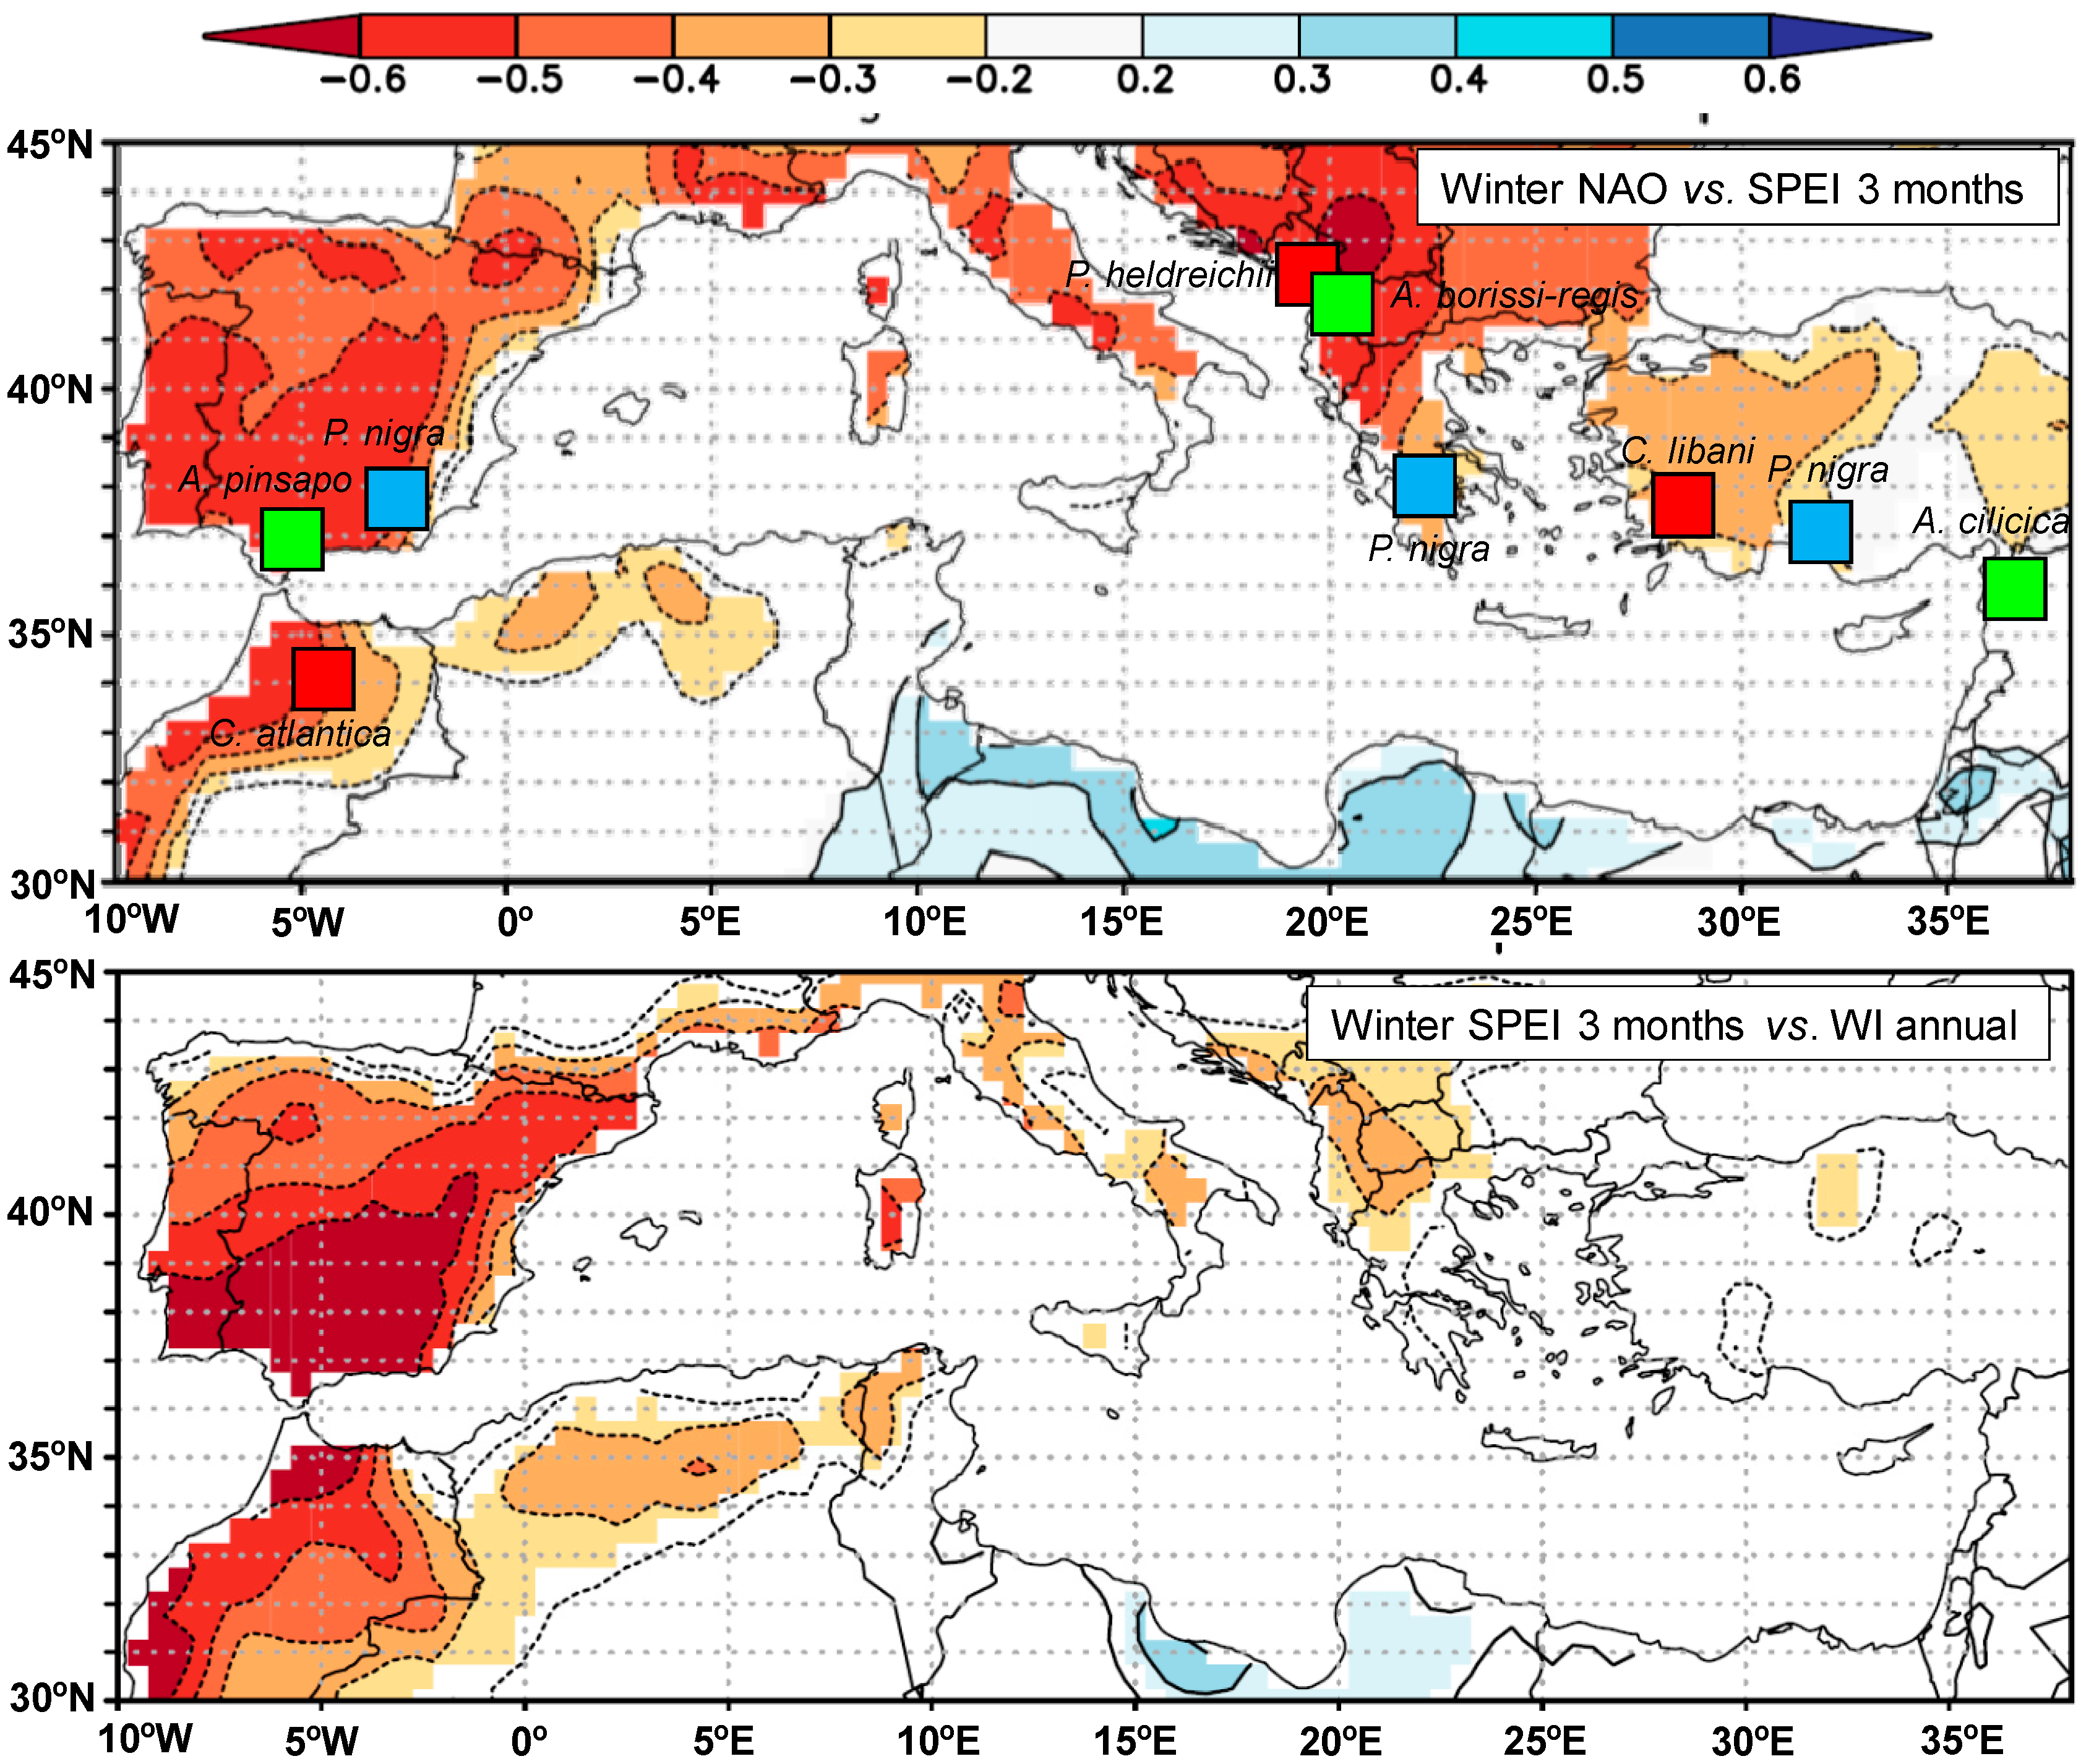
3.1. Atmospheric Circulation Indices and Drought

Spatial correlations between NAO, WI, and SPEI3 were observed with large differences across the Mediterranean Basin (Figure 2). The winter drought variability was well explained by NAO and WI, controlling the precipitation patterns. Annual NAO correlated positively with annual WI (r = 0.48), winter WI (r = 0.79), spring WI (r = 0.50), summer WI (r = 0.34), and autumn WI (r = 0.56) (Table 2).
The relationships between annual SPEI3 and annual WI reported disparate results along the Mediterranean Basin (Table 2). The highest correlations were observed in the western region for the A. pinsapo site, showing significant negative correlations for annual (−0.39), winter (−0.61), spring (−0.41), and autumn (−0.30) values (Table 2). C. atlantica and P. nigra sites in the Western Mediterranean also showed negative correlations between annual SPEI3 and winter WI (C. atlantica and P. nigra) and annual and autumn values for P. nigra. However, no significant correlations were observed for the Central Mediterranean region, while in the eastern area, only A. cilicica showed a significant negative correlation between annual SPEI3 and annual and summer WI index (Table 2).

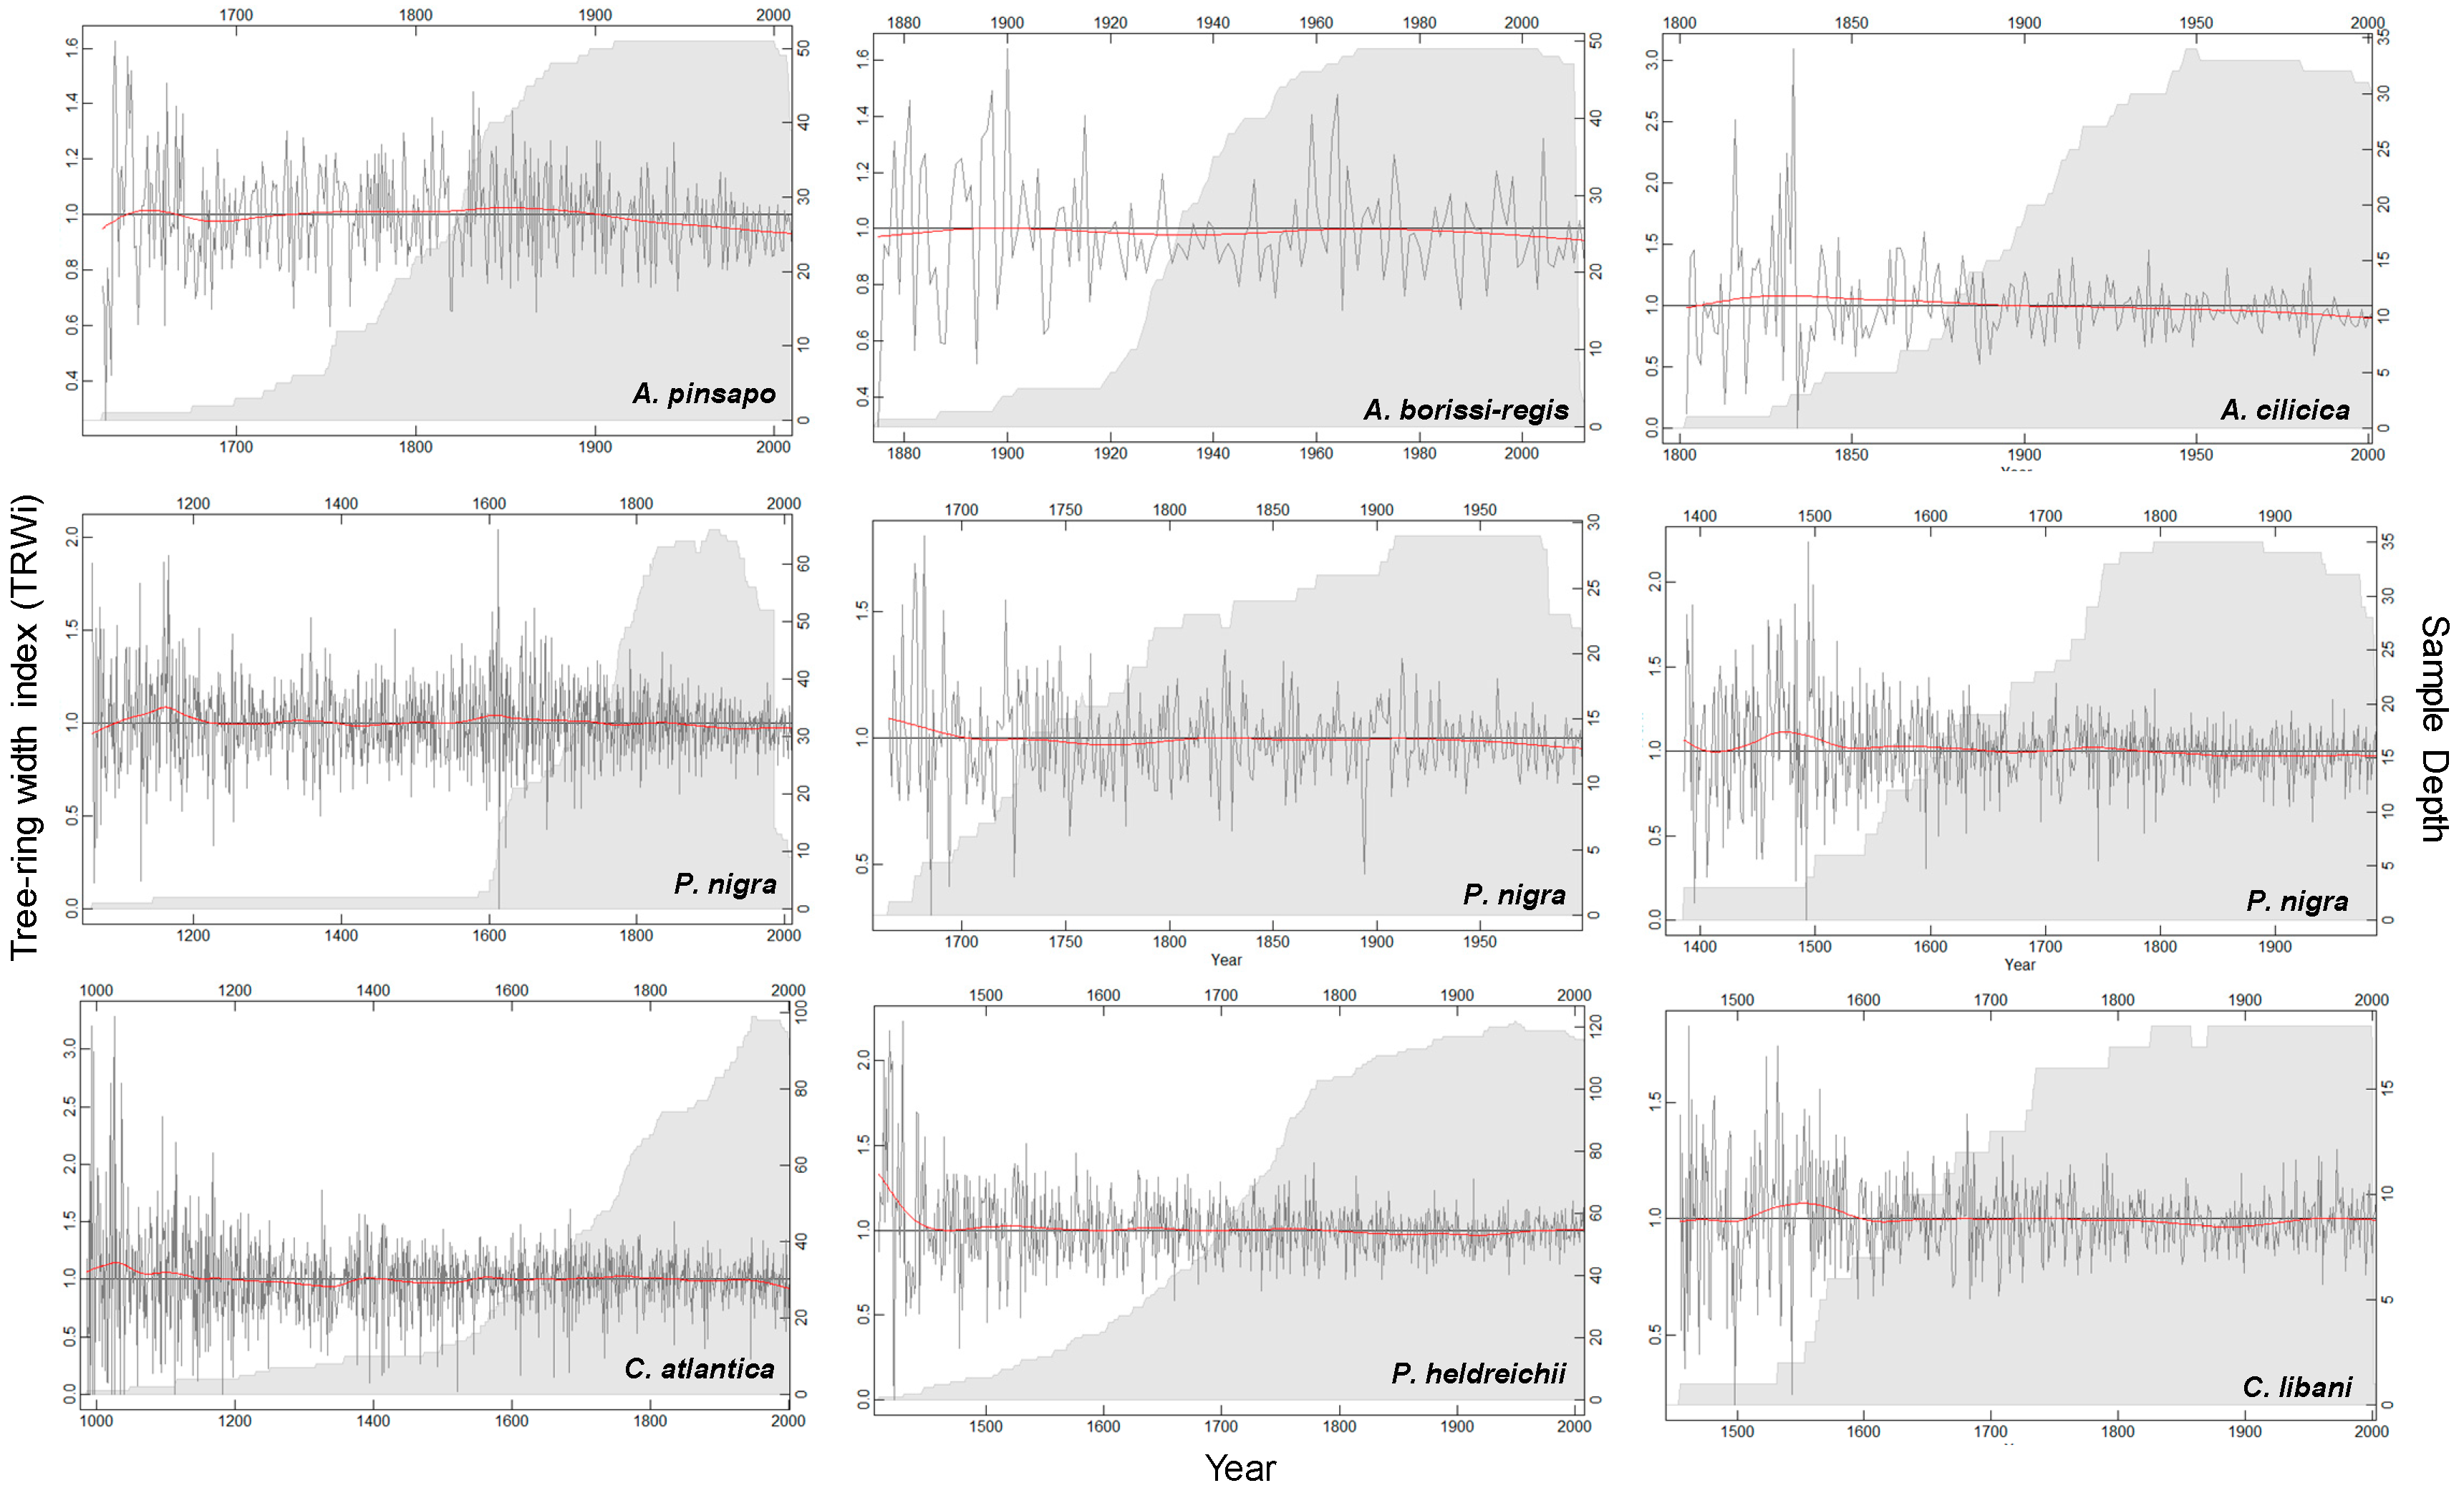
3.2. Chronology Characteristics

Trees from the Western Mediterranean were older on average (264 years) but formed narrower rings (0.79 mm) than those from central (212 years, 1.46 mm) and eastern sites (263 years, 0.96 mm) (Table 1 and Table 3; Figure A1). The year-to-year tree-ring autocorrelation (AC) and interannual mean sensitivity (MS) of growth were similar at the extremes of the west–east dipole, which suggests that climatic constraints on growth are more important for these edge forests than in the Central Mediterranean region (Table 3). Western sites presented higher inter-series correlation and higher mean sensitivity compared to central and eastern regions, respectively, although these comparisons must be made with caution, since the number of trees used for each variable differed (Table 1; Figure A1). The remaining dendrochronological statistics confirmed the coherence among individual sites and further composited series for each region (Table 3).

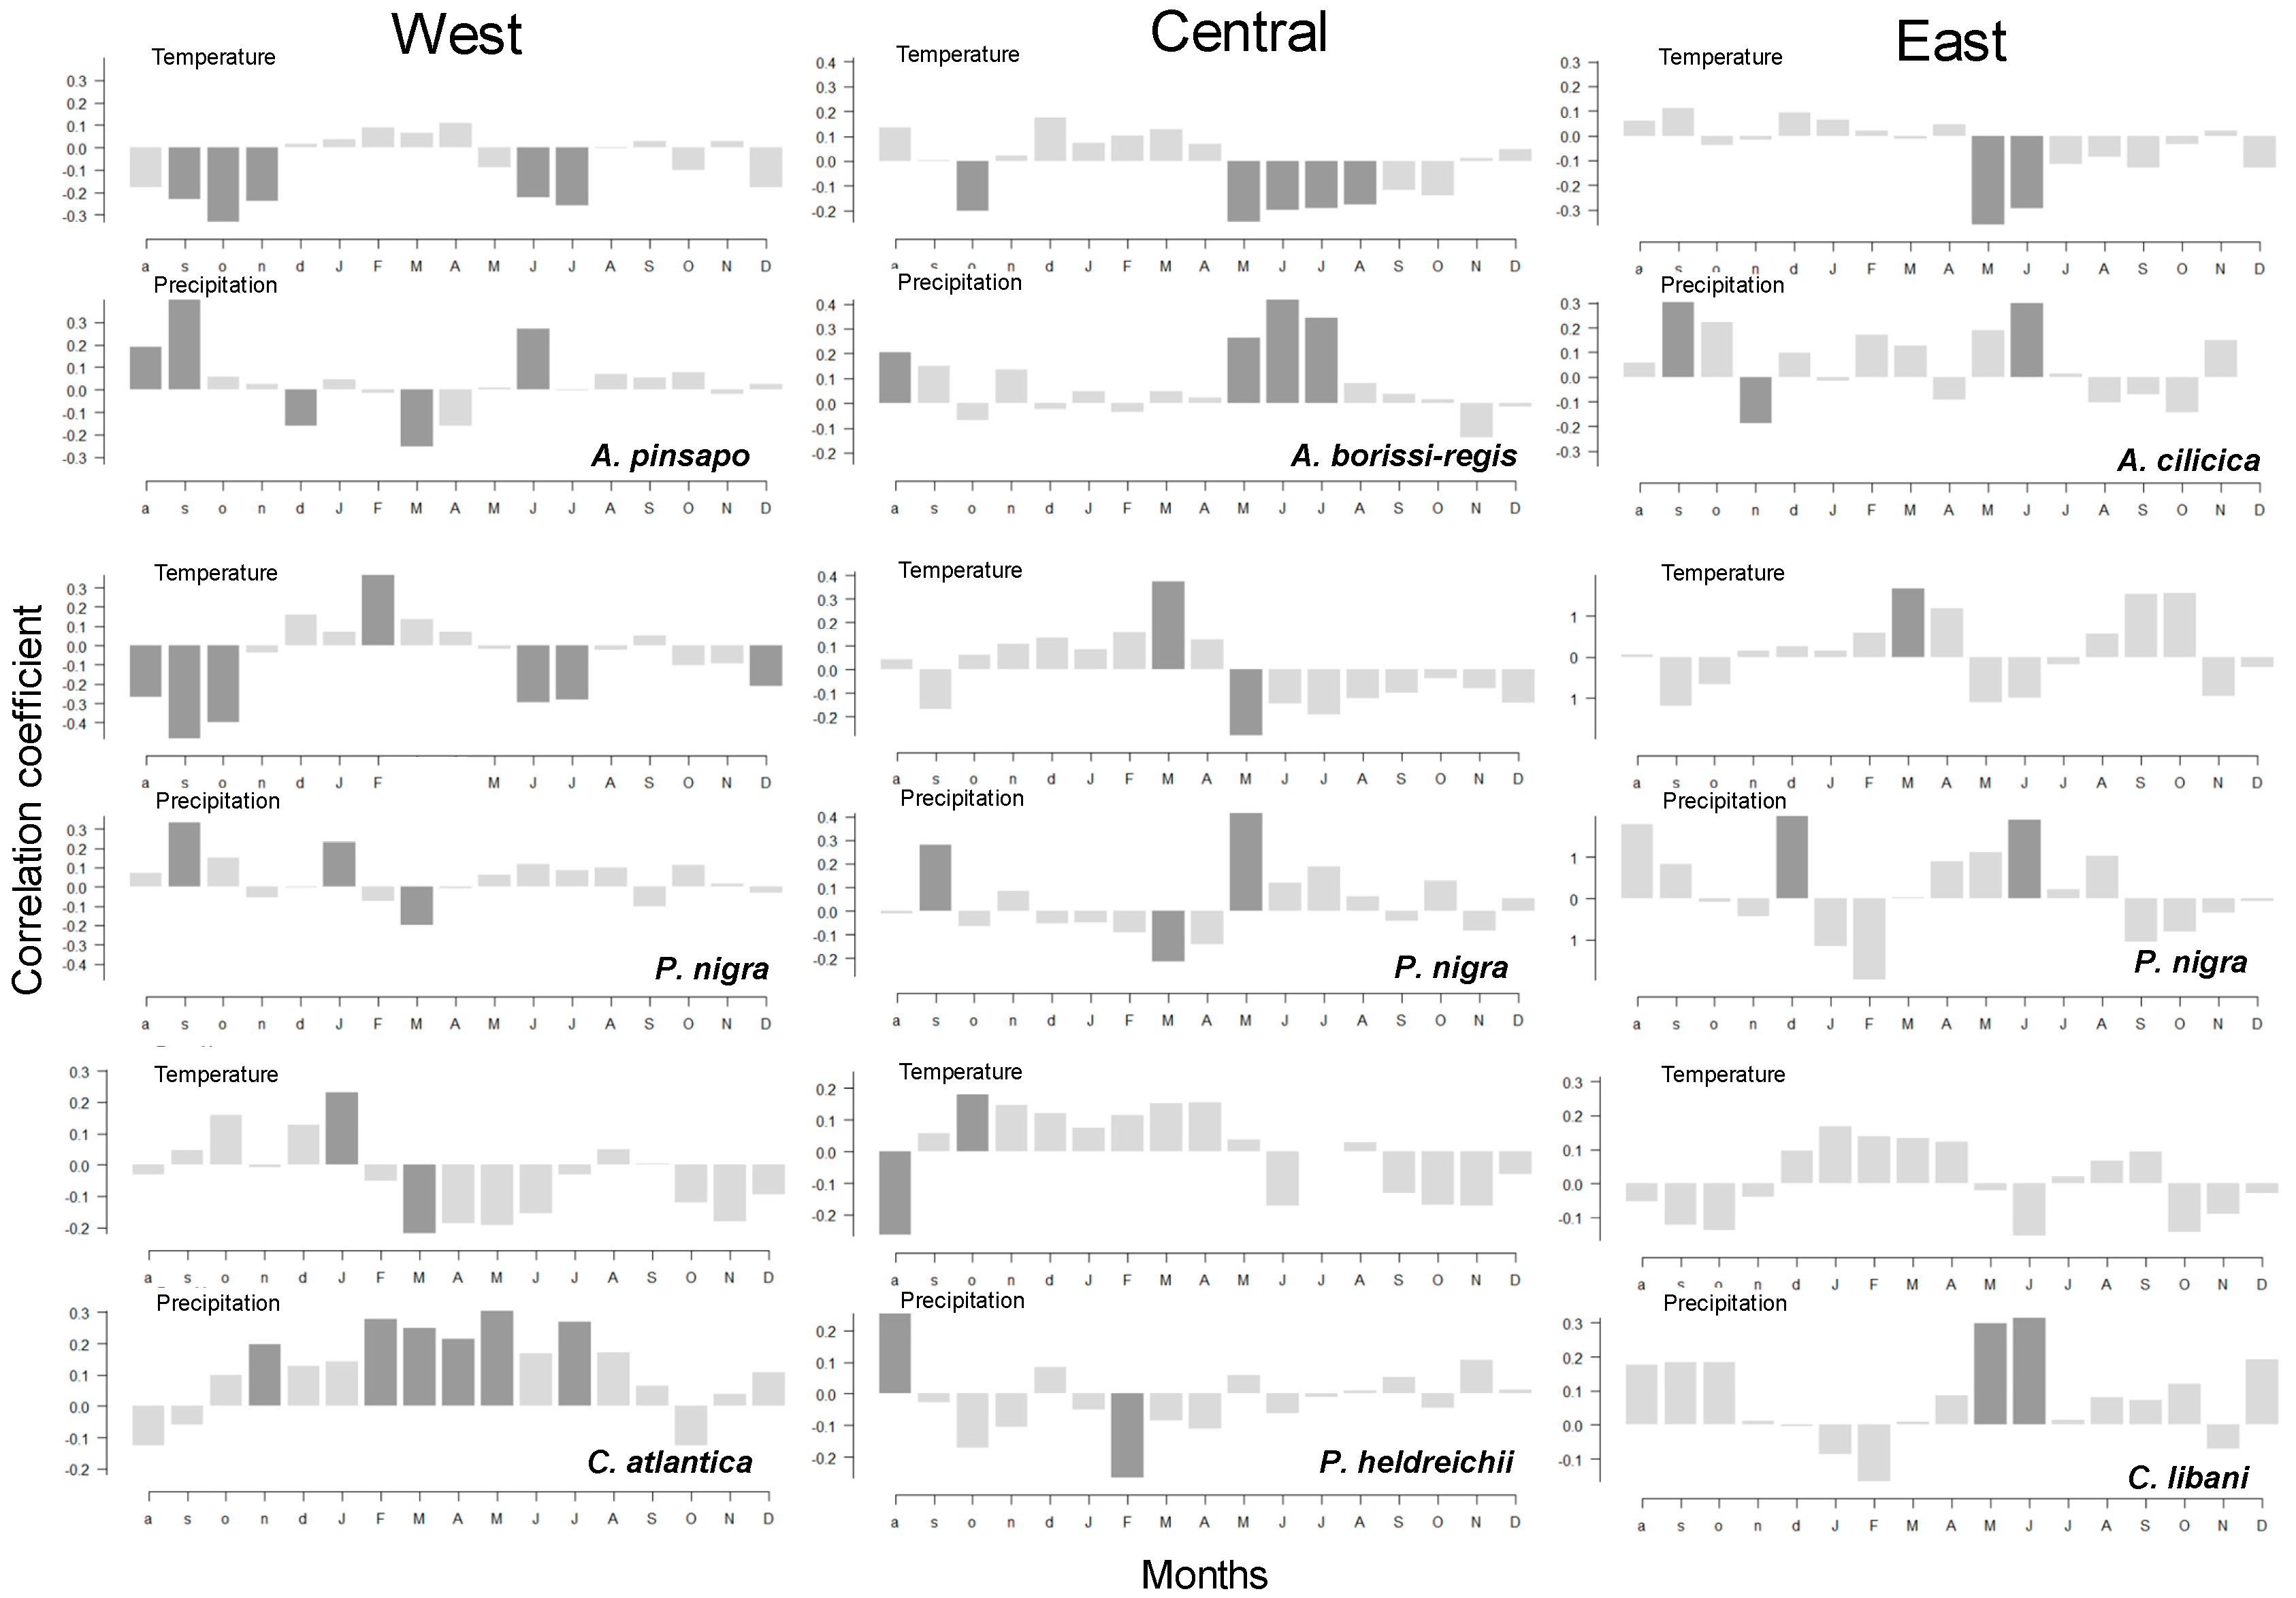
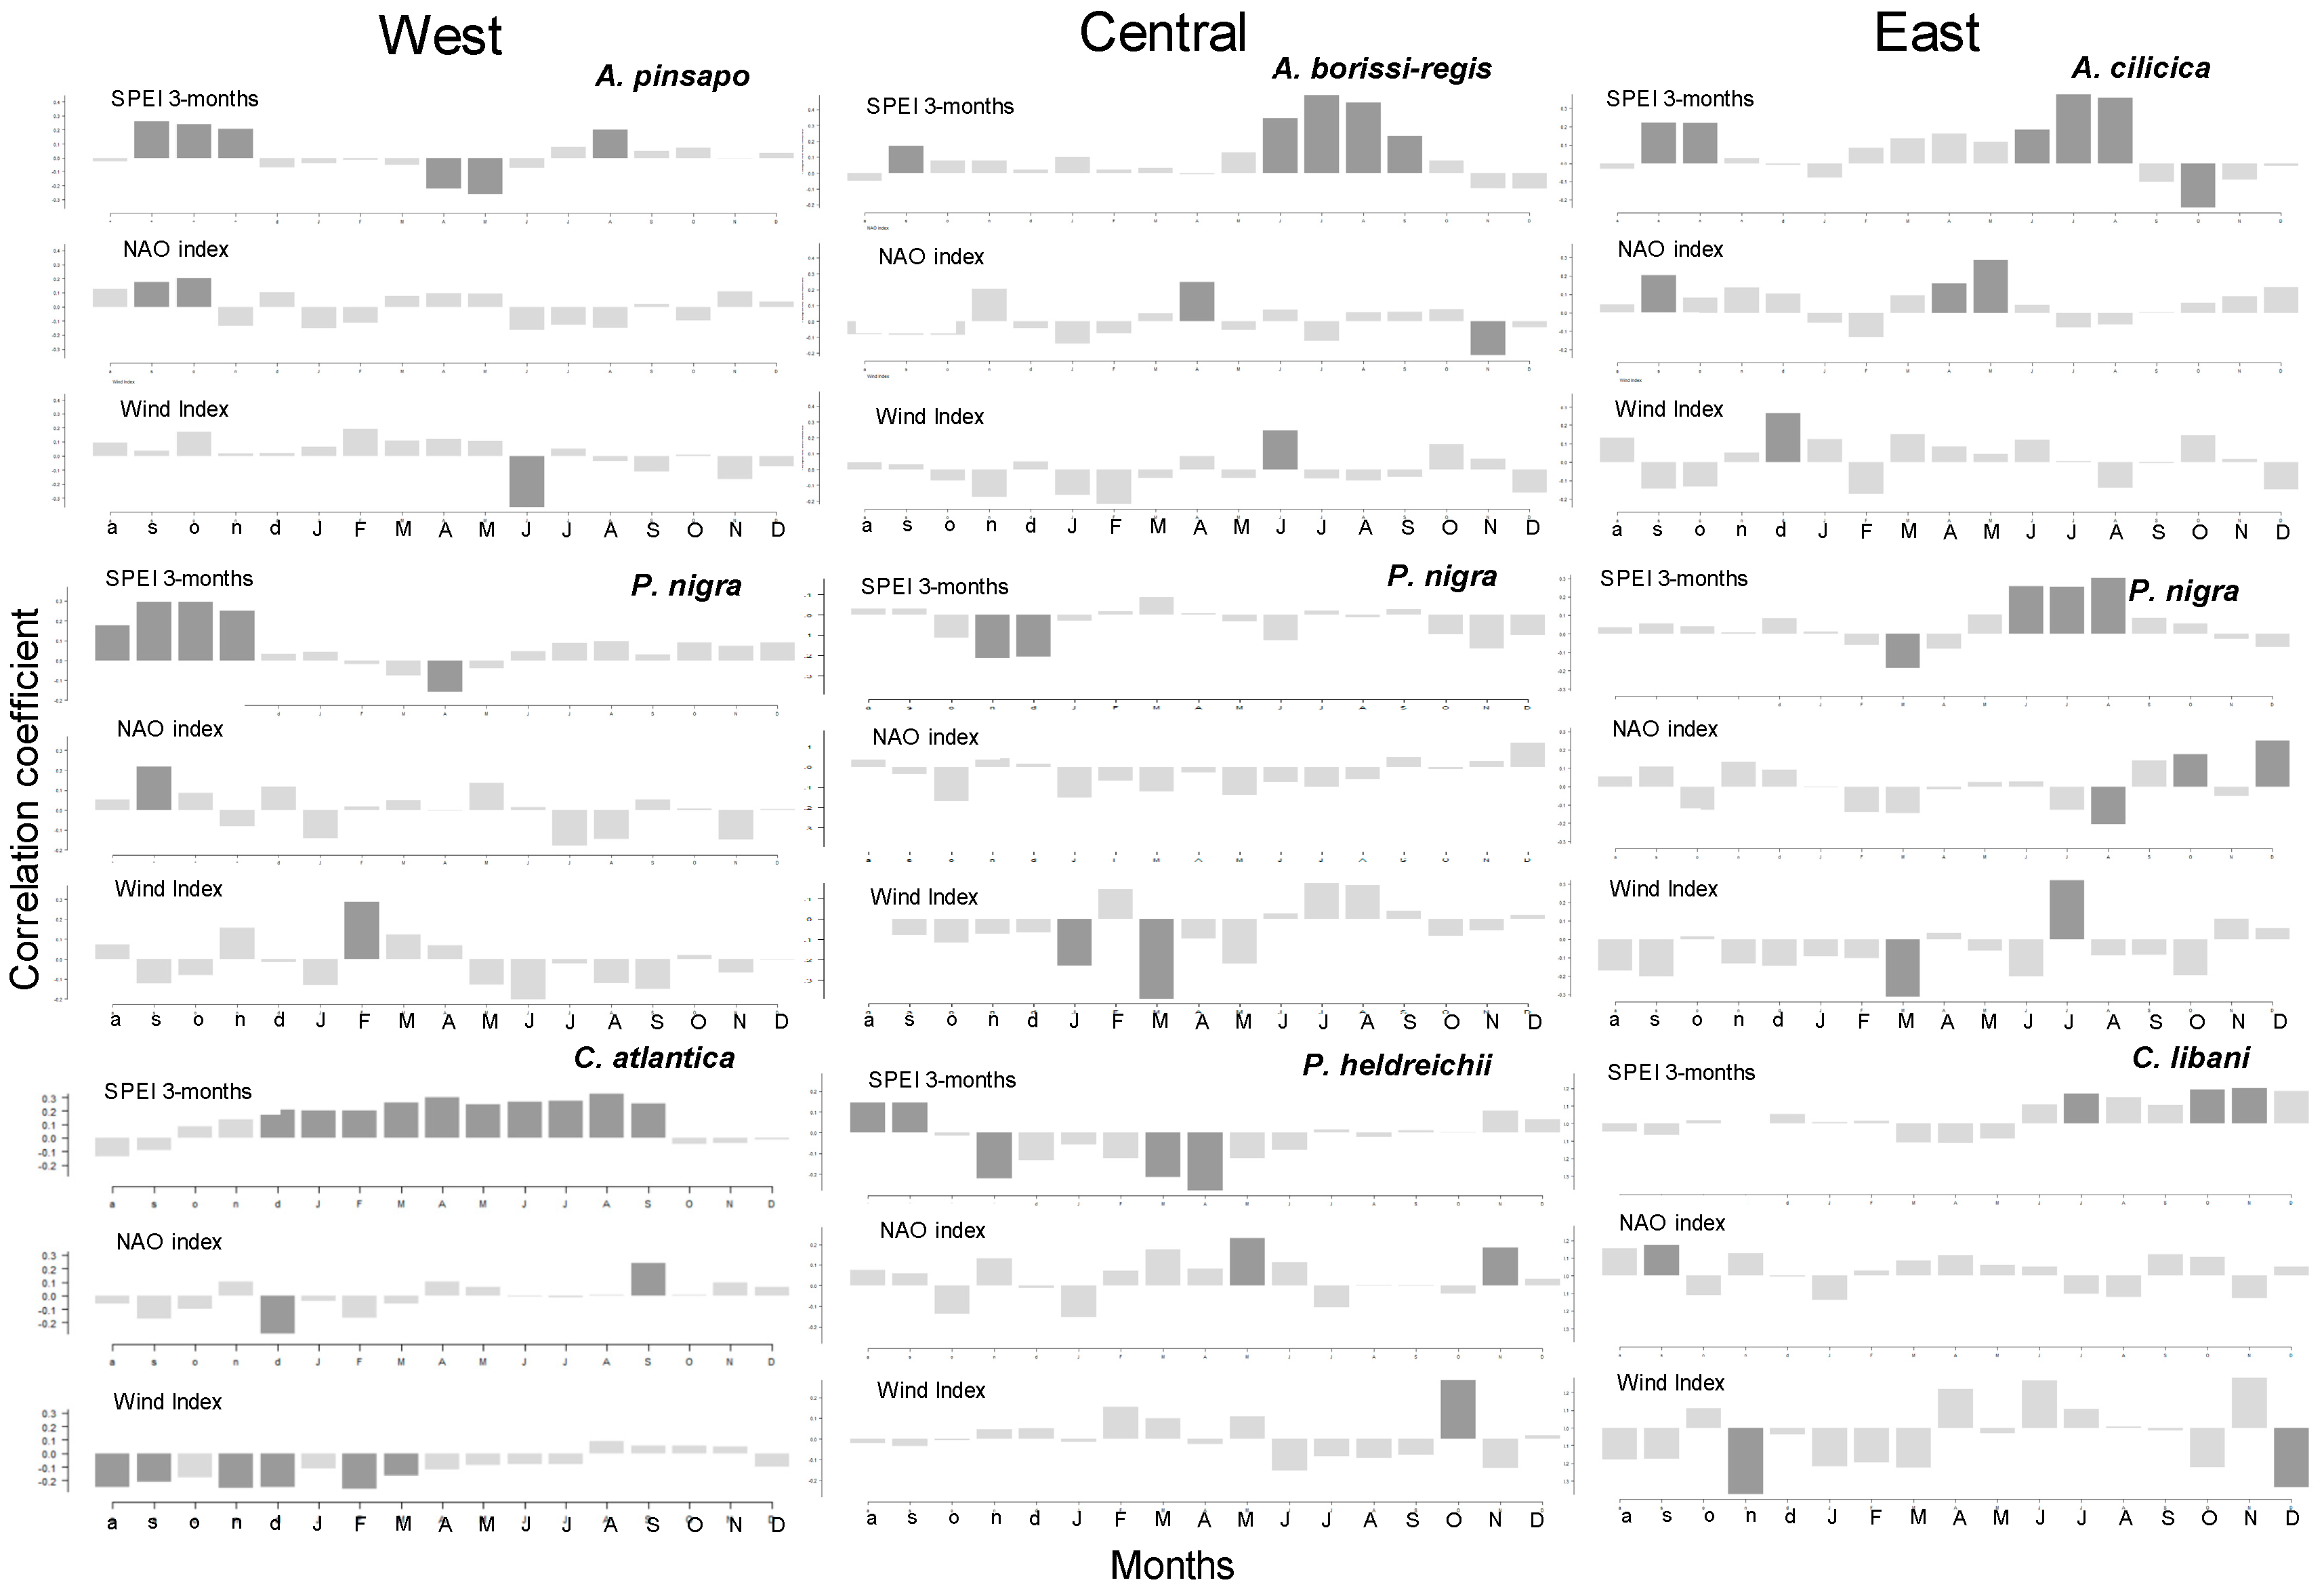
3.3. Climate–Growth Relationships

Mediterranean Abies species showed higher negative correlations with mean temperatures during the previous autumn in A. pinsapo and A. borissi-regis and late spring and early summer temperatures for the three Abies species (Figure 3). TRWi was positively influenced by late spring/early summer precipitation in all sites and species except P. heldreichii in the central region and P. nigra and A. pinsapo in the west, which showed the highest correlation with precipitation in the previous summer and autumn, respectively (Figure 3). The highest correlation with temperature was observed during the previous autumn in the western P. nigra site, while the lowest was observed in the eastern C. libani (Figure 3). Total precipitation showed a higher signal in western C. atlantica and central low-elevation A. borissi-regis in the Central Mediterranean (Figure 3).

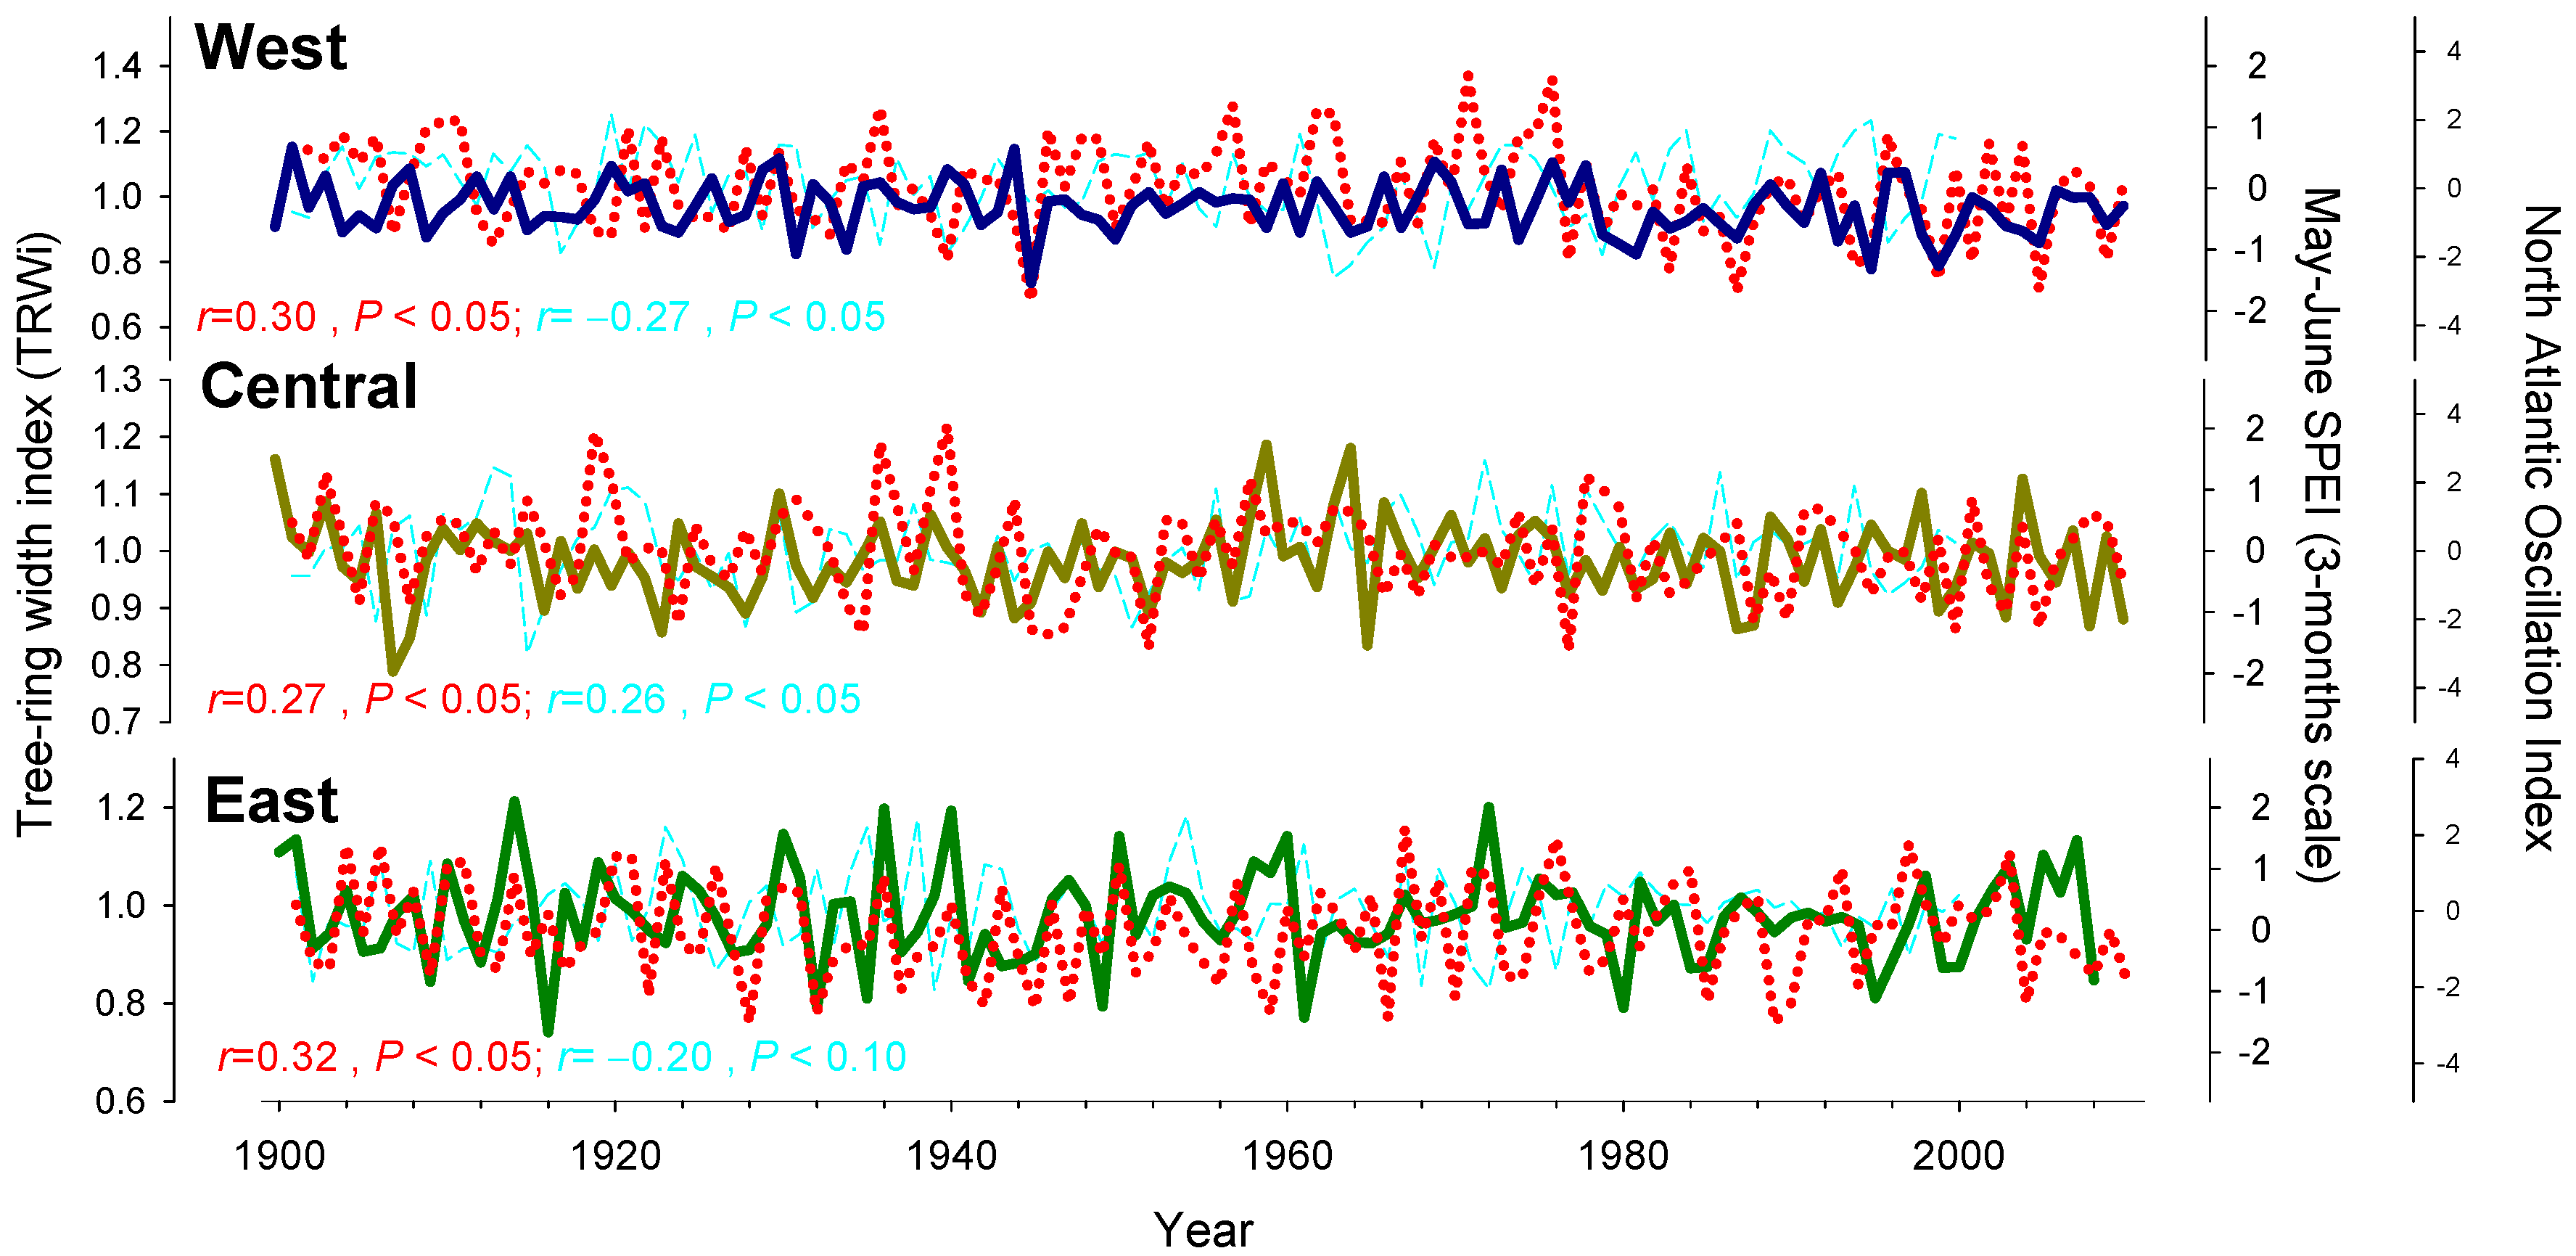
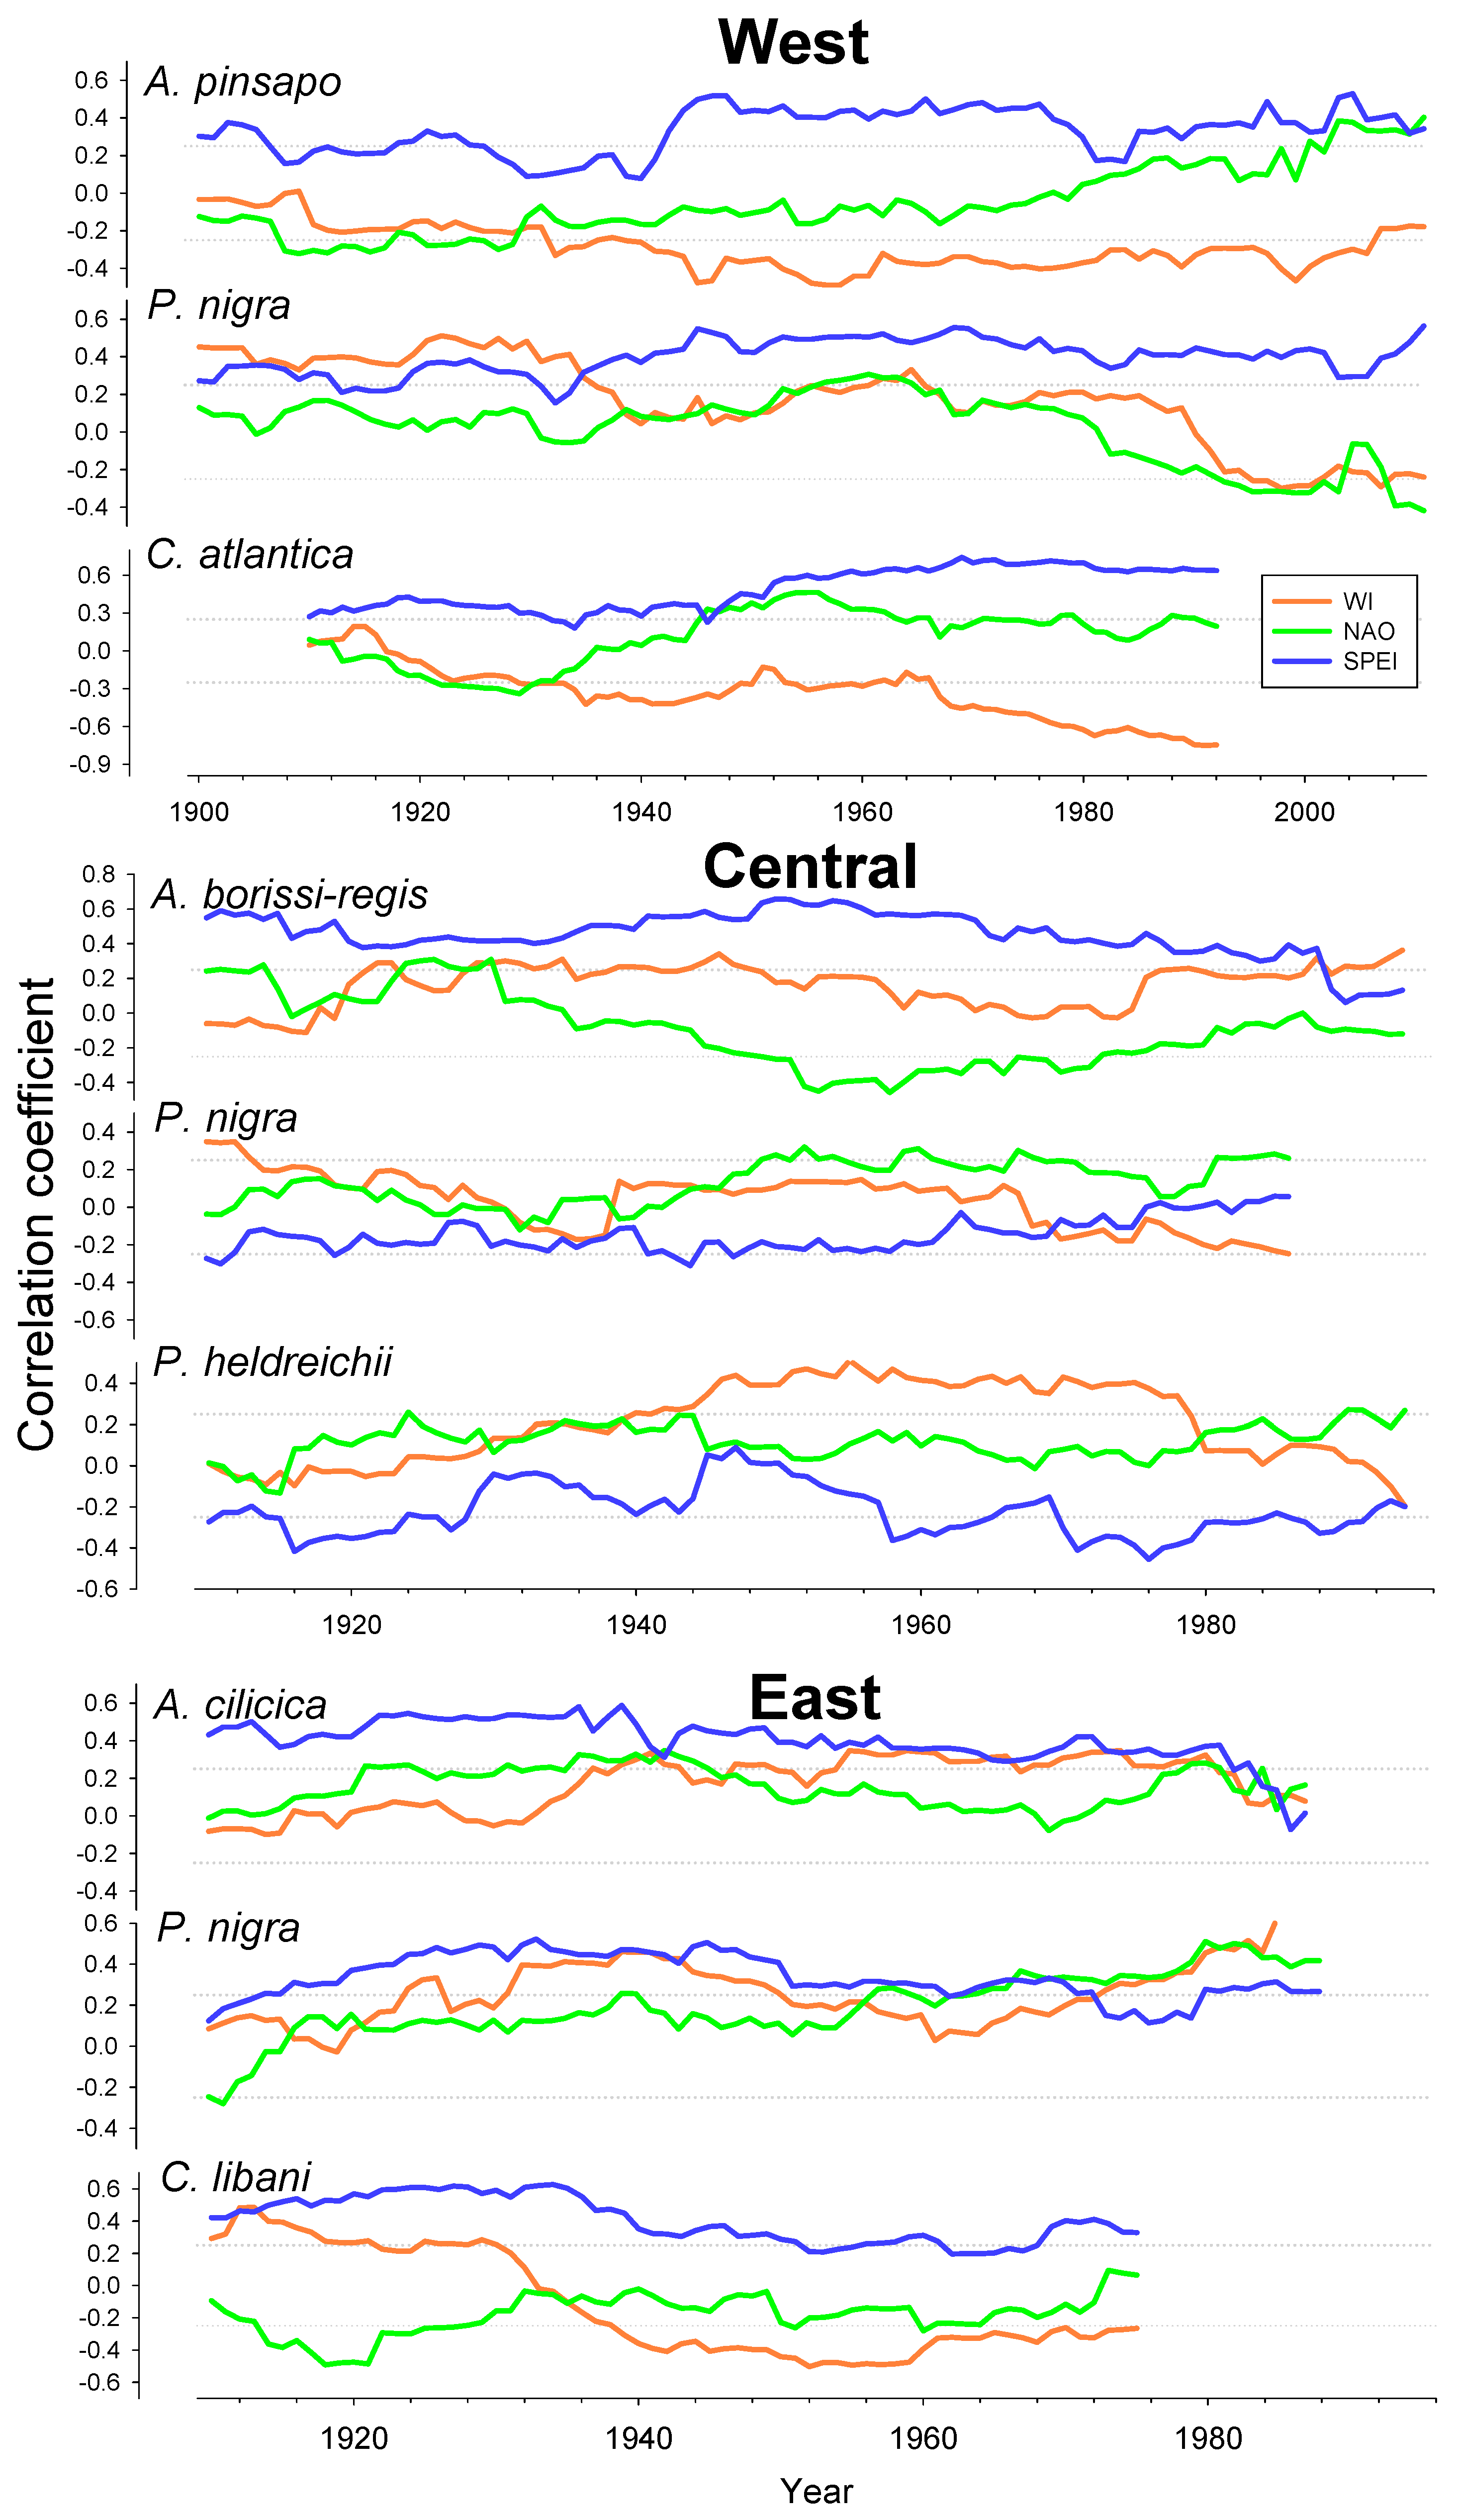
3.4. Relationships between Growth SPEI, NAO, and WI

The relationships between TRWi and SPEI showed a significant association between growth and intensity and severity drought in West P. nigra and C. atlantica but not in the A. pinsapo site (Figure 4). We found a positive and significant correlation with SPEI recorded at a 3–12-month-long scale in these western sites, corresponding to short wet or dry periods at a high frequency occurrence (Figure 4). In central and eastern sites, significant SPEI and TRWi relationships were found for 1–8-month-long scales, higher in lower elevation (A. borissi-regis) and eastern (C. libani) sites (Figure 4). Lower drought–growth correlations were observed in Abies species. Finally, we observed similar high-frequency TRWi (growth) evolution patterns in comparison with the mean SPEI3 drought index for May and June, with growth increases and reductions evolving in parallel to SPEI3 evolution (Figure 5). The composite chronologies for each region (west, central, and east) showed significant correlations between MJ SPEI3 drought index and TRWi, representing high coherence between concatenated relations among SPEI3, NAO, and WI (Figure 2, Table 2).
Monthly NAO and WI showed long-term variability during the 20th century, but stationary trends (Table 4). However, SPEI3 showed strong variability between decades and years with wet periods (1960s, 1970s in the west; 1920s, 1940s in the central region; and 1960s, 1990s in the east) alternating with dry ones (1950s, 1980s in the west; 1950s, 1980s in the central region; and 1970s, 1990s in the east) (Figure 5). However, long-term drought trends were different along the east–west dipole, mainly in the second half of the 20th century (Table 4).
C. atlantica (west), C. libani (east), A. borissi-regis (central), and A. cilicica (east) showed the highest positive associations with SPEI3, followed by P. nigra in the western, eastern, and central regions, respectively (Figure 6). TRWi was negatively correlated with Febraury NAO in C. atlantica and positively with the previous autumn in A. pinsapo and P. nigra (west) and current summer in Central Mediterranean species (Figure 6). Some eastern sites showed positive relationships with the current summer, autumn, and winter NAO indices (A. cilicica, P. nigra) and the central (P. heldreichii) region (Figure 6). As expected, the WI index showed the highest signal in the West Mediterranean for C. atlantica (negative) and P. nigra (positively) during autumn and winter, respectively (Figure 6). However, it is interesting to notice that all the species showed at least one month with significant associations between TRWi and WI index both in the central and in the eastern basin (Figure 6).
Figure 7 shows moving correlations between TRWi and SPEI3, NAO, and WI for the months with the best long-term correlation between these indices and TRWi (see Table A1 and Figure 6). The most stable correlations are obtained when SPEI3 series are analyzed, in particular, in the Western and Eastern Mediterranean regions. In the Central Mediterranean area, only A. borissi-regis is significantly associated with SPEI3. On the other hand, NAO and WI show a much more variable association with TRWi series. In the Western Mediterranean area, the WI shows a stable negative correlation with A. pinsapo and a (mostly significant) negative association with C. atlantica during the second half of the analyzed period. On the other hand, NAO only shows a relatively stable positive association with C. atlantica during the second half of the analyzed period.
In the Central Mediterranean region, no clear associations were observed. The WI was positively associated (mostly significantly) with A. borissi-regis and, during some decades in the middle of the analyzed period, positively associated with P. heldreichii. Associations with P. nigra were not significant. On the other hand, NAO changed the sign of its association with A. bosissi-regis along the analyzed period but showed a more stable positive association (near or above the significance level during a significant part of the analyzed period) with P. nigra and P. heldreichii.
Finally, in the Eastern Mediterranean, NAO and WI showed very similar associations. Both of them were positively associated with A. cilicica and P. nigra, coming in and out of the level of significance, and both of them were negatively correlated with C. libani during the final half of the analyzed period; however, the WI was positively correlated during the early decades of this period.

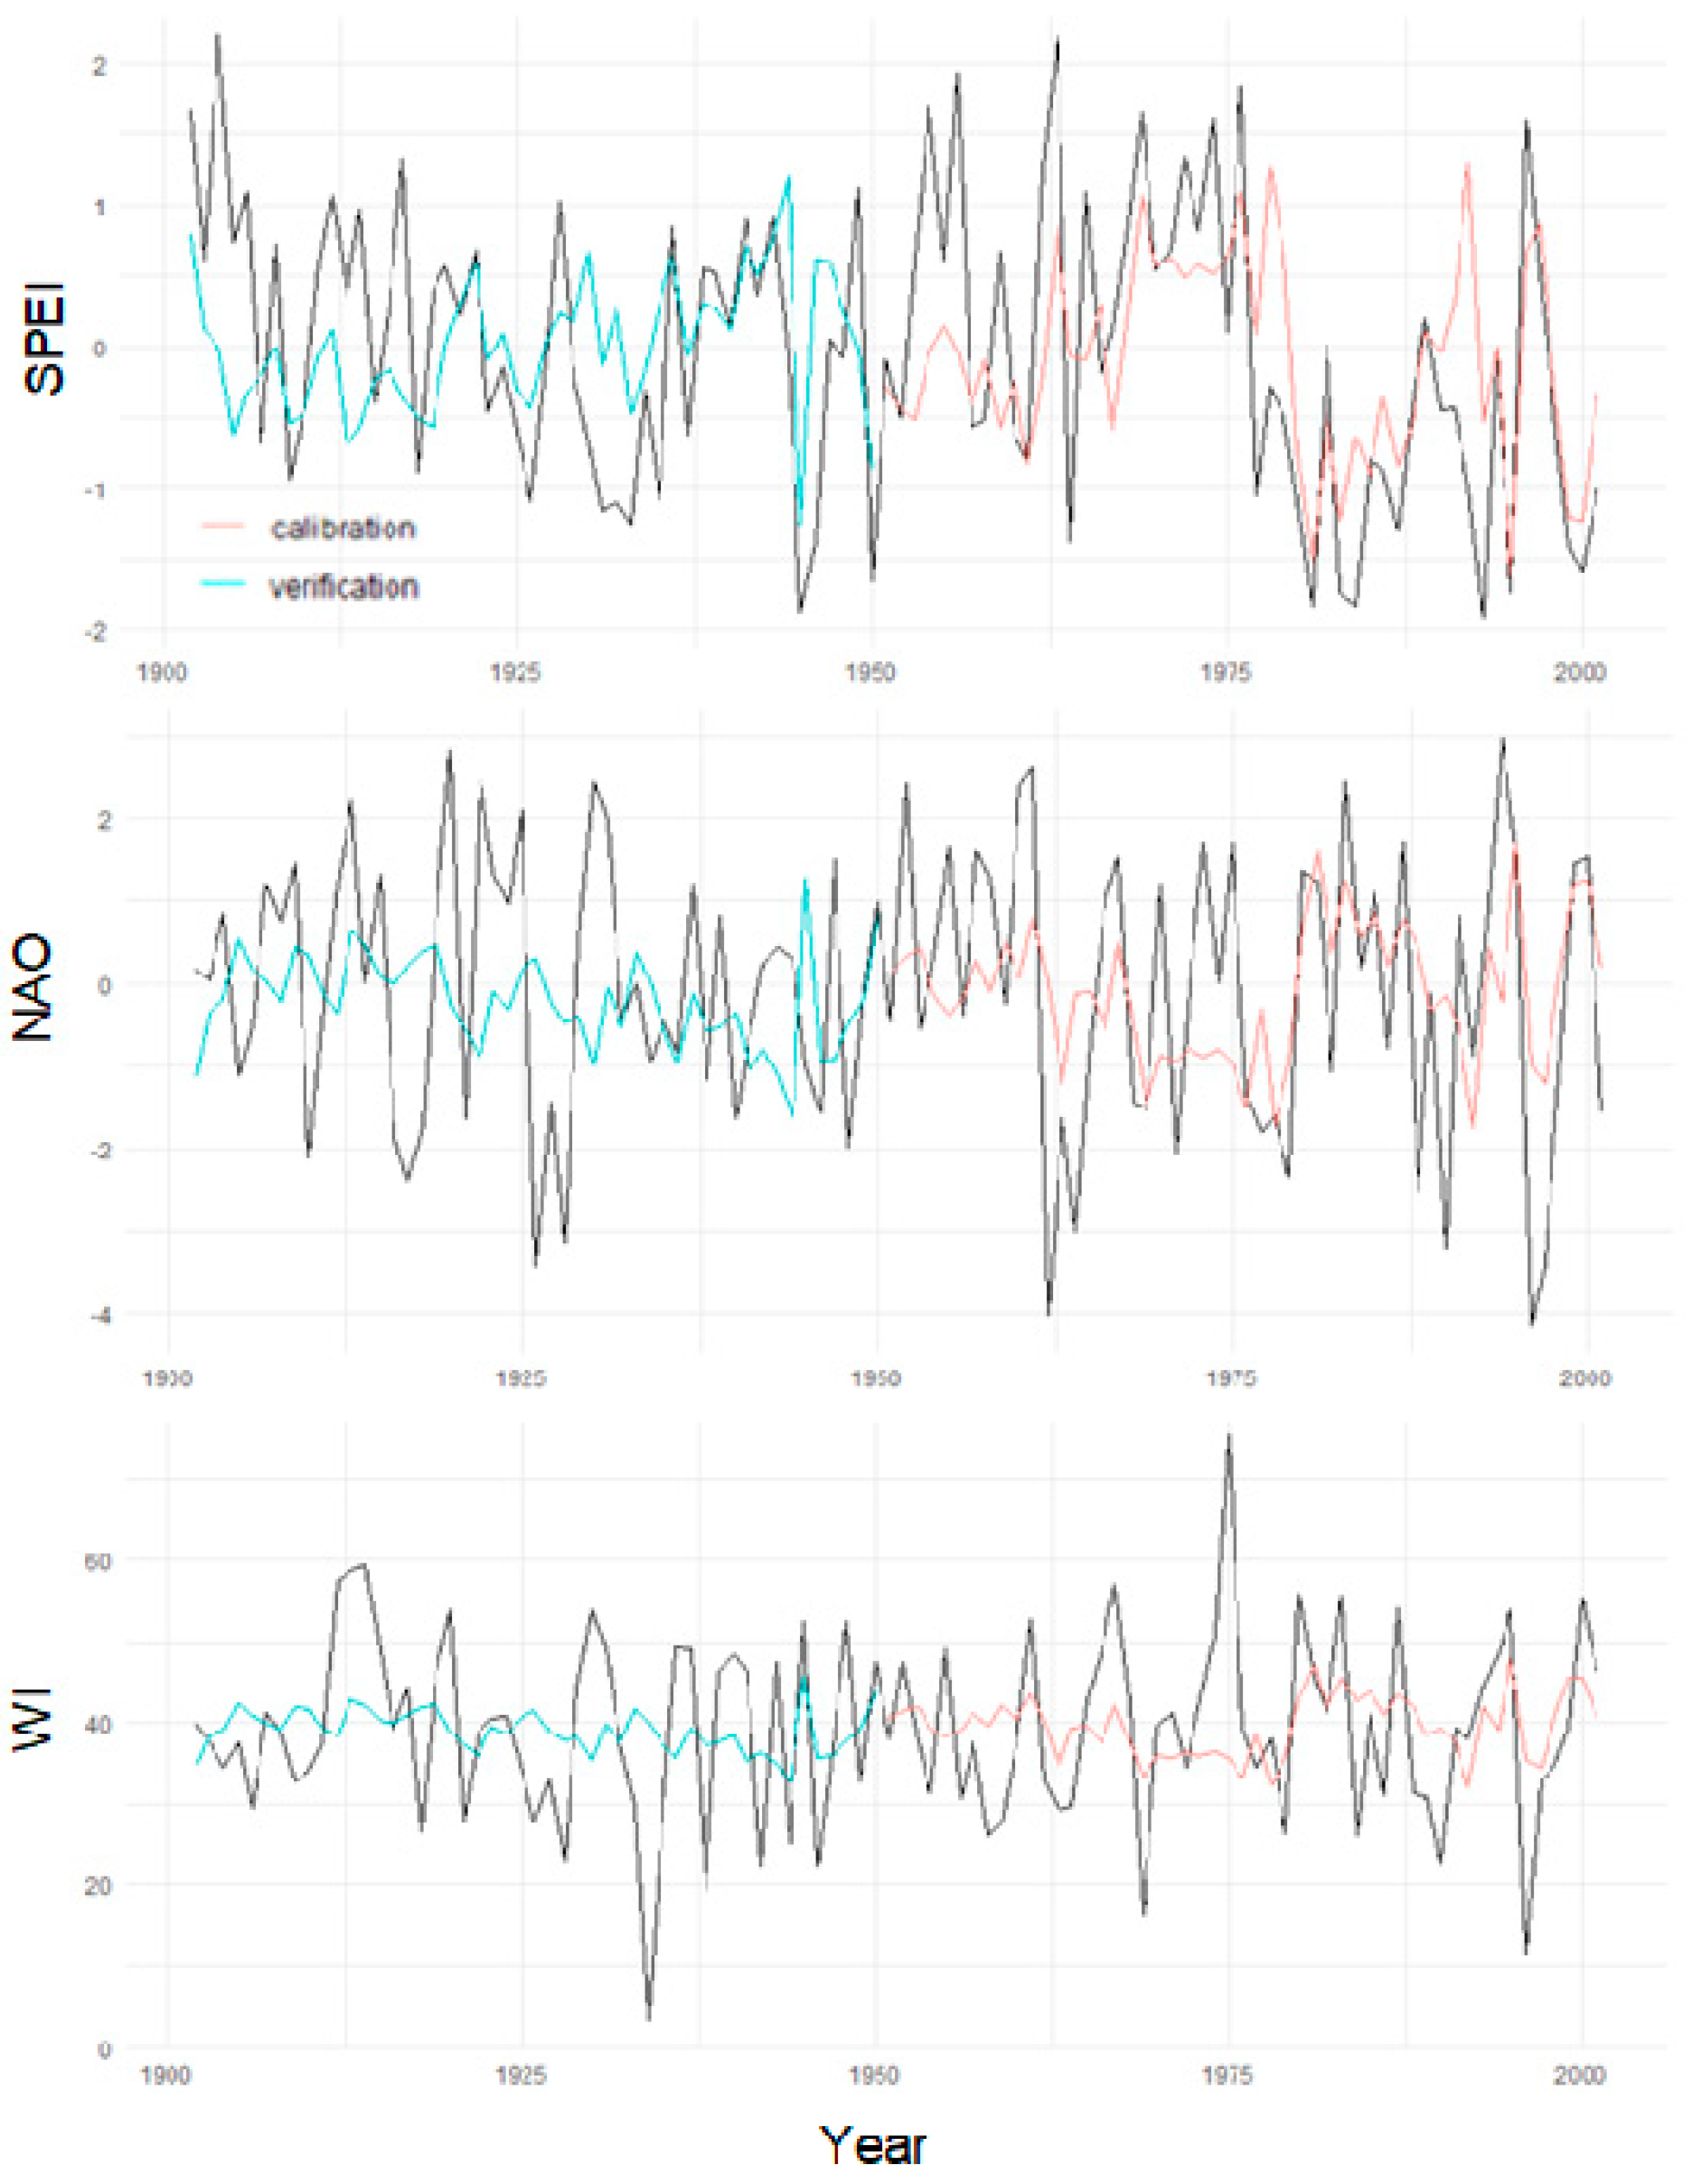
3.5. Exploring WI Reconstructions from Tree Rings

We explored whether TRWi could emerge as a potential proxy for the WI reconstruction in the Mediterranean Basin (Table 5, Figure A2). The regression models for C. atlantica, the site with higher correlations for SPEI12, NAO, and WI (Figure 3, Figure 4 and Figure 6), were adjusted explaining 52% (SPEI), 29% (NAO), and 28% (WI) variability during the period of 1903–2001 (Table 5). The calibration/verification statistics indicated that there is reconstructive potential in the WI model, even if the WI signal is weak (Table 5; Figure A2). The two subperiods for calibration and verification of the regression models showed significant correlations for summer SPEI12 (1903–1953: r = 0.58, p < 0.01; 1953–2001: r = 0.62, p < 0.01), previous December NAO (1903–1953: r = 0.26, p < 0.05; 1953–2001, r = 0.42, p < 0.05) and previous November–December WI index (1903–1953: r = 0.33, p < 0.05; 1953–2001, r = 0.30, p < 0.05) (Figure A2).

4. Discussion

Regional climatic changes affect societies and natural ecosystems, endorsing the basis for efficient adaptation measures [1]. Several studies support that regional climates are the result of the interaction of large-scale dynamics with the orography and physical properties at the regional and local scales. Notwithstanding, improving our knowledge about regional and local climate linkages, including extremes, remains highly relevant [7,51]. Here, we obtained reliable information on the amplitude and changes of past climate dynamics at regional scales using tree rings in relation with drought variability (SPEI) and atmospheric circulation patterns (NAO, WI). Despite significant recent research efforts, detailed interactions among regional drought variability and atmospheric patterns are not sufficiently understood yet [8]. Furthermore, the analysis of long-term climate series at large spatial scales provides relevant information on climate variability and trends in relation to climate change [1,52,53]. Since the climate of the Mediterranean Basin is characterized by seasonal drought during the dry and warm summer conditions [54,55], this region is potentially sensitive to climate change, with periods of water shortage negatively affecting the tree growth and dynamics of forest ecosystems, as well as to several socio-economic implications within and beyond the region [56,57]. Our results showed higher drought sensitivity in the western areas, compared to the eastern part, according to significant tree growth sensitivity due to siring drought intensity caused by recent changes on large atmospheric oscillations patterns [11].
Since the Mediterranean Basin’s climate is modulated by atmospheric patterns [7], their changes influence the local climate and drought conditions [58]. In terms of the modulation of the temperature, positive phases of the winter NAO show a high correlation with cold air temperatures in the Southwestern Mediterranean area, while the opposite response is observed during negative NAO phases [3,4]. Similarly, the Central-eastern European and Northern Turkish climates showed positive associations with NAO, while the NAO influenced the winter temperatures in Northern Italy (Figure 2) [20,24,58]. Several studies showed positive relationships between winter NAO and lower precipitation in the Western and Northern Mediterranean areas [13,59]. Conversely, the NAO presented weak relationships during other seasons, except for the NAO changes which translate into variations in precipitation in the Southern Mediterranean [7,11,13,23,58].
The influence of NAO on drought severity (SPEI) and its relationships with the WI was confirmed in the Mediterranean Basin [23]. The WI index accounts for climate variability during the summer season and higher temperatures during winter in Western Europe (Figure 2). A positive WI was related with lower temperatures in Northern Europe and warmer conditions in the Eastern Mediterranean area [20]. However, high frequency of westerly winds (positive WI) increases cloudiness and humidity in Northern Europe, with decreasing precipitation and humidity towards the Mediterranean area. Winter and summer seasons show an extended decrease of precipitation, covering the west and east of the Mediterranean Basin, while decreasing spring precipitation prevails mainly in the west of the Mediterranean [20,23]. Many previous studies showed the relationships between NAO and drought in Southern Europe and North Africa [23], although the WI index captures a similar signal to the NAO during summer and winter seasons, especially during dry spring–summer seasons in Western and Central Europe [23]. While the NAO is a pattern that considers wind strength, the WI is an index that only considers the prevalence of westerly winds [20]. This difference is important since it has been proven that the WI, unlike the NAO, is a better indicator of precipitation with robustness throughout the year in Northern and Central Europe. However, the WI presents difficulty to capture temperature anomalies that are determined by the advection and intensity of air masses, whereas NAO can capture it more easily. Nevertheless, our study is the first attempt to understand the combined influence of these patterns in the effects of drought across Mediterranean ecosystems. As [20] showed, NAO and WI have many similarities in behavior and effects on the European continent and can complement each other to improve our knowledge on both short- and long-term drought effects across European forests [23].
Based on our findings about the relationships among tree-ring data (TRWi) and NAO, WI, and SPEI, we conclude that drought, as reflected by the SPEI, is the main limiting factor of tree growth in agreement with previous regional studies [60]. This pattern has been already observed in different studies showing higher correlation between SPEI and tree growth variation than NAO or other atmospheric patterns [11,12,16]. This result might be related to the temporal scale of drought. Hence, while SPEI is able to capture short-term weather conditions and extreme weather events more accurately when seasonal droughts occur, NAO and WI reflect large spatial and temporal atmospheric patterns, mainly sensitive to intra-annual periods, such as winter, where tree growth stops and drought conditions remain low [10,13,15].
An important issue raised by our study is the lack of stationary relationships among NAO, WI, and the climate sensitivity observed in the different tree species (TRWi) (Figure 7). It is important to note that, although the correlations might be significant for the entire time period, decreasing correlations may be present at some shorter time spans, where the relationship is weakened. Here, sequential coupling and de-coupling of climate sensitivity could be related to contrasting and sometimes opposite local environmental responses over time and also among nearby forest ecosystems during a given time period [11]. Non-stationary climate sensitivity relies on ecosystem development and its complex response to climate changes, even in the same region, supporting that these responses are highly influenced by the landscape and the environmental evolution of the area [58,61,62]. In addition, these shifting environmental responses might be amplified in our tree species during the last centuries, suggesting a different resilience and sensitivity to climate variations between the studied mountain forest ecosystems [2,11,53]. Anthropogenic influences should be taken into account, as they also appear to modulate the effects of solar and atmospheric cycles in the tree rings’ environmental signals [62]. The obtained climate sensitivity of the Mediterranean forests studied here provides paleoenvironmental records likely influenced by several drivers, including climate variations but also human-induced environmental changes.
However, our results showed that depending on the Mediterranean zone, the inter-annual NAO variations can explain large-scale growth variability (Figure 5). For the western area, we found higher associations with TRWi for autumn and winter NAO for A. pinsapo and P. nigra (Figure 6). These results are consistent with other studies that associate an increase in the temperatures during the previous winter with an increase in the growth rates due to an early bud break [63]. This relationship has been proven in studies that show how the NAO strongly modulates the inter-annual variability of precipitation in the Western Mediterranean [62]. This situation explains the negative impact of spring NAO in C. atlantica that translates into a lower soil water reserve and availability, which acts as a limiting factor in the tree radial growth during the growing season. In contrast, a positive NAO phase in summer increases growth rates in Central Europe [64]. Regarding the Eastern Mediterranean region, the summer NAO conditions influence water availability during the growing season [10,16,23], as does the autumn NAO, consequently affecting tree-ring growth of eastern forests [10,62].
Regarding the relationship between tree growth and WI, we observed higher correlations with Western Mediterranean forests (Figure 6). For instance, P. nigra and A. pinsapo showed positive and negative WI signals in tree growth during winter, summer, and spring seasons, respectively (Figure 6)—periods in which there was an increase in temperature and a decrease in precipitation in western regions [11]. In this case, the increase in temperature is related to the onset of growing season of P. nigra and C. atlantica (Figure 3). However, autumn WI negatively affected the tree growth of C. atlantica in relation with the influence of WI on the precipitation and temperature patterns (Figure 2 and Figure 6). The autumn WI was related with drought that consequently affected the growth [5,13]. On the other hand, the relationships between WI and growth in Eastern Mediterranean forests were higher with previous winters (A. cilicica and C. libani) and March and July in P. nigra (Figure 6). This relationship with winter WI was consistent with drought–growth relationships in this area. Our results showed the ability of the WI to explain how the tree growth in the Central Mediterranean area is mainly limited by spring conditions; with a positive effect on growth during autumn. This finding is consistent with those obtained in other studies on the WI, where we can see how its potential is located in Western and Northern Europe, presenting difficulties in explaining the behavior of droughts in Southern Europe [23].
The combination of SPEI, WI, and NAO allows us to study the effects of large-scale atmospheric patterns in the regional growth of tree species in drought-prone Mediterranean areas. While the NAO is better related with large-scale drought periods, the WI allows us to study shorter drought effects, having a stable seasonal influence on drought severity [23]. This combination of characteristics between both atmospheric patterns seems promising for a better understanding and reconstruction of drought periods in the Western Mediterranean area (Table 5). The potential of using TRWi as a proxy in annual climate reconstructions has been proven in numerous studies [65,66]. However, to our knowledge, this is the first study using TRWi information to understand and reconstruct long-term regional climate patterns in the Mediterranean Basin related with the WI. Our results evidence a strong connection between drought and large atmospherics patterns, especially the interconnected WI and NAO, which is reflected in annual tree-ring chronologies (Table 5). Although tree-ring information from the Mediterranean basin is not scarce, many of the currently available chronologies do not cover centuries to address long-term climate reconstructions, due to the scarce long-lived trees [67]. The oldest trees in our study (C. atlantica) were found in the Atlas Mountains in Morocco [24,67]. This species showed the highest correlations between TRWi and summer precipitation in the Western Mediterranean [68], while negative correlations between TRWi chronologies and summer precipitation were obtained from some Eastern Mediterranean mountains [11], which have been demonstrated to reflect a distinct temperature signal, most likely reflecting the inverse relationship between summer temperature and precipitation (Figure 5). Nonetheless, Eastern Mediterranean drought responses are also available, for instance, in Southern Turkey [33,69]. Hence, the use of multiple species with different intra-annual periods of climate–growth sensitivity provides complementary information. Even with these shortcomings, TRWi data in our study proved to reconstruct local climatic variables and to detect significant relationships with large-scale atmospheric oscillations such as NAO or WI [23].
Overall, our results support significant relationships among Mediterranean tree-ring chronologies and the SPEI3, in relation with atmospheric oscillations (Table 5), suggesting that TRWi datasets may be widely suitable proxies to perform reliable reconstructions of the spatial and temporal patterns of drought frequency and intensity in relation with NAO and WI oscillations in the Western Mediterranean area. Thus, despite the NAO and WI presenting periods related to tree growth, the reliability seems much lower than that of the SPEI. Then, although we obtained limited adjustment, the use of drought-sensitive tree-ring chronologies would improve the suitability of TRWi to reconstruct millennial WI patterns. In summary, our understanding of variations in short-duration and extensive drought across the Mediterranean basin is still limited, as a small number of well-dated high-temporal-resolution proxies are available [7] and due to the non-stationary relationships among TRWi, NAO, WI, and SPEI (Figure 7). In this context, in order to improve climate reconstructions, further studies could identify new potential long-term tree-ring series with higher sensitivity to regional-scale circulation patterns, such as WI and NAO indices [70]. Despite the limitations of our results using TRWi, this is a first attempt to understand the spatiotemporal associations among drought patterns and the interconnected NAO and WI oscillations over the Mediterranean Basin, although these relationships should be considered carefully given the relative level of non-stationarity (Figure 7). Further research is needed to understand past and future spatiotemporal variability of the tree growth associations with NAO and WI.

5. Conclusions

Although our results are still limited to draw detailed conclusions on the spatiotemporal high-resolution links among drought patterns and TRWi, NAO, and WI, we provide valuable information about the west–east dipole effects on how local climate variables, atmospheric patterns, and drought affect forest growth in the Mediterranean Basin. The NAO and WI explained high-frequency growth variability of western C. atlantica and P. nigra forests, and partially of Central and Eastern Mediterranean forests. Our study also shows that tree-ring widths are a potential proxy to long-term reconstructions of WI variability in the Western Mediterranean region. Based on our results, the climate change towards drier conditions could influence western, central, and eastern mountain forests differently in relation with changes in non-stationary atmospheric oscillation patterns. To improve the accuracy of future climate scenarios, local and large-scale climate drivers must be reconstructed using complementary proxies such as high-temporal-resolution tree rings, which allow to extend back centuries.

Author Contributions

Conceptualization, P.C.-G., R.S.-S., P.R. and J.C.L.; Data curation, P.C.-G. and P.R.; Formal analysis, P.C.-G. and R.S.-S.; Funding acquisition, R.S.-S., P.R. and J.C.L.; Investigation, P.C.-G., R.S.-S., P.R. and J.C.L.; Methodology, P.C.-G. and R.S.-S.; Project administration, P.R. and J.C.L.; Software, P.C.-G. and R.S.-S.; Supervision, J.C.L.; Validation, P.C.-G., R.S.-S., P.R. and J.C.L.; Visualization, P.C.-G. and R.S.-S.; Writing—original draft, P.C.-G. and R.S.-S.; Writing—review & editing, P.C.-G., R.S.-S., P.R. and J.C.L. All authors have read and agreed to the published version of the manuscript.

Funding

This research was financially supported by the project LESENS (RTI2018-096884-B-C33) from the Spanish Ministry of Science, Innovation, and Universities and by the VULBOS project (UPO-1263216) from the ERDF funds of the Andalusian regional government 2014–2020. P.C.-G. was funded by the Environmental predoctoral grant by the Fundación Tatiana Pérez de Gúzman El Bueno 2018. This research was supported by the research groups RNM-356 “Ciencias de la Tierra y de la Atmósfera” and RNM-313 “Estructura y Función de Ecosistemas Mediterráneos”.

Acknowledgments

We thank all data contributors at the International Tree-Ring Data Bank. We thank the Fundación Tatiana Pérez de Guzmán el Bueno which support Casas-Gomez, P. with a Predoctoral Fellowship.

Conflicts of Interest

The authors declare no conflict of interest. The funders had no role in the design of the study; in the collection, analyses, or interpretation of data; in the writing of the manuscript, or in the decision to publish the results.

Appendix A

Figure A1. Site chronologies (tree-ring width indices, TRWi; continuous lines) obtained for the studied sites from western (left column), central (central), and eastern (right) regions of the Mediterranean and the number of measured series (grey areas) for each site.
Atmosphere 11 00644 g0a1
Figure A2. Comparison between the reconstructed (color lines) and actual (black line) summer SPEI at a 12 month scale, previous December NAO (NAOdt−1), and previous November–December Westerly Index (WIndt−1) for the Cedrus atlantica site (see Table 5 for details).
Atmosphere 11 00644 g0a2
Table A1. Selected months or seasons for the moving correlations between TRWi and WI, NAO, and SPEI for each of the six different sites for 1902–2010. Abbreviations correspond to months and seasons of the previous (t−1) and current years, respectively. Seasonal climate data: Au, autumn; Wi, winter; Sp, spring, Su, summer).
VariableWestCentralEast
ABPICEATPINIABBRPIHEPINIABCICELIPINI
WIJunNdt−1Novt−1JunOctMarDect−1Novt−1Jul
NAOOctt−1Dect−1Sept−1AprMayOctt−1MaySept−1Aug
SPEIAut-1SuAut−1SuAprWit−1SuJulSu

References

  1. IPCC. Climate Change 2013—The Physical Science Basis: Working Group I Contribution to the Fifth Assessment Report of the Intergovernmental Panel on Climate Change; Intergovernmental Panel on Climate Change, Ed.; Cambridge University Press: Cambridge, UK, 2014; ISBN 9781107415324. [Google Scholar]
  2. Giorgi, F.; Lionello, P. Climate change projections for the Mediterranean region. Glob. Planet. Chang. 2008, 63, 90–104. [Google Scholar] [CrossRef]
  3. Hurrell, J.W. Decadal trends in the North Atlantic oscillation: Regional temperatures and precipitation. Science 1995, 269, 676–679. [Google Scholar] [CrossRef] [PubMed] [Green Version]
  4. Trigo, R.M.; Osborn, T.J.; Corte-Real, J.M. The North Atlantic Oscillation influence on Europe: Climate impacts and associated physical mechanisms. Clim. Res. 2002, 20, 9–17. [Google Scholar] [CrossRef]
  5. Vicente-Serrano, S.M.; Camarero, J.J.; Zabalza, J.; Sangüesa-Barreda, G.; López-Moreno, J.I.; Tague, C.L. Evapotranspiration deficit controls net primary production and growth of silver fir: Implications for Circum-Mediterranean forests under forecasted warmer and drier conditions. Agric. For. Meteorol. 2015, 206, 45–54. [Google Scholar] [CrossRef] [Green Version]
  6. Madrigal-González, J.; Ballesteros-Cánovas, J.A.; Herrero, A.; Ruiz-Benito, P.; Stoffel, M.; Lucas-Borja, M.E.; Andivia, E.; Sancho-García, C.; Zavala, M.A. Forest productivity in southwestern Europe is controlled by coupled North Atlantic and Atlantic Multidecadal Oscillations. Nat. Commun. 2017, 8, 1–8. [Google Scholar] [CrossRef] [Green Version]
  7. Luterbacher, J.; García-Herrera, R.; Akcer-On, S.; Allan, R.; Alvarez-Castro, M.C.; Benito, G.; Booth, J.; Büntgen, U.; Cagatay, N.; Colombaroli, D.; et al. A Review of 2000 Years of Paleoclimatic Evidence in the Mediterranean, 1st ed.; Elsevier Inc.: Amsterdam, The Netherlands, 2012; ISBN 9780124160422. [Google Scholar]
  8. Dünkeloh, A.; Jacobeit, J. Circulation dynamics of Mediterranean precipitation variability 1948-98. Int. J. Climatol. 2003, 23, 1843–1866. [Google Scholar] [CrossRef]
  9. Xoplaki, E.; González-Rouco, J.F.; Luterbacher, J.; Wanner, H. Mediterranean summer air temperature variability and its connection to the large-scale atmospheric circulation and SSTs. Clim. Dyn. 2003, 20, 723–739. [Google Scholar] [CrossRef]
  10. Seim, A.; Treydte, K.; Trouet, V.; Frank, D.; Fonti, P.; Tegel, W.; Panayotov, M.; Fernández-Donado, L.; Krusic, P.; Büntgen, U. Climate sensitivity of Mediterranean pine growth reveals distinct east-west dipole. Int. J. Climatol. 2014, 35, 2503–2513. [Google Scholar] [CrossRef]
  11. Sangüesa-Barreda, G.; Camarero, J.J.; Sánchez-Salguero, R.; Gutiérrez, E.; Linares, J.C.; Génova, M.; Ribas, M.; Tíscar, P.A.; López-Sáez, J.A. Droughts and climate warming desynchronize Black pine growth across the Mediterranean Basin. Sci. Total Environ. 2019, 697. [Google Scholar] [CrossRef]
  12. Camarero, J.J. Direct and Indirect Effects of the North Atlantic Oscillation on Tree Growth and Forest Decline in Northeastern Spain. In Advances in Global Change Research; Springer International Publishing: Cham, Switzerland, 2011; Volume 46, pp. 129–152. [Google Scholar] [CrossRef] [Green Version]
  13. Camarero, J.J.; Manzanedo, R.D.; Sanchez-Salguero, R.; Navarro-Cerrillo, R.M. Growth response to climate and drought change along an aridity gradient in the southernmost Pinus nigra relict forests. Ann. For. Sci. 2013, 70, 769–780. [Google Scholar] [CrossRef]
  14. Dorado-Liñán, I.; Zorita, E.; Martínez-Sancho, E.; Gea-Izquierdo, G.; Filippo, A.D.; Gutiérrez, E.; Levanic, T.; Piovesan, G.; Vacchiano, G.; Zang, C.; et al. Large-scale atmospheric circulation enhances the Mediterranean East-West tree growth contrast at rear-edge deciduous forests. Agric. For. Meteorol. 2017, 239, 86–95. [Google Scholar] [CrossRef]
  15. Rozas, V.; Camarero, J.J.; Sangüesa-Barreda, G.; Souto, M.; García-González, I. Summer drought and ENSO-related cloudiness distinctly drive Fagus sylvatica growth near the species rear-edge in northern Spain. Agric. For. Meteorol. 2015, 201, 153–164. [Google Scholar] [CrossRef] [Green Version]
  16. Vicente-Serrano, S.M.; Lopez-Moreno, J.I.; Beguería, S.; Lorenzo-Lacruz, J.; Sanchez-Lorenzo, A.; García-Ruiz, J.M.; Azorin-Molina, C.; Morán-Tejeda, E.; Revuelto, J.; Trigo, R.; et al. Evidence of increasing drought severity caused by temperature rise in southern Europe. Environ. Res. Lett. 2014, 9, 1–9. [Google Scholar] [CrossRef]
  17. Hurrell, J.W.; Kushnir, Y.; Visbeck, M. The North Atlantic oscillation. Science 2001, 291, 603–605. [Google Scholar] [CrossRef] [PubMed] [Green Version]
  18. Alvarez-Castro, M. Westerly Index: Un Nuevo Índice de Vientos del Oeste en el Canal de la Mancha a Partir de Observaciones en los Diarios de Navegación de la Royal Navy (1685–2008); Universidad Pablo de Olavide: Sevilla, Spain, 2014. [Google Scholar]
  19. Glueck, M.F.; Stockton, C.W. Reconstruction of the North Atlantic Oscillation, 1429–1983. Int. J. Climatol. 2001, 21, 1453–1465. [Google Scholar] [CrossRef]
  20. Barriopedro, D.; Gallego, D.; Alvarez-Castro, M.C.; García-Herrera, R.; Wheeler, D.; Peña-Ortiz, C.; Barbosa, S.M. Witnessing North Atlantic westerlies variability from ships’ logbooks (1685–2008). Clim. Dyn. 2014, 43, 939–955. [Google Scholar] [CrossRef]
  21. Vicente-Serrano, S.M.; Beguería, S.; López-Moreno, J.I. A multiscalar drought index sensitive to global warming: The standardized precipitation evapotranspiration index. J. Clim. 2010, 23, 1696–1718. [Google Scholar] [CrossRef] [Green Version]
  22. Manzano, A.; Clemente, M.A.; Morata, A.; Luna, M.Y.; Beguería, S.; Vicente-Serrano, S.M.; Martín, M.L. Analysis of the atmospheric circulation pattern effects over SPEI drought index in Spain. Atmos. Res. 2019, 230, 104630. [Google Scholar] [CrossRef]
  23. Vicente-Serrano, S.M.; García-Herrera, R.; Barriopedro, D.; Azorin-Molina, C.; López-Moreno, J.I.; Martín-Hernández, N.; Tomás-Burguera, M.; Gimeno, L.; Nieto, R. The Westerly Index as complementary indicator of the North Atlantic oscillation in explaining drought variability across Europe. Clim. Dyn. 2016, 47, 845–863. [Google Scholar] [CrossRef] [Green Version]
  24. Till, C.; Guiot, J. Reconstruction of precipitation in Morocco since 1100 A.D. Based on Cedrus atlantica tree-ring widths. Quat. Res. 1990, 33, 337–351. [Google Scholar] [CrossRef]
  25. Cook, E.R.; D’Arrigo, R.D.; Briffa, K.R. A reconstruction of the North Atlantic Oscillation using tree-ring chronologies from North America and Europe. Holocene 1998, 8, 9–17. [Google Scholar] [CrossRef]
  26. Fritts, H.C. Tree Rings and Climate; Blackburn Press: Caldwell, NJ, USA, 2001. [Google Scholar]
  27. Matskovsky, V.; Dolgova, E.; Lomakin, N.; Matveev, S. Dendroclimatology and historical climatology of Voronezh region, European Russia, since 1790s. Int. J. Climatol. 2017, 37, 3057–3066. [Google Scholar] [CrossRef]
  28. Tejedor, E.; Saz, M.A.; Esper, J.; Cuadrat, J.M.; de Luis, M. Summer drought reconstruction in northeastern Spain inferred from a tree ring latewood network since 1734. Geophys. Res. Lett. 2017, 44, 8492–8500. [Google Scholar] [CrossRef] [Green Version]
  29. Luterbacher, J.; Xoplaki, E.; Dietrich, D.; Rickli, R.; Jacobeit, J.; Beck, C.; Gyalistras, D.; Schmutz, C.; Wanner, H. Reconstruction of sea level pressure fields over the Eastern North Atlantic and Europe back to 1500. Clim. Dyn. 2002, 18, 545–562. [Google Scholar] [CrossRef]
  30. Grissino-Mayer, H.D.; Fritts, H.C. The International Tree-Ring Data Bank: An enhanced global database serving the global scientific community. Holocene 1997, 7, 235–238. Available online: http://www.ncdc.noaa.gov/paleo/treering.html (accessed on 13 June 2018). [CrossRef]
  31. Kuniholm, P.I. Long tree-ring chronologies for the Eastern Mediterranean, Archaeometry 1994. In Proceedings of the 29th International Symposium on Archaeometry, Ankara, Turkey; 1994; pp. 401–409. [Google Scholar]
  32. Touchan, R.; Xoplaki, E.; Funkhouser, G.; Luterbacher, J.; Hughes, M.K.; Erkan, N.; Akkemik, Ü.; Stephan, J. Reconstructions of spring/summer precipitation for the Eastern Mediterranean from tree-ring widths and its connection to large-scale atmospheric circulation. Clim. Dyn. 2005, 25, 75–98. [Google Scholar] [CrossRef]
  33. Seim, A.; Buentgen, U.; Fonti, P.; Haska, H.; Herzig, F.; Tegel, W.; Trouet, V.; Treydte, K. Climate sensitivity of a millennium-long pine chronology from Albania. Clim. Res. 2012, 51, 217–228. [Google Scholar] [CrossRef]
  34. Sánchez-Salguero, R.; Camarero, J.J.; Carrer, M.; Gutiérrez, E.; Alla, A.Q.; Andreu-Hayles, L.; Hevia, A.; Koutavas, A.; Martínez-Sancho, E.; Nola, P.; et al. Climate extremes and predicted warming threaten Mediterranean Holocene firs forests refugia. Proc. Natl. Acad. Sci. USA 2017, 114, E10142–E10150. [Google Scholar] [CrossRef] [Green Version]
  35. Kuniholm, P.I.; Groneman, C. Pinus Nigra–Taygetos forest, Greece; National Climatic Data Center, NESDIS, NOAA, U.S. Department of Commerce: Boulder, CO, USA, 2005. [Google Scholar]
  36. Linares, J.C.; Camarero, J.J.; Carreira, J.A. Interacting effects of climate and forest-cover changes on mortality and growth of the southernmost European fir forests. Glob. Ecol. Biogeogr. 2009, 18, 485–497. [Google Scholar] [CrossRef]
  37. Shestakova, T.A.; Voltas, J.; Saurer, M.; Berninger, F.; Esper, J.; Andreu-Hayles, L.; Daux, V.; Helle, G.; Leuenberger, M.; Loader, N.; et al. Spatio-temporal patterns of tree growth as related to carbon isotope fractionation in European forests under changing climate. Glob. Ecol. Biogeogr. 2019, 28, 1295–1309. [Google Scholar] [CrossRef]
  38. Esper, J.; Frank, D.; Büntgen, U.; Verstege, A.; Luterbacher, J.; Xoplaki, E. Long-term drought severity variations in Morocco. Geophys. Res. Lett. 2007, 34, L17702. [Google Scholar] [CrossRef] [Green Version]
  39. Cook, E.R.; Peters, K. Calculating unbiased tree-ring indices for the study of climatic and environmental change. Holocene 1997, 7, 361–370. [Google Scholar] [CrossRef]
  40. Cook, E. A Time Series Analysis Approach to Tree Ring Standardization; The University of Arizona: Tucson, AZ, USA, 1985. [Google Scholar]
  41. Wigley, T.M.L.; Briffa, K.R.; Jones, P.D.; Wigley, T.M.L.; Briffa, K.R.; Jones, P.D. On the Average Value of Correlated Time Series, with Applications in Dendroclimatology and Hydrometeorology. J. Clim. Appl. Meteorol. 1984, 2, 201–213. [Google Scholar] [CrossRef]
  42. Mitchell, T.D.; Jones, P.D. An improved method of constructing a database of monthly climate observations and associated high-resolution grids. Int. J. Climatol. 2005, 25, 693–712. Available online: https://crudata.uea.ac.uk/cru/data/pci.htm (accessed on 13 June 2018). [CrossRef]
  43. Beguería, S.; Vicente-Serrano, S.M. SPEI: Calculation of the Standardised Precipitation-Evapotranspiration Index, R package version 1.7. 2017. Available online: https://rdrr.io/cran/SPEI/ (accessed on 2 June 2020).
  44. Stenseth, N.C.; Ottersen, G.; Hurrell, J.W.; Mysterud, A.; Lima, M.; Chan, K.S.; Yoccoz, N.G.; Ådlandsvik, B. Studying climate effects on ecology through the use of climate indices: The North Atlantic Oscillation, El Niño Southern Oscillation and beyond. Proc. R. Soc. B Biol. Sci. 2003, 270, 2087–2096. [Google Scholar] [CrossRef] [PubMed] [Green Version]
  45. KNMI Climate Explorer. Available online: http://climexp.knmi.nl/ (accessed on 15 June 2018).
  46. Vicente-Serrano, S.M.; López-Moreno, J.I.; Lorenzo-Lacruz, J.; Kenawy, A.E.; Azorin-Molina, C.; Morán-Tejeda, E.; Pasho, E.; Zabalza, J.; Beguería, S.; Angulo-Martínez, M. The NAO Impact on Droughts in the Mediterranean Region. In Advances in Global Change Research; Springer International Publishing: Cham, Switzerland, 2011; Volume 46, pp. 23–40. [Google Scholar] [CrossRef]
  47. Meko, D.; Graybill, D.A. Tree-ring reconstruction of Upper Gila Rwer Discharge. J. Am. Water Resour. Assoc. 1995, 31, 605–616. [Google Scholar] [CrossRef]
  48. Zang, C.; Biondi, F. treeclim: An R package for the numerical calibration of proxy-climate relationships. Ecography (Cop.) 2015, 38, 431–436. [Google Scholar] [CrossRef]
  49. Bunn, A.G. A dendrochronology program library in R (dplR). Dendrochronologia 2008, 26, 115–124. [Google Scholar] [CrossRef]
  50. R: A Language and Environment for Statistical Computing; R Foundation for Statistical Computing: Vienna, Austria, 2020.
  51. Jones, P.D.; Briffa, K.R.; Osborn, T.J.; Lough, J.M.; Van Ommen, T.D.; Vinther, B.M.; Luterbacher, J.; Wahl, E.R.; Zwiers, F.W.; Mann, M.E.; et al. High-resolution palaeoclimatology of the last millennium: A review of current status and future prospects. Holocene 2009, 19, 3–49. [Google Scholar] [CrossRef]
  52. Lionello, P.; Malanotte-Rizzoli, P.; Boscolo, R. The Mediterranean Climate: An Overview of the Main Characteristics and Issues. Dev. Earth Environ. Sci. 2006, 4, 1–26. [Google Scholar]
  53. Luterbacher, J.; Xoplaki, E.; Casty, C.; Wanner, H.; Kiittel, M.; Rutishauser, T.; Bronnimann, S.; Fischer, E.; Fleitmann, D.; Gonzalez-rouco, F.J.; et al. Mediterranean Climate Variability over the Last Centuries: A Review. Dev. Earth Environ. Sci. 2006, 4, 27–148. [Google Scholar] [CrossRef]
  54. Lionello, P.; Abrantes, F.; Gacic, M.; Planton, S.; Trigo, R.; Ulbrich, U. The climate of the Mediterranean region: Research progress and climate change impacts. Reg. Environ. Chang. 2014, 14, 1679–1684. [Google Scholar] [CrossRef]
  55. Lionello, P. The Climate of the Mediterranean Region: From the Past to the Future; Elsevier: Amsterdam, The Netherlands, 2012; ISBN 9780123914774. [Google Scholar]
  56. Jalut, G.; Dedoubat, J.J.; Fontugne, M.; Otto, T. Holocene circum-Mediterranean vegetation changes: Climate forcing and human impact. Quat. Int. 2009, 200, 4–18. [Google Scholar] [CrossRef]
  57. Mensing, S.A.; Tunno, I.; Sagnotti, L.; Florindo, F.; Noble, P.; Archer, C.; Zimmerman, S.; Pavón-Carrasco, F.J.; Cifani, G.; Passigli, S.; et al. 2700 years of Mediterranean environmental change in central Italy: Asynthesis of sedimentary and cultural records to interpret past impacts of climate on society. Quat. Sci. Rev. 2015, 116, 72–94. [Google Scholar] [CrossRef]
  58. Ulbrich, U.; Lionello, P.; Belušić, D.; Jacobeit, J.; Knippertz, P.; Kuglitsch, F.G.; Leckebusch, G.C.; Luterbacher, J.; Maugeri, M.; Maheras, P.; et al. Climate of the Mediterranean: Synoptic Patterns, Temperature, Precipitation, Winds, and Their Extremes; Elsevier: Amsterdam, The Netherlands, 2012; ISBN 9780124160422. [Google Scholar]
  59. Nissen, K.M.; Leckebusch, G.C.; Pinto, J.G.; Renggli, D.; Ulbrich, S.; Ulbrich, U. Cyclones causing wind storms in the Mediterranean: Characteristics, trends and links to large-scale patterns. Nat. Hazards Earth Syst. Sci. 2010, 10, 1379–1391. [Google Scholar] [CrossRef]
  60. Pasho, E.; Camarero, J.J.; de Luis, M.; Vicente-Serrano, S.M. Impacts of drought at different time scales on forest growth across a wide climatic gradient in north-eastern Spain. Agric. For. Meteorol. 2011, 151, 1800–1811. [Google Scholar] [CrossRef]
  61. García-Alix, A.; Jiménez-Espejo, F.J.; Toney, J.L.; Jiménez-Moreno, G.; Ramos-Román, M.J.; Anderson, R.S.; Ruano, P.; Queralt, I.; Delgado Huertas, A.; Kuroda, J. Alpine bogs of southern Spain show human-induced environmental change superimposed on long-term natural variations. Sci. Rep. 2017, 7, 1–12. [Google Scholar] [CrossRef]
  62. Xoplaki, E.; Trigo, R.M.; García-Herrera, R.; Barriopedro, D.; D’Andrea, F.; Fischer, E.M.; Gimeno, L.; Gouveia, C.; Hernández, E.; Kuglitsch, F.G.; et al. Large-Scale Atmospheric Circulation Driving Extreme Climate Events in the Mediterranean and Its Related Impacts; Elsevier: Oxford, UK, 2012; ISBN 9780124160422. [Google Scholar]
  63. Linares, J.C.; Covelo, F.; Carreira, J.A.; Merino, J.Á. Phenological and water-use patterns underlying maximum growing season length at the highest elevations: Implications under climate change. Tree Physiol. 2012, 32, 161–170. [Google Scholar] [CrossRef] [PubMed] [Green Version]
  64. Bastos, A.; Janssens, I.A.; Gouveia, C.M.; Trigo, R.M.; Ciais, P.; Chevallier, F.; Peñuelas, J.; Rödenbeck, C.; Piao, S.; Friedlingstein, P.; et al. European land CO2 sink influenced by NAO and East-Atlantic Pattern coupling. Nat. Commun. 2016, 7, 1–9. [Google Scholar] [CrossRef] [PubMed]
  65. Babst, F.; Bodesheim, P.; Charney, N.; Friend, A.D.; Girardin, M.P.; Klesse, S.; Moore, D.J.P.; Seftigen, K.; Björklund, J.; Bouriaud, O.; et al. When tree rings go global: Challenges and opportunities for retro- and prospective insight. Quat. Sci. Rev. 2018, 197, 1–20. [Google Scholar] [CrossRef]
  66. Esper, J.; George, S.S.; Anchukaitis, K.; D’Arrigo, R.; Ljungqvist, F.C.; Luterbacher, J.; Schneider, L.; Stoffel, M.; Wilson, R.; Büntgen, U. Large-scale, millennial-length temperature reconstructions from tree-rings. Dendrochronologia 2018, 50, 81–90. [Google Scholar] [CrossRef] [Green Version]
  67. Touchan, R.; Anchukaitis, K.J.; Meko, D.M.; Attalah, S.; Baisan, C.; Aloui, A. Long term context for recent drought in northwestern Africa. Geophys. Res. Lett. 2008, 35, 1–5. [Google Scholar] [CrossRef]
  68. Manrique, E.; Fernandez-Cancio, A. Extreme climatic events in dendroclimatic reconstructions from Spain. Clim. Chang. 2000, 44, 123–138. [Google Scholar]
  69. Akkemik, Ü.; Aras, A. Reconstruction (1689–1994 AD) of April-August precipitation in the southern part of central Turkey. Int. J. Climatol. 2005, 25, 537–548. [Google Scholar] [CrossRef]
  70. Pozo-Vazquez, D.; Santos-Alamillos, F.J.; Lara-Fanego, V.; Ruiz-Arias, J.A.; Tovar-Pescador, J. Hydrological, Socioeconomic and Ecological Impacts of the North Atlantic Oscillation in the Mediterranean Region; Springer: Dordrecht, The Netherlands, 2011; Volume 46, pp. 213–231. [Google Scholar]
Figure 1. Map showing the geographic locations of the study sites in the Mediterranean Basin and the digital elevation model in the background. Colored squares represent the studied species in green (Abies pinsapo, A. borissi-regis, A. cilicica), blue (Pinus nigra), and red (Cedrus atlantica, C. libani and P. heldreichii) populations, respectively. Climatic diagrams for each study site (mean temperature, red lines; precipitation, blue areas) are shown.
Atmosphere 11 00644 g001
Figure 2. Field correlations for the period 1901–2001 calculated between winter North Atlantic Oscillation (DJF NAO, upper panel) and annual Westerly Index (WI, lower panel) and winter 3-month Standardized Precipitation–Evapotranspiration Index (SPEI3). Squares in the upper panel are study sites (see codes in Figure 1).
Atmosphere 11 00644 g002
Figure 3. Bootstrapped tree growth–climate associations for the studied sites assessed by relating ring-width indices (TRWi) to seasonal and monthly climatic variables (mean temperature and precipitation) for the 1946–2010 period. The temporal window of analyses ranges from the previous August (previous-year months and seasons are abbreviated in uppercase letters) to the current December (current-year months are abbreviated in lowercase letters). Significance levels are shown in darker grey color (p < 0.01). Sites’ codes are as in Table 1.
Atmosphere 11 00644 g003
Figure 4. Drought–growth associations of the studied sites in the Mediterranean Basin (from the left to the right for respective rows) assessed by relating ring-width indices (TRWi) to the Standardized Precipitation–Evapotranspiration Index (SPEI) considering for up to 24-month-long scales (x axes). Correlations were calculated for the common and best-replicated period of 1946–2010 and considering the months of the current growth year (y axes). Correlation values above +0.25 and below −0.25 were significant at the p < 0.05 level. Sites’ codes are as in Table 1.
Atmosphere 11 00644 g004
Figure 5. Composite regional chronologies (tree-ring width indices, TRWi; continuous lines) obtained for the studied sites and May to June Standardized Precipitation–Evapotranspiration Index (MJ–SPEI) drought index calculated at 3-month-long scales (dotted red lines) for the 1901–2010 period. The plotted drought index and NAO (dashed cyan line; winter for west, spring for central, and summer for east) were most strongly related to the tree-ring width indices (TRWi) in most study sites (see Figure 5). Pearson correlations (r) between TRWi and the indices and associated probability values (P) are shown for each site (see Figure 6 for more correlations).
Atmosphere 11 00644 g005
Figure 6. Bootstrapped tree growth–climate associations for the studied sites assessed by relating ring-width indices (TRWi) to monthly SPEI3, NAO, and WI indices for the period 1946–2001. The temporal window of analyses includes the time from the previous August (previous-year months are abbreviated in lowercase letters) up to the current December (current-year months are abbreviated in uppercase letters). Significance levels are shown in grey color (p < 0.01). Sites’ codes are as in Table 1.
Atmosphere 11 00644 g006
Figure 7. Temporal changes in bootstrapped correlation coefficients between tree-ring width indices (TRWi) and the best correlated (see Figure 6) SPEI, NAO, and WI using 30-year-long intervals shifted by one year for the period of 1903–2001 (values are arranged for the last year of each 30-year-long interval). Dotted grey horizontal lines indicate statistically significant correlation coefficients (p < 0.05). Sites’ codes are as in Table 1, and the selected period for each site is shown in Table A1.
Atmosphere 11 00644 g007
Table 1. Site features of the study forests in the Mediterranean Basin.
VariablesWestCentralEast
ABPICEATPINIABBRPIHEPINIABCICELIPINI
Latitude (N)35°10′33″32°58′36″37°49′12″40°21′00″40°42′00″36°55′12″35°34′12″36°40′12″36°27′00″
Longitude (W/E)5°11′58″ W5°3′35″ W2°57′00″ W20°23′24″ E20°7′58″ E22°21′00″ E36°12′00″ E29°55′12″ E32°31′12″ E
Elevation (m a.s.l.)180022001800114420001400145018001580
AspectNNENWNWWNWW
MAP5605104839731007565721769691
MAT16.713.412.110.610.117.617.314.713.1
Nºof trees/Nº of cores26/5250/10035/6949/49124/12430/3034/3436/3619/19
Mean/Max Age (years)211/397309/1024272/94794/122310/604232/343111/207348/619332/557
ABPI: Abies pinsapo; CEAT: Cedrus atlantica; PINI: Pinus nigra; ABBR: Abies borissi-regis; PIHE: Pinus heldreichii; ABCI: Abies cilicica; CELI: Cedrus libani. MAP: mean annual precipitation; MAT: mean annual temperature based on gridded CRU TS. 3.0 dataset [42].
Table 2. Correlation matrix of the seasonal (wi, winter; sp, spring; su, summer; au, autumn) and annual WI (dependent variable) versus annual NAO and annual SPEI3 for each of the nine different sites for 1946–2010. Correlation values in bold letters are significant at the p < 0.05 level.
TitleSPEI
WestCentralEast
SeasonNAOABPICEATPINIABBRPIHEPINIABCICELIPINI
WIan0.490.39−0.14−0.22−0.03−0.19−0.010.26−0.02−0.04
WIwi0.790.610.360.53−0.10−0.100.02−0.11−0.04−0.08
Wisp0.500.410.06−0.09−0.12−0.25−0.20−0.14−0.23−0.08
WIsu0.340.03−0.01−0.08−0.02−0.13−0.060.29−0.02−0.14
WIau0.560.30−0.170.30−0.12−0.210.09−0.120.030.03
Table 3. Dendrochronological statistics based on radial growth series for each studied site. The statistics and mean basal tree-ring width values were calculated for the common period of 1930–2010. All dendrochronological statistics were calculated for residual series except autocorrelation (AC), which was obtained for raw tree-ring width data.
VariablesWestCentralEast
ABPICEATPINIABBRPIHEPINIABCICELIPINI
Tree-ring width (mm) ± SD1.07 ± 0.360.76 ± 0.230.56 ± 0.122.67 ± 0.630.80 ± 0.150.93 ± 0.281.02 ± 0.361.29 ± 0.220.58 ± 0.11
Time span1614–2011977–20011050–20101874–20121405–20081657–19991795–20011370–19881444–2003
AC0.8320.7910.8420.7590.8150.8070.8100.8020.844
MS0.2370.3110.2480.2430.2130.2440.2210.2840.221
Rbt0.5330.7560.5900.4640.5700.4960.4740.5750.460
SNR4.3993.6397.2075.6212.1929.0956.70311.935.372
PC1 (%)37.2258.0939.3033.0536.0536.5630.5035.0526.35
EPS 1930–20100.9250.9920.9760.9510.9920.9520.9710.9050.943
Abbreviations: AC, first-order autocorrelation for raw tree-ring series; MS, mean sensitivity; rbt, mean between-trees correlation of indexed values; SNR: signal-to-noise ratio; PC1, variance accounted for by the first principal component; EPS, expressed population signal.
Table 4. Mann–Kendall statistic and related probability levels assessing NAO, WI, and site SPEI (3 months) trends for selected months during the period 1946–2010 and considering the nine Mediterranean study sites, p < 0.05 (italic values) and p < 0.01 (bold values).
MonthSPEI 3WestCentralEast
NAOWIABPICEATPINIABBRPIHEPINIABCICELIPINI
January0.060.04−0.02−0.10−0.070.17−0.170.010.070.01−0.03
February0.20−0.01−0.08−0.10−0.110.18−0.140.01−0.050.01−0.10
March0.240.16−0.16−0.08−0.15−0.09−0.08−0.05−0.10−0.08−0.10
April−0.16−0.08−0.12−0.110.19−0.010.00−0.07−0.04−0.08−0.09
May0.020.07−0.15−0.170.21−0.03−0.10−0.01−0.01−0.01−0.12
June−0.10−0.09−0.100.160.230.01−0.060.010.07−0.010.06
July0.000.030.18−0.110.170.02−0.130.070.010.05−0.01
August0.02−0.07−0.130.07−0.090.02−0.060.050.060.060.02
September−0.12−0.090.030.150.100.01−0.010.15−0.050.200.09
October0.030.070.090.160.05−0.08−0.010.180.030.200.03
November0.060.080.070.070.05−0.16−0.070.130.080.150.04
December−0.07−0.080.09−0.020.000.16−0.160.070.090.070.00
Table 5. Calibration verification statistics for the dendroclimatic reconstructions of climatic variables using tree-ring width indices in the Cedrus atlantica study site for the period of 1903–2001. Climate variables were current summer SPEI 12-month scale (SPEIsu); previous December NAO (NAOdt-1); and previous November–December Westerly Index (WIndt-1). Statistics’ abbreviations: RE, reduction of error; CE, coefficient of efficiency; and DW, Durbin–Watson test.
West1903–19531954–20011903–2001
RECEDWrRECEDWRInterceptSloper
SPEIsu0.1750.5021.5160.580.3531.0491.5170.62−1.9751.9790.52
NAOdt-10.2430.5151.2320.260.2180.2231.9740.421.601−1.6660.29
WIndt-10.0250.0201.7140.330.1880.1911.2940.3050.136−10.9730.28

