Assessment of Gaseous and Particulate Emissions of a Euro 6d-Temp Diesel Vehicle Driven >1300 km Including Six Diesel Particulate Filter Regenerations


Abstract
1. Introduction
2. Experiments
2.1. Vehicle and Fuel
2.2. Laboratory Tests
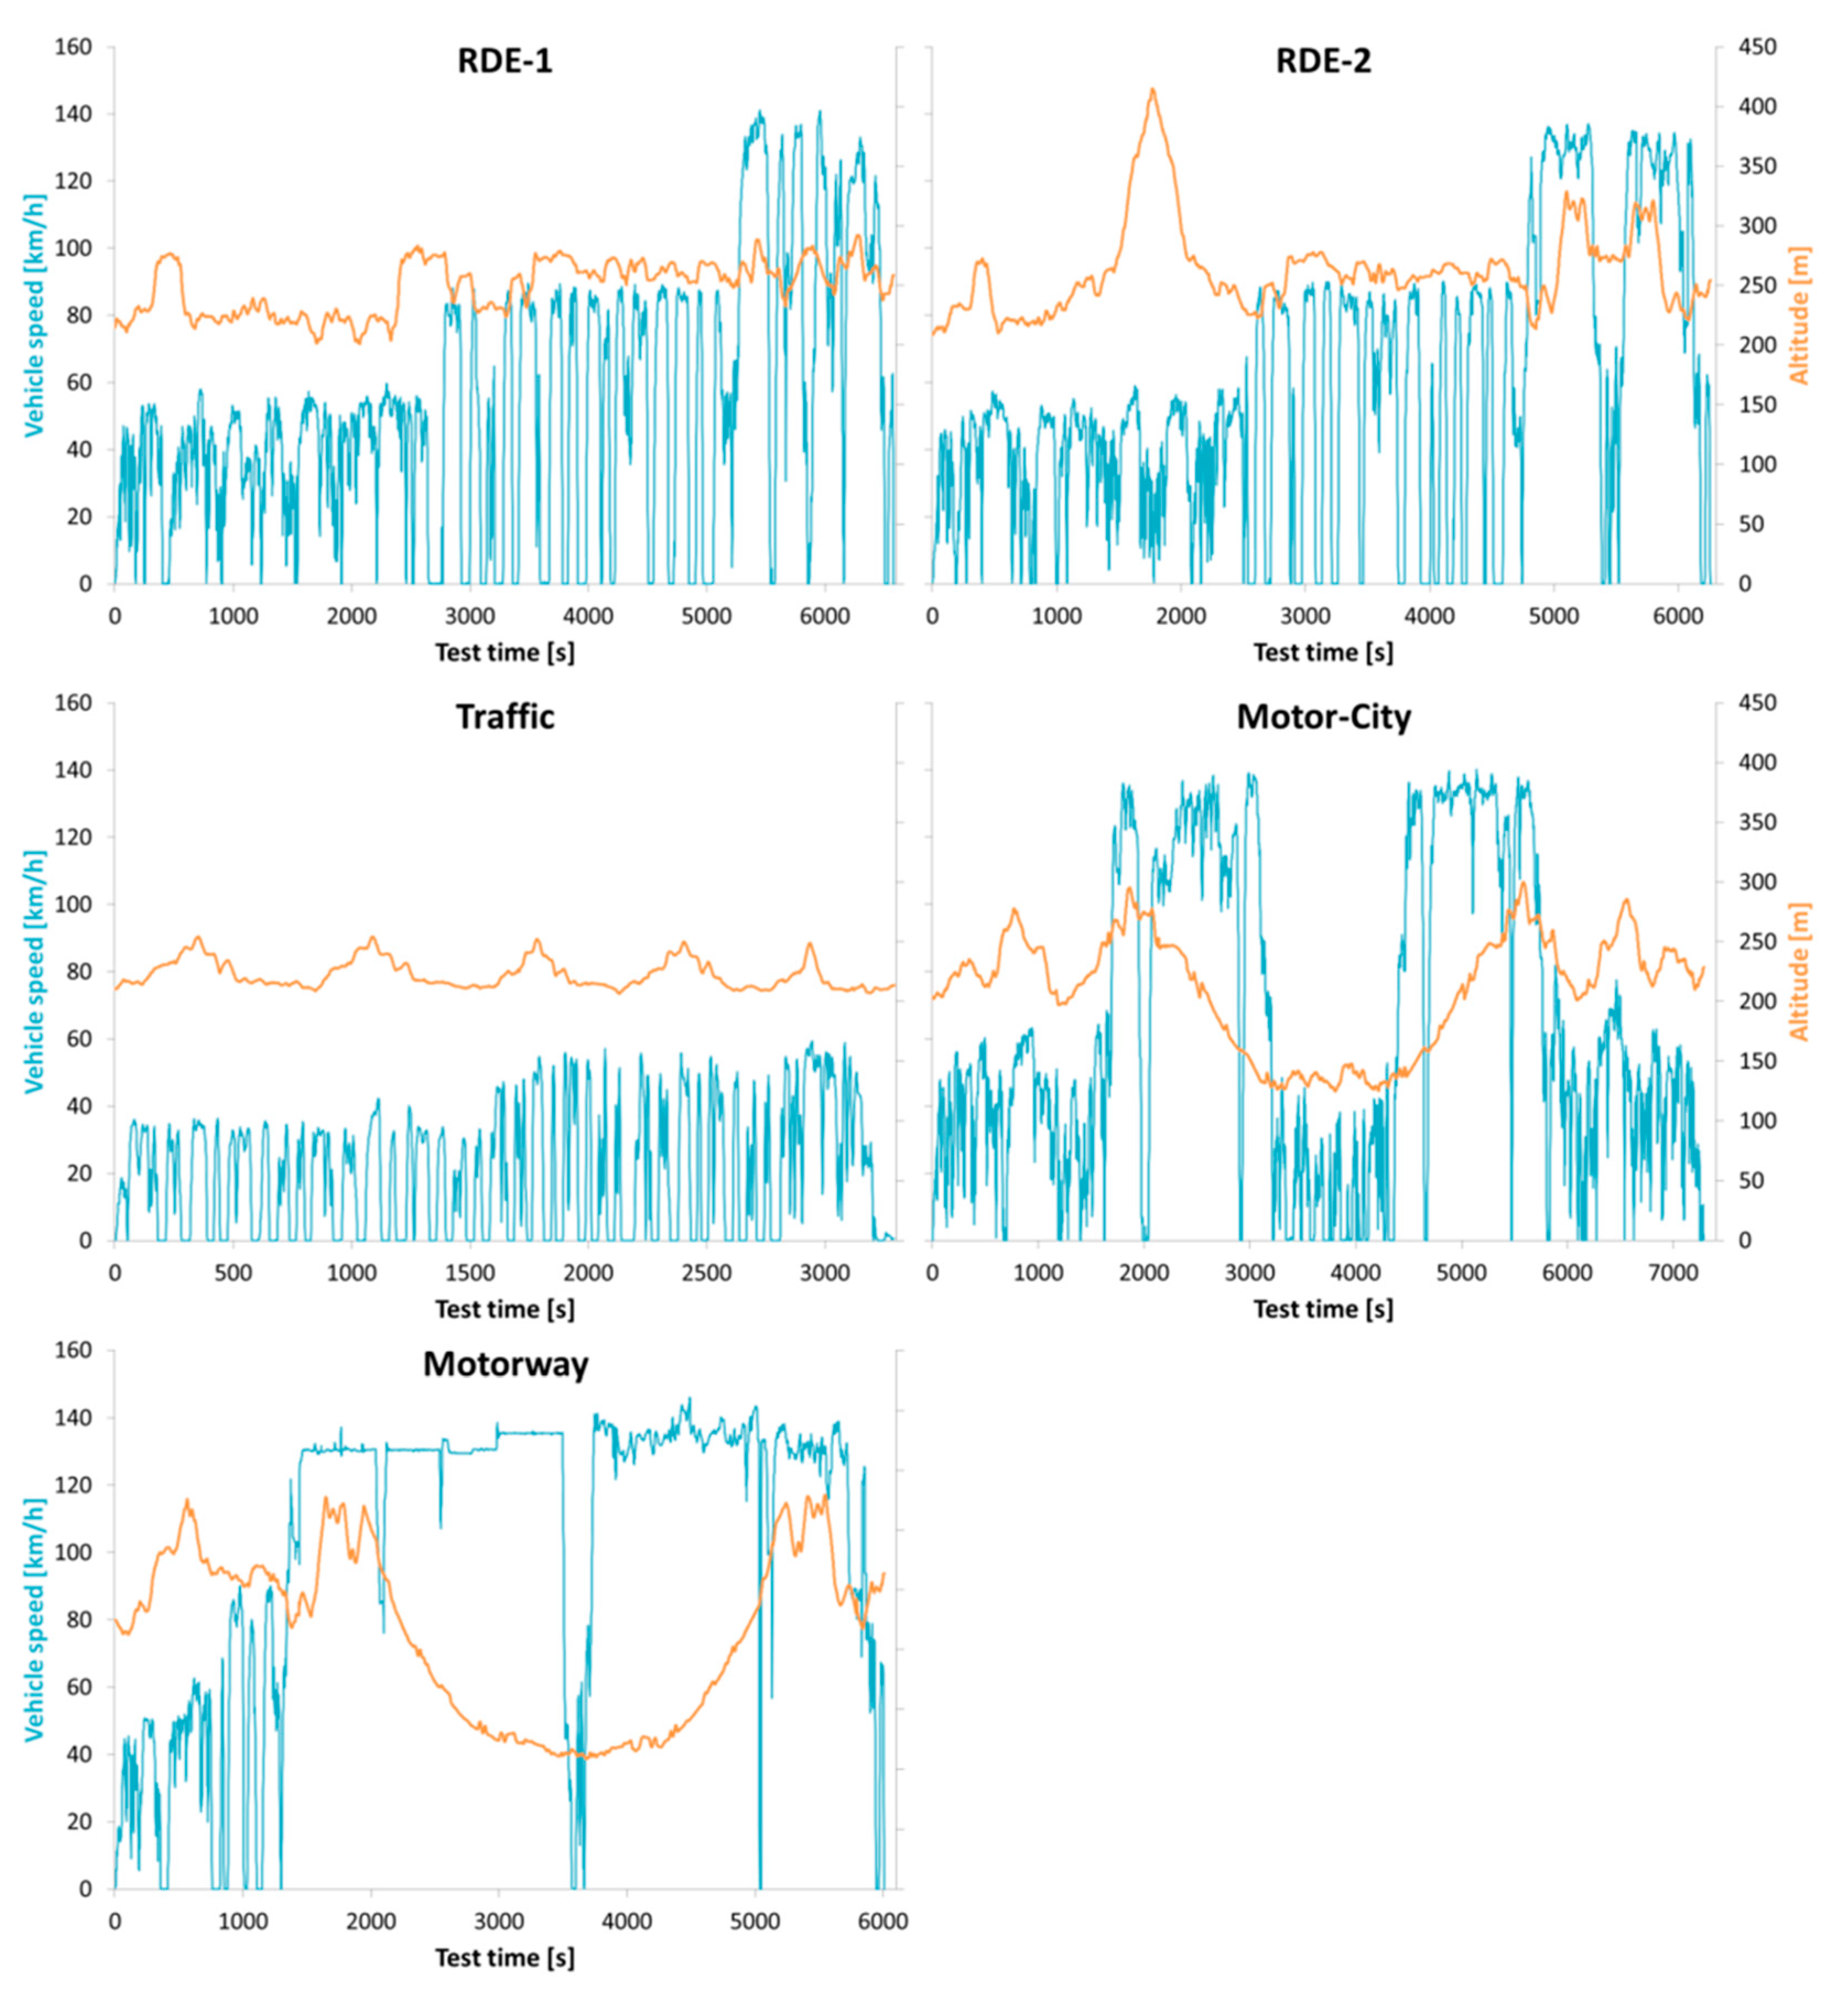
2.3. On-Road Tests
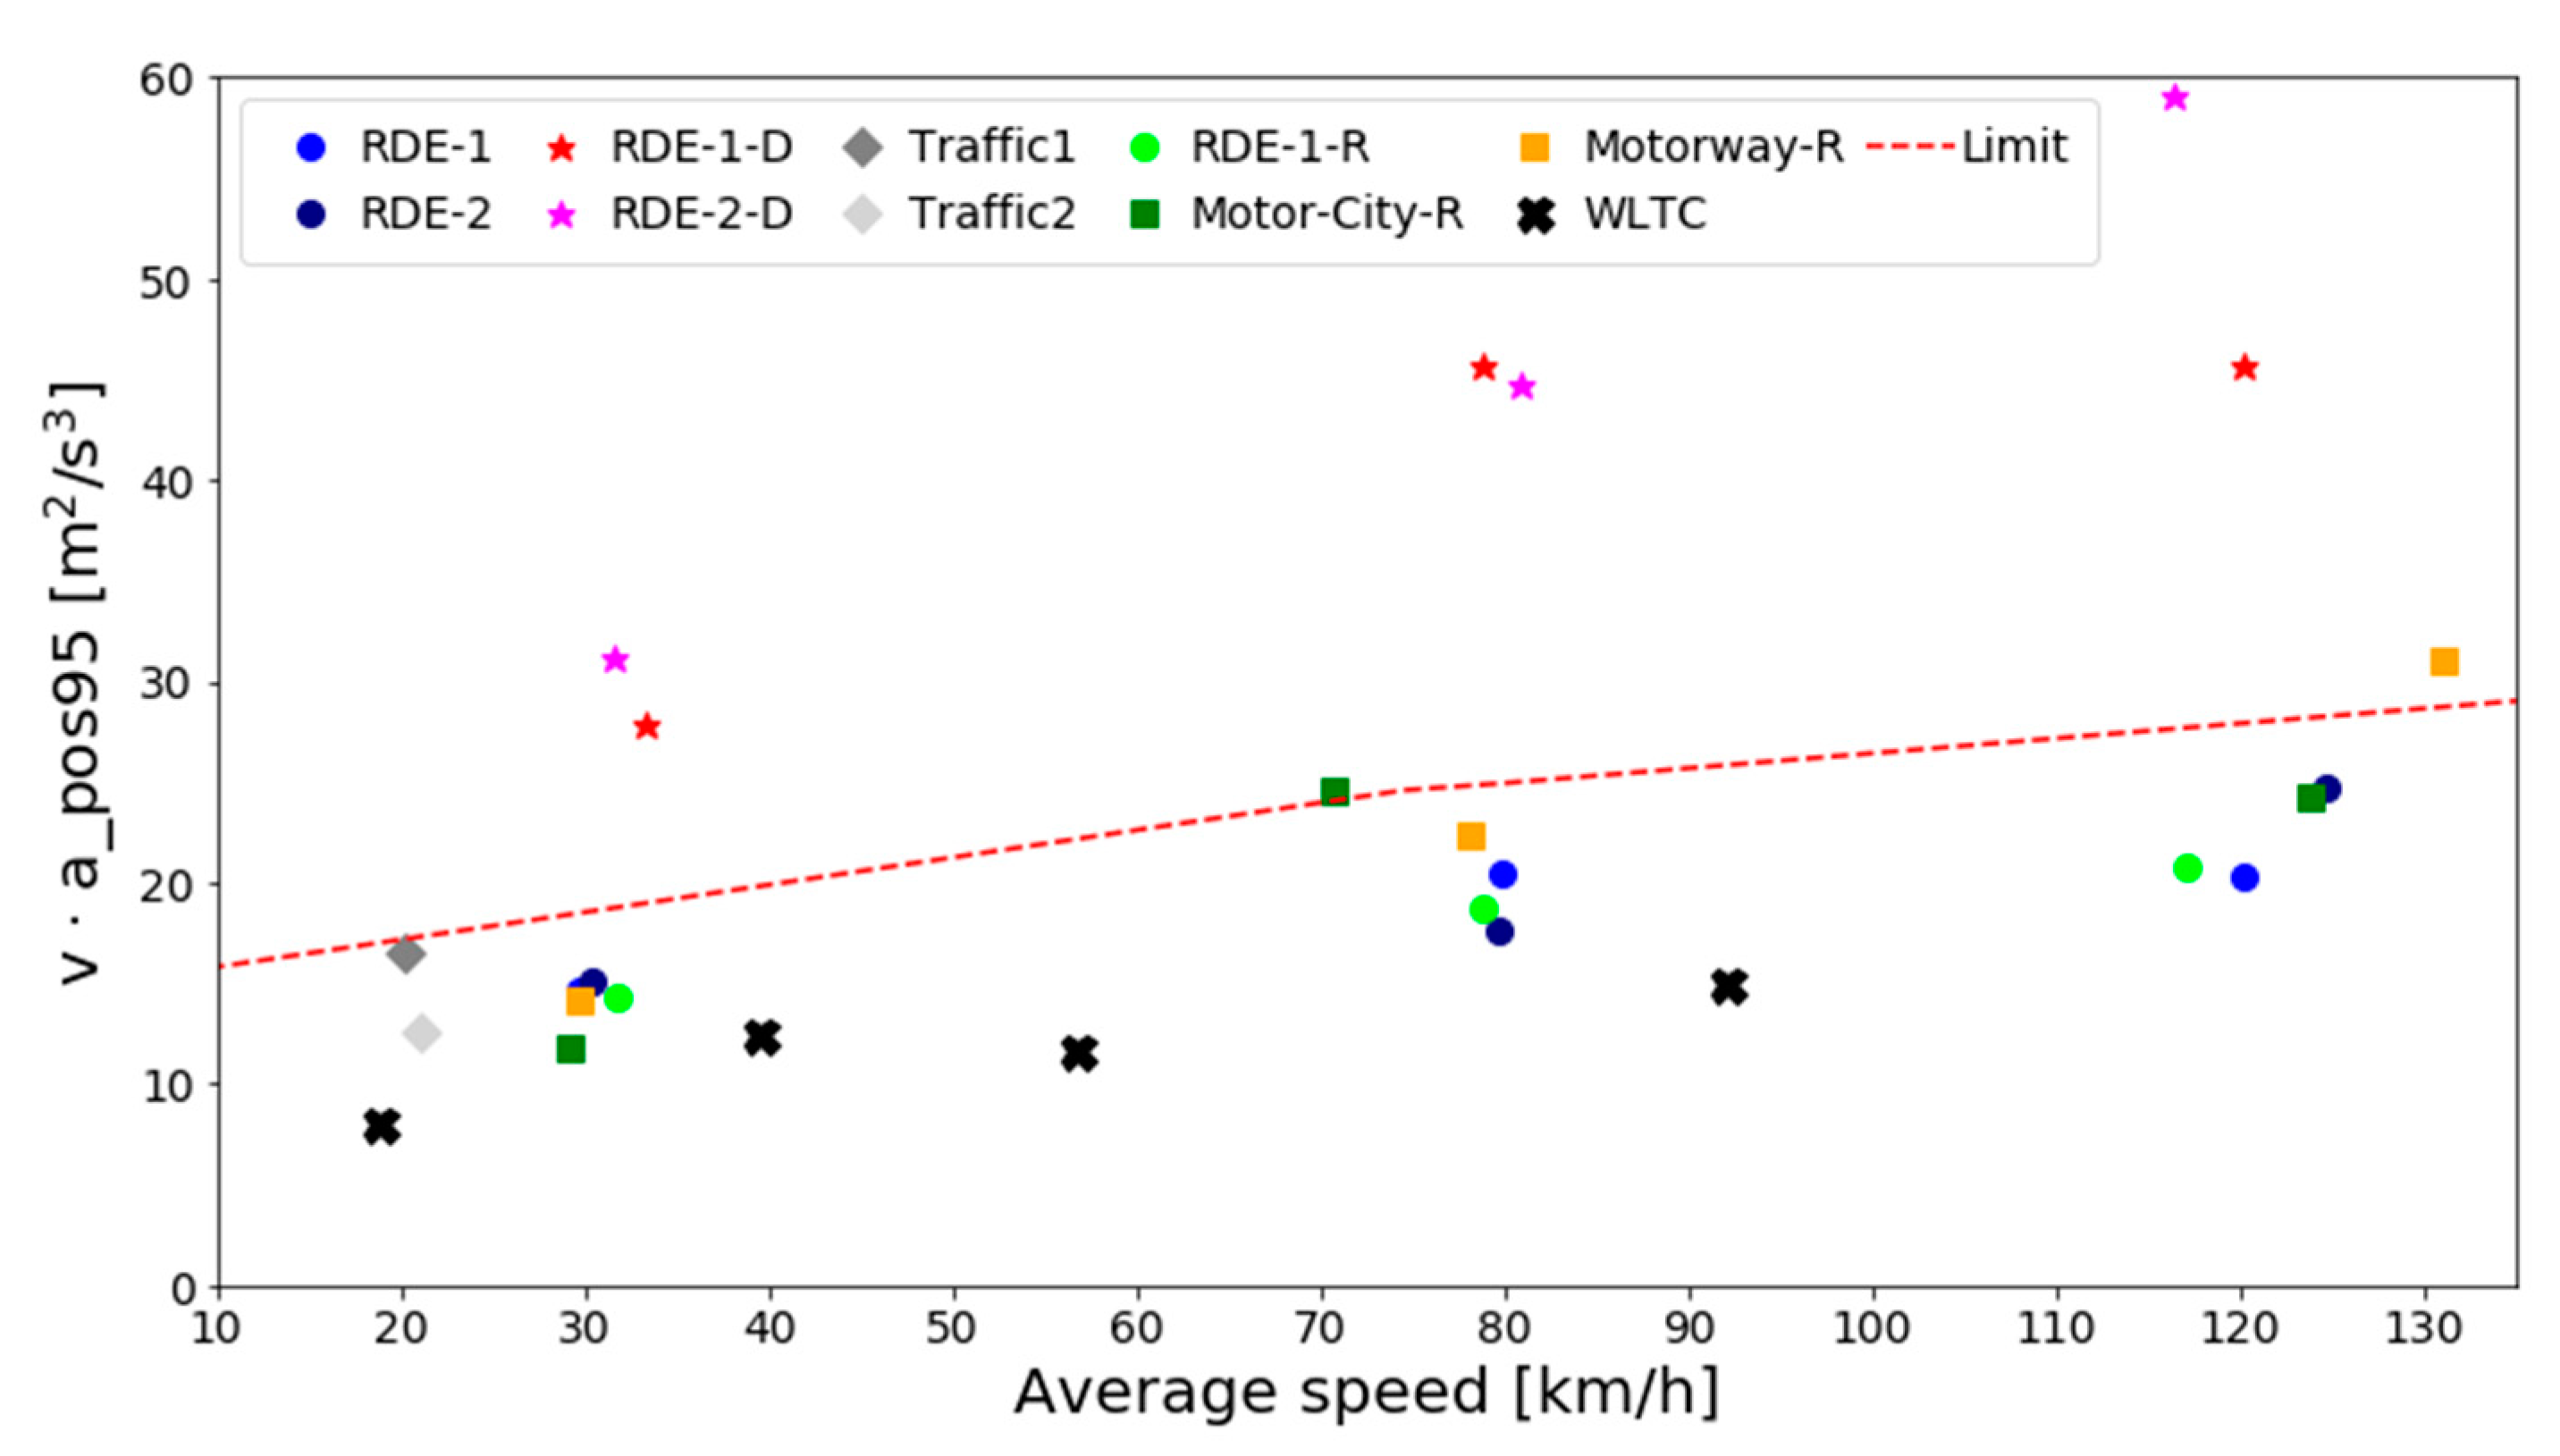
2.4. Calculations
3. Results
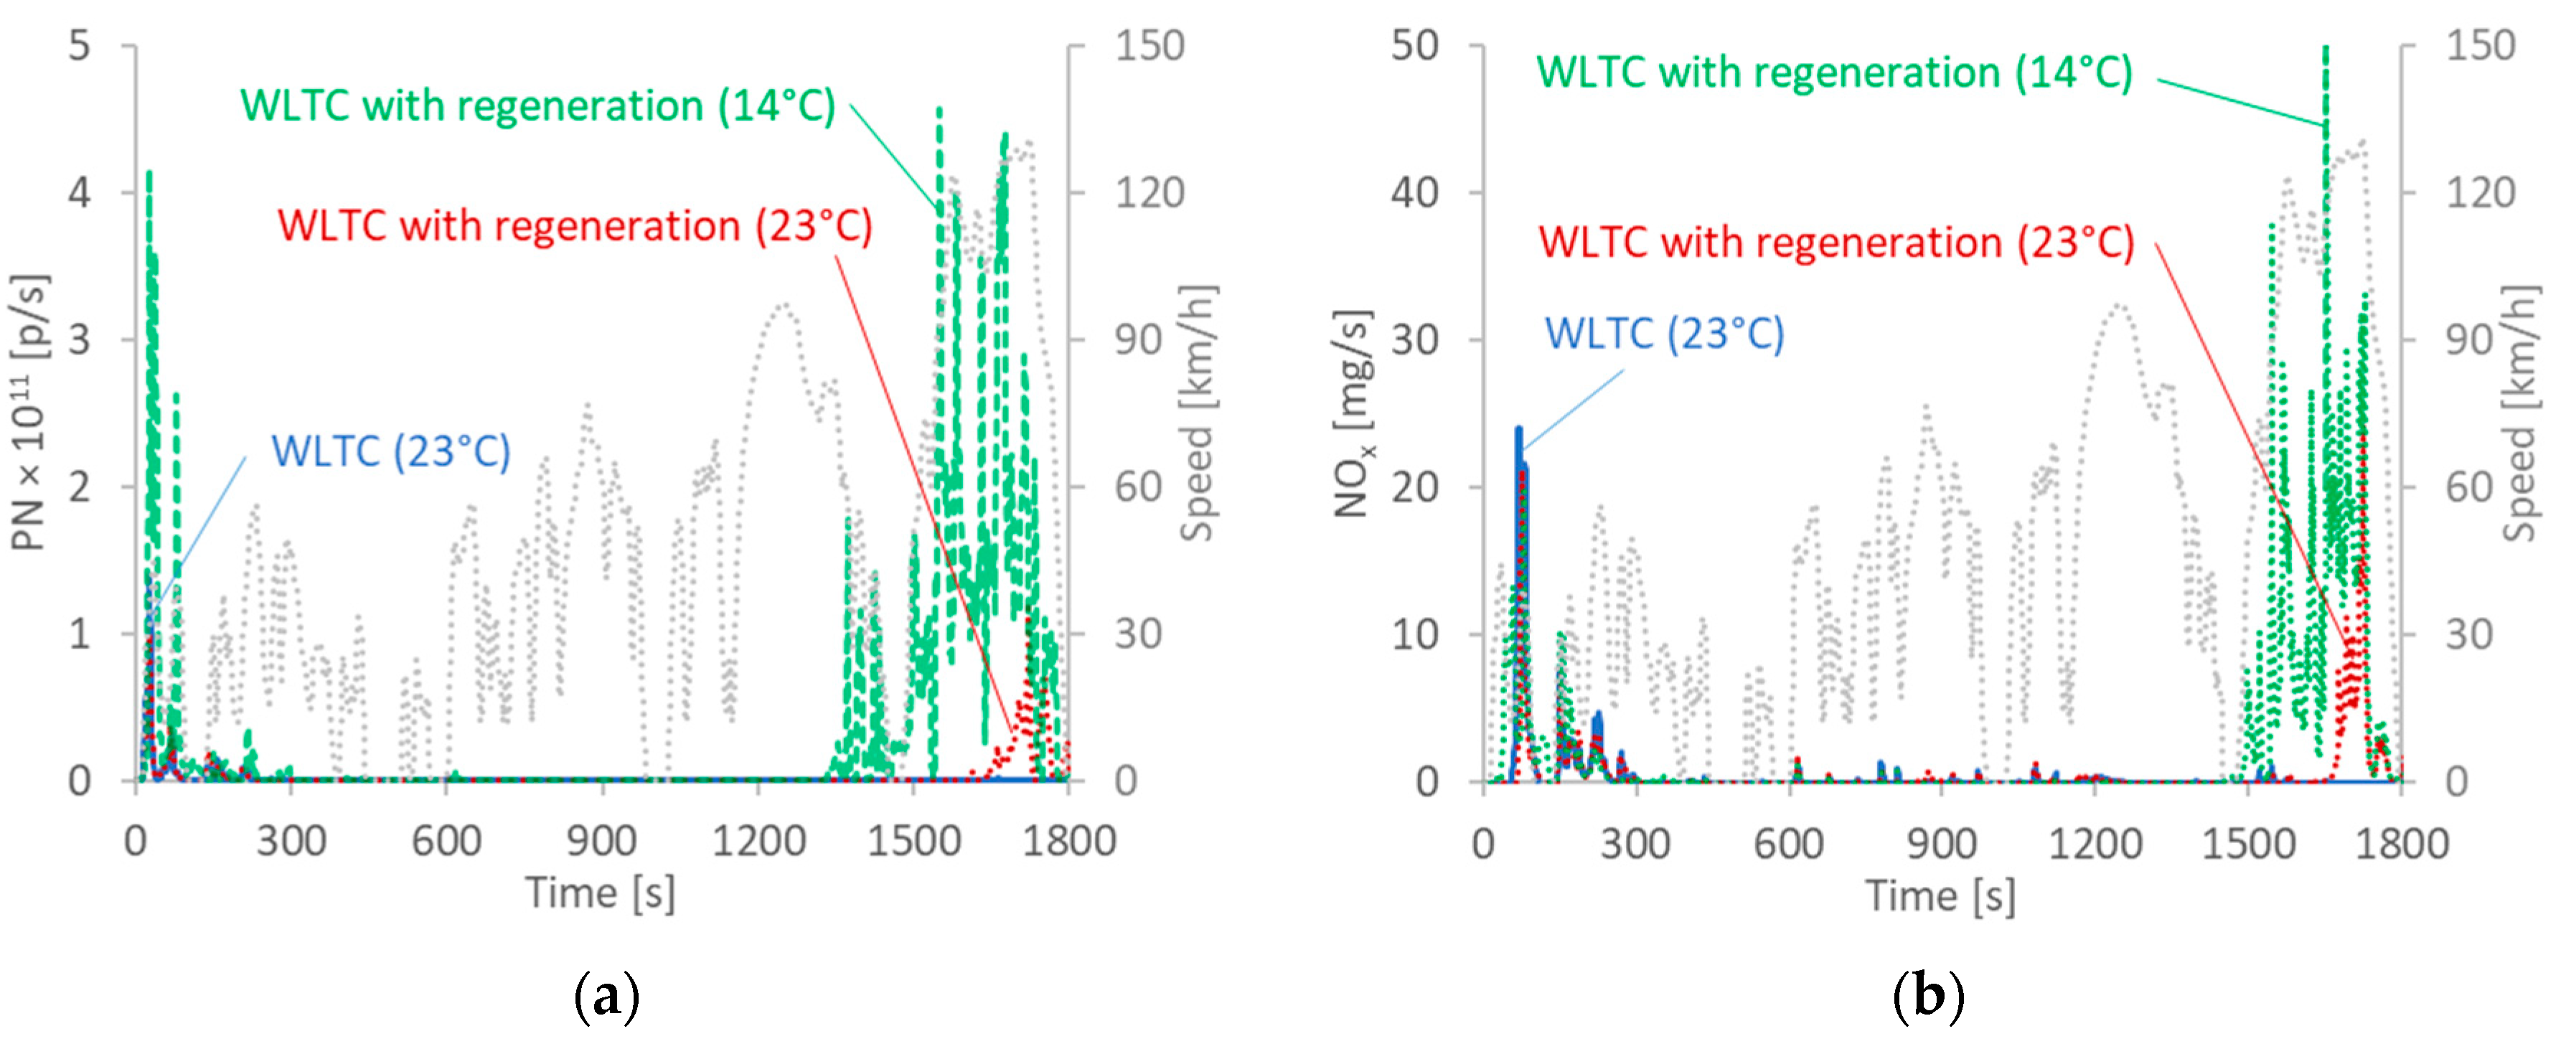
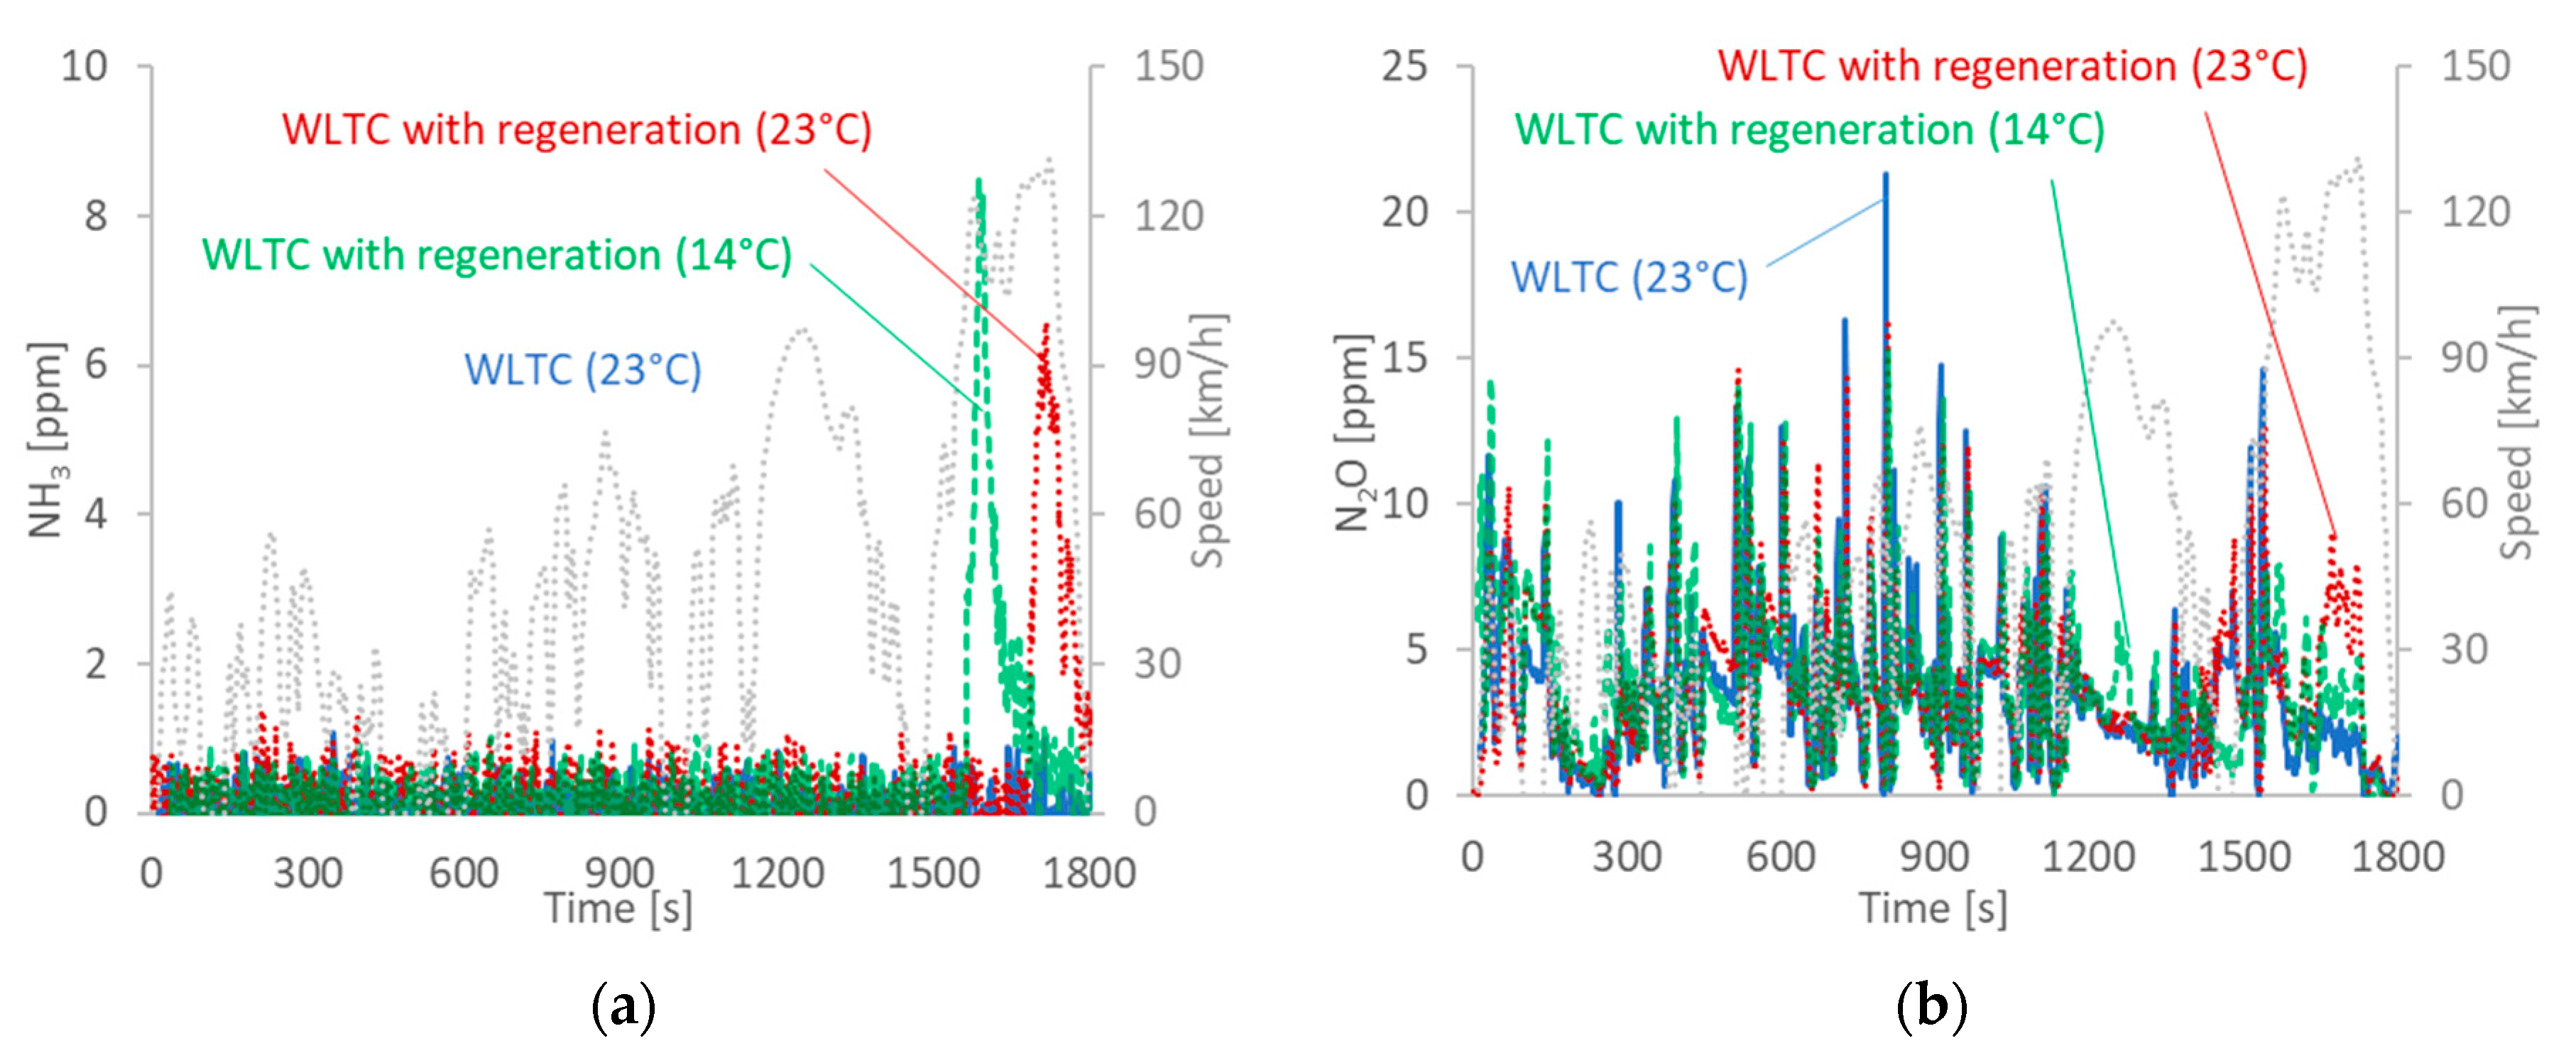
3.1. Laboratory Tests
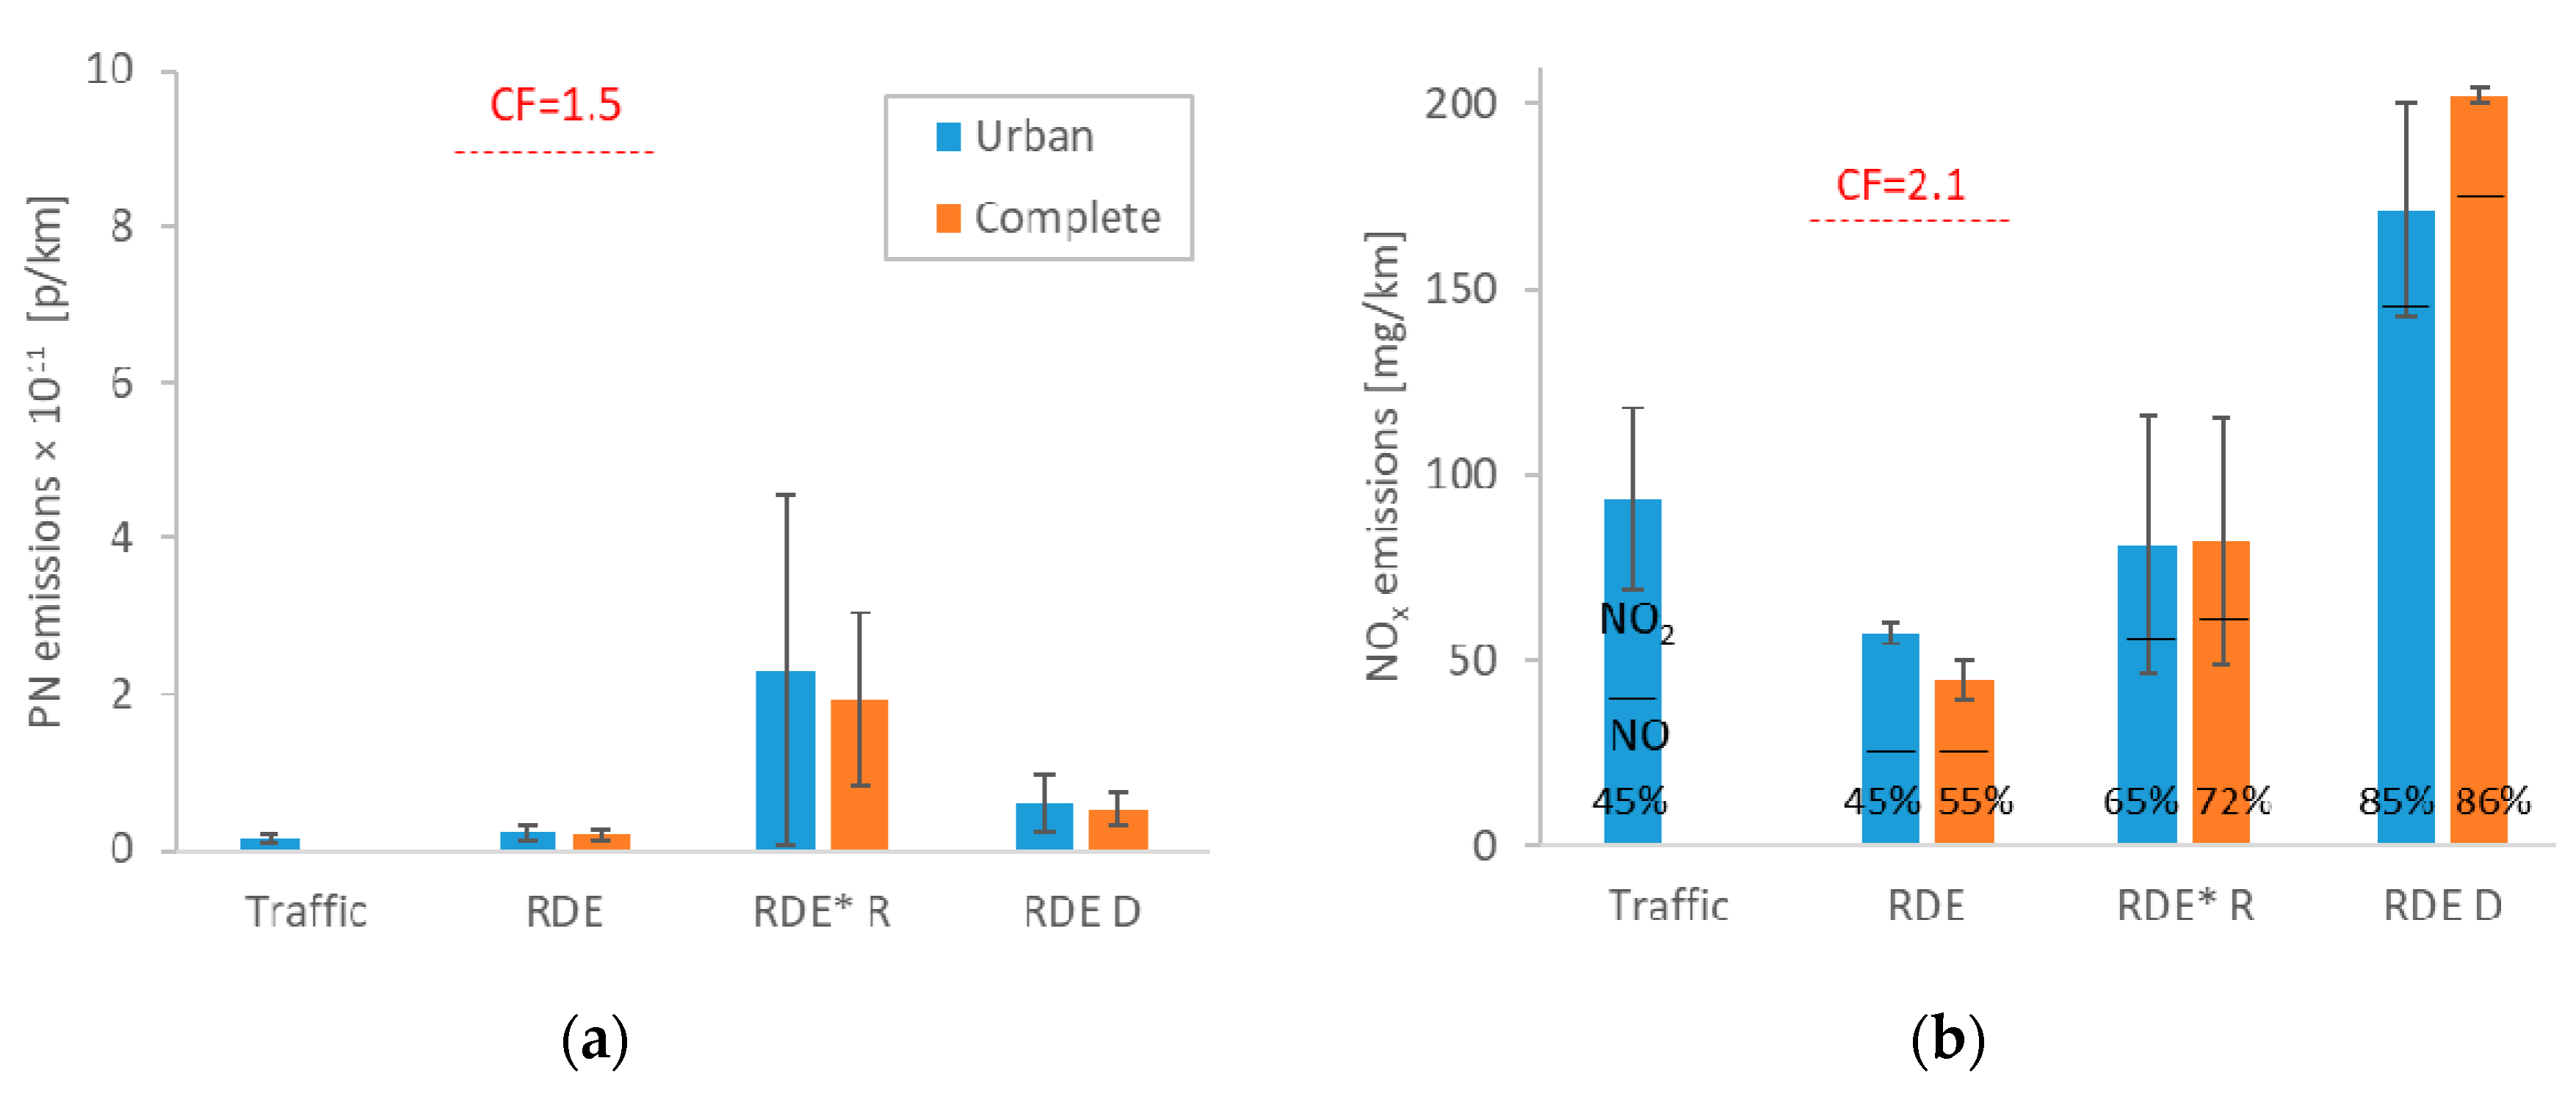
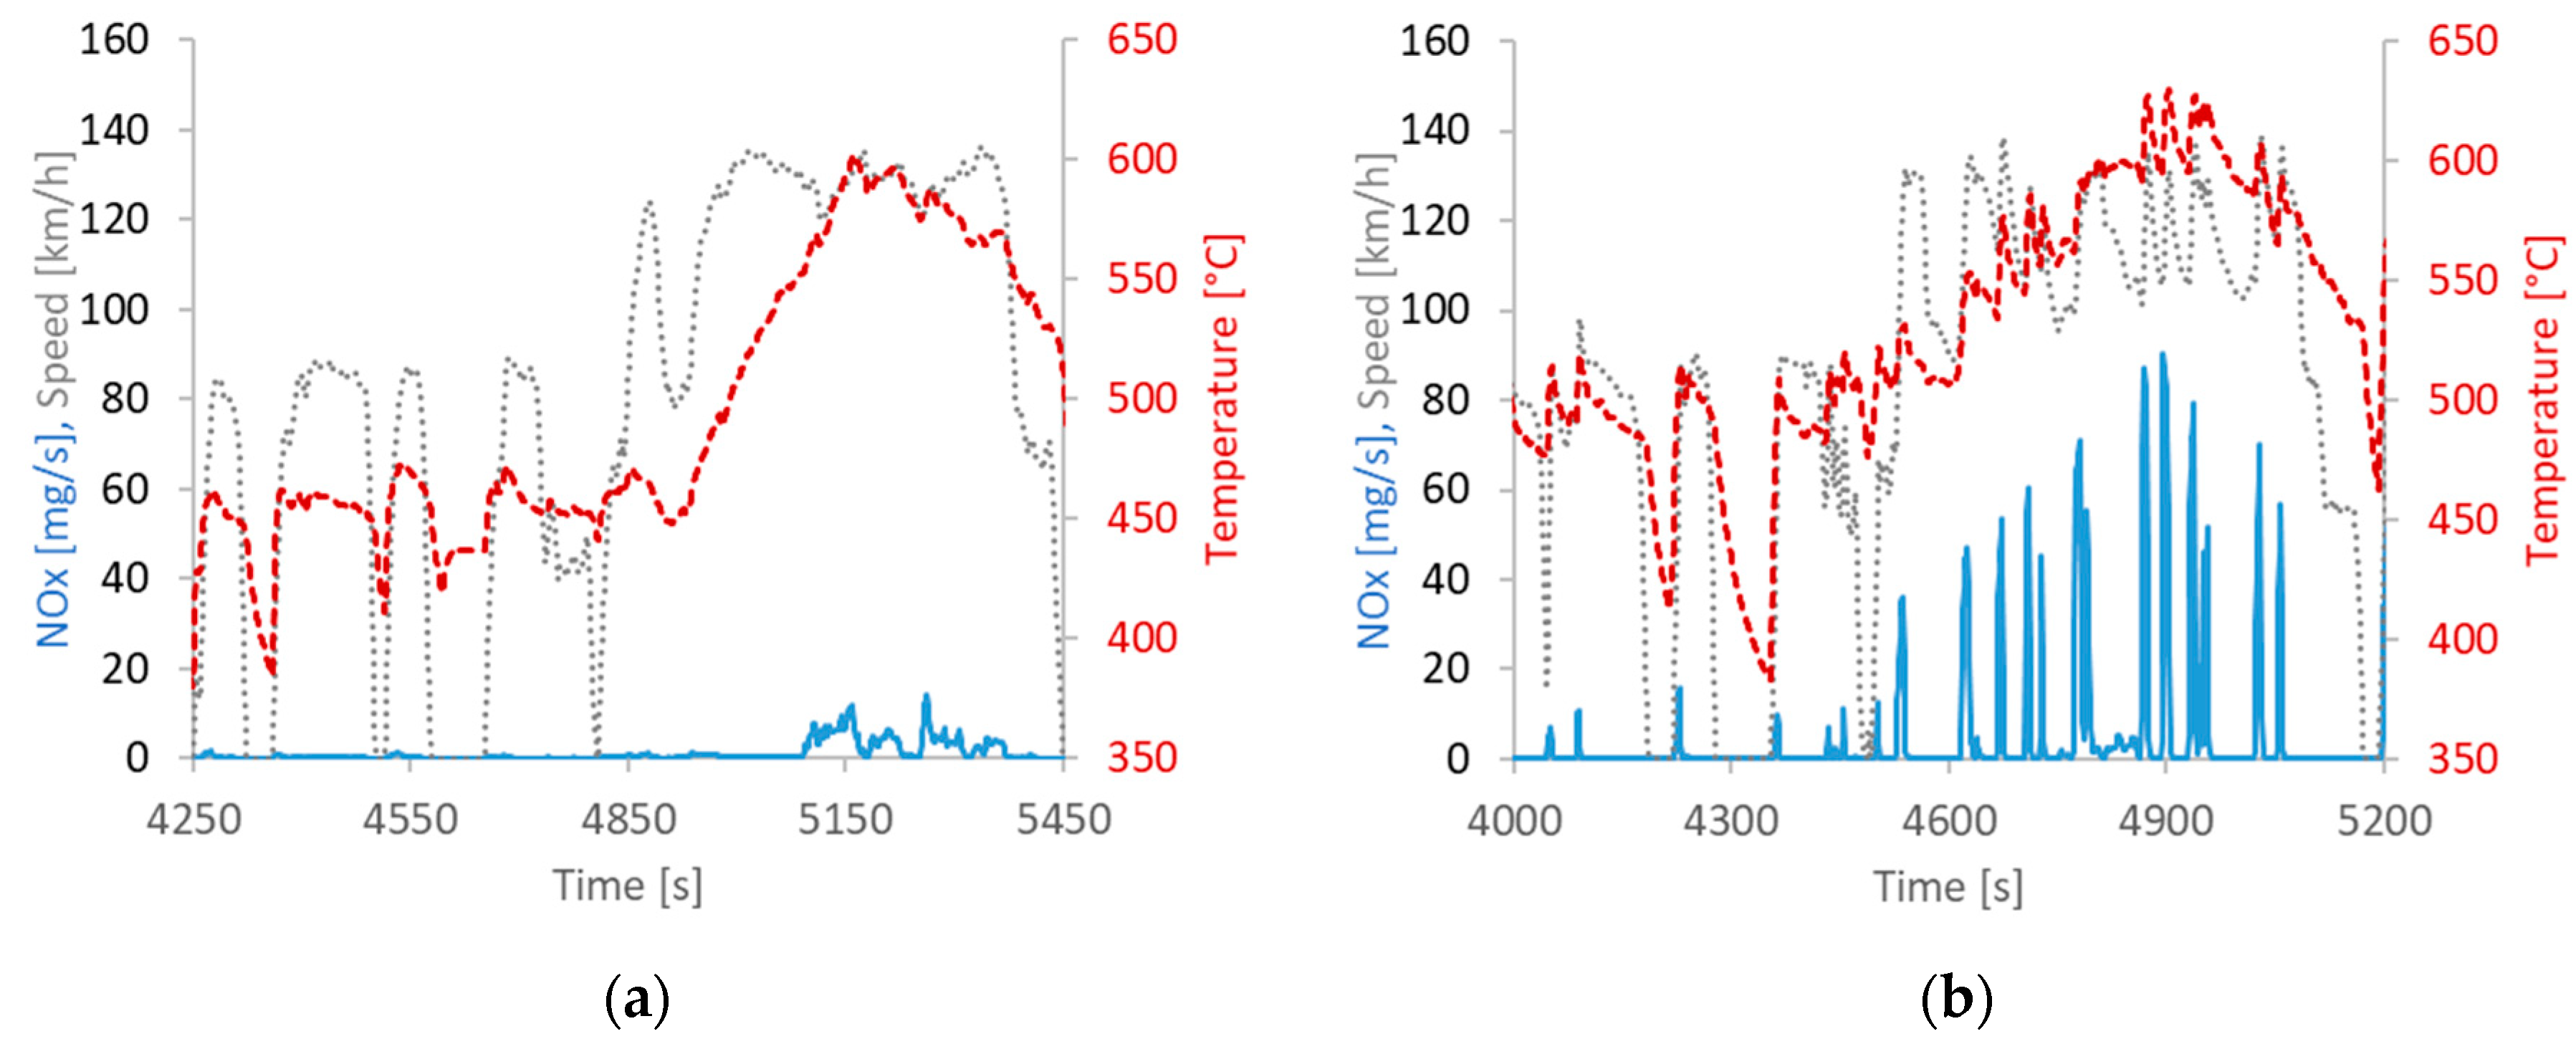
3.2. On-Road Tests
4. Discussion
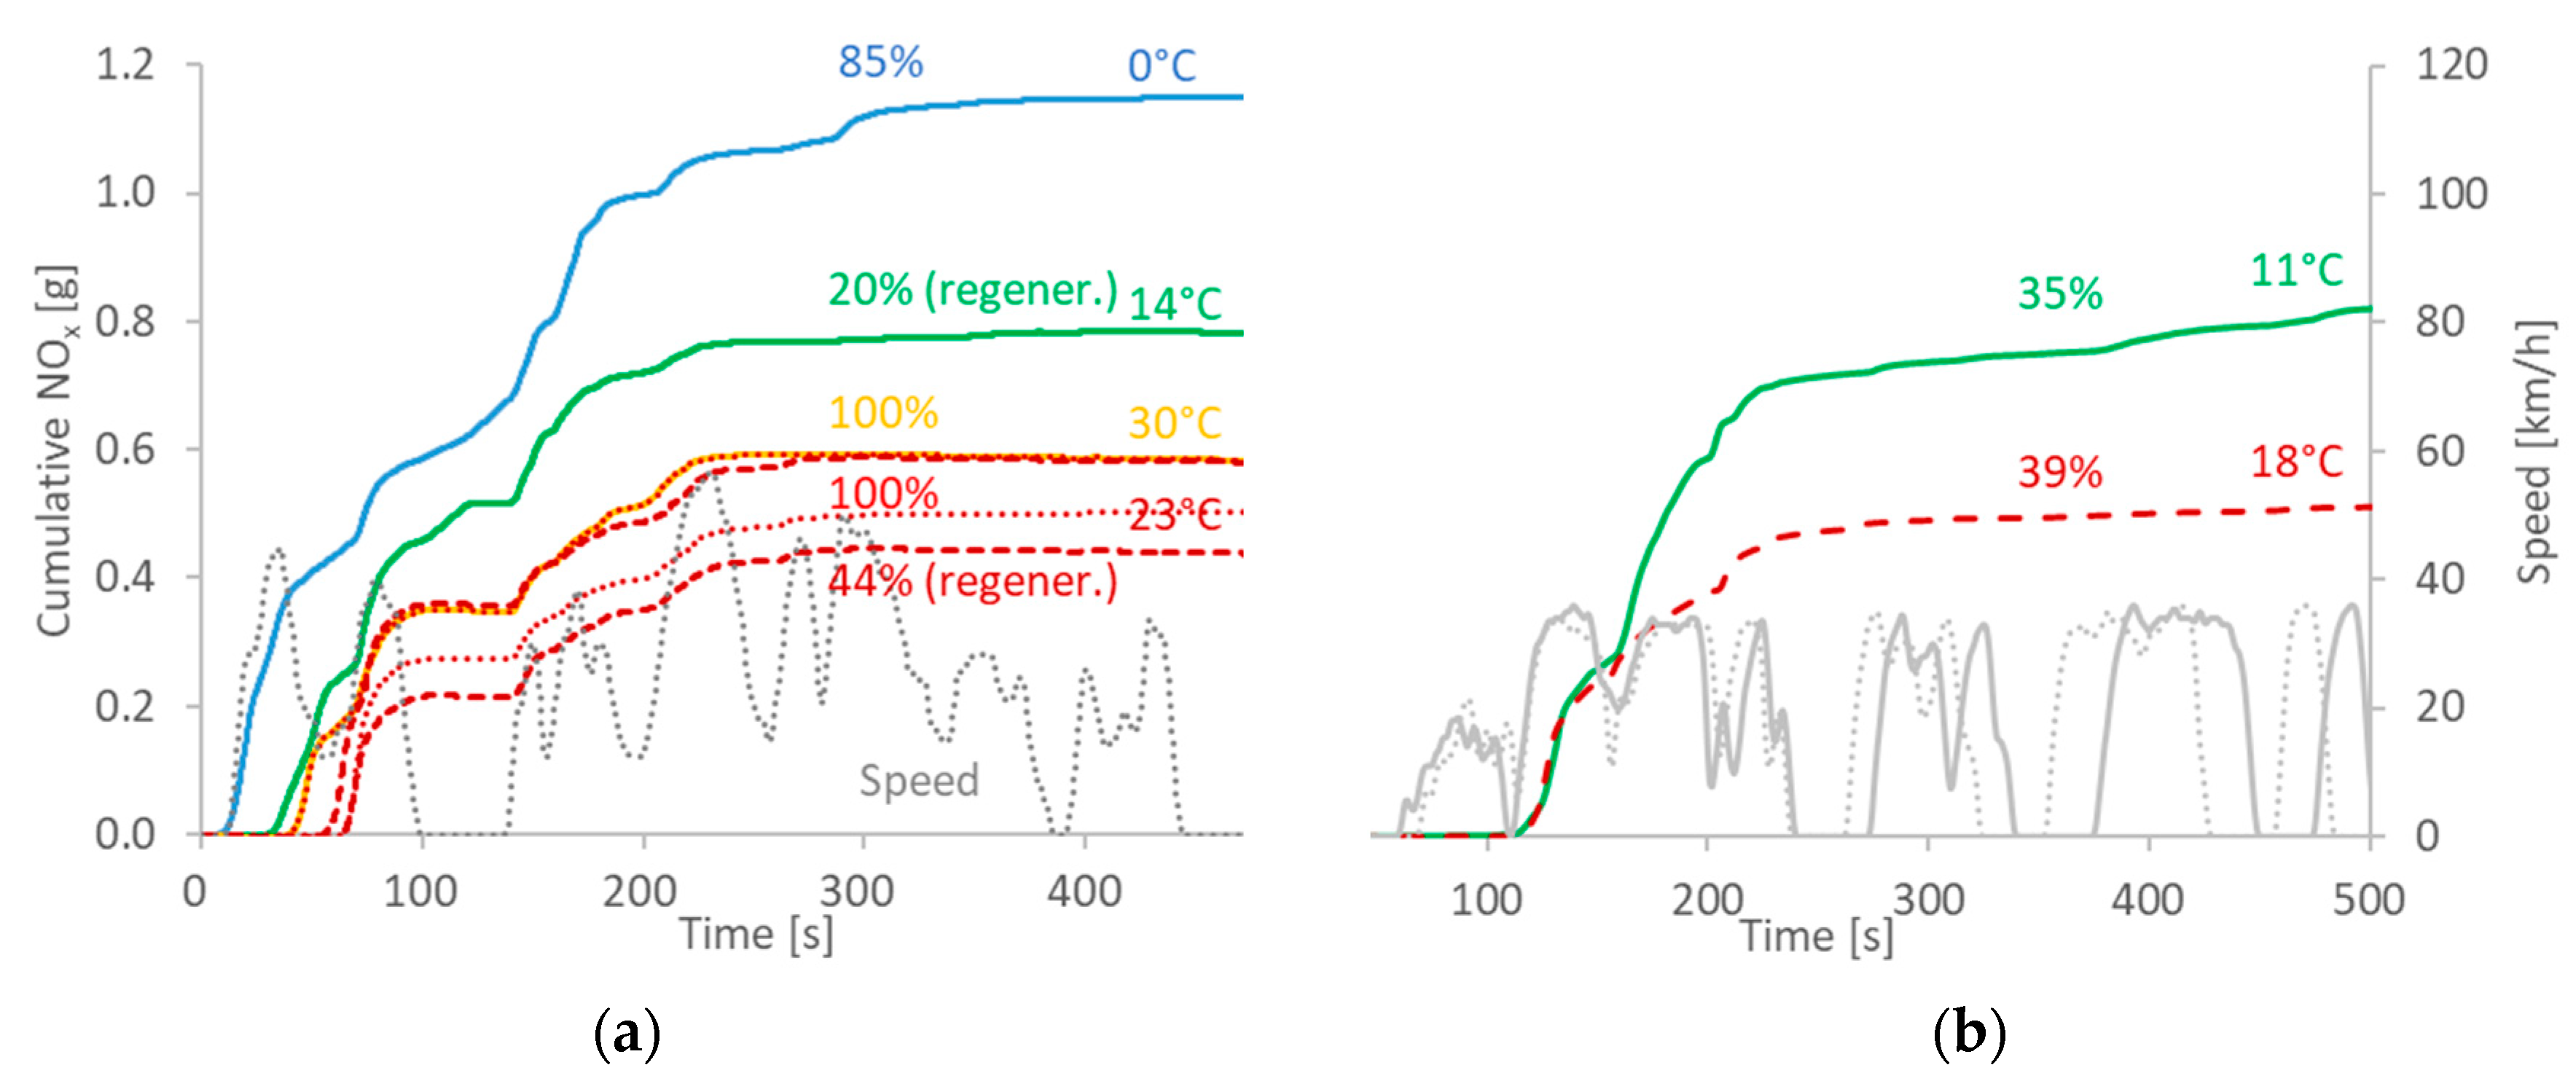
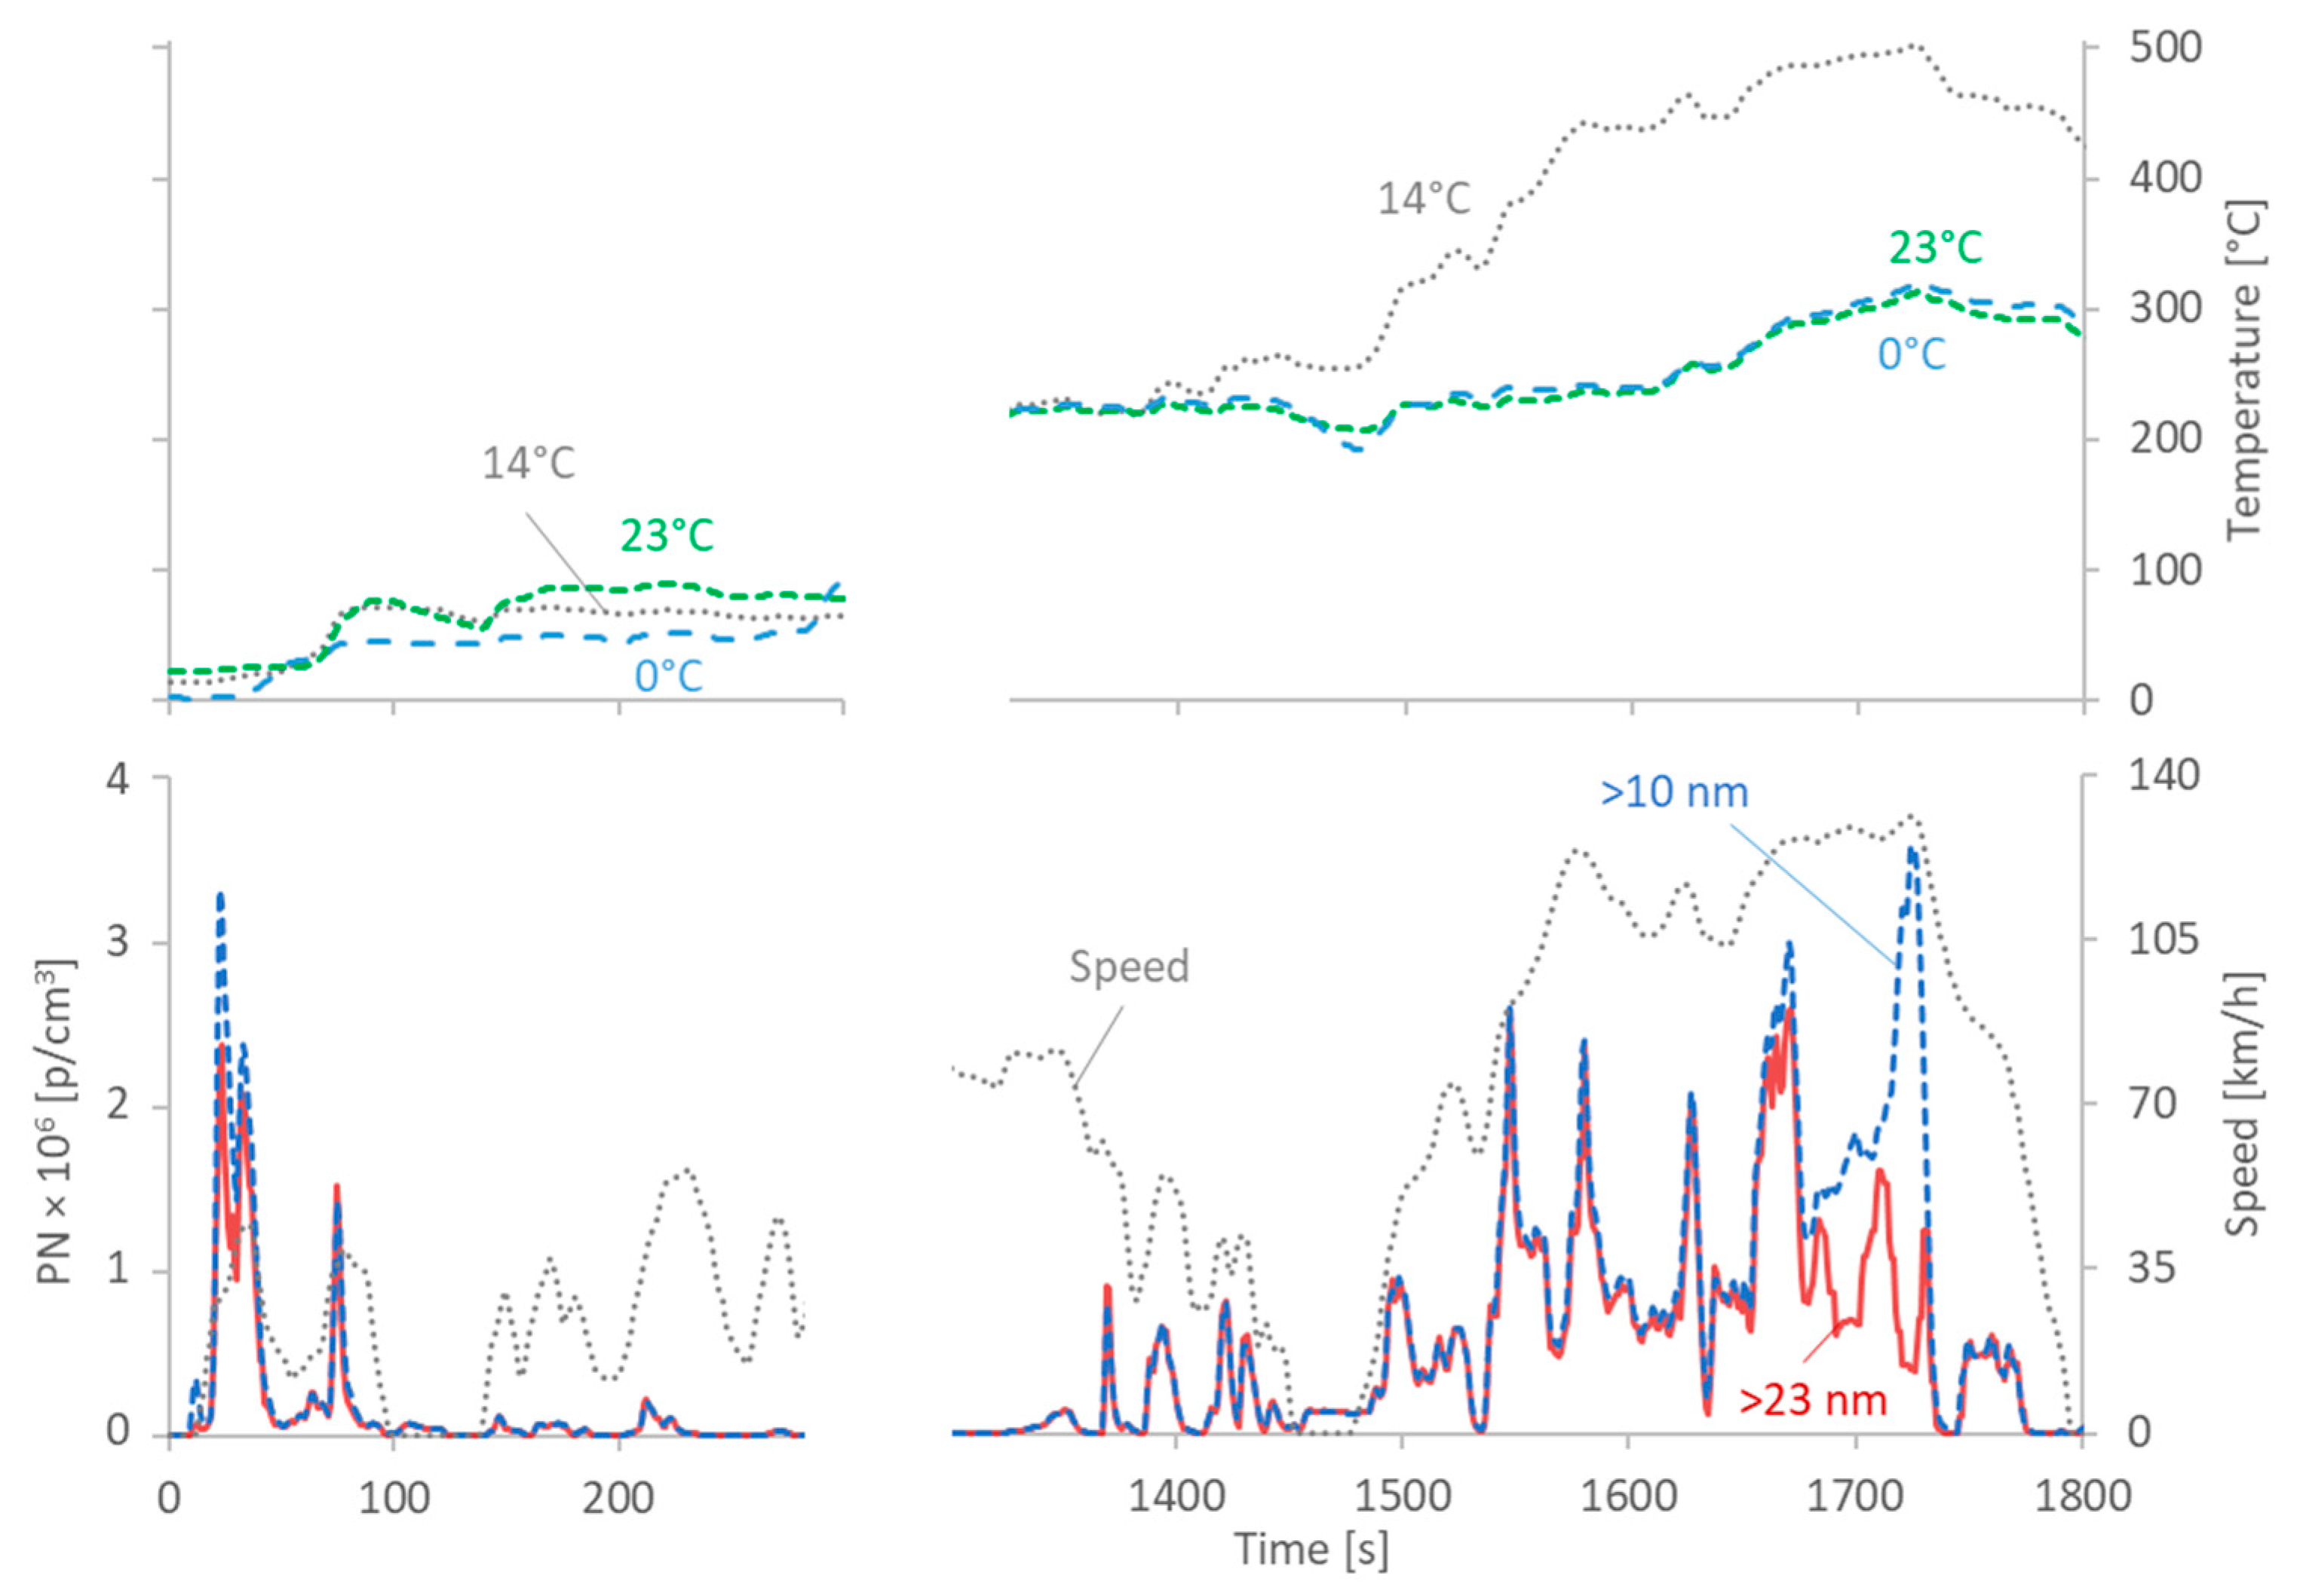
4.1. Cold Start
4.2. Regeneration
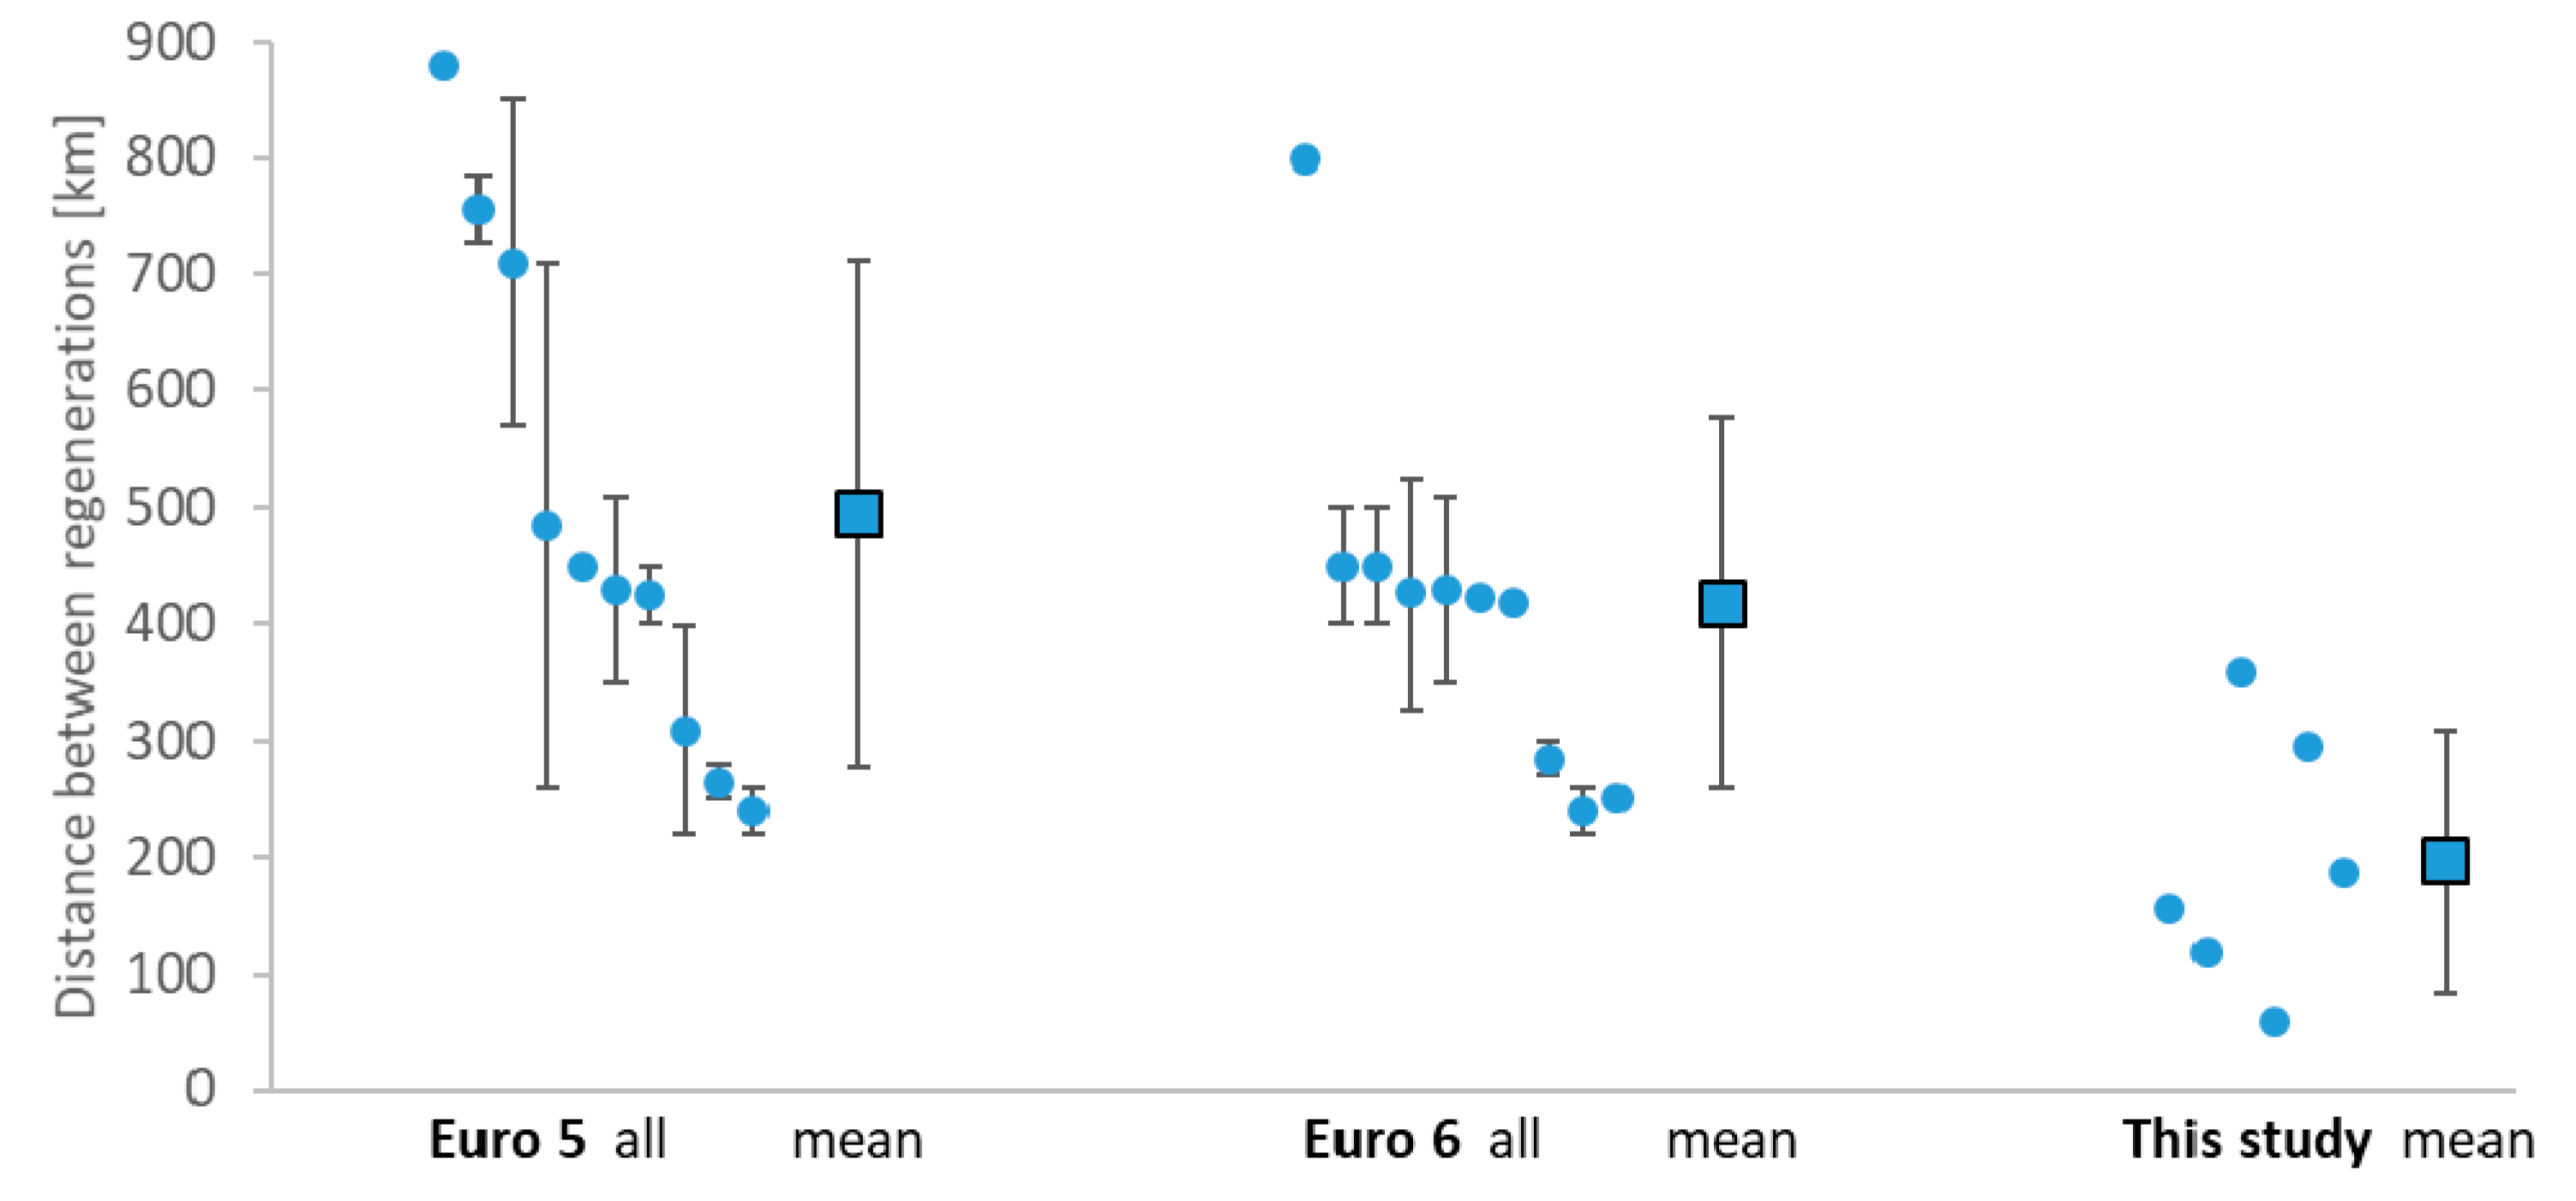
4.2.1. Regeneration Frequency
- Do the emissions exceed the limits and, if yes, how much?
- In which driving conditions do the regeneration events take place?
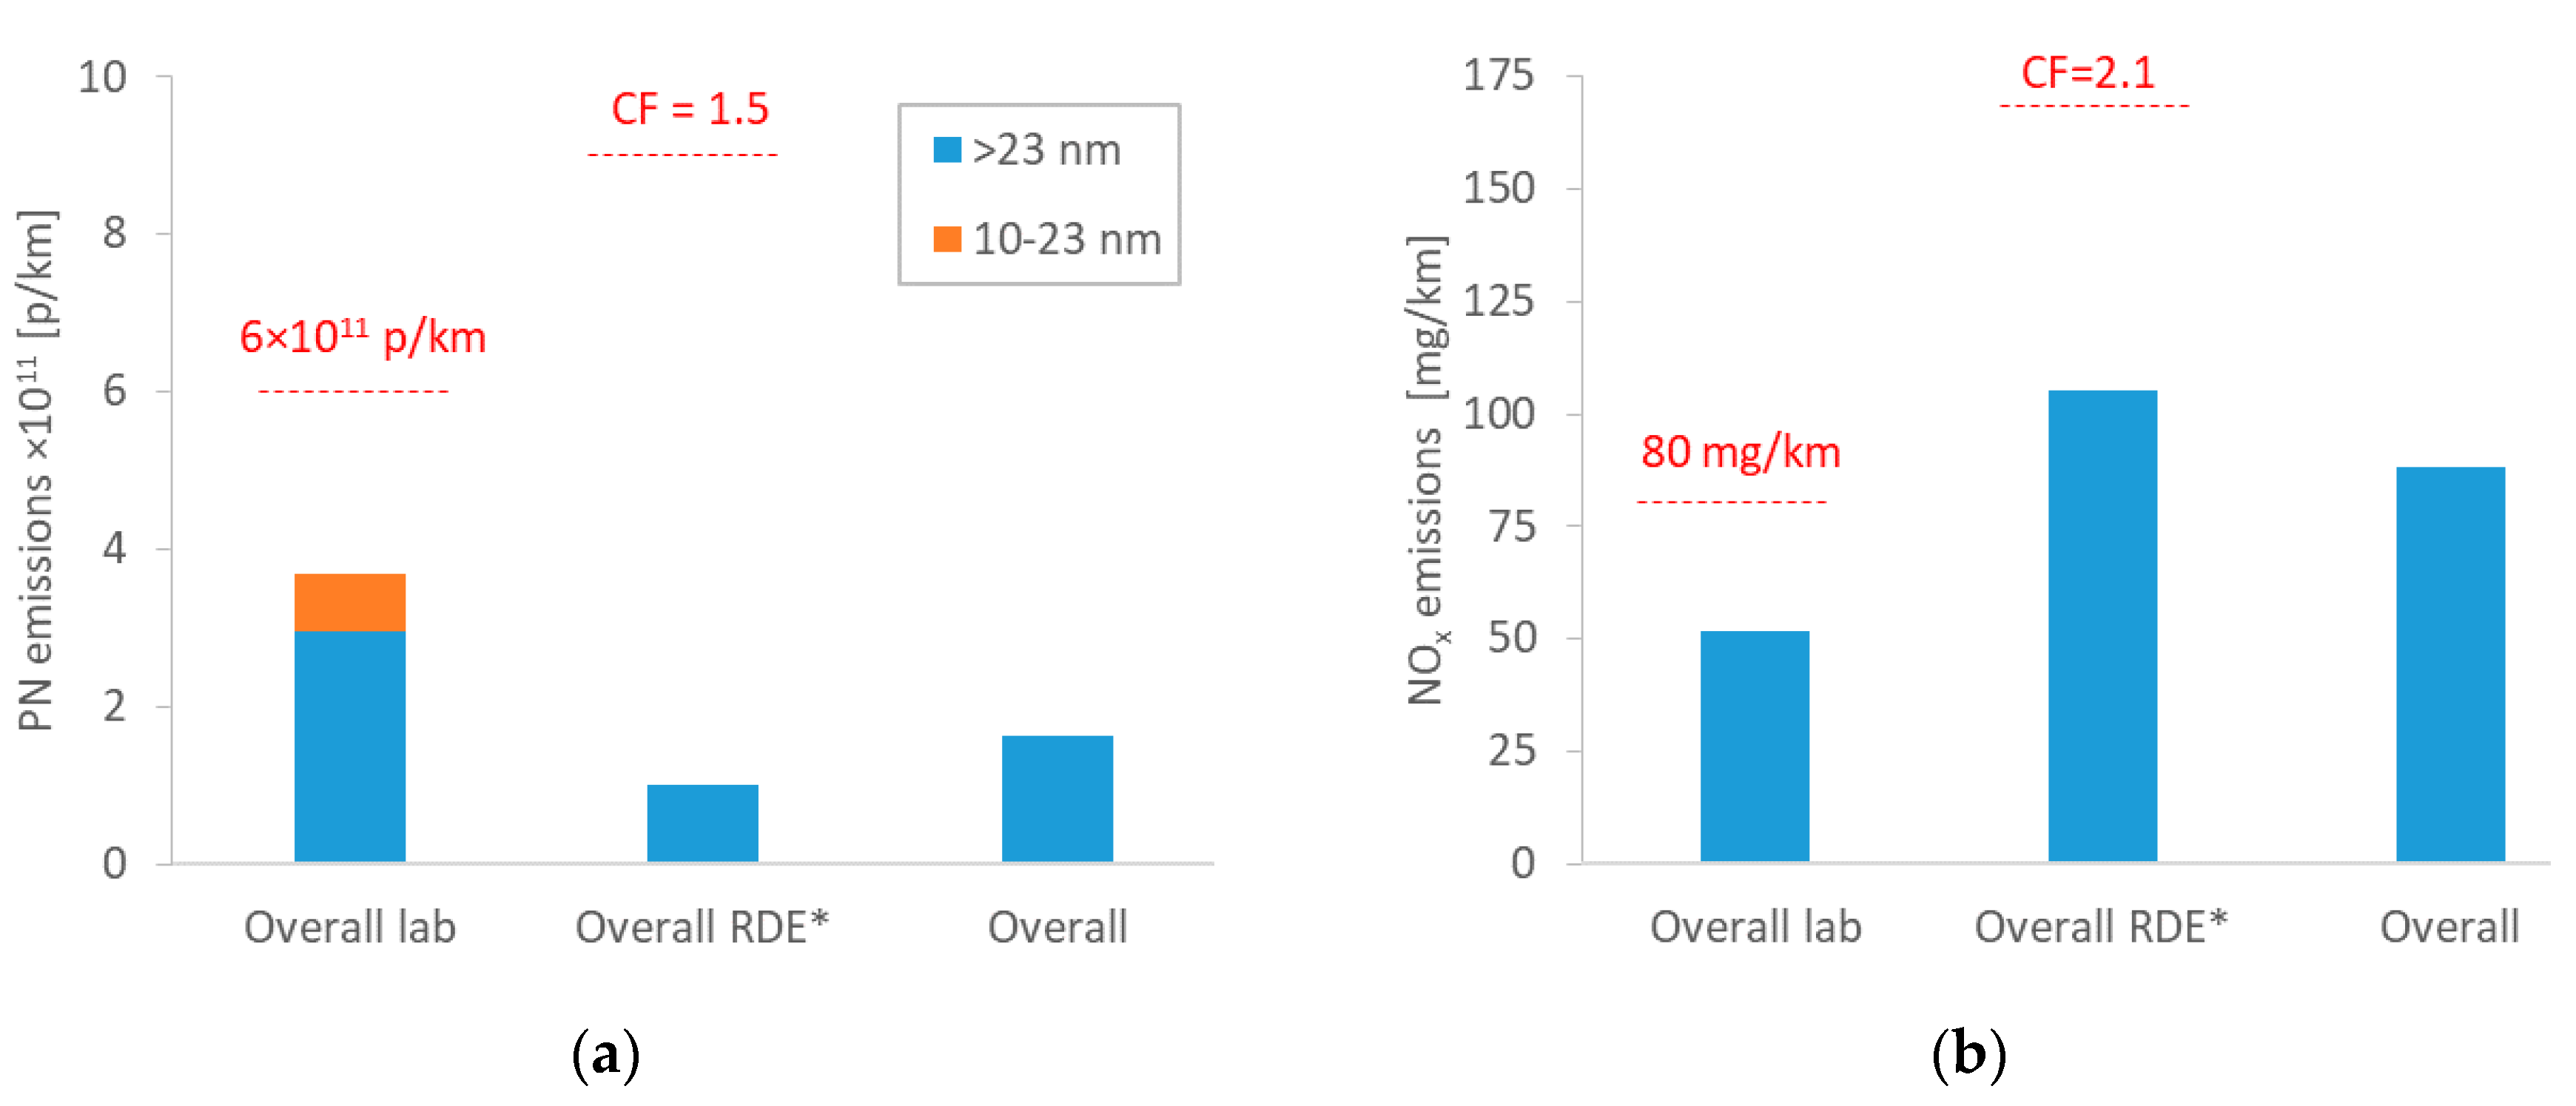
- Do the weighted emissions, including regeneration events, still respect the limits?
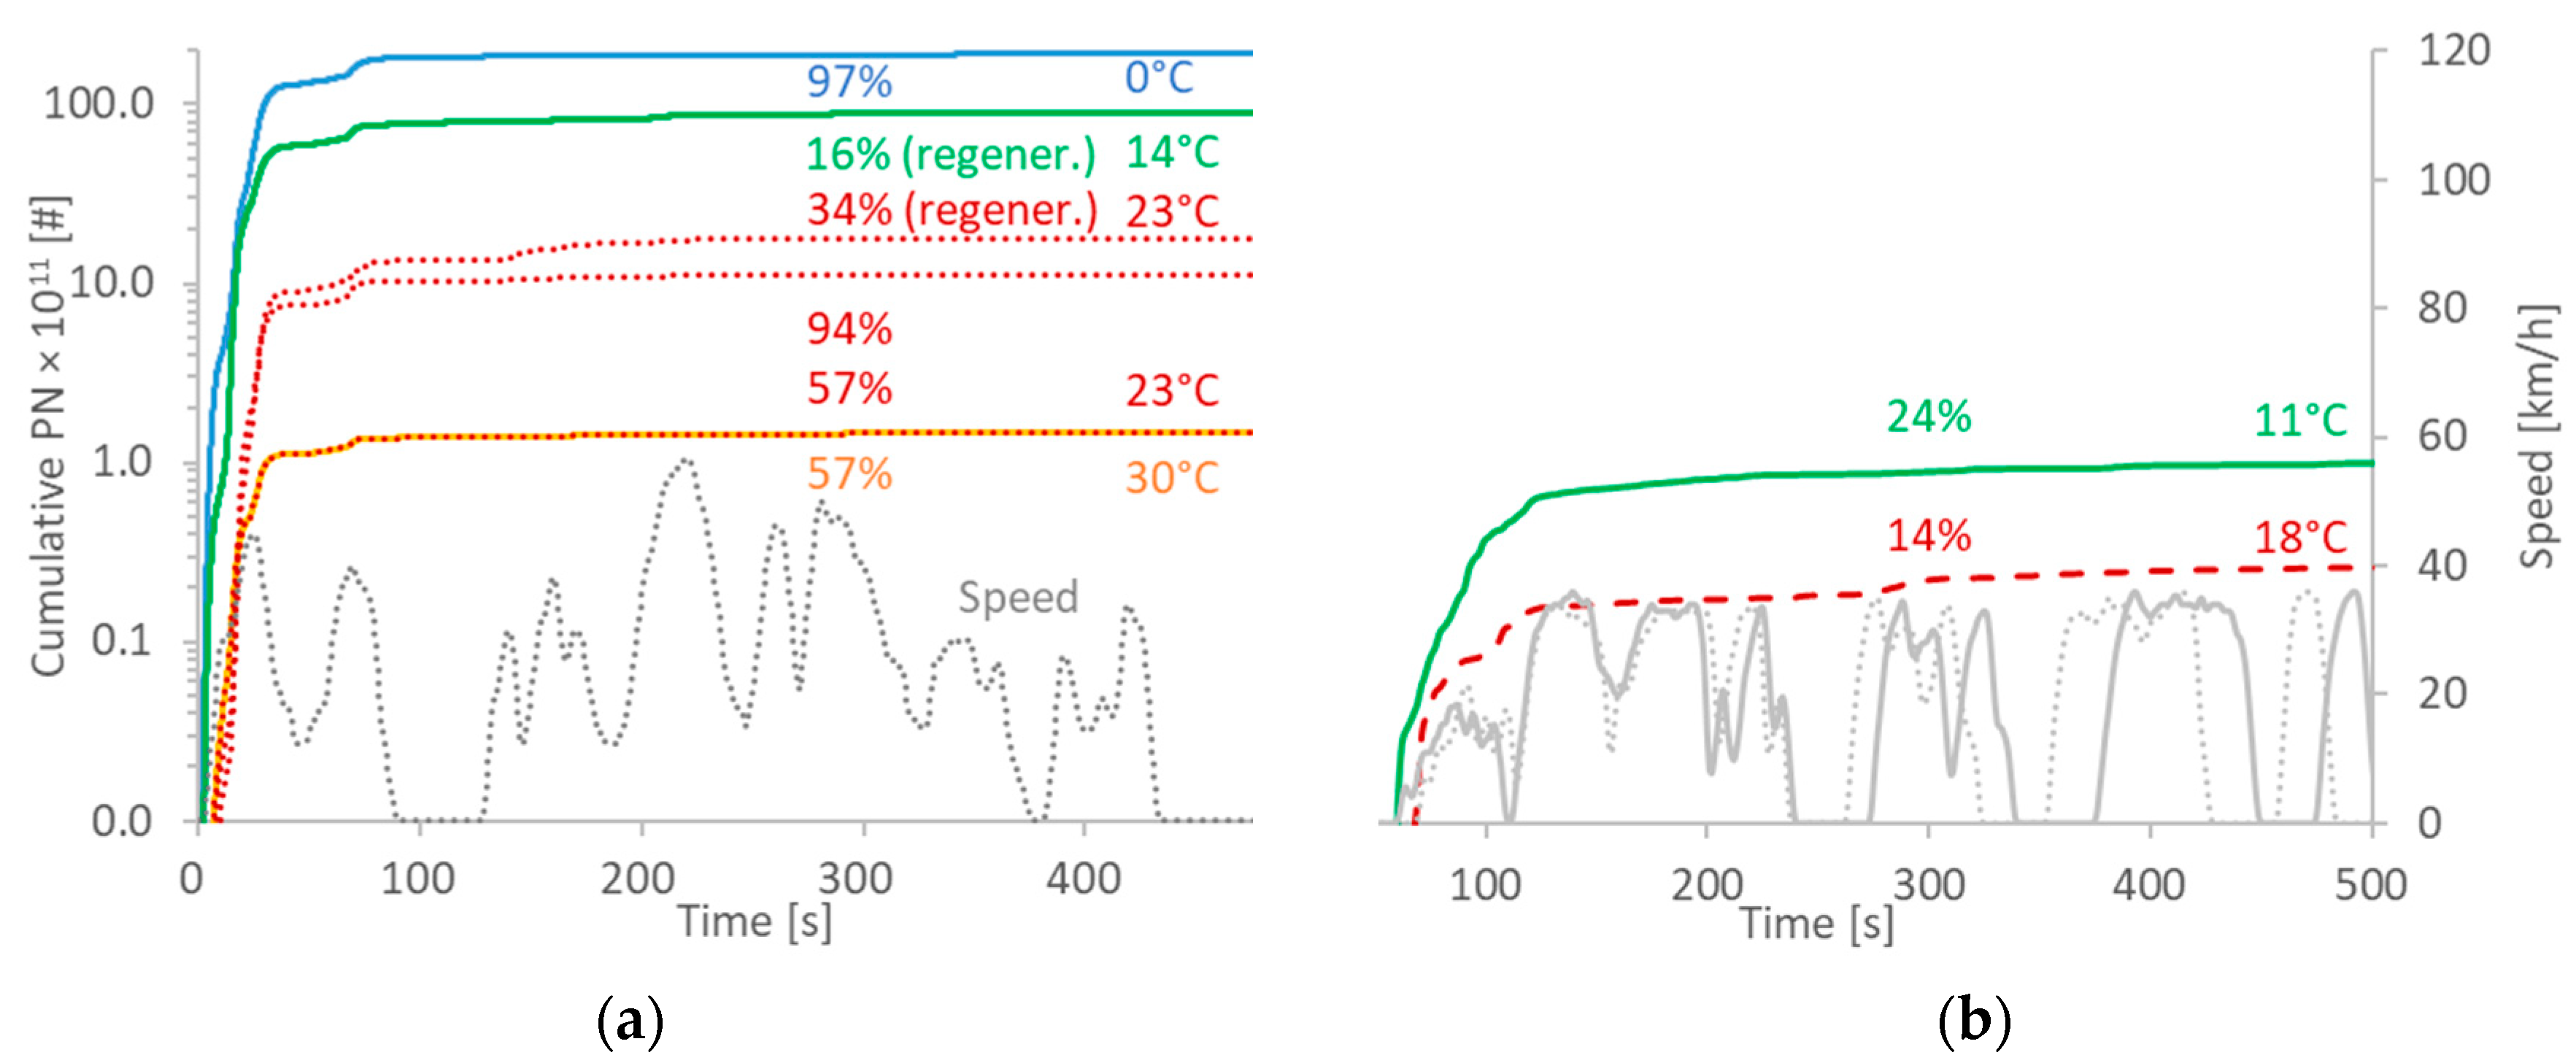
4.2.2. PN Instrumentation
4.2.3. Fuel Penalty
5. Conclusions
Author Contributions
Funding
Acknowledgments
Conflicts of Interest
Disclaimer
Appendix A


| WLTC | CO2 g/km | CO mg/km | NOx mg/km | CH4 mg/km | N2O mg/km | NH3 mg/km | HCHO mg/km | CH3CHO mg/km |
|---|---|---|---|---|---|---|---|---|
| 0 °C | 268.9 | 61.8 | 61.0 | 6.3 | 20.7 | 0.1 | 3.4 | 21.2 |
| 14 °C Reg | 274.5 | 41.2 | 134.0 | 12.8 | 13.7 | 1.0 | 1.8 | 19.1 |
| 23 °C | 242.3 | 10.4 | 24.6 | 5.4 | 11.4 | 0.1 | 0.3 | 18.7 |
| 23 °C Reg. | 247.3 | 12.5 | 40.9 | 12.4 | 12.4 | 0.9 | 0.6 | 19.1 |
| 30 °C | 240.7 | 4.8 | 24.9 | 5.6 | 9.1 | 0.2 | 0.4 | 21.7 |
References
- Ochoa-Hueso, R.; Munzi, S.; Alonso, R.; Arróniz-Crespo, M.; Avila, A.; Bermejo, V.; Bobbink, R.; Branquinho, C.; Concostrina-Zubiri, L.; Cruz, C.; et al. Ecological impacts of atmospheric pollution and interactions with climate change in terrestrial ecosystems of the Mediterranean Basin: Current research and future directions. Environ. Pollut. 2017, 227, 194–206. [Google Scholar] [CrossRef] [PubMed]
- Xie, Y.; Dai, H.; Dong, H.; Hanaoka, T.; Masui, T. Economic impacts from PM2.5 pollution-related health effects in China: A provincial-level analysis. Environ. Sci. Technol. 2016, 50, 4836–4843. [Google Scholar] [CrossRef] [PubMed]
- Brunekreef, B.; Holgate, S.T. Air pollution and health. Lancet 2002, 360, 1233–1242. [Google Scholar] [CrossRef]
- Guarnieri, M.; Balmes, J.R. Outdoor air pollution and asthma. Lancet 2014, 383, 1581–1592. [Google Scholar] [CrossRef]
- Hoek, G.; Krishnan, R.M.; Beelen, R.; Peters, A.; Ostro, B.; Brunekreef, B.; Kaufman, J.D. Long-term air pollution exposure and cardio-respiratory mortality: A review. Environ. Health 2013, 12, 43. [Google Scholar] [CrossRef]
- Bai, L.; Chen, H.; Hatzopoulou, M.; Jerrett, M.; Kwong, J.C.; Burnett, R.T.; van Donkelaar, A.; Copes, R.; Martin, R.V.; Van Ryswyk, K.; et al. Exposure to ambient ultrafine particles and nitrogen dioxide and incident hypertension and diabetes. Epidemiology 2018, 29, 323–332. [Google Scholar] [CrossRef]
- Loomis, D.; Grosse, Y.; Lauby-Secretan, B.; Ghissassi, F.E.; Bouvard, V.; Benbrahim-Tallaa, L.; Guha, N.; Baan, R.; Mattock, H.; Straif, K. The carcinogenicity of outdoor air pollution. Lancet Oncol. 2013, 14, 1262–1263. [Google Scholar] [CrossRef]
- Wu, X.; Nethery, R.C.; Sabath, B.M.; Braun, D.; Dominici, F. Exposure to air pollution and COVID-19 mortality in the United States: A nationwide cross-sectional study. Epidemiology 2020, 4. [Google Scholar] [CrossRef]
- Travaglio, M.; Yu, Y.; Popovic, R.; Leal, N.S.; Martins, L.M. Links between air pollution and COVID-19 in England. Toxicology 2020. [Google Scholar] [CrossRef]
- Conticini, E.; Frediani, B.; Caro, D. Can atmospheric pollution be considered a co-factor in extremely high level of SARS-CoV-2 lethality in Northern Italy? Environ. Pollut. 2020, 261, 114465. [Google Scholar] [CrossRef]
- Contini, D.; Costabile, F. Does air pollution influence COVID-19 outbreaks? Atmosphere 2020, 11, 377. [Google Scholar] [CrossRef]
- Mitsakou, C.; Dimitroulopoulou, S.; Heaviside, C.; Katsouyanni, K.; Samoli, E.; Rodopoulou, S.; Costa, C.; Almendra, R.; Santana, P.; Dell’Olmo, M.M.; et al. Environmental public health risks in European metropolitan areas within the EURO-HEALTHY project. Sci. Total Environ. 2019, 658, 1630–1639. [Google Scholar] [CrossRef] [PubMed]
- Samoli, E.; Stergiopoulou, A.; Santana, P.; Rodopoulou, S.; Mitsakou, C.; Dimitroulopoulou, C.; Bauwelinck, M.; de Hoogh, K.; Costa, C.; Marí-Dell’Olmo, M.; et al. Spatial variability in air pollution exposure in relation to socioeconomic indicators in nine European metropolitan areas: A study on environmental inequality. Environ. Pollut. 2019, 249, 345–353. [Google Scholar] [CrossRef] [PubMed]
- European Environment Agency. Air Quality in Europe: 2019 Report; European Environment Agency: Copenhagen, Denmark, 2019; ISBN 978-92-9480-088-6. [Google Scholar]
- Madrid Municipality Inventario de Emisiones de Contaminantes a la Atmósfera en el Municipio de Madrid 2017. Available online: https://www.madrid.es/UnidadesDescentralizadas/Sostenibilidad/EspeInf/EnergiayCC/04CambioClimatico/4aInventario/Ficheros/Inventario_emisiones_INV2017.pdf (accessed on 29 May 2020).
- AirParif Les Emissions en Quelques Chiffres. Available online: https://www.airparif.asso.fr/etat-air/air-et-climat-quelques-chiffres (accessed on 29 May 2020).
- London Datastore London Atmospheric Emissions (LAEI) 2016. Available online: https://data.london.gov.uk/dataset/london-atmospheric-emissions-inventory--laei--2016 (accessed on 29 May 2020).
- Zhang, R.; Zhang, Y.; Lin, H.; Feng, X.; Fu, T.-M.; Wang, Y. NOx emission reduction and recovery during COVID-19 in East China. Atmosphere 2020, 11, 433. [Google Scholar] [CrossRef]
- Tobías, A.; Carnerero, C.; Reche, C.; Massagué, J.; Via, M.; Minguillón, M.C.; Alastuey, A.; Querol, X. Changes in air quality during the lockdown in Barcelona (Spain) one month into the SARS-CoV-2 epidemic. Sci. Total Environ. 2020, 726, 138540. [Google Scholar] [CrossRef] [PubMed]
- Giechaskiel, B.; Clairotte, M.; Valverde-Morales, V.; Bonnel, P.; Kregar, Z.; Franco, V.; Dilara, P. Framework for the assessment of PEMS (portable emissions measurement systems) uncertainty. Environ. Res. 2018, 166, 251–260. [Google Scholar] [CrossRef]
- Eurostat Statistics Explained: Passenger Cars in EU. Available online: https://ec.europa.eu/eurostat/statistics-explained/images/1/11/SE_Passenger_cars_in_the_EU_update2019.xlsx (accessed on 29 May 2020).
- Weiss, M.; Bonnel, P.; Hummel, R.; Provenza, A.; Manfredi, U. On-road emissions of light-duty vehicles in Europe. Environ. Sci. Technol. 2011, 45, 8575–8581. [Google Scholar] [CrossRef]
- Valverde, V.; Mora, B.A.; Clairotte, M.; Pavlovic, J.; Suarez-Bertoa, R.; Giechaskiel, B.; Astorga-LLorens, C.; Fontaras, G. Emission factors derived from 13 Euro 6b light-duty vehicles based on laboratory and on-road measurements. Atmosphere 2019, 10, 243. [Google Scholar] [CrossRef]
- Clairotte, M.; Valverde, V.; Bonnel, P.; Giechaskiel, P.; Carriero, M.; Otura, M.; Fontaras, G.; Pavlovic, J.; Martini, G.; Krasenbrink, A. Joint Research Centre 2017 Light-Duty Vehicles Emissions Testing Contribution to the EU Market Surveillance: Testing Protocols and Vehicle Emissions Performance; Publications Office of the EU: Brussels, Belgium, 2018; ISBN 978-92-79-90600-8. [Google Scholar]
- Franco, V.; Posada, F.; German, J.; Mock, P. Real world exhaust emissions from modern diesel cars. Communications 2014, 49, 847129-102. [Google Scholar]
- Degraeuwe, B.; Weiss, M. Does the New European Driving Cycle (NEDC) really fail to capture the NOx emissions of diesel cars in Europe? Environ. Pollut. 2017, 222, 234–241. [Google Scholar] [CrossRef]
- Leach, F.C.P.; Peckham, M.S.; Hammond, M.J. Identifying NOx hotspots in transient urban driving of two diesel buses and a diesel car. Atmosphere 2020, 11, 355. [Google Scholar] [CrossRef]
- Ma, C.; Wu, L.; Mao, H.; Fang, X.; Wei, N.; Zhang, J.; Yang, Z.; Zhang, Y.; Lv, Z.; Yang, L. Transient characterization of automotive exhaust emission from different vehicle types based on on-road measurements. Atmosphere 2020, 11, 64. [Google Scholar] [CrossRef]
- Giechaskiel, B.; Suarez-Bertoa, R.; Lahde, T.; Clairotte, M.; Carriero, M.; Bonnel, P.; Maggiore, M. Emissions of a Euro 6b diesel passenger car retrofitted with a solid ammonia reduction system. Atmosphere 2019, 10, 180. [Google Scholar] [CrossRef]
- Guan, B.; Zhan, R.; Lin, H.; Huang, Z. Review of state of the art technologies of selective catalytic reduction of NOx from diesel engine exhaust. Appl. Therm. Eng. 2014, 66, 395–414. [Google Scholar] [CrossRef]
- Giechaskiel, B.; Mamakos, A.; Andersson, J.; Dilara, P.; Martini, G.; Schindler, W.; Bergmann, A. Measurement of automotive nonvolatile particle number emissions within the European legislative framework: A review. Aerosol Sci. Technol. 2012, 46, 719–749. [Google Scholar] [CrossRef]
- Burtscher, H. Physical characterization of particulate emissions from diesel engines: A review. J. Aerosol Sci. 2005, 36, 896–932. [Google Scholar] [CrossRef]
- Demuynck, J.; Favre, C.; Bosteels, D.; Bunar, F.; Spitta, J.; Kuhrt, A. Diesel Vehicle with Ultra-Low NOx Emissions on the Road; No. 2019-24-0145; SAE: Warrendale, PA, USA, 2019. [Google Scholar]
- Simonen, P.; Kalliokoski, J.; Karjalainen, P.; Rönkkö, T.; Timonen, H.; Saarikoski, S.; Aurela, M.; Bloss, M.; Triantafyllopoulos, G.; Kontses, A.; et al. Characterization of laboratory and real driving emissions of individual Euro 6 light-duty vehicles–Fresh particles and secondary aerosol formation. Environ. Pollut. 2019, 255, 113175. [Google Scholar] [CrossRef] [PubMed]
- Williams, R.; Andersson, J.; Hamje, H.; Ziman, P.; Kar, K.; Fittavolini, C.; Pellegrini, L.; Gunther, G.; Oliva, F.; Van de Heijning, P. Impact of Demanding Low Temperature Urban Operation on the Real Driving Emissions Performance of Three European Diesel Passenger Cars; No. 2018-01–1819; SAE: Warrendale, PA, USA, 2018. [Google Scholar]
- Suarez-Bertoa, R.; Valverde-Morales, V.; Clairotte, M.; Pavlovic, J.; Giechaskiel, B.; Franco, V.; Kregar, Z.; Astorga-LLorens, C. On-road emissions of passenger cars beyond the boundary conditions of the real-driving emissions test. Environ. Res. 2019, 108572. [Google Scholar] [CrossRef]
- Leblanc, M.; Noel, L.; R’Mili, B.; Boréave, A.; D’Anna, B.; Raux, S. Impact of engine warm-up and DPF active regeneration on regulated & unregulated emissions of a Euro 6 Diesel SCR equipped vehicle. J. Earth Sci. Geotechnol. Eng. 2016, 6, 29–50. [Google Scholar]
- Transport & Environment. New Diesels, New Problems. Report 2020. Available online: https://www.transportenvironment.org/publications/new-diesels-new-problems (accessed on 17 June 2020).
- Giechaskiel, B.; Munoz-Bueno, R.; Rubino, L.; Manfredi, U.; Dilara, P.; De Santi, G.; Andersson, J. Particle Measurement Programme (PMP): Particle Size and Number Emissions before, during and after Regeneration Events of a Euro 4 DPF Equipped Light-Duty Diesel Vehicle; No. 2007-01–1944; SAE: Warrendale, PA, USA, 2007. [Google Scholar]
- Giechaskiel, B.; Lähde, T.; Suarez-Bertoa, R.; Clairotte, M.; Grigoratos, T.; Zardini, A.; Perujo, A.; Martini, G. Particle number measurements in the European legislation and future JRC activities. Combust. Engines 2018, 174, 3–16. [Google Scholar] [CrossRef]
- Giechaskiel, B. Particle number emissions of a diesel vehicle during and between regeneration events. Catalysts 2020, 10, 587. [Google Scholar] [CrossRef]
- Erisman, J.W.; Schaap, M. The need for ammonia abatement with respect to secondary PM reductions in Europe. Environ. Pollut. 2004, 129, 159–163. [Google Scholar] [CrossRef]
- Stocker, T. Climate Change 2013: The Physical Science Basis: Working Group I Contribution to the Fifth Assessment Report of the Intergovernmental Panel on Climate Change; Cambridge University Press: New York, NY, USA, 2014; ISBN 978-1-107-05799-9. [Google Scholar]
- Kim, M.J. Sensitivity of nitrate aerosol production to vehicular emissions in an urban street. Atmosphere 2019, 10, 212. [Google Scholar] [CrossRef]
- Valverde, V.; Clairotte, M.; Bonnel, P.; Giechaskiel, P.; Carriero, M.; Otura, M.; Gruening, C.; Fontaras, G.; Pavlovic, J.; Martini, G.; et al. Joint Research Centre 2018 Light-Duty Vehicles Emissions Testing: Contribution to the EU Market Surveillance: Testing Protocols and Vehicle Emissions Performance; Publications Office of the European Union: Brussels, Belgium, 2019; ISBN 978-92-76-12333-0. [Google Scholar]
- Suarez-Bertoa, R.; Pechout, M.; Vojtíšek, M.; Astorga, C. Regulated and non-regulated emissions from Euro 6 diesel, gasoline and CNG vehicles under real-world driving conditions. Atmosphere 2020, 11, 204. [Google Scholar] [CrossRef]
- Giechaskiel, B.; Cresnoverh, M.; Jörgl, H.; Bergmann, A. Calibration and accuracy of a particle number measurement system. Meas. Sci. Technol. 2010, 21, 045102. [Google Scholar] [CrossRef]
- Giechaskiel, B.; Bonnel, P.; Perujo, A.; Dilara, P. Solid particle number (SPN) portable emissions measurement systems (PEMS) in the European legislation: A review. IJERPH 2019, 16, 4819. [Google Scholar] [CrossRef] [PubMed]
- AVL CONCERTO: Lab Data Intelligence with AVL CONCERTO. Available online: https://www.avl.com/-/avl-concerto-5- (accessed on 29 May 2020).
- JRC EMROAD. Available online: https://circabc.europa.eu/sd/a/efc8a97c-5281-4483-9b93-da79cd197f14/EMROAD_6_03.zip (accessed on 29 May 2020).
- Varella, R.; Giechaskiel, B.; Sousa, L.; Duarte, G. Comparison of Portable Emissions Measurement Systems (PEMS) with Laboratory Grade Equipment. Appl. Sci. 2018, 8, 1633. [Google Scholar] [CrossRef]
- Giechaskiel, B.; Casadei, S.; Mazzini, M.; Sammarco, M.; Montabone, G.; Tonelli, R.; Deana, M.; Costi, G.; Di Tanno, F.; Prati, M.; et al. Inter-laboratory correlation exercise with portable emissions measurement systems (PEMS) on chassis dynamometers. Appl. Sci. 2018, 8, 2275. [Google Scholar] [CrossRef]
- European Commission Commission Regulation (EU) 2018/1832 2018. Available online: https://eur-lex.europa.eu/legal-content/EN/TXT/PDF/?uri=CELEX:32018R1832&from=FR (accessed on 28 May 2020).
- Kwon, S.; Park, Y.; Park, J.; Kim, J.; Choi, K.-H.; Cha, J.-S. Characteristics of on-road NOx emissions from Euro 6 light-duty diesel vehicles using a portable emissions measurement system. Sci. Total Environ. 2017, 576, 70–77. [Google Scholar] [CrossRef]
- O’Driscoll, R.; Stettler, M.E.J.; Molden, N.; Oxley, T.; ApSimon, H.M. Real world CO2 and NOx emissions from 149 Euro 5 and 6 diesel, gasoline and hybrid passenger cars. Sci. Total Environ. 2018, 621, 282–290. [Google Scholar] [CrossRef]
- Triantafyllopoulos, G.; Dimaratos, A.; Ntziachristos, L.; Bernard, Y.; Dornoff, J.; Samaras, Z. A study on the CO2 and NOx emissions performance of Euro 6 diesel vehicles under various chassis dynamometer and on-road conditions including latest regulatory provisions. Sci. Total Environ. 2019, 666, 337–346. [Google Scholar] [CrossRef] [PubMed]
- Ko, J.; Myung, C.-L.; Park, S. Impacts of ambient temperature, DPF regeneration, and traffic congestion on NOx emissions from a Euro 6-compliant diesel vehicle equipped with an LNT under real-world driving conditions. Atmos. Environ. 2019, 200, 1–14. [Google Scholar] [CrossRef]
- Vojtíšek-Lom, M.; Beránek, V.; Klír, V.; Jindra, P.; Pechout, M.; Voříšek, T. On-road and laboratory emissions of NO, NO2, NH3, N2O and CH4 from late-model EU light utility vehicles: Comparison of diesel and CNG. Sci. Total Environ. 2018, 616, 774–784. [Google Scholar] [CrossRef]
- Olsen, D.B.; Kohls, M.; Arney, G. Impact of oxidation catalysts on exhaust NO2/NOx ratio from lean-burn natural gas engines. J. Air Waste Manag. Assoc. 2010, 60, 867–874. [Google Scholar] [CrossRef] [PubMed]
- Li, H.; Ropkins, K.; Andrews, G.E.; Daham, B.; Bell, M.; Tate, J.; Hawley, G. Evaluation of a FTIR Emission Measurement System for Legislated Emissions Using a SI Car; No. 2006-01–3368; SAE: Warrendale, PA, USA, 2006. [Google Scholar]
- Leach, F.; Davy, M.; Peckham, M. Cyclic NO2:NOx ratio from a diesel engine undergoing transient load steps. Int. J. Engine Res. 2019, 146808741983320. [Google Scholar] [CrossRef]
- O’Driscoll, R.; ApSimon, H.M.; Oxley, T.; Molden, N.; Stettler, M.E.J.; Thiyagarajah, A. A portable emissions measurement system (PEMS) study of NOx and primary NO2 emissions from Euro 6 diesel passenger cars and comparison with COPERT emission factors. Atmos. Environ. 2016, 145, 81–91. [Google Scholar] [CrossRef]
- Suarez-Bertoa, R.; Mendoza-Villafuerte, P.; Riccobono, F.; Vojtisek, M.; Pechout, M.; Perujo, A.; Astorga, C. On-road measurement of NH3 emissions from gasoline and diesel passenger cars during real world driving conditions. Atmos. Environ. 2017, 166, 488–497. [Google Scholar] [CrossRef]
- Suarez-Bertoa, R.; Astorga, C. Isocyanic acid and ammonia in vehicle emissions. Transp. Res. Part D Transp. Environ. 2016, 49, 259–270. [Google Scholar] [CrossRef]
- Suarez-Bertoa, R.; Kousoulidou, M.; Clairotte, M.; Giechaskiel, B.; Nuottimäki, J.; Sarjovaara, T.; Lonza, L. Impact of HVO blends on modern diesel passenger cars emissions during real world operation. Fuel 2019, 235, 1427–1435. [Google Scholar] [CrossRef]
- Pechout, M.; Kotek, M.; Jindra, P.; Macoun, D.; Hart, J.; Vojtisek-Lom, M. Comparison of hydrogenated vegetable oil and biodiesel effects on combustion, unregulated and regulated gaseous pollutants and DPF regeneration procedure in a Euro6 car. Sci. Total Environ. 2019, 696, 133748. [Google Scholar] [CrossRef]
- Bielaczyc, P.; Szczotka, A.; Woodburn, J. An overview of cold start emissions from direct injection spark-ignition and compression ignition engines of light duty vehicles at low ambient temperatures. Combust. Engines 2013, 154, 96–103. [Google Scholar]
- Gao, J.; Tian, G.; Sorniotti, A.; Karci, A.E.; Di Palo, R. Review of thermal management of catalytic converters to decrease engine emissions during cold start and warm up. Appl. Therm. Eng. 2019, 147, 177–187. [Google Scholar] [CrossRef]
- Badshah, H.; Khalek, I.A. Solid particle emissions from vehicle exhaust during engine start-up. SAE Int. J. Engines 2015, 8. [Google Scholar] [CrossRef]
- Mamakos, A.; Martini, G.; Manfredi, U. Assessment of the legislated particle number measurement procedure for a Euro 5 and a Euro 6 compliant diesel passenger cars under regulated and unregulated conditions. J. Aerosol Sci. 2013, 55, 31–47. [Google Scholar] [CrossRef]
- Giechaskiel, B.; Riccobono, F.; Vlachos, T.; Mendoza-Villafuerte, P.; Suarez-Bertoa, R.; Fontaras, G.; Bonnel, P.; Weiss, M. Vehicle emission factors of solid nanoparticles in the laboratory and on the road using portable emission measurement systems (PEMS). Front. Environ. Sci. 2015, 3. [Google Scholar] [CrossRef]
- Zinola, S.; Raux, S.; Leblanc, M. Persistent Particle Number Emissions Sources at the Tailpipe of Combustion Engines; No. 2016-01–2283; SAE: Warrendale, PA, USA, 2016. [Google Scholar]
- Beatrice, C.; Costagliola, M.A.; Guido, C.; Napolitano, P.; Prati, M.V. How Much Regeneration Events Influence Particle Emissions of DPF-Equipped Vehicles; No. 2017-24–0144; SAE: Warrendale, PA, USA, 2017. [Google Scholar]
- Rose, K.; Hamje, H.; Jansen, L.; Fittavolini, C.; Clark, R.; Cardenas Almena, M.D.; Katsaounis, D.; Samaras, C.; Geivanidis, S.; Samaras, Z. Impact of FAME Content on the Regeneration Frequency of diesel particulate filters (DPFs). SAE Int. J. Fuels Lubr. 2014, 7, 563–570. [Google Scholar] [CrossRef][Green Version]
- Chappell, E.; Burke, R.; Lu, P.; Gee, M.; Williams, R. Analysis of a diesel passenger car behavior on-road and over certification duty cycles. SAE Int. J. Engines 2016, 9, 2201–2214. [Google Scholar] [CrossRef]
- Pajdowski, P.; Puchałka, B. The process of diesel particulate filter regeneration under real driving conditions. IOP Conf. Ser.: Earth Environ. Sci. 2019, 214, 012114. [Google Scholar] [CrossRef]
- Thompson, G.J.; Carder, D.K.; Besch, M.C.; Thiruvengadam, A.; Kappanna, H.K. In-Use Emissions Testing of Light-Duty Diesel Vehicles in the United States; SAE: Warrendale, PA, USA, 2014. [Google Scholar]
- Viswanathan, S.; George, S.; Govindareddy, M.; Heibel, A. Advanced Diesel Particulate Filter Technologies for Next Generation Exhaust Aftertreatment Systems; No. 2020-01–1434; SAE: Warrendale, PA, USA, 2020. [Google Scholar]
- Cumaranatunge, L.; Chiffey, A.; Stetina, J.; McGonigle, K.; Repley, G.; Lee, A.; Chatterjee, S. A study of the soot combustion efficiency of an SCRF® catalyst vs. a CSF during active regeneration. Emiss. Control Sci. Technol. 2017, 3, 93–104. [Google Scholar] [CrossRef]
- Otsuki, Y.; Tochino, S.; Kondo, K.; Haruta, K. Portable Emissions Measurement System for Solid Particle Number Including Nanoparticles Smaller than 23 nm; No. 2017-01–2402; SAE: Warrendale, PA, USA, 2017. [Google Scholar]
- Filippo, A.D.; Maricq, M.M. Diesel nucleation mode particles: Semivolatile or solid? Environ. Sci. Technol. 2008, 42, 7957–7962. [Google Scholar] [CrossRef]
- Giechaskiel, B.; Lähde, T.; Gandi, S.; Keller, S.; Kreutziger, P.; Mamakos, A. Assessment of 10-nm particle number (PN) portable emissions measurement systems (PEMS) for future regulations. IJERPH 2020, 17, 3878. [Google Scholar] [CrossRef] [PubMed]
- Yamada, H.; Inomata, S.; Tanimoto, H. Mechanisms of increased particle and VOC emissions during DPF active regeneration and practical emissions considering regeneration. Environ. Sci. Technol. 2017, 51, 2914–2923. [Google Scholar] [CrossRef] [PubMed]
- Giechaskiel, B.; Manfredi, U.; Martini, G. Engine exhaust solid sub-23 nm particles: I. literature survey. SAE Int. J. Fuels Lubr. 2014, 7, 950–964. [Google Scholar] [CrossRef]
- Giechaskiel, B. Differences between tailpipe and dilution tunnel sub-23 nm nonvolatile (solid) particle number measurements. Aerosol Sci. Technol. 2019, 53, 1012–1022. [Google Scholar] [CrossRef]
- Giechaskiel, B.; Mamakos, A.; Woodburn, J.; Szczotka, A.; Bielaczyc, P. Evaluation of a 10 nm particle number portable emissions measurement system (PEMS). Sensors 2019, 19, 5531. [Google Scholar] [CrossRef] [PubMed]
- Giechaskiel, B. Effect of sampling conditions on the sub-23 nm nonvolatile particle emissions measurements of a moped. Appl. Sci. 2019, 9, 3112. [Google Scholar] [CrossRef]
- Yang, J.; Pham, L.; Johnson, K.C.; Durbin, T.D.; Karavalakis, G.; Kittelson, D.; Jung, H. Impacts of exhaust transfer system contamination on particulate matter measurements. Emiss. Control Sci. Technol. 2020. [Google Scholar] [CrossRef]


| Vehicle Category | M1 |
|---|---|
| Propulsion type | Internal combustion engine |
| Cylinder number and arrangement | 4 in line |
| Combustion type | Compression ignition |
| Fuel type | Diesel |
| Injection type | Direct injection |
| Aspiration type | Turbocharger |
| Emissions control technologies | EGR+DOC+SCR+DPF |
| Engine displacement (L) | 2.1 |
| Engine power (hp) | 200 |
| Transmission/Gearbox | Automatic/8 |
| Mass in running order (kg) | 2000 |
| Declared CO2 (WLTP) (g/km) | 249 |
| EU emission standard | Euro 6d-temp |
| Registration date | 05/2018 |
| Mileage (km) | 3000 |
| RDE-1 | RDE-2 | RDE-1-D | RDE-2-D | Traffic | Motor-City | Motorway | |
|---|---|---|---|---|---|---|---|
| Distance [km] | 91 | 98 | 91 | 98 | 18 | 129 | 174 |
| Duration [min] | 101 | 104 | 96 | 101 | 53 | 121 | 100 |
| Mean Tamb [°C] | 16 | 9 | 18 | 15 | 8 | 13 | 7 |
| Urban stop time [%] | 20 | 21 | 18 | 20 | 32 | 16 | 22 |
| Urban dist. [km] | 34 | 33 | 34 | 31 | 18 | 34 | 11 |
| Rural dist. [km] | 28 | 31 | 28 | 33 | - | 12 | 11 |
| Motorway dist. [km] | 28 | 35 | 30 | 35 | - | 83 | 151 |
| Mean speed [km/h] | 53.5 | 57 | 57 | 59 | 20.5 | 64 | 104 |
| CPEG [m/100km] | 600 | 740 | 600 | 740 | 990 | 460 | 430 |
| Max altitude [m] | 300 | 410 | 300 | 410 | 255 | 300 | 330 |
© 2020 by the authors. Licensee MDPI, Basel, Switzerland. This article is an open access article distributed under the terms and conditions of the Creative Commons Attribution (CC BY) license (http://creativecommons.org/licenses/by/4.0/).
Share and Cite
Valverde, V.; Giechaskiel, B. Assessment of Gaseous and Particulate Emissions of a Euro 6d-Temp Diesel Vehicle Driven >1300 km Including Six Diesel Particulate Filter Regenerations. Atmosphere 2020, 11, 645. https://doi.org/10.3390/atmos11060645
Valverde V, Giechaskiel B. Assessment of Gaseous and Particulate Emissions of a Euro 6d-Temp Diesel Vehicle Driven >1300 km Including Six Diesel Particulate Filter Regenerations. Atmosphere. 2020; 11(6):645. https://doi.org/10.3390/atmos11060645
Chicago/Turabian StyleValverde, Victor, and Barouch Giechaskiel. 2020. "Assessment of Gaseous and Particulate Emissions of a Euro 6d-Temp Diesel Vehicle Driven >1300 km Including Six Diesel Particulate Filter Regenerations" Atmosphere 11, no. 6: 645. https://doi.org/10.3390/atmos11060645
APA StyleValverde, V., & Giechaskiel, B. (2020). Assessment of Gaseous and Particulate Emissions of a Euro 6d-Temp Diesel Vehicle Driven >1300 km Including Six Diesel Particulate Filter Regenerations. Atmosphere, 11(6), 645. https://doi.org/10.3390/atmos11060645