Article

Variation of the Distribution of Atmospheric n-Alkanes Emitted by Different Fuels’ Combustion

1
Instituto de Química, Universidade de São Paulo, São Paulo 05508-000, Brazil
2
Instituto de Química, Universidade Estadual de Campinas, Campinas 13083-861, Brazil
*
Author to whom correspondence should be addressed.
Atmosphere 2020, 11(6), 643; https://doi.org/10.3390/atmos11060643
Submission received: 20 April 2020 / Revised: 27 May 2020 / Accepted: 28 May 2020 / Published: 16 June 2020
(This article belongs to the Special Issue Sources and Composition of Ambient Particulate Matter)

Abstract

:
This study presents the emission profiles of n-alkanes for different vehicular sources in two Brazilian cities. Atmospheric particulate matter was collected in São Paulo (Southeast) and in Salvador (Northeast) to determine n-alkanes. The sites were impacted by bus emissions and heavy and light-duty vehicles. The objective of the present study is to attempt to differentiate the profile of n-alkane emissions for particulate matter (PM) collected at different sites. PM concentrations ranged between 73 and 488 µg m−3, and the highest concentration corresponded to a tunnel for light and heavy duty vehicles. At sites where diesel-fueled vehicles are dominant, the n-alkanes show a unimodal distribution, which is different from the bimodal profile observed in the literature. Carbon preference index values corresponded to anthropogenic sources for most of the sites, as expected, but Cmax varied comparing to literature and a source signature was difficult to observe. The main sources to air pollution were indicated by principal component analysis (PCA). For PCA, a receptor model often used as an exploratory tool to identify the major sources of air pollutant emissions, the principal factors were attributed to mixed sources and to bus emissions. Chromatograms of four specific samples showed distinct profiles of unresolved complex mixtures (UCM), indicating different contributions of contamination from petroleum or fossil fuel residues, which are unable to resolve by gas chromatography. The UCM area seemed higher in samples collected at sites with the abundance of heavy vehicles.

1. Introduction

The Brazilian fleet corresponds to about 50 million vehicles [1] and, since 2003, a new generation of vehicles, known as flexible fuel vehicles, has been introduced in the country. Their flexible engines are adapted to use gasohol (gasoline with anhydrous ethanol) as well as pure ethanol [2]. In addition, diesel and biodiesel are also being used. The combustion of all these fuels leads to the rise of species in both gaseous and particulate phases in the atmosphere and their composition has not yet been elucidated in detail [3].
Particulate matter emitted by anthropogenic activities might cause many environmental problems, including climate effects, and also impacts human health [4]. Among the compounds emitted by fossil fuel burning, the organic fraction is predominant, and organic pollutants as n-alkanes are often present [5,6].
Despite the fact that aliphatic hydrocarbons do not present significant adverse effects on biological systems, as polycyclic aromatic hydrocarbons and their nitro- and oxy-derivatives, their role in atmospheric chemistry is important. Aliphatic hydrocarbons contribute to a significant portion of the total organic fraction which is present in the atmospheric particulate matter, besides containing several important markers, which can provide important information about sources that may be acting at a site [6,7]. Their homologous distribution may indicate different pollution sources [8].
Depending on the ambient temperature, aliphatic hydrocarbons in the particulate phase might volatilize and increase in concentration in the gaseous phase. The initial reaction of the aliphatic hydrocarbon in the atmosphere is generally with hydroxyl radicals, producing water and an alkyl radical, via hydrogen abstraction. The reaction rates at room temperature are in the range between 10−15 and 10−11 molecule cm−3 s−1, increasing with growth in chain size and structural complexity of the aliphatic hydrocarbons [9,10]. Once formed, alkyl radicals are converted through reactions into alkyl peroxy (ROO🞄) and alkoxy (RO🞄) radicals which, in sequence, will act as formation precursors of ozone, alkyl nitrates, and carbonyl compounds. These compounds can influence the vapor-to-particle distribution [11]. The toxic effects of these photochemical oxidants are widely recognized in the literature [12,13]. When it is inhaled, they produce reactive oxygen species, which may induce cellular oxidative stress and consequently become the first step in the development of many diseases including respiratory diseases such as asthma and cardiovascular problems [9,12].
Studies performed in smog chambers demonstrated that the organic fraction of aerosol-containing nitro groups, produced when aliphatic and aromatic hydrocarbons are exposed to NOx and solar radiation in the atmosphere, can be potentially mutagenic to organisms [14]. Considering that, the atmospheric reactions occurring with some of the emitted compounds may significantly increase the genotoxic potential of the ambient air particles [15].
Sicre et al. [16] suggested that n-alkanes emitted by higher plants are found predominantly in larger particles and, on the other hand, those originating from anthropogenic sources, such as incomplete fuel combustion, lubricating oil volatilization, tire debris and road dust [17,18,19], are major sources of fine particles. Regarding origin and distribution, natural n-alkanes can be derived from biological sources such as plant wax, soil, marine bacteria, phytoplankton, and biomass burning and often present an odd carbon chain prevalence in relation to the odd/even distribution [7]. In urban areas the homologues emitted by anthropogenic sources do not present a characteristic distribution. Therefore, the observed n-alkane profiles can contribute to the identification of emission sources [20].
São Paulo and Salvador are big cities with approximately 12 million and 3 million inhabitants, respectively [21], and have ongoing problems concerning air pollution. Local emissions are considered as the major contributors of organic aerosols [22,23]. According to previous studies, São Paulo presented a total concentration of 36 ng m−3 for n-alkanes [22], while Salvador showed an even higher value, 62 ng m−3 [23].
In an attempt to differentiate the emissions from different engines, measurements were undertaken in three tunnels, in a bus station, in an urban area impacted mostly by heavy vehicles, and in a truck parking depot. In this study n-alkanes in aerosols were identified and quantified; the samples were collected in two different Brazilian states strongly affected by vehicular emissions in their most populated cities, São Paulo and Salvador.

2. Experiments

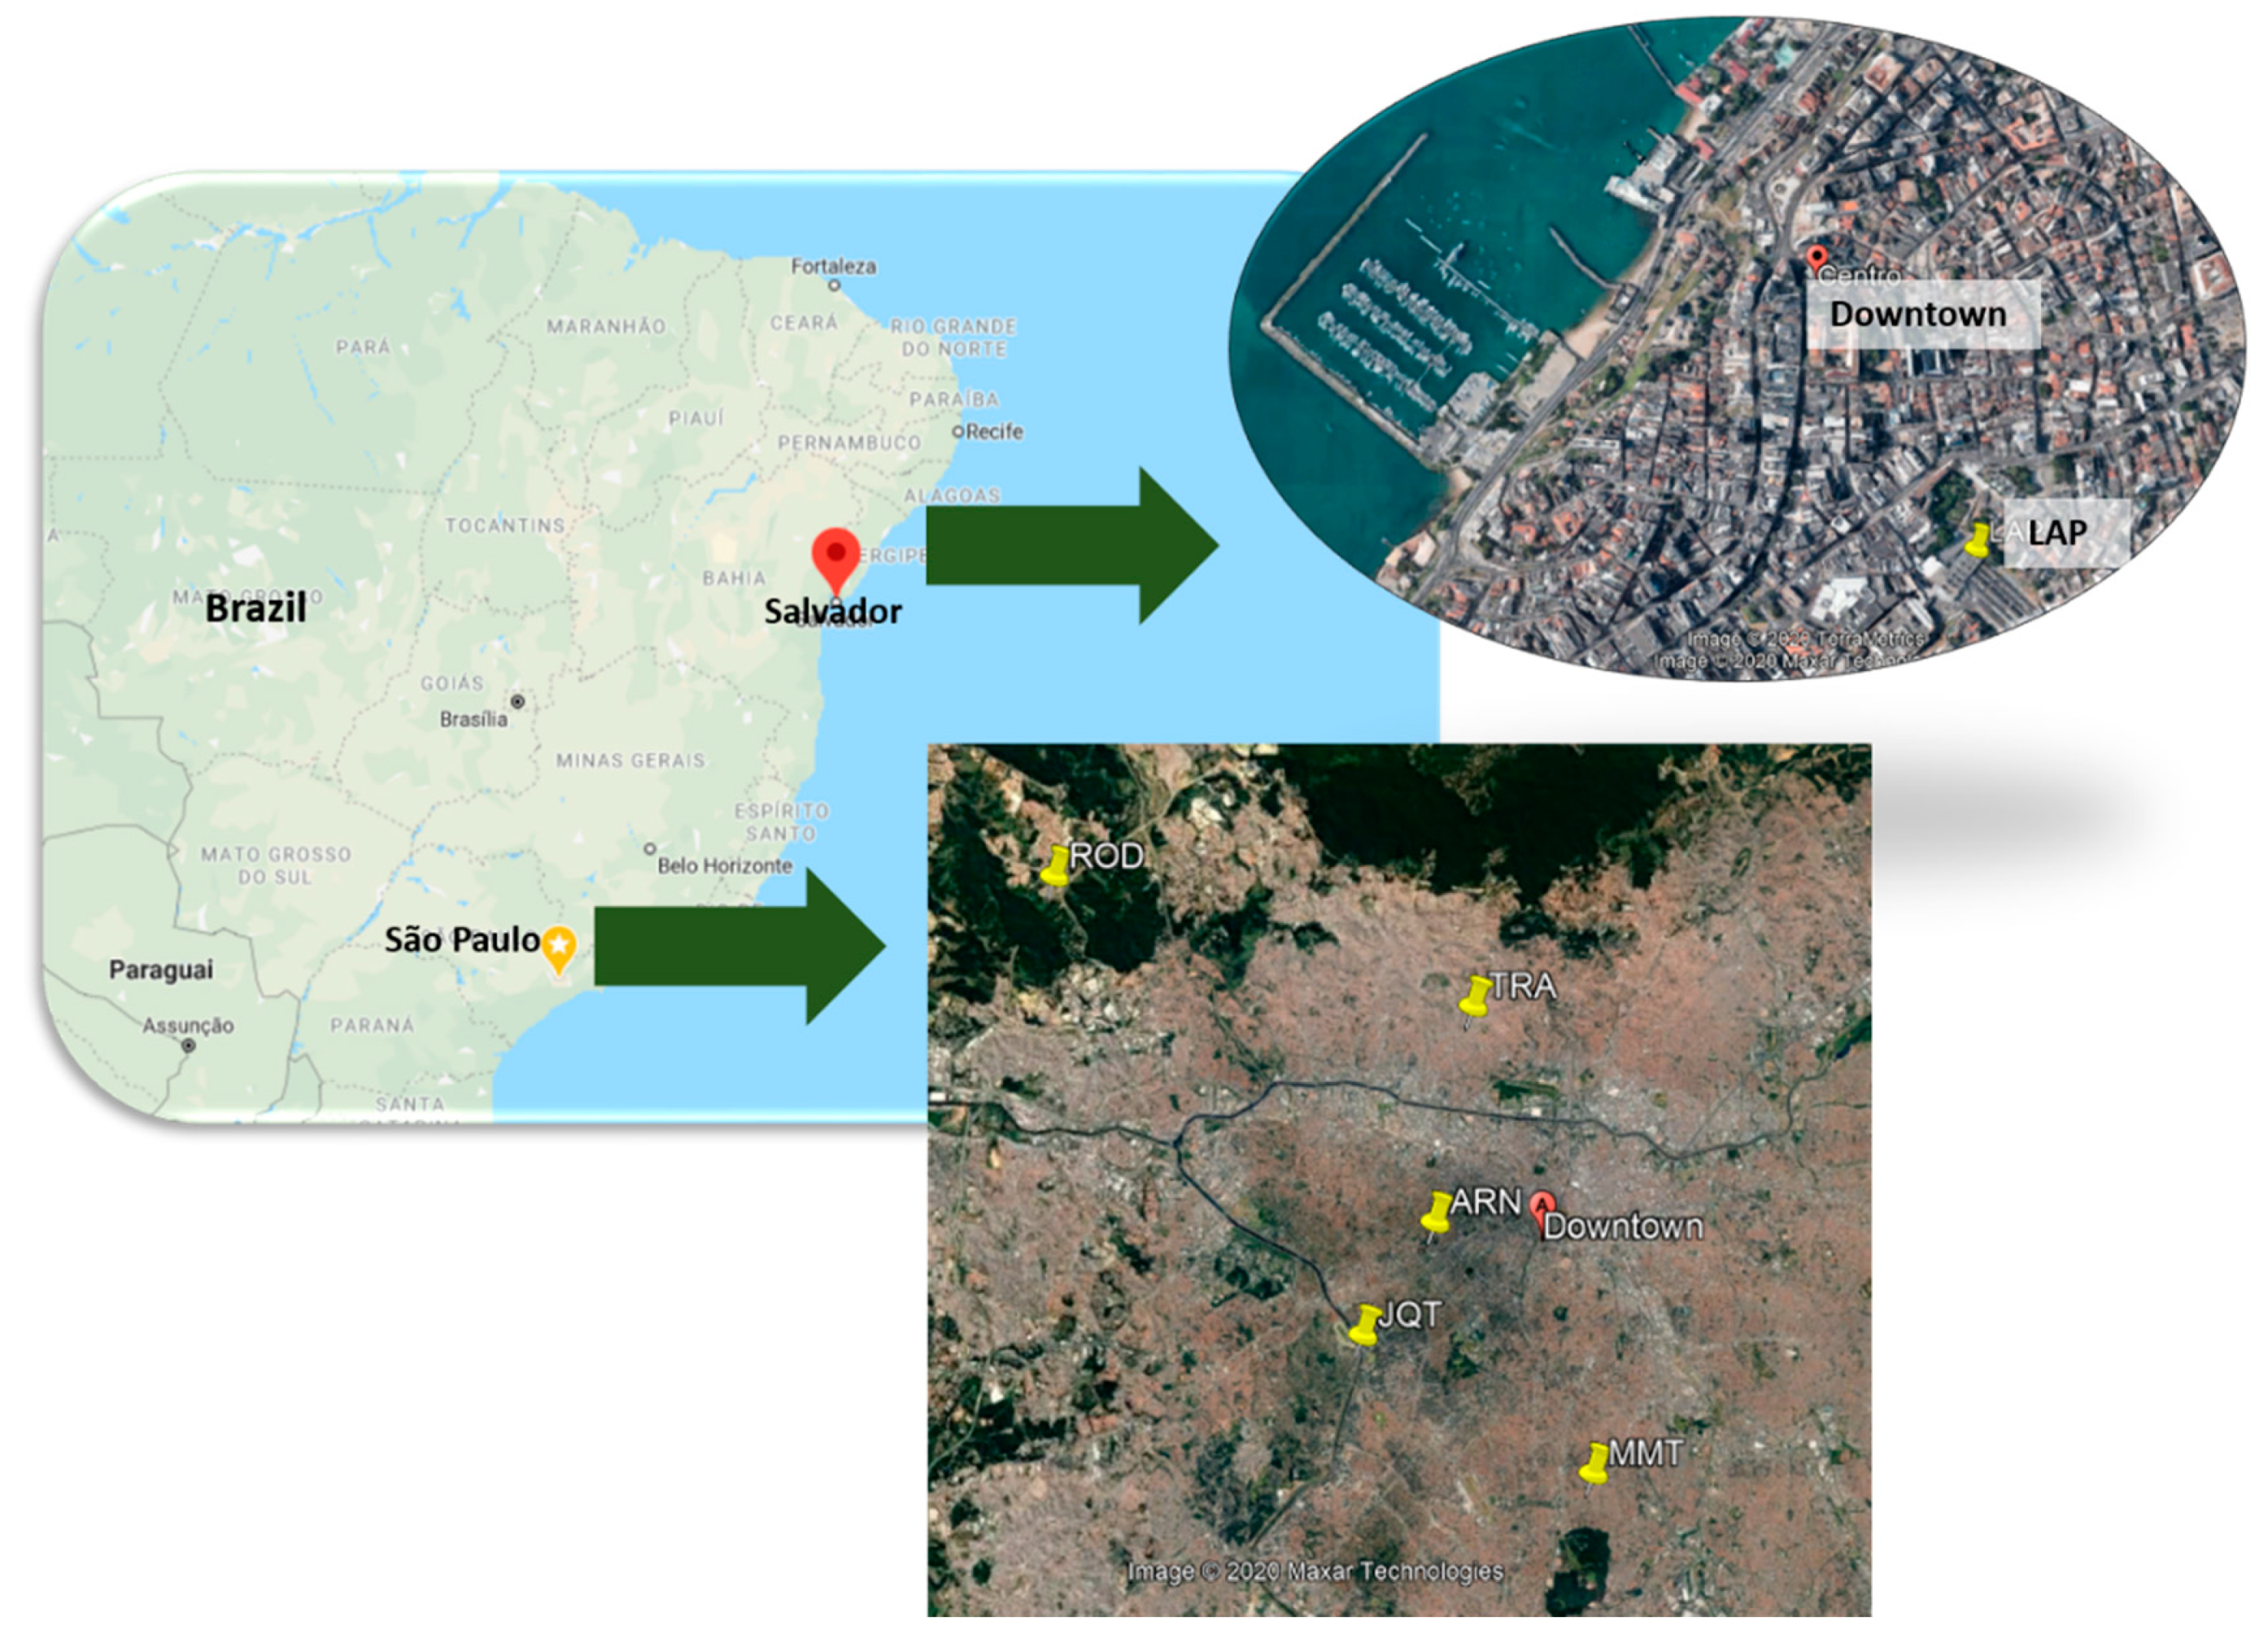
2.1. Sampling Site Descriptions

Sampling was conducted in two cities located in two different Brazilian states. The first one was São Paulo city (Southeastern Brazil, Figure 1) where five places were chosen: three tunnels, one road site and one truck shipping corporation site. The first tunnel, Jânio Quadros (JQT), is located in the southwest area/region and is 1900 m long. The traffic is only permitted in one direction and the movement of diesel-fueled vehicles is restricted. Thus, light vehicles are predominant at this site. JQT presented intense traffic during weekdays. The second tunnel, Maria Maluf (MMT) is located in the south area and is 800 m long, connecting with important highways. In MMT, the emission varied between gasohol, ethanol and diesel vehicles [24]. The third tunnel, Rodoanel (ROD) is 1700 m long. It is an important road for heavy-duty vehicles, especially heavy trucks transporting loads. It is a beltway with a radius of approximately 23 km from geographical center of the city downtown. Sampling at the three sites was conducted as follows: at JQT in 2001 and 2011, at MMT in 2001, at ROD in 2011.
The fourth sampling site in São Paulo is located inside the campus of the University of São Paulo (ARN) near city center, at the intersection of two roads with intense traffic of buses and cars during weekdays. The samples at ARN were collected in 2012.
The fifth sampling in São Paulo was conducted at a truck shipping company (TRA) in 2015. This site is used for mechanical repair and fuel supply for trucks. It is located in the North region of the city, close to several important highways. As road transport is the most important way of trading goods in Brazil, companies specialized in the transport of payloads predominantly use heavy trucks, which are fueled with biodiesel (B5% = blend volume of 5% of pure biodiesel and 95% of diesel) and diesel.
The second city was Salvador, capital of the Bahia State (Northeastern Brazil, Figure 1). The sampling was conducted at Lapa Bus Station (LAP), located in the downtown area (Figure 1), a region with heavy commerce and service activities, in close proximity to several office buildings, stores and a big shopping mall. Sampling was conducted at the underground level, where ventilation is very poor, thus impairing air circulation. The site is impacted by emissions from buses of a fleet of about 510 vehicles operating at an average frequency of 325 buses per hour and with a daily circulation of approximately 300,000 people. The samplings were conducted in 2010 (LAP10) and in 2013 (LAP13).

2.2. Aerosol Collection and Chemical Analysis

Before sampling, quartz fiber filters were pre-heated at 600 °C for 6 h. Samples were obtained with a high-volume sampler at a flow rate of 1.13 m3 min–1, collecting total suspended particles (TSP) (Energética, Brazil and Thermo Scientific, USA), PM10 or PM2.5 (Thermo Scientific, USA) on quartz fibers.
In the tunnels of São Paulo, 15 samples were collected for a period of 6 h, during the day [2,24] between 2001 and 2011. Owing to the expected high loads of PM inside the tunnels that could overcharge filters, sampling periods were shorter than at the other sites. At TRA and ARN, 11 samples were collected during a 24-h sampling period. Fifty-two samples were collected in Salvador at the Lapa Bus Station, for eight hours during the daytime in 2010 and 2013. After sampling, the filters were kept at 4 °C in a refrigerator. Table 1 summarizes the size of particles, numbers of samples, sampling durations, months and years for each campaign.
As the chemical analyzes were conducted in different periods by different research groups, the methodology chosen for the samples from São Paulo and Salvador was not the same. However, analytical parameters related to these methodologies have been published previously [22,23,25]. Furthermore, all samples were analyzed close to the collection period. Samples collected in São Paulo were extracted by an ultrasonic bath (Q335D2, Quimis, Brazil) with 80mL of dichloromethane, three times, and concentrated to 1 mL in a rotatory evaporator with N2 (Air Liquide) flux. A column packed with silica and alumina was used to separate n-alkanes from the other organic compounds [26]. The eluent used to obtain n-alkanes was n-hexane.
Gas chromatography coupled with a mass spectrometry (GC–MS) analyzer (GC-7820A/MS-5975, Agilent, Palo Alto, CA, USA) was used to identify the compounds, with helium as the carrier gas. The chromatographic conditions were: 60 °C for 1 min, up to 150 °C for 6 °C min−1; next to 280 °C at 5 °C min−1, holding for 15 min. The splitless mode was used to make the injections (1 µL) and the injector temperature was set to 300 °C. The standard used for the calibration curve was purchased from Sigma-Aldrich (C7–C40 alkanes standard).
For samples collected in Salvador, the extraction method of the n-alkanes from the filters was based on the work of Pereira et al. [3]. Briefly, samples from atmospheric particulate matter were placed in amber glass vials and 5 mL of a dichloromethane/methanol (1:1 v/v) mixture was added. The vials were then closed and placed into an ultrasonic bath for 10 min. After that, each sample was filtered through a 0.45 μm polytetrafluoroethylene membrane (PTFE); 500 μL aliquot was dried in a gentle nitrogen stream. The dry extract was completed with 50 μL of dichloromethane, for the subsequent GC–MS analysis. The quantification was based on external standard calibration curves using stock solution of 500 mg L−1 C10–C40 mixture of n-alkanes (AccuStandard, New Haven, CT, USA). The analyses were performed with a GC–MS system (Varian 431/200, Walnut Creek, CA, USA) with an auto sampler (Varian CP-8410, Palo Alto, CA, USA). The column used was BPX5 MS (30 m × 0.25 mm ID × 0.25 µm; 5% phenyl/95% polydimethylsiloxane) with helium as the carrier gas at a 1 mL min−1 flow rate. The oven temperature program was: 60 °C for 1 min; increased up to 90 °C at 4 °C min−1; up to 140 °C at 12 °C min−1; up to 180 °C at 9 °C min−1; and up to 330 °C at 6 °C min−1, remaining at this temperature for 6 min and finishing with a total run time of 48 min. Injections (1 µL) were made in the splitless mode and the injector temperature was set at 300 °C. Recovery tests were conducted in both experiments, the values ranging between 80% and 98%.

2.3. Data Analysis

Information on the source index used in this study for data analyses are described hereafter. The carbon preferential index (CPI) is a diagnostic tool that represents a relation of proportionality between alkanes with odd and even carbon chains (Equation (1)) [7]. While the contribution of petrogenic sources leads to CPI values close to 1, values greater than 3 are indicative of contributions from biogenic sources [6,27].
CPI = ∑Codd ÷ ∑Ceven
Two CPI parameters were adopted in the present study to discriminate between petrogenic and biogenic influences, and they include [28]:
Whole range of n-alkanes (Equation (2)):
CPI 1 = i = 17 29 C i   ÷   k = 16 30 C k
Petrogenic n-alkanes (Equation (3)):
CPI 2 = i = 17 25 C i   ÷   k = 16 24 C k
Another parameter that can be used to indicate the source is called average chain length (ACL), especially for lipid components produced by plants. ACL is calculated as a mean number of carbon atoms per molecule based on the abundance of odd high homologs (Cn ≥ C23, Equation (4)) [27]:
ACL = (n × [Cn] + (n+2) × [Cn+2] +…+ (n+m) × ([Cn+m])/([Cn] + [Cn+2] + …+ [Cn+m])
The percentage of petrogenic n-alkanes (%PNA, Equation (5)) was deduced from the percentage of WNA (wax n-alkanes), which is used to estimate the biogenic contribution of wax n-alkanes and was calculated by subtracting the concentration of next higher and lower even carbon-numbered homologs from the average (Equation (6)) [5,28]:
%PNA = 100 − %WNA
% WNA = [ C n ( C n + 1 + C n 1 ) / 2 ] C t o t a l × 100
The equation derived for computing the ratio of homolog concentrations is called odd-to-even predominance (OEP). It has been adopted as a tool to confirm CPI values, but OEP is calculated for each individual n-alkane, while CPI is calculated for the whole range. Thereby, mathematical improvements have made it possible for OEP to eliminate the limitations found in CPI, as previous studies have reported [29]. This parameter can bring more realistic information about the sources than CPI [30]. The OEP ratios were calculated according to Equation (7). Kavouras et al. [31] suggested adopting the range between C14 and C34 for this calculation.
O E P = ( C n 2 + 6 × C n + C n + 2 4 × C n 1 + 4 × C n + 1 ) ( 1 ) ( n 1 )

3. Results and Discussion

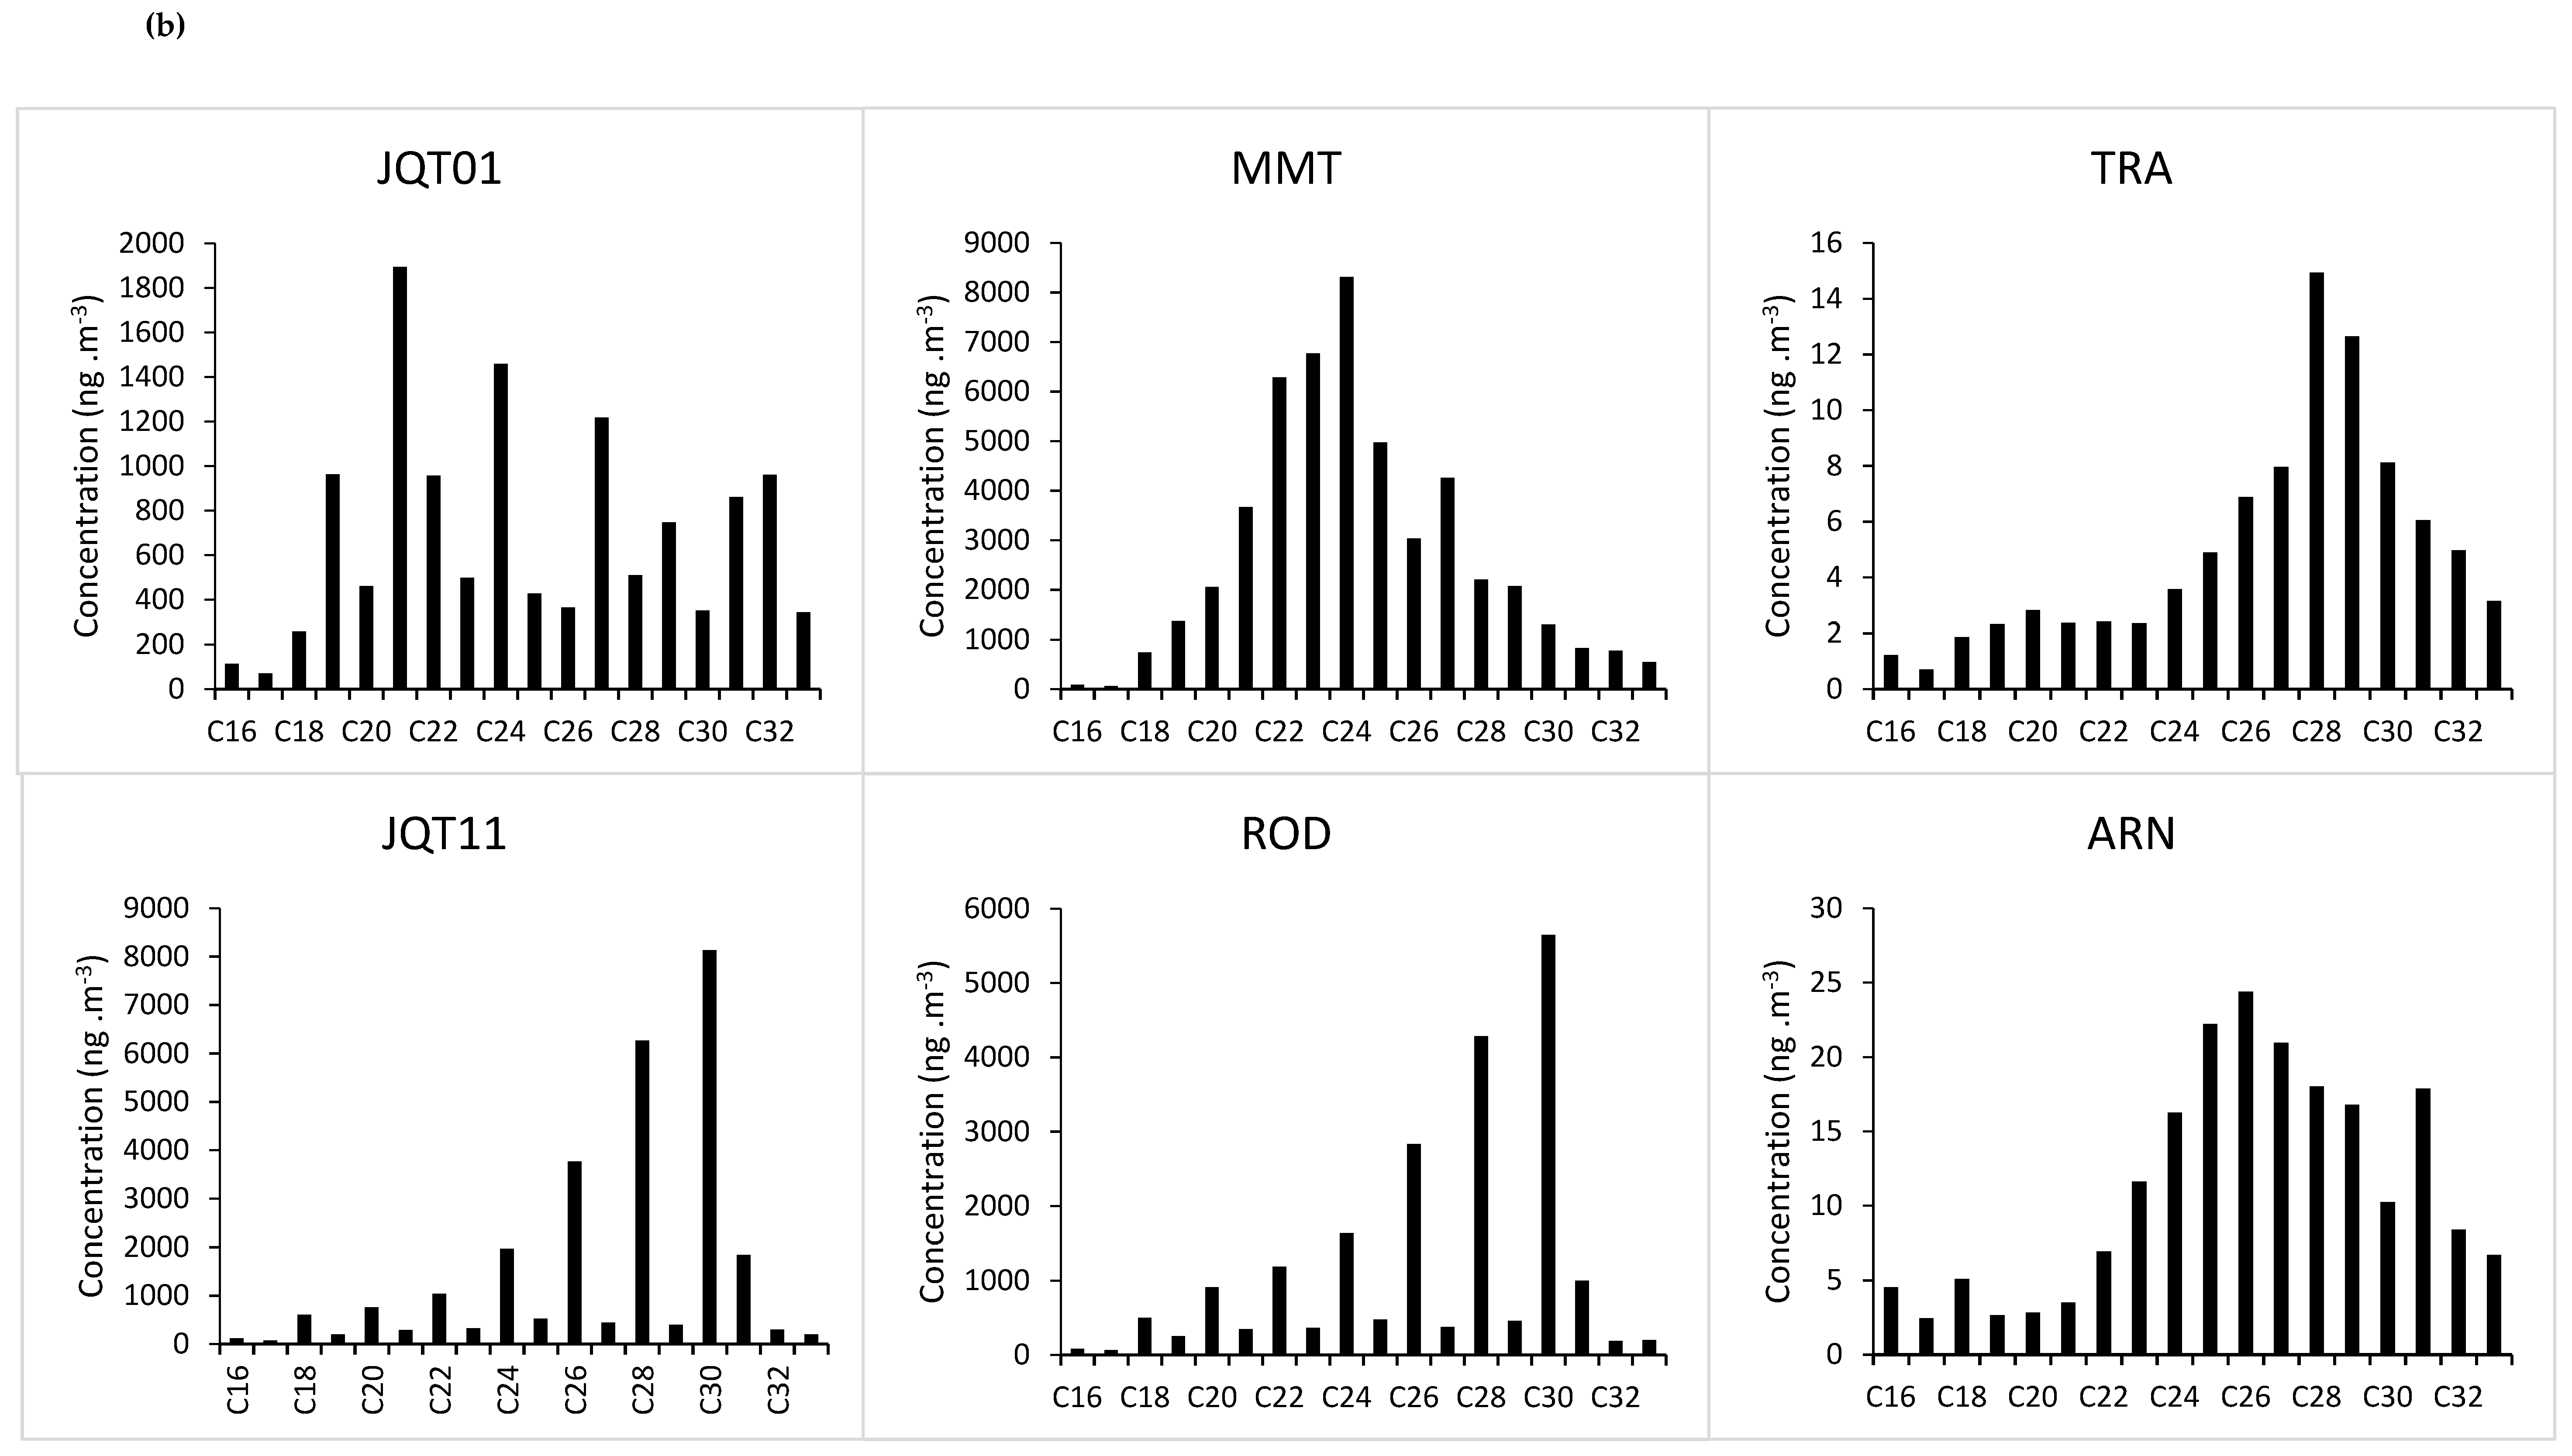
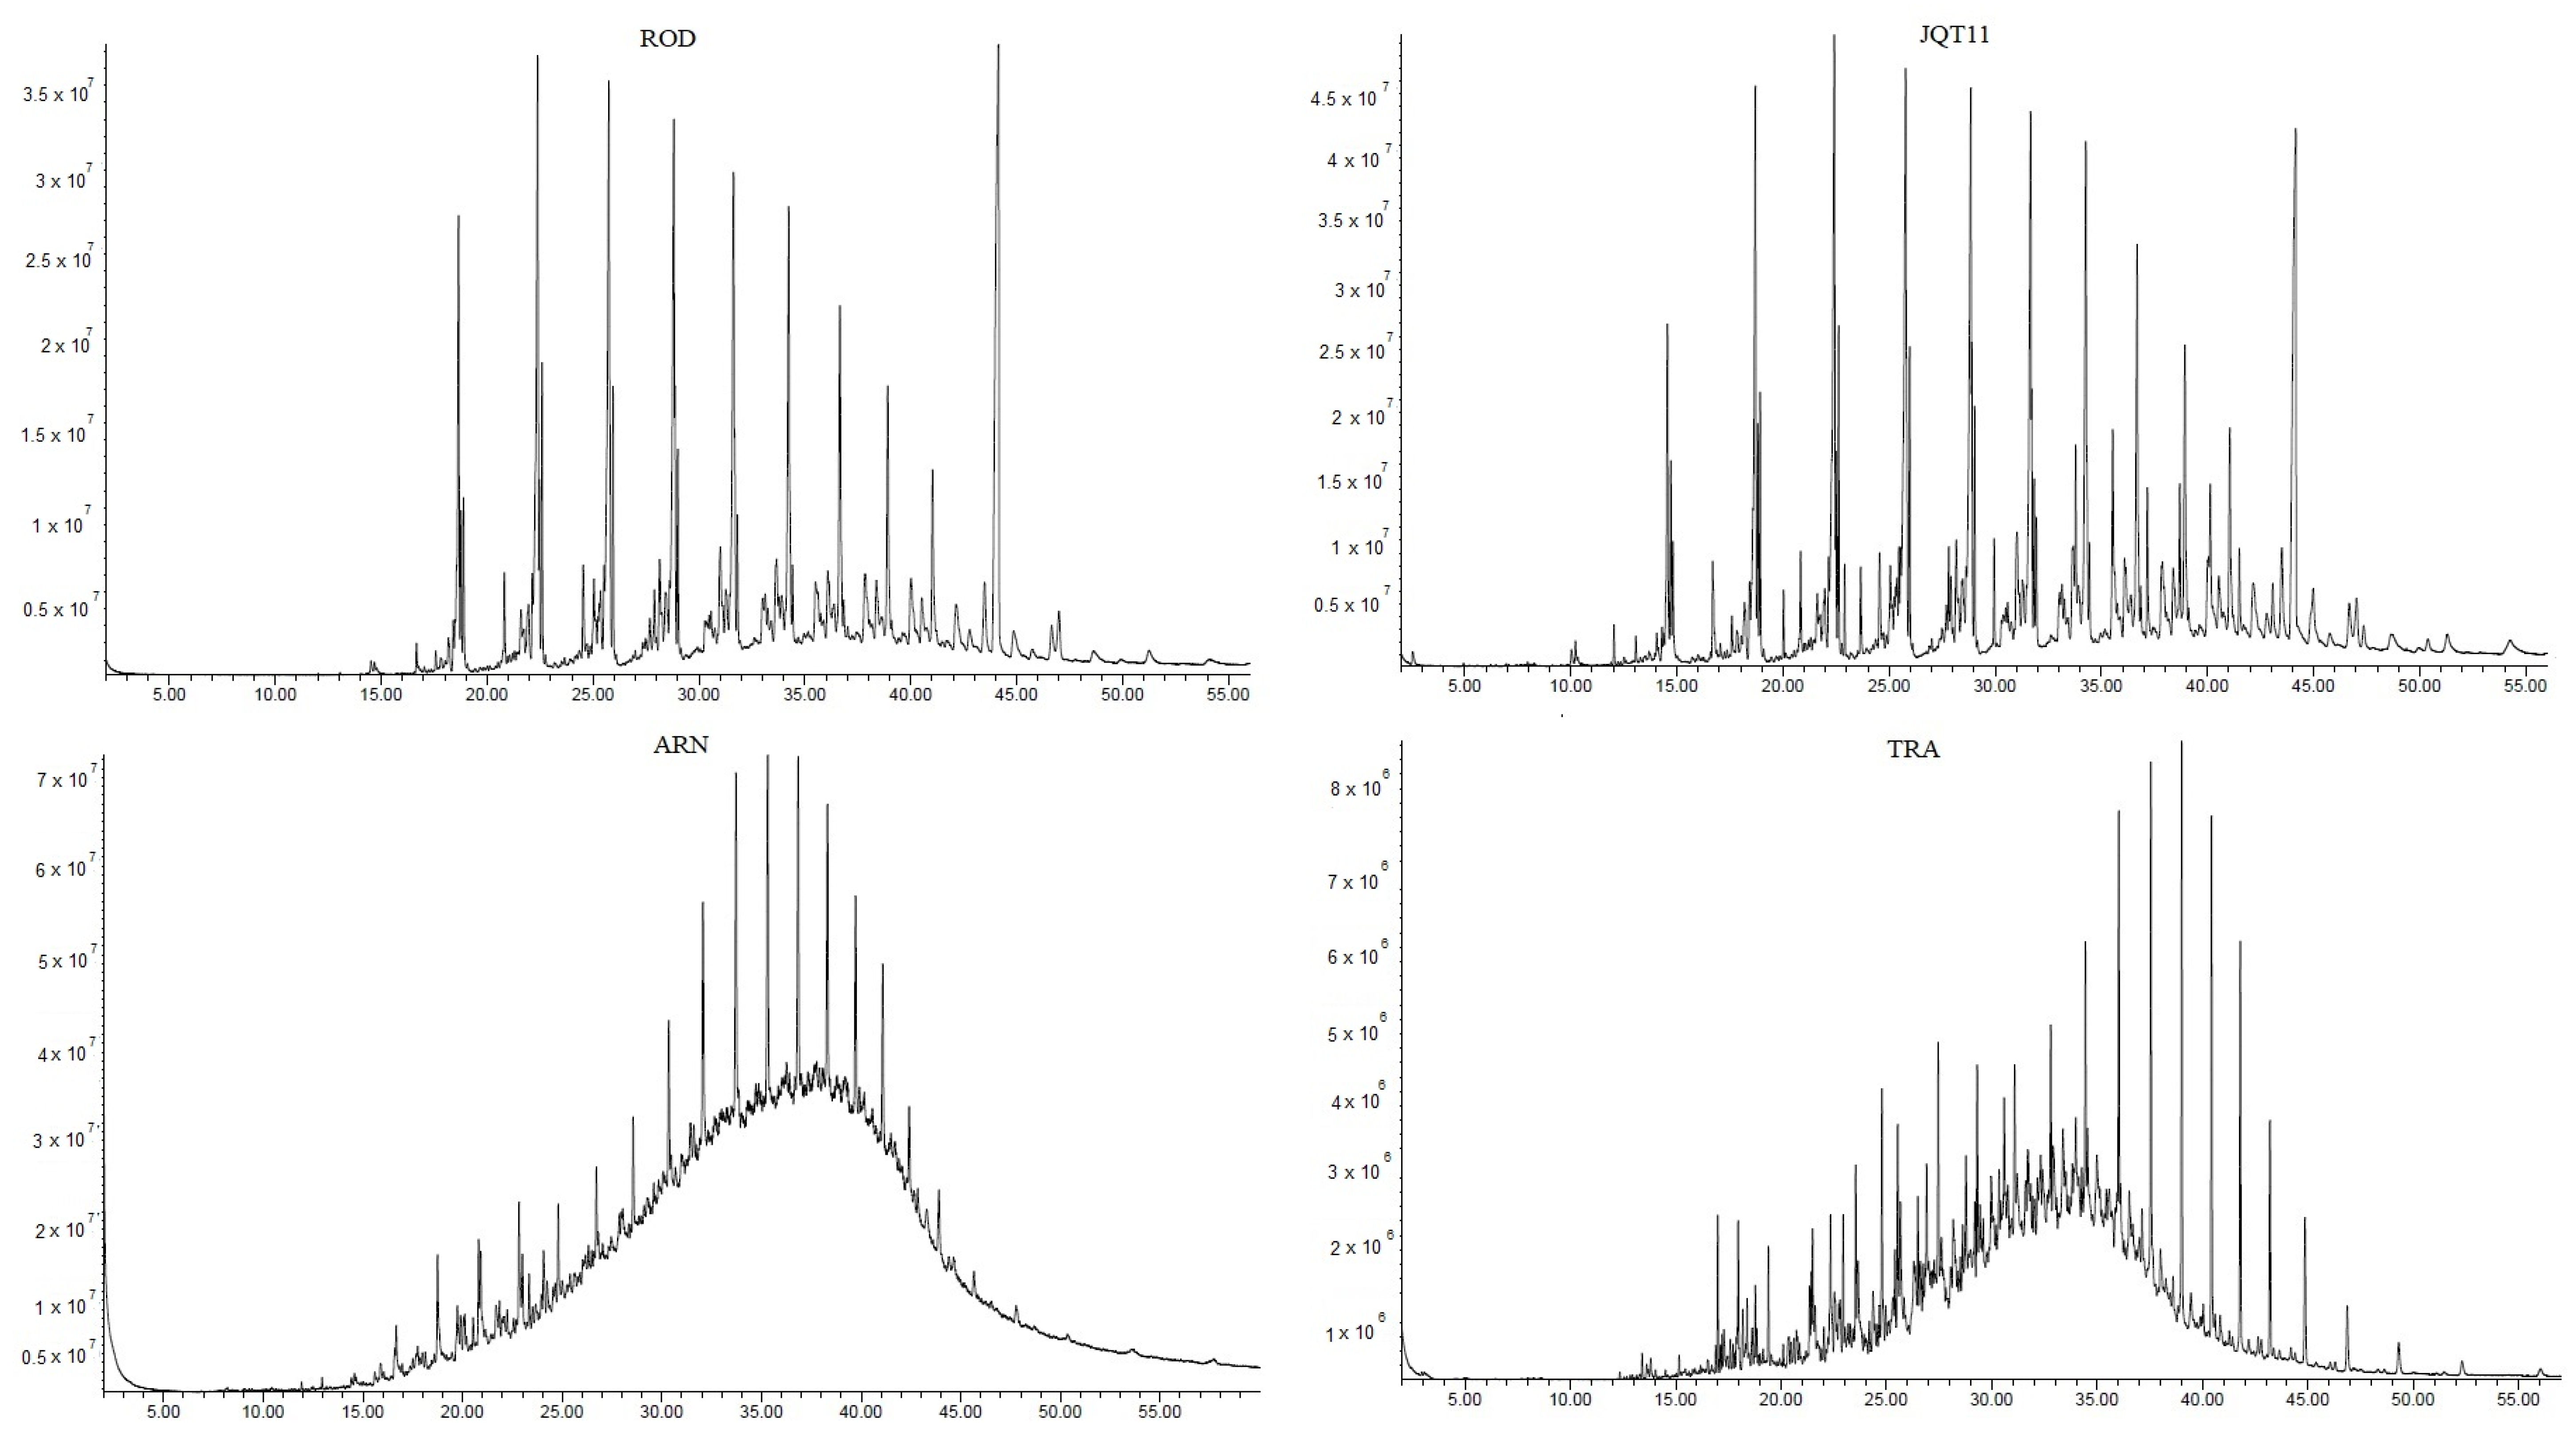
3.1. Particulate Matter and n-Alkane Concentrations in the Tunnels and at the Truck Depot

Table 2 shows minima, maxima and mean concentrations, standard deviations and sampling numbers for all sites. The samples collected in 2001 at JQT and MMT presented mean concentrations of TSP of 488 and 253 µg m−3 (Table 2), respectively. The truck traffic was allowed in this area and the fleet was constituted by a mixed of gasohol, ethanol and diesel fueled vehicles until 2008 [1]. At this time, flex vehicles were not circulating and biodiesel was not added to the diesel; this addition is often related to better fuel burning and smaller emissions of particulate matter [32,33]. The limits defined in the Brazilian Atmospheric Standards for TSP are related to 24 h of exposure, however, even with sampling time below 24 h, the average concentrations in both tunnels was higher than the limit of 240 µg m−3 established in Brazil. A large difference in traffic characteristics between the tunnels MMT and JQT01 was observed. An intense traffic of heavy-duty vehicles (HDV) occurred in MMT during the afternoon and light-duty vehicles (LDV) circulation was constant during the morning and afternoon. In the JQT, the LDV were predominant and the vehicle density increased from morning to afternoon [34].
In JQT11, where LDV were predominant, the PM2.5 mean concentration was over 52 µg m−3, and at ROD, where the particulate sources are LDV and HDV, the mean concentration was over 233 µg m−3 (Table 2). ROD is approximately 23 km from São Paulo’s city downtown and it is an important route for HDV that circulate with diesel and biodiesel, especially for trucks transporting shipments to the entire state. Besides that, these values are comparable to the Standard establish by the São Paulo Environmental Agency, CETESB, for 24 h of exposure (60 µg m−3) [35]. JTQ11 had a mean value below the legislation value. On the other hand, ROD presented a mean concentration almost four times higher than the CETESB standard.
Comparing the results obtained in São Paulo tunnels with other studies, the values obtained in the JQT11 and ROD were lower than the concentration found in a tunnel in Lisbon (Portugal) characterized by the predominance of gasoline vehicles (58%) followed by diesel cars (42%). The PM2.5 concentrations ranged from 450 to 1061 µg m−3 in October 2008 [36]. For PM10 samples collected in Shanghai, China at a road tunnel with intense traffic of gasoline-powered vehicles (91–98%), between October 2011 and May 2012, the mean concentration was 670 µg m−3 [37], much higher than the values obtained in the tunnel samples in the present study.
The TSP concentration at JQT for the samples collected in 2001 was 488 µg m−3 (JQT01) and for those collected 10 years later at the same site (JQT11), the PM2.5 mean concentration was over 52 µg m−3. The restriction of truck circulation, implemented in 2008 by local government, might have influenced this PM reduction [1], since HDV are known to significantly contribute to the PM emissions [38].
The mean concentrations of the homologues found in the tunnel samples in 2001 (JQT01) were over 767 ng m−3 and even much higher 1680 ng m−3 (Figure 2) at MMT. The Cmax, carbon number of the most abundant n-alkane [39], was C21 for JQT01 and C24 for MMT. According to the literature, this parameter can be used for a relative source input [28,39]. Cmax lower than C25 is characteristic of anthropogenic emissions, more specifically by fossil fuel burnings [6,40]. Simoneit et al. [40], reports n-alkanes emitted by diesel vehicles and auto engine exhausts (species not burned) maximizing at C22–C23. Among the sites impacted by diesel burning emissions (ARN, TRA, JQT, LAP, MMT, and ROD), only JQT and MMT presented Cmax (Table 3) similar to that reported for areas impacted by diesel burning [40].
For the samples collected at tunnels 10 years later, JQT11 (PM2.5) presented an n-alkane mean concentration higher (1670 ng m−3) than ROD (1276 ng m−3) (Figure 2). This value was higher than obtained at JQT01 (767 ng m−3) 10 years before. In 2011, JQT11 registered 1806 vehicles/hour, while ROD recorded 1152 vehicles/hour [2].
Comparing tunnel results with strong contributions from heavy duty-vehicles, ROD (1276 ng m−3) presented a smaller n-alkane mean concentration than MMT (1680 ng m−3), probably due to a smaller number of vehicles, because according to Vasconcellos et al. [41], the traffic volume in MMT was 2917 vehicles/hour.
The TRA site is a place where a truck company offers maintenance services and is an open area used for parking, located in an industrial neighborhood of São Paulo. This site presented PM2.5 average concentrations of 92 µg m−3 almost four times higher than the value recommended by World Health Organization for PM2.5 (25 µg m−3) [42] and higher than the standard established for São Paulo State [35]. The total n-alkane mean concentration at TRA was 90 ng m−3. These samples showed a predominant distribution between C26 and C30. The Cmax was C28, showing the influence from engine exhausts (lubricating oil emissions) in addition to the fossil fuel burning [7].

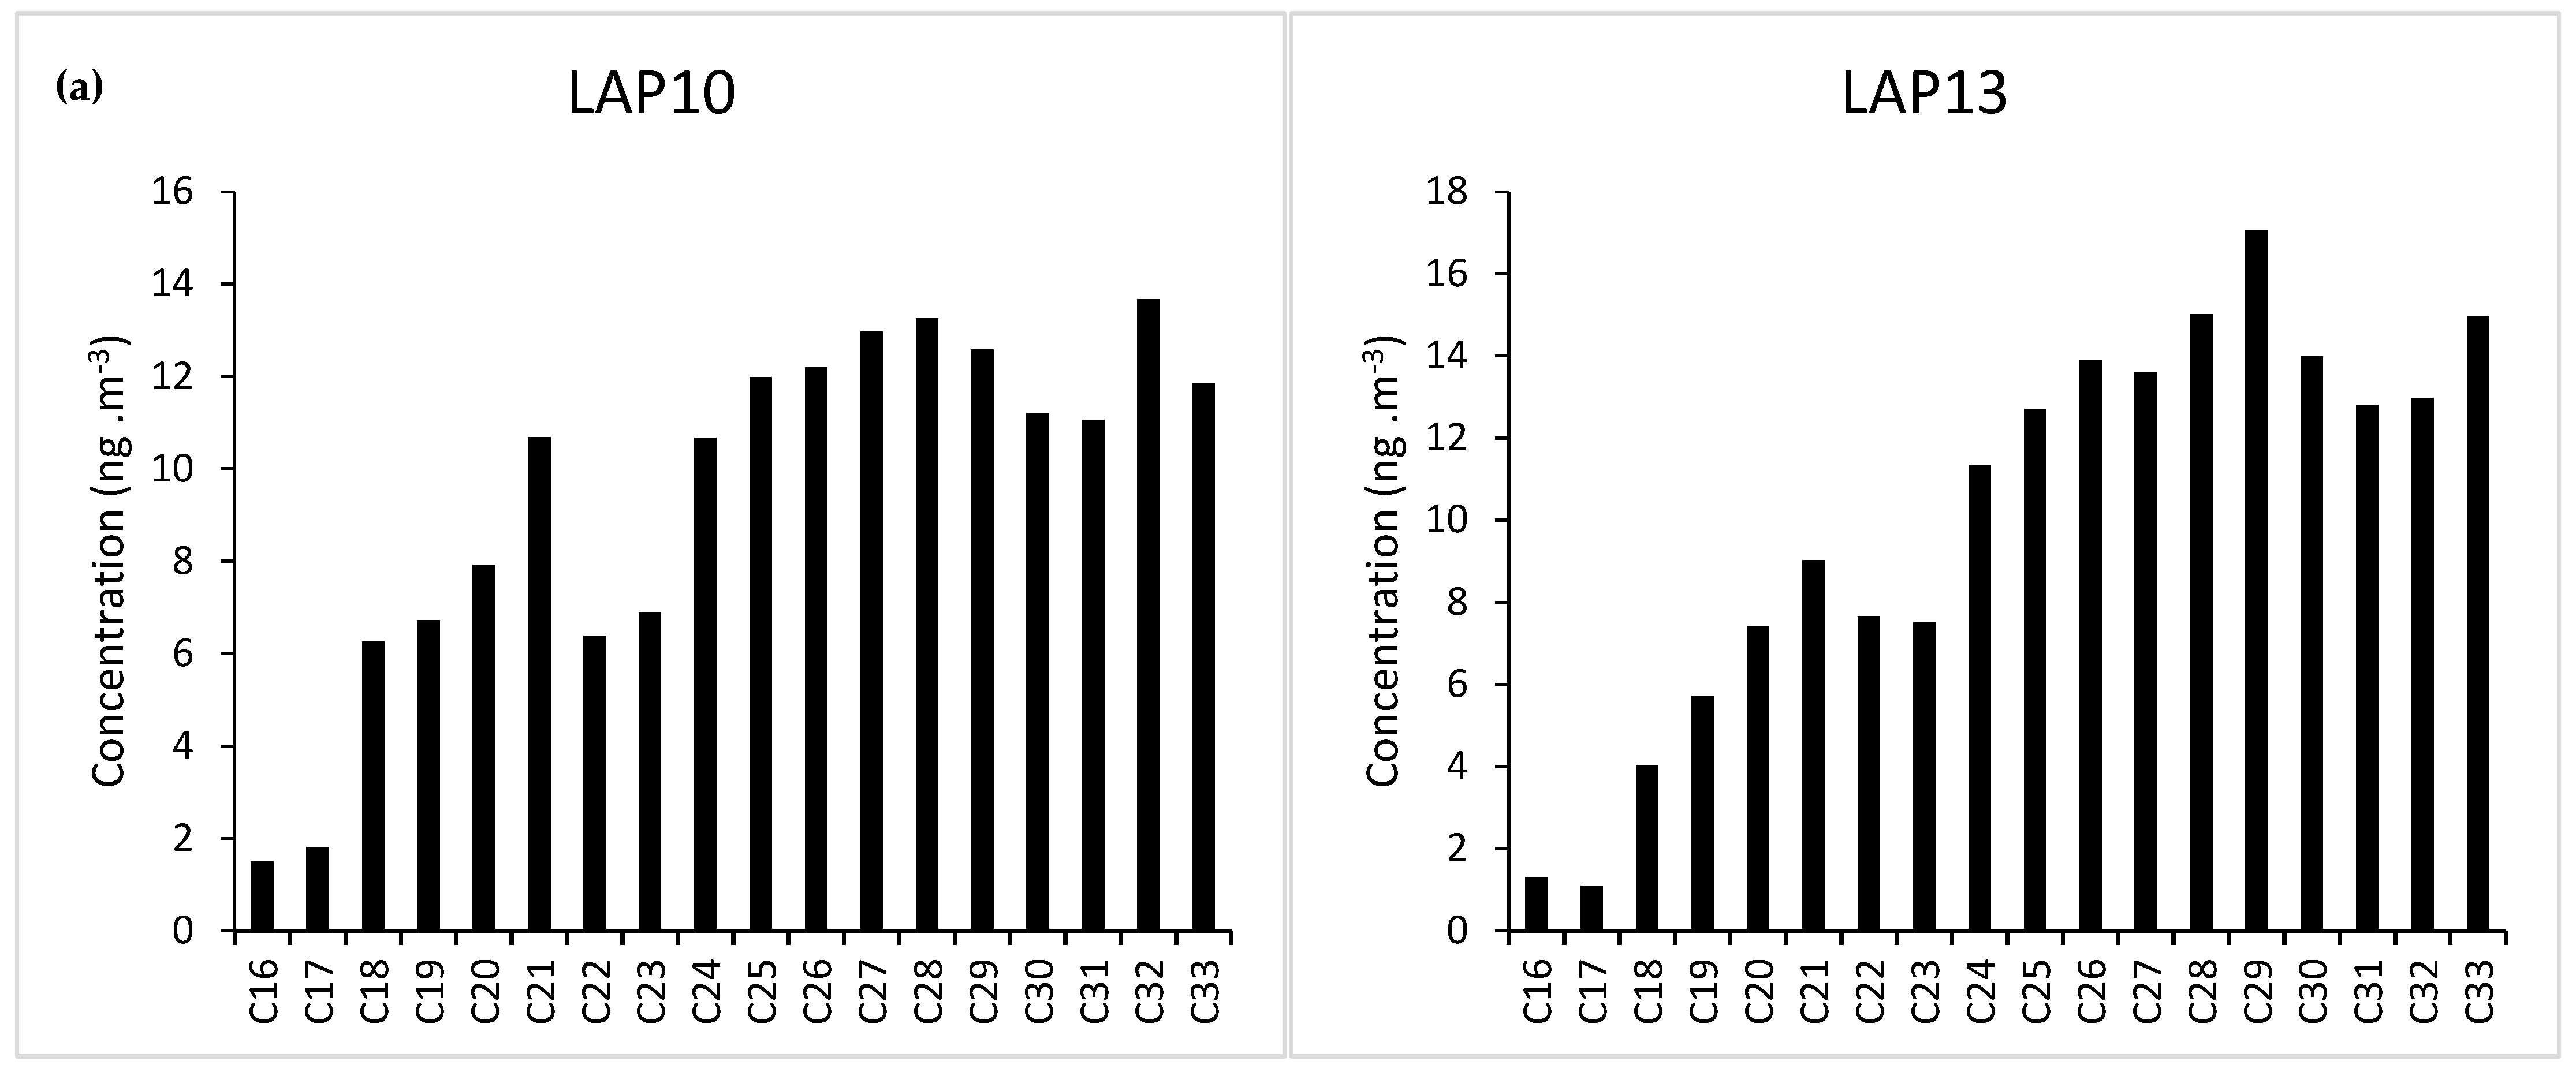
3.2. Particulate Matter and n-Alkanes Concentration in Bus Station (LAP) and Bus Corridor (ARN)

The PM10 concentrations at the LAP13 bus station (Table 2), were lower than those found three years before (LAP10), considering either the weekday or the day period of sampling. The average concentrations in the morning, afternoon and night for 2010 samples were 162, 171 and 85 μg m−3, while for samples collected three years later (2013) the values were 91, 127 and 56 μg m−3, respectively. These results are consistent with previous studies at the same site by Pereira et al. [43] in 2005 (123 μg m−3; 140 μg m−3 and 63 μg m−3), confirming that in 2010 the concentrations were higher than in 2005. This can be explained partly by an increase in the bus fleet; while in 2005 an average of 482 vehicles circulated daily in the bus station, in 2010 this number increased to 519 vehicles. In addition, there were changes in station architecture after 2005, when the air exhaust system was removed for repair, resulting in a lessening of air circulation through the station. The decrease in concentration in 2013 was probably due to new arrangements in the station; after 2012, a new bus platform was added, providing air circulation at the underground floor. Other factors could be associated with this, such as fleet renewal and improvement of fuel quality (diesel) [43].
Table 3 and Figure 2 presented the n-alkane distributions for all sites studied. The Cmax, the most abundant species, was C32 for LAP10 and C29 for LAP13, which can be related to biogenic contributions [5]. For these samples, it was possible to identify and quantify the homologous series that was distributed between the C16 and C33. It was observed that the average concentrations did not differ significantly between the two sampling years (1.5–14 ng m−3 and 1.3–17 ng m−3 in 2010 and 2013, respectively). In addition, there was a greater contribution of n-alkanes of high molecular mass (C24 to C33). In the same place, a previous analysis by Pereira et al. (2007) with samples collected in 1998 showed concentrations of total n-alkanes ranging between 300 and 580 ng m−3, values above those found in 2010 (range: 72–210 ng m−3) and 2013 (range: 105–202 ng m−3).
The total concentrations of n-alkanes found in this study for LAP10 (160 ng m−3) and LAP13 (180 ng m−3), are comparable with values obtained in other studies, which reported concentrations of samples collected in roadway regions and in urban areas, as by Omar et al. [6] (Kuala Lumpur, Malaysian, 103 ng m−3), Wang et al. [44] (Beijing, 137 ng m−3) and Vasconcellos et al. [45] (São Paulo, 106 ng m−3).
The ARN site, an important road close to São Paulo’s main avenues, receives a strong influence of bus and car emissions; besides there are many public hospitals around this area. The mean PM2.5 concentration at ARN was 79 µg m−3, this value is also three times higher than that recommended for 24 h of exposure by the World Health Organization (WHO) [4]. Regarding n-alkanes at ARN, the total concentration was 201 ng m−3, and a predominance of species ranging from C24 to C29 was observed; the Cmax was C26, which indicates the contribution of mixed sources [40].

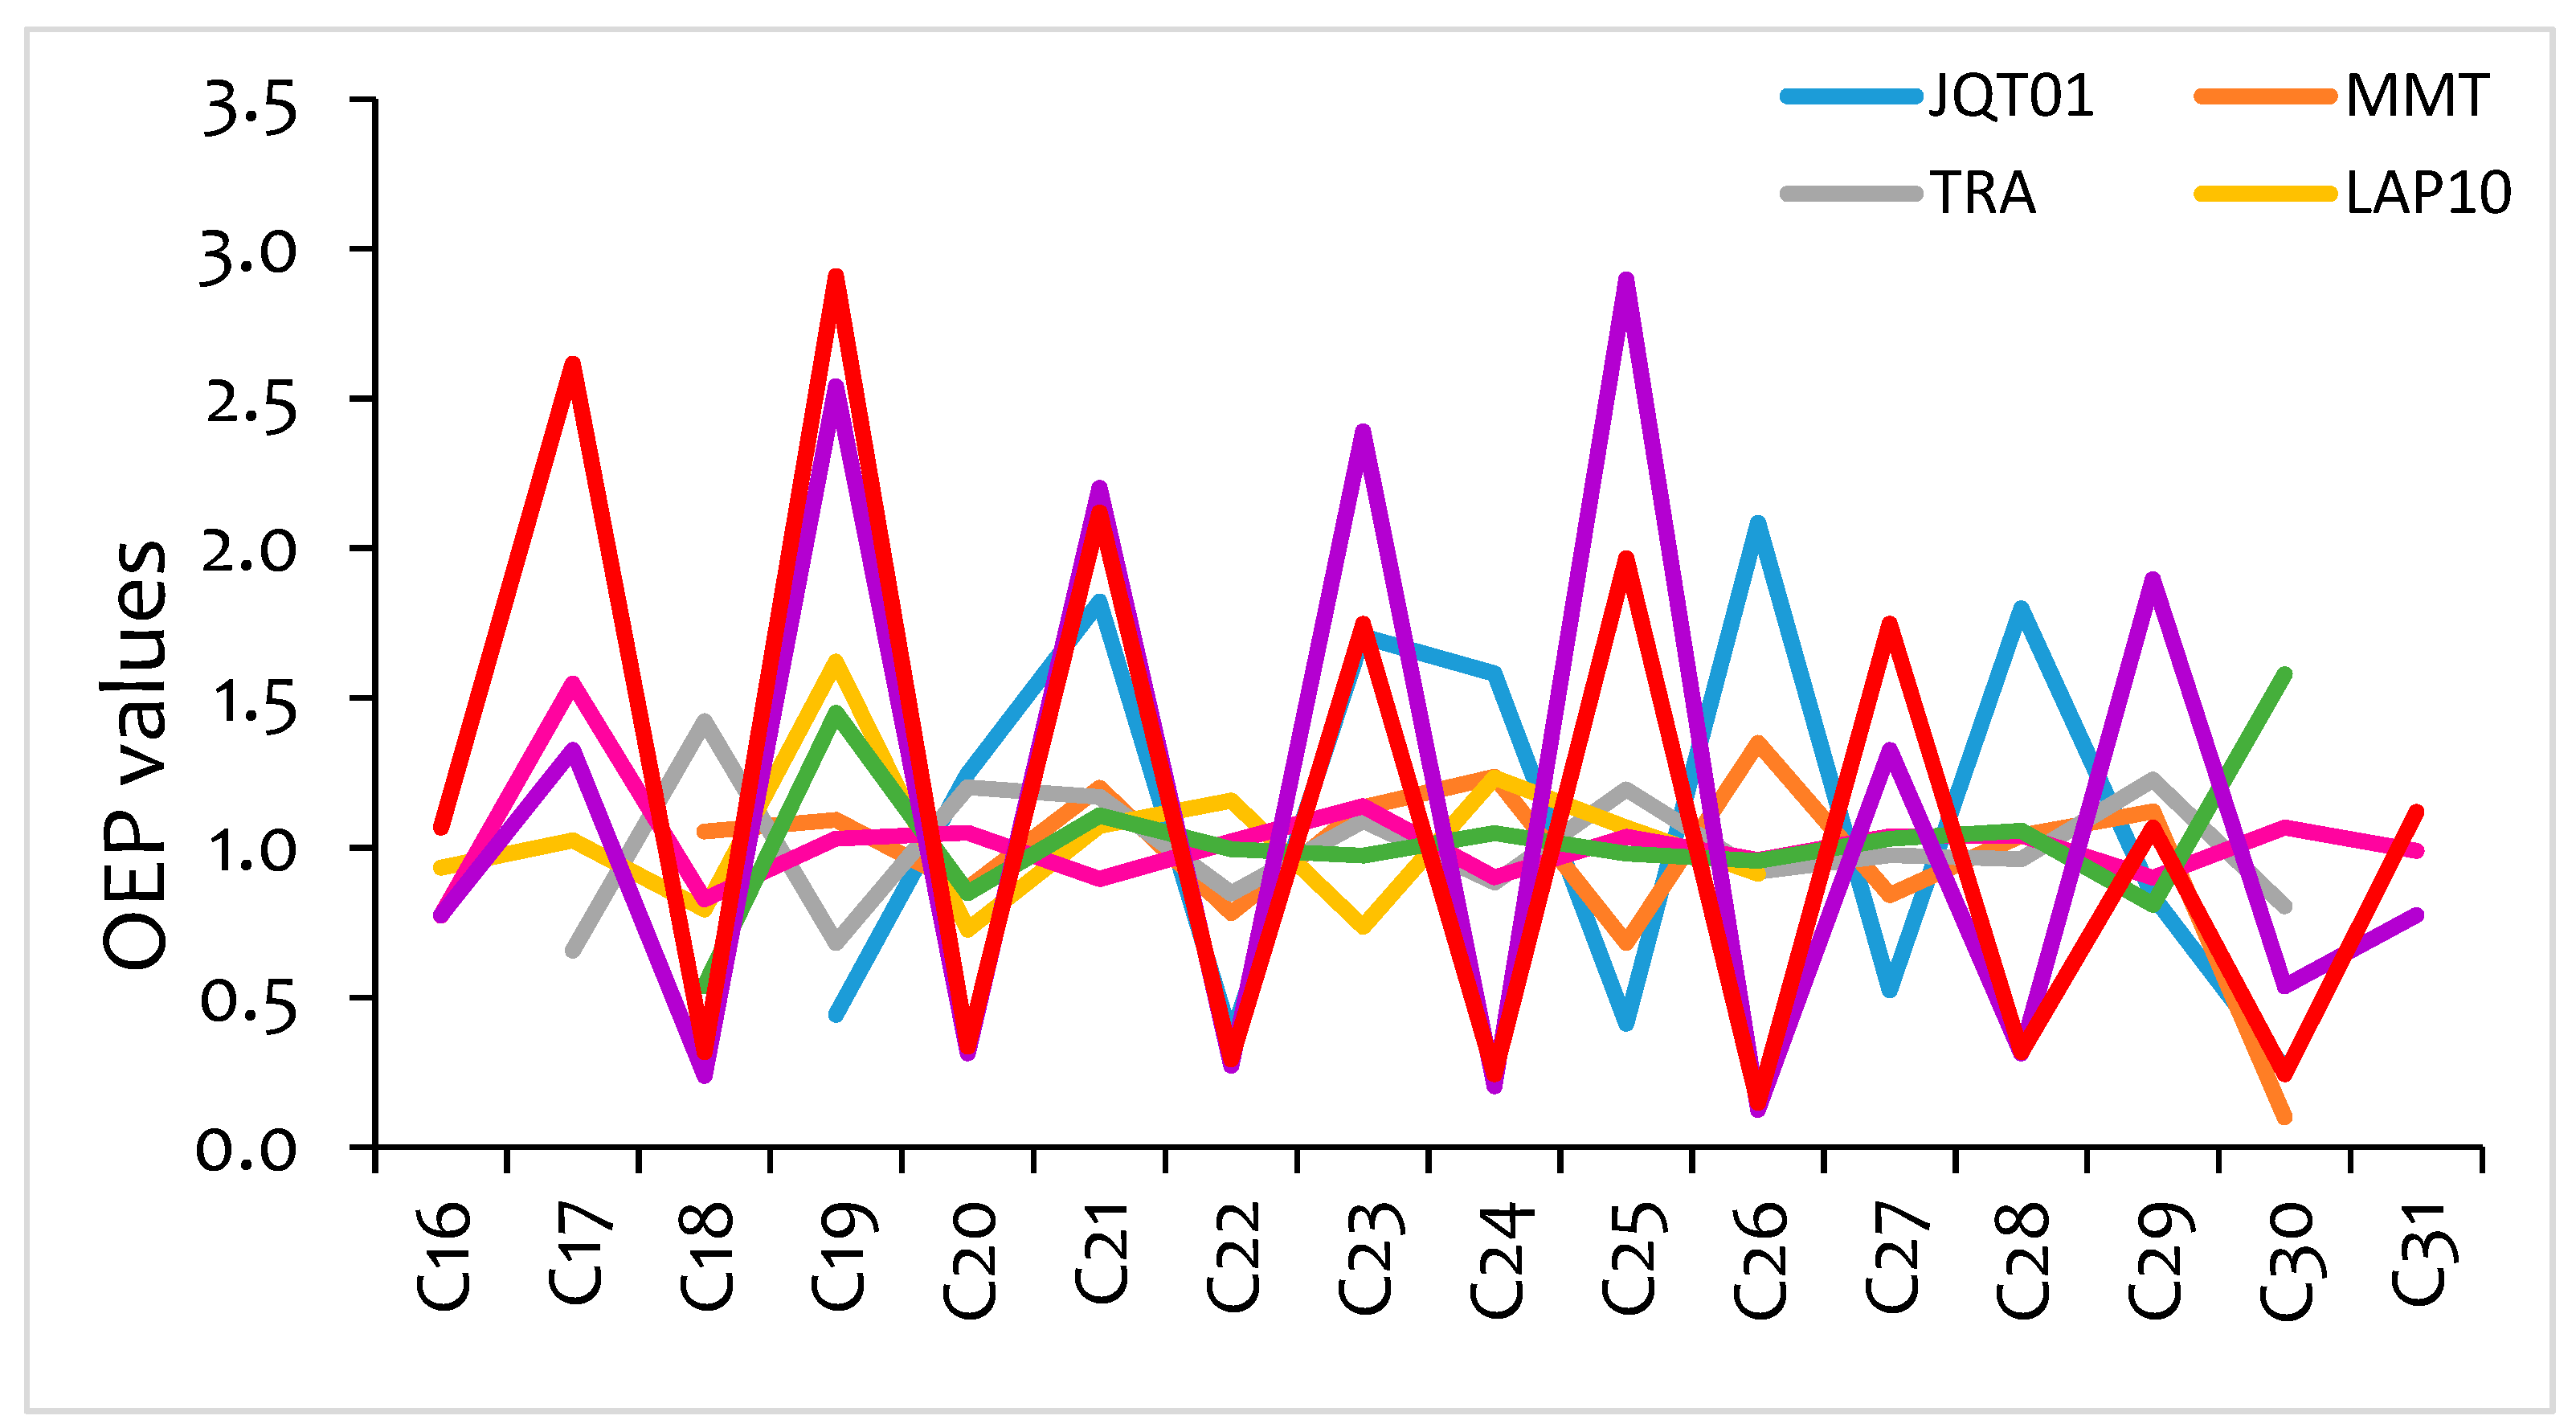
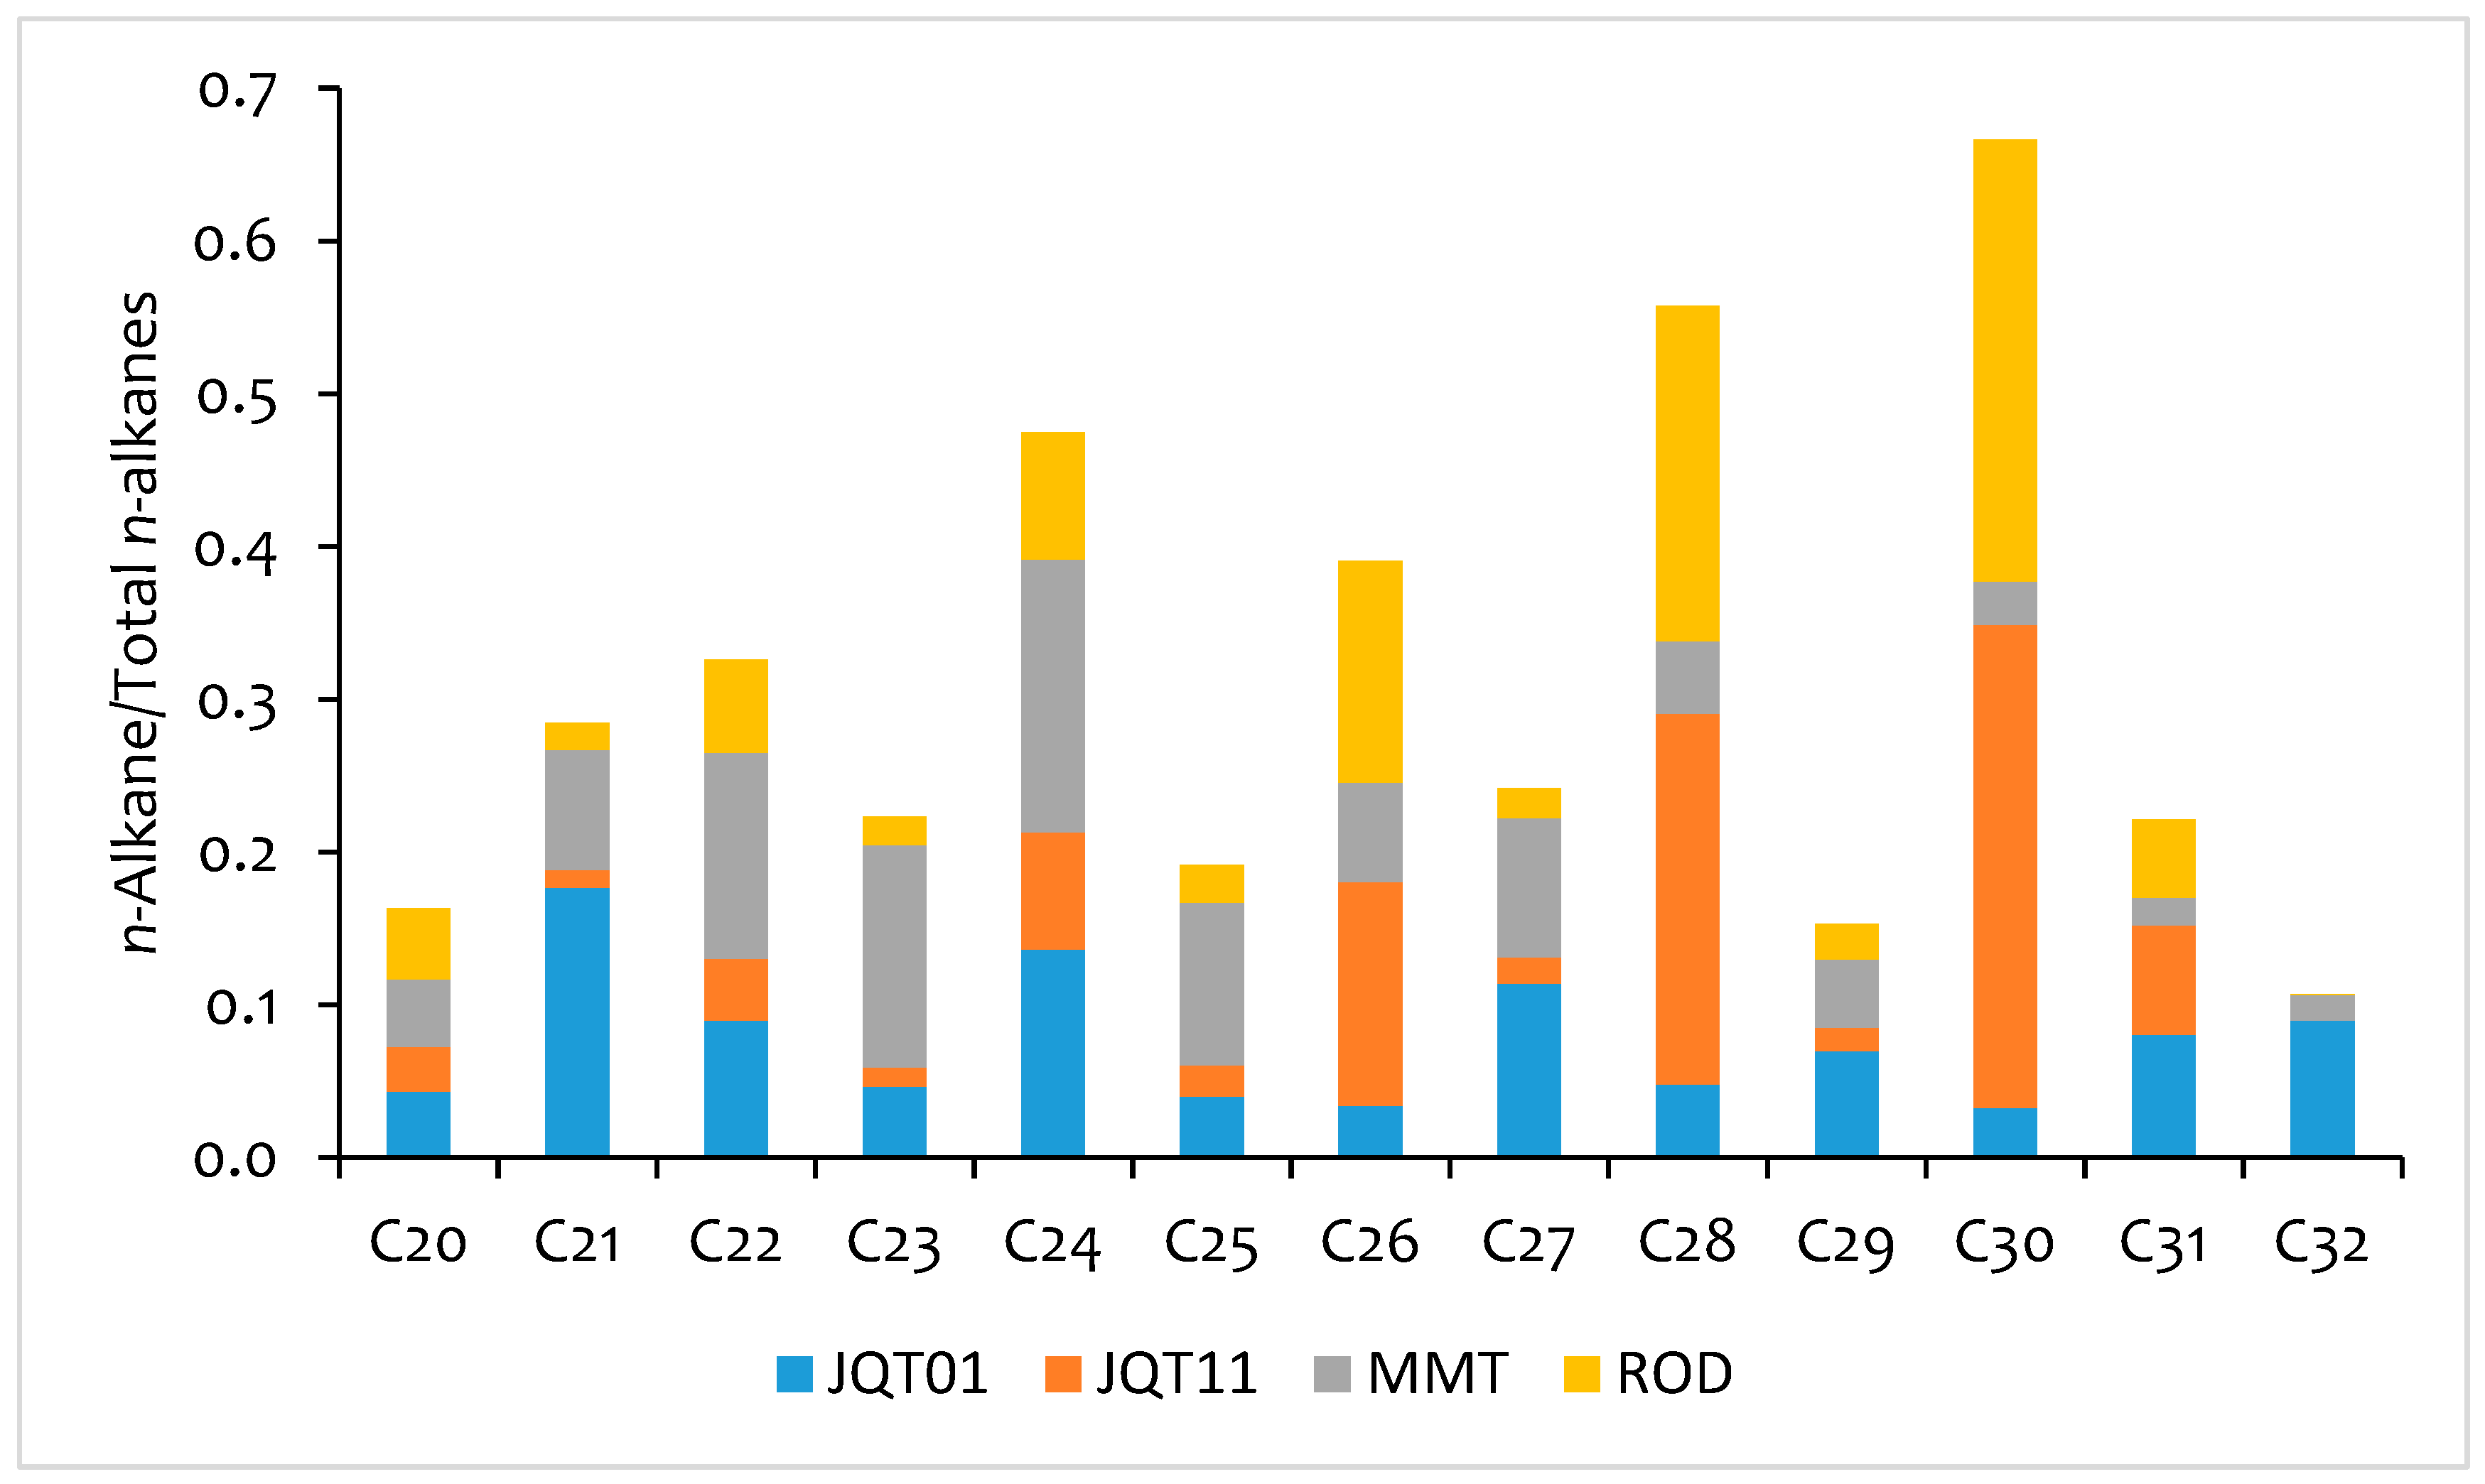
3.3. Species Contribution

Four chromatograms were chosen to illustrate the difference in profiles according to the site variations (JQT11, ROD, ARN, TRA—Figure 3). The hump areas shown in two chromatograms are chracterized as unresolved complex mixtures (UCM), a term used as one indicator of petroleum or fossil fuel-burning contamination, which represents the area of compounds unable to be resolved by simple gas chromatography. The combination of the two-dimensional gas chromatography technique coupled to time-of-flight mass-spectrometry (GC–TOF/MS) has been reported as a solution to resolve and identify these hydrocarbons individually [46].
Many studies presented similar humps characterized by petroleum contributions in different environmental matrices, such as sediments, rivers, and road dust [20,46]. The hydrocarbons that originate in the UCM hump are predominantly products of biodegraded crude oil and refined fractions, such as lubricating oils. Booth et al. [46] have shown that most of the compounds contained in the UCM area were derived from cyclic hydrocarbons such as alkylbenzenes and tetralins that are potentially toxic to humans.
Comparing the four chromatograms, ROD and JQT exhibited similar distributions and negligible unresolved complex mixture areas while the chromatograms regarding ARN and TRA, two open areas, contain large UCM areas (Figure 3). ARN and TRA showed higher contributions of heavy molecular weight hydrocarbons unresolved by gas chromatography than ROD and JQT.
Another calculation adopted by previous studies [27] is the ratio between the unresolved area of chromatogram to the total resolved area. This ratio describes the degree of contamination by hydrocarbons emitted by heavy fraction of petroleum [36]. ROD and JQT presented ratios equal to 1.7 and 1.6, while ARN and TRA obtained values of 17 and 5, respectively. With these values, it is possible to infer that ARN and TRA sites have different sources of pollution that can contribute significantly to this unresolved mixture.
A large bus corridor is surrounded by five important hospitals at ARN. The municipal legislation requires hospitals to have their own power generator [47] which uses fossil fuels to produce energy. These emissions can add particulate matter containing organic compounds.
At the TRA site, an industrial neighborhood where most of the commercial buildings are for transportation but chemical and plastic industries are also present as well as one of the largest Brazilian airports that is over 4 km away from the sampling site. Masiol and Harrison [48] reported that jet fuel burning emits normal paraffin, iso-paraffin, cycloparaffin, aromatic and alkene classes. The PM emitted by these sources may contain species impacting the atmosphere and air quality.
There are different n-alkane ranges that can be selected to calculate the carbon preference index (CPI), which can show the biogenic versus anthropogenic predominance or petrogenic contribution [49,50]. Considering the CPI1 (Table 3), which indicates the impact of biogenic and anthropogenic sources [49], all the sites demonstrate a strong influence of anthropogenic sources, since the values are close to 1. These results are similar with the CPI1 (mean = 1.3) obtained during the winter in 2005 for PM2.5 collected at the Chinese megacity Nanjing, at a typical urban site [51].
The CPI2 shows the contribution of petrogenic hydrocarbons [49]. According to the literature, the smaller values represent a higher contribution of anthropogenic activities [52]. In this study, the smaller values were for JQT11 (mean = 0.3) and ROD (mean = 0.4), indicating again, the high impact of petrogenic emissions.
Table 3 also shows average chain lengths (ACL) at all sites, according to calculation previous presented in Section 2.3 Data Analysis. ACL is a source index relative to lipids, for n-alkanes. The ACL values ranged from 26 (MMT) to 29 (JQT11). According to previous studies, in tropical climates, ACL values between C22 and C29 were indicative of mixed source contributions [28,53]. Additionally, ACL is a parameter that can be used as an ambient temperature indicator, by the fact that higher values were observed during warm seasons and lower values in cold periods [54]. However, this parameter must be used sparingly, since cloistered places may show different behavior. The samples collected during the warm season were from LAP13 and ARN site, the other samplings were conducted during cold season.
The percentage of petrogenic n-alkanes (%PNA) falls between 75% (JQT01) and 99% (ROD). Comparing JQT results obtained in the 2001 and 2011 samples, the %PNA was lower in 2001 (75%) than in 2011 (99%). This difference could be attributed to the increase in the number of vehicles in the city over time. In 2001, there were over 4 million vehicles running in São Paulo, while by 2011 the number increased to 7 million [1], representing an increase of 78%.
It is worth noting that, while the CPI values and Cmax (Table 3) point to the prevalence of petrogenic sources (LAP10, MMT, JQT11, ROD, ARN, TRA), other sources may have minor roles, such as emissions from activities around the sites, parks (JQT), food commerce (LAP, ARN) and industries (ROD and TRA).
The OEP ratio is an odd-to-even calculation, which is a measure of the local odd-even ratio [29]. It is a useful tool that can provide information about the variety of sources of n-alkanes [55]. The OEP measure was established to eliminate mathematical limitations found in the CPI ratio, as mentioned before in Section 2.3. Data analysis. Although the CPI ratio is the most popular calculation for n-alkanes, high oscillations in the concentration observed for odd/even carbon could appear and the errors of this parameter can increase as the number of carbon chains decreases [56]. In an attempt to use distinguishing running ratios for correlation determinations, the OEP function was established to avoid these fluctuations.
In previous studies, OEP values were plotted against carbon chain length to make the OEP curves. Tunnels sites (JQT01, JQT11, and ROD) showed a similar flat profile, with the largest variation values (ranging from 0.3 to 2.9), and the highest values were below C25 (Figure 4), which provides evidence for the predominance of the anthropogenic contribution [19]. The other sites (MMT, TRA, ARN, LAP10, and LAP13) also presented a shape of OEP curves similar to those for urban sites (Figure 4) reported by previous literature studies conducted at sites highly impacted by vehicular emissions [30,55]. Despite this, the range of values was smaller (between 0.1 and 1.6) than the three tunnel samplings, which may indicate one major source for each site [56].
Figure 5 shows the ratio between individual n-alkane concentrations and the sum of n-alkanes for each tunnel ranging from C20 to C32 in an attempt to evaluate the specific contribution of each compound to the total concentration. It was expected that n-alkanes below C25 showed higher contributions relating to the sum of concentrations than the compounds above C25, since the first range (<C25) is attributed to anthropogenic sources, which is dominant inside tunnels [5,18]. It was observed that the percentage of even homologs from C20 to C30 was similar to those of the JQT11 and ROD tunnels. In fact, JQT11 prioritizes LDV during the peak period, prohibiting HDV during this period [56]. For the samples collected 10 years before, MMT and JQT01, at a time when Brazilian legislation allowed HDV circulation at both sites, n-alkanes lower than C25 were predominant in these locations, indicating a high contribution of diesel burning [19].
Since 2008, the percentage of alcohol in Brazilian fuels has increased to 25% [32]. Pacheco and collaborators [57] reported that the addition of ethanol to gasoline may increase the emissions of aldehydes, acetic acid and unburned alcohol, negatively affecting the air quality. For the samples collected at JQT in 2001, C21, C24 and C27 were the most abundant homologs as opposed the samples collected in 2011, where C26, C28 and C30 presented the highest concentrations. The change in Brazilian fuels between these years resulted in reducing PM concentrations in the urban areas, but the non-exhaust vehicular emissions such as tire, brake, and road surface wear increased [58], which can be attributed to different profiles observed for JQT01 and JQT11 (Figure 5).
The homologous distributions presented for the samples collected in tunnels with the predominance of diesel-burning emission, presented distinct shapes. The results show that for MMT samples from 2001, C22, C23 and C24 were the most abundant homologs, whereas for ROD collected in 2011 the most abundant were C26, C28 and C30, showing different contributions.
According to the literature, the most abundant n-alkane can be used with respect to the relative source input. Cmax lower than C25 is characteristic of anthropogenic emissions, more specifically by fossil fuel burnings [6,40]. The present study shows different profiles from the studies conducted in other countries; it may be due to the large variety of fuels burned in the Brazilian fleet (Cmax varied from C21 to C32). Besides the fuels commonly used in other countries, in 2004, a governmental program was implemented in Brazil and biofuels were added to diesel [59]. It is expected that this implementation will change the species contribution.

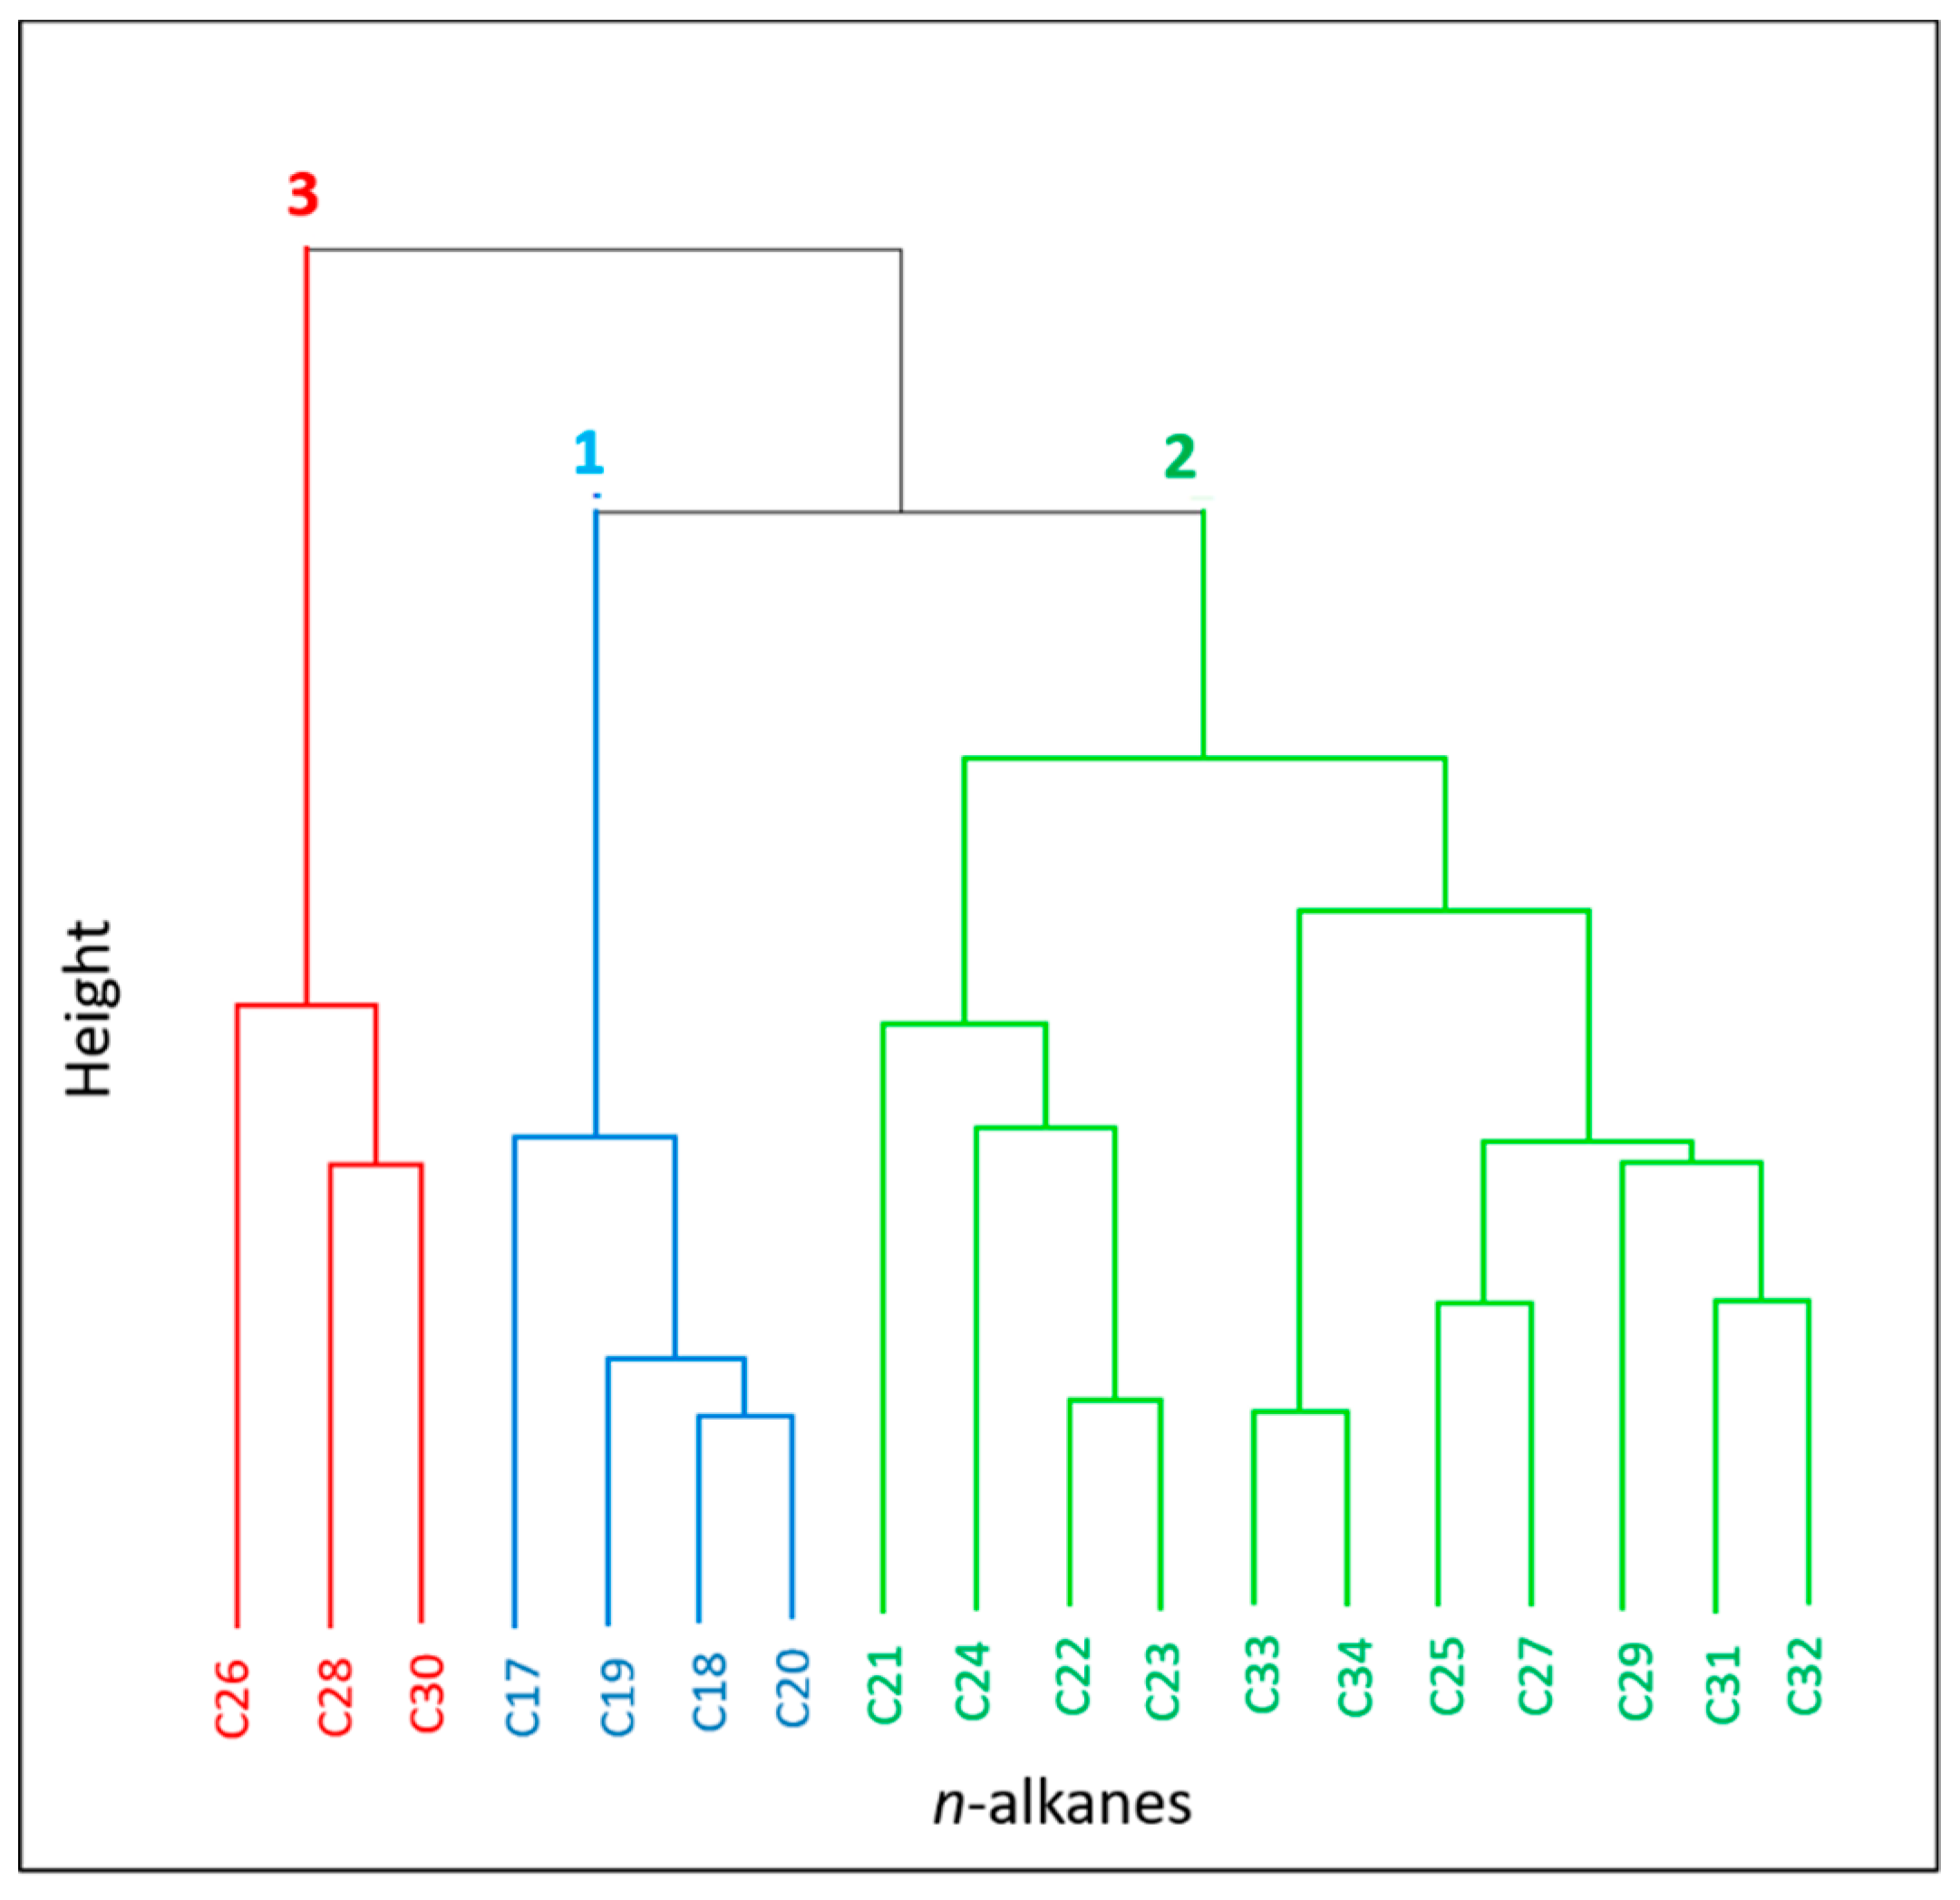
3.4. Statistical Correlations

Pearson’s correlations were also calculated using the n-alkanes concentrations. The results showed that samples collected at sites with the influence of biodiesel burnt in buses (LAP10, LAP13 and ARN), were strongly correlated with the homologues ranging from C22 to C32 (R = 0.62–0.99). For samples collected at the ROD and TRA sites where the trucks are fueled with biodiesel, the correlations were also stronger, from C15 to C32 (R = 0.57–0.99).
On the other hand, low correlations were found for JTQ samples collected during different years. The prohibition of HDV traffic in this tunnel after 2008 may have affected the n-alkanes distribution. Results from both tunnels with similar characteristics (ROD and MMT) presented high correlations (R = 0.54–0.99) between C15 and C25.
Rogge et al. [18] reported that the profile of n-alkanes emitted by fossil fuel burning presented a bimodal distribution with higher emission rates between C20 and C22 and C24 and C27. LAP10 and LAP13 showed a bimodal distribution between C19 and C21 and from C24 to C29. In general, the samples collected at tunnels (TJQ, MMT and ROD) presented a unimodal distribution with even carbon n-alkanes higher than odd carbon n-alkanes. The TRA and ARN samples exhibited a unimodal profile from C20 to C29. At a site with a predominant emission of fossil fuel, an increase of lower molecular weight n-alkanes (≤C22) reflects the presence of fossil fuel burning [40].
Hierarchical cluster analysis (HCA) is an unsupervised agglomerative technique that examines inter-point distances between all samples in the data set and represents this information in the form of a two-dimensional graph, the dendrogram. Through the dendrogram, it is possible to visualize the groupings and similarity between the samples and/or variables. Figure 6 outlines grouping tendencies of n-alkanes that showed high connections for all sites. In this way, three groups of n-alkanes with good correlation were observed, they are: (1) C17, C18, C19 and C20; (2) C22, C23, C24, C27, C29, C31, C32, C33 and C34 and lastly (3) C26, C28 and C30.
According to a previous study, 95% of n-alkanes emitted by diesel burning have carbon numbers less than C19 [18]. By comparison, group 1 might be associated mostly with diesel burning.
Group 2 contains more compounds than the other groups, which is consistent with results obtained previously by Pearson correlation, where compounds from C22 to C32 showed great associations. Similar results were obtained by independent mathematical methods. This group can be attributed mainly to anthropogenic emissions since the biogenic contribution tends to be small at all sites. According to a previous study, plant wax concentrations were attributed to high-molecular-weight n-alkanes (from C24 to C35) [59]; however, the waxes of n-alkanes are presented in the rubber material which produces tires, as antiozonants, to protect it from ozone attack [18]. Therefore, compounds grouped in this cluster with long carbon chains (C29, C31, C32, C33) can be attributed mostly to tire wear particles generated during the rolling shear of the tire tread against the road surface.
The third group contained three even n-alkanes which can be attributed to different sources, since these even compounds have carbon long chains that can be emitted by a source mixture with anthropogenic and biogenic contribution.

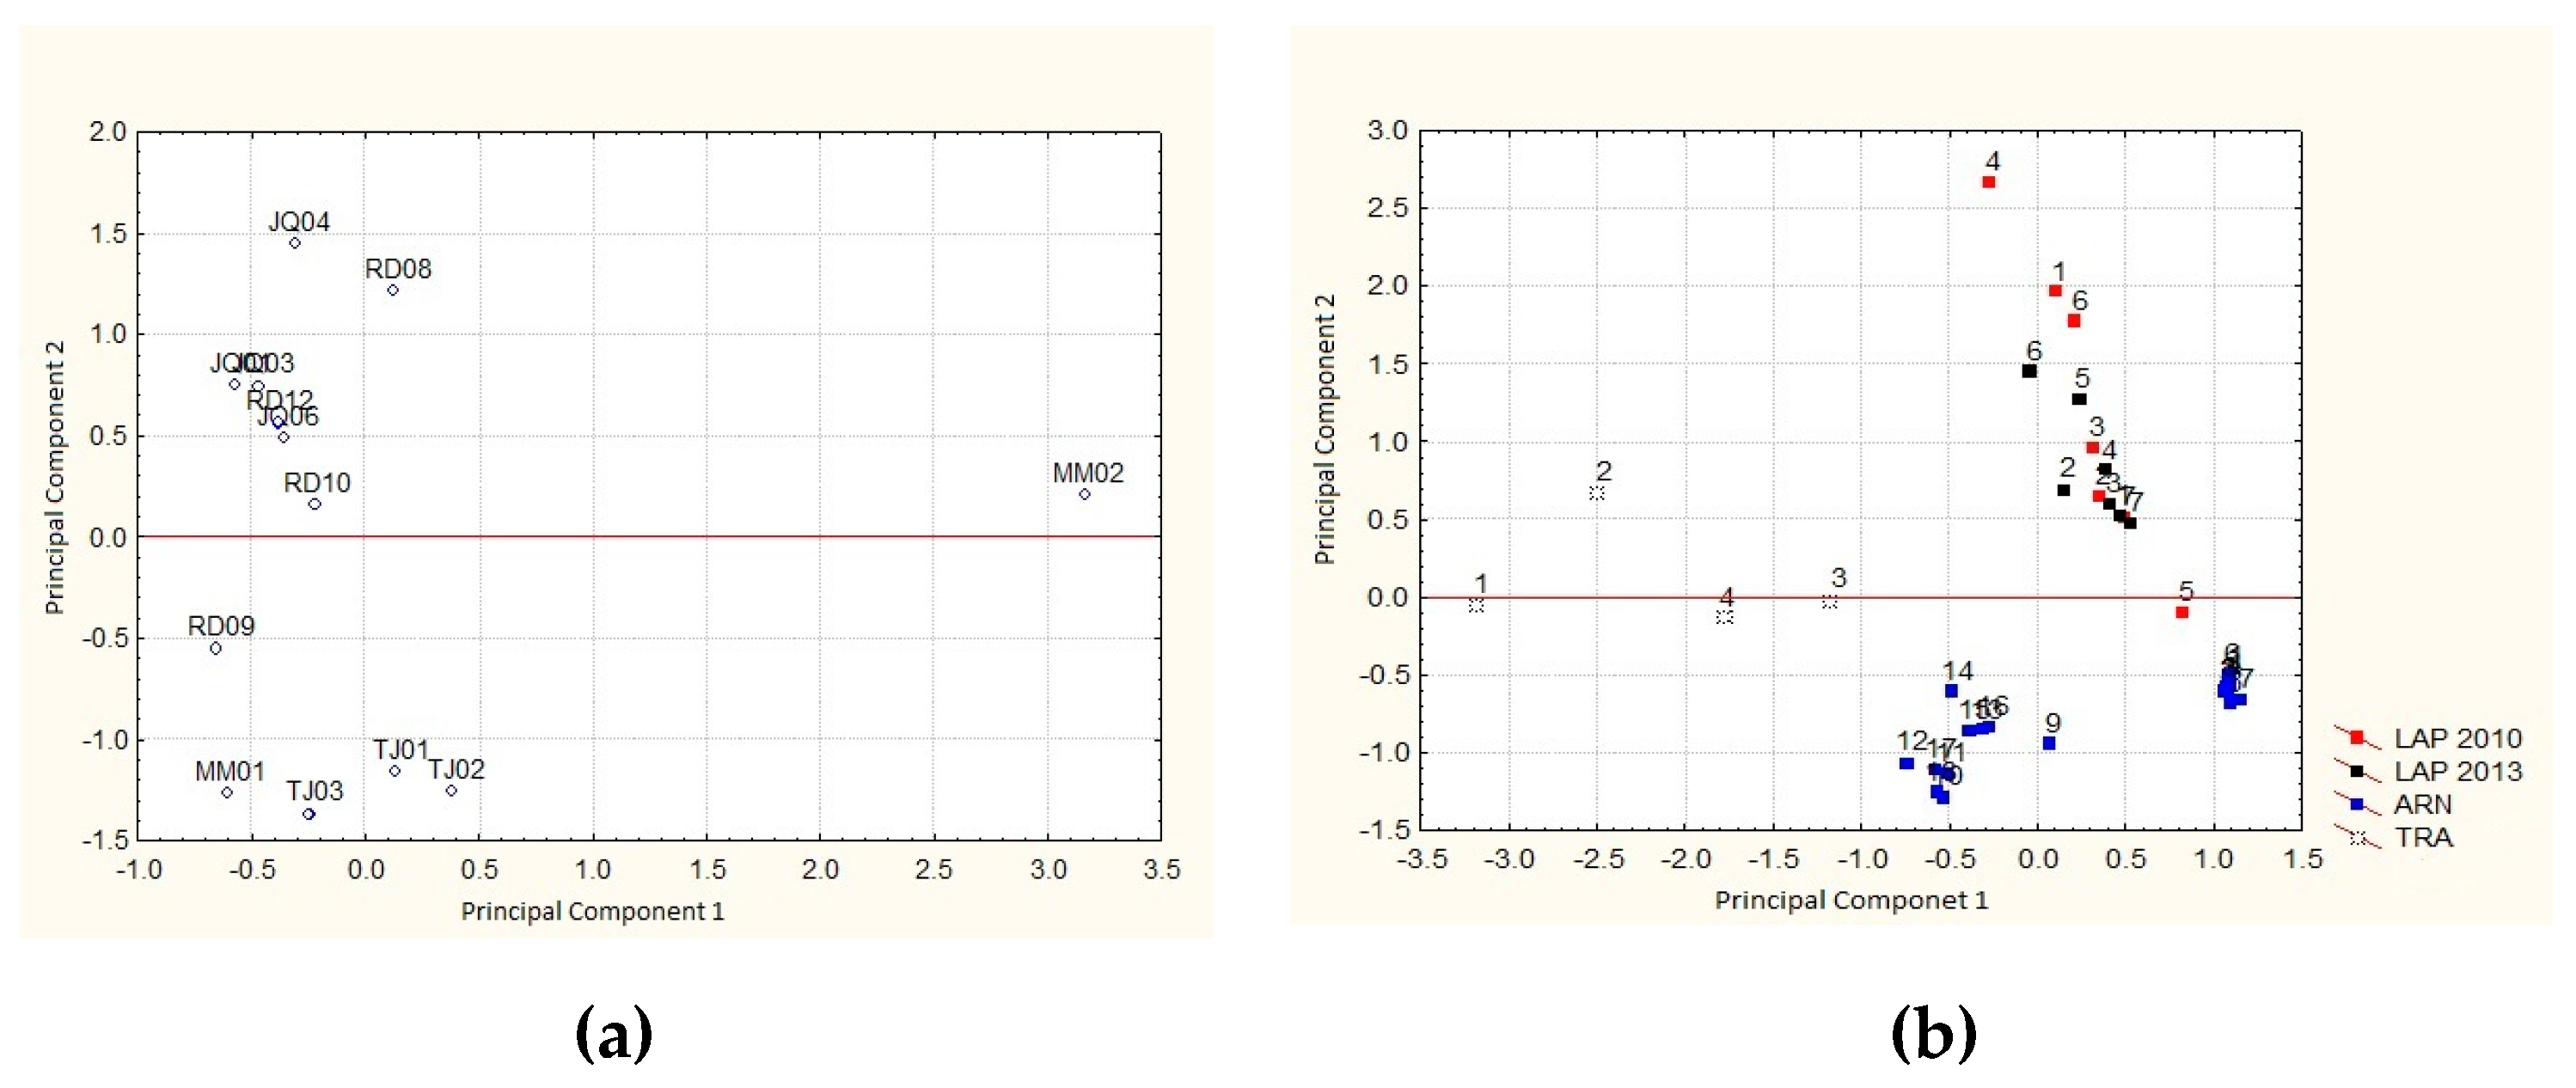
3.5. Principal Component Analysis (PCA)

PCA is a useful tool for understanding emission sources. To define the principal sources of n-alkanes, enrichment factors associated with aerosols sources were calculated for all sites. Due to a large range of concentrations, PCA was calculated in two ways: one for large value concentrations (JQT01, MMT, JQT11 and ROD) and the other for small-value concentrations (LAP10, LAP13, ARN and TRA). Table A1 (Appendix A) shows the scores of the two principal components for large and small values. Principal component 1 accounts for 56% of the total data variance, while the principal component 2 explained 32% for the data with large values. In contrast, for small values, PC1 corresponded to 80% and PC2 to 10%.
For large-value concentrations (JQT01, MMT, JQT11 and ROD), most of n-alkanes were explained by factor 1 (Figure 7a). This factor ranged from C19 to C29, (except to C26 and C28). The range from C19–C25 is often attributed to fossil fuel emissions, as this carbon range is predominant in anthropogenic activities [60]. Rogge et al. [18] showed that vehicular tires have higher n-alkanes in their compositions, revealing different compositions with additional pyrolysis products. Therefore, this factor presents mixed sources.
It seems that the samples collected at JQT11 (Figure 7a) presented a higher contribution to factor 2, due to the predominance of even n-alkanes (C18, C26, C28 and C30). As described earlier, this tunnel is characterized by light-duty vehicles.
To permit easier graphical visualization, the following nomenclatures were adopted: JQT01 as TQ, MMT as MM, JQ is JQT11 and RD is ROD (Figure 7a).
For the sites with lower concentration values of n-alkanes (LAP10, LAP13, ARN and TRA) factor 1 was attributed predominantly to buses emissions (combustion of diesel plus biodiesel) since this cluster is well correlated (Figure 7b). On the other hand, for TRA samples, different sources besides truck emissions, such as industrial emissions, as expected, can impact this site. Factor 2 with n-alkanes (C20 and C21) well correlated can be attributed to unknown sources.

4. Conclusions

The present study reports particulate matter and n-alkane concentrations at different sites impacted by vehicular emission in Brazil. Regarding PM size and concentrations, samples collected at tunnels in 2001 presented higher levels since TSP samples were collected; the addition of biodiesel was implemented years later. The massive difference between the samples collected at JQT in 2001 and 2011 was attributed to PM size and, especially, to the restriction of truck circulation implemented in 2008 by the local government of São Paulo city. The bus station in Salvador (LAP) presented a decrease in PM concentration between 2010 and 2013 probably due to a change in the station’s architecture which provided better air circulation at the site.
Despite the fact that PM concentration has decreased in smaller aerosol fractions, the n-alkanes concentrations increased, highlighting the predominance of organic compounds in the fine PM fraction. The n-alkane concentrations were characterized mostly by anthropogenic emissions at all sites, as expected for areas strongly impacted by vehicular emissions. The chromatographic profiles were different for samples collected at tunnels that showed a low contribution of an unresolved complex mixture when compared to the samples collected at urban sites (ARN and TRA). This difference can be attributed to other possible PM local sources, such as power generators and industries.
The CPI values suggest the prevalence of petrogenic sources at LAP10, MMT, JQT11, ROD, ARN and TRA. The OEP values were typical of urban areas and the profiles were similar in spite of different site characteristics. Among the sites, Cmax varied from C21 to C32, showing the complexity of emissions of different fuels.
Pearson’s correlations indicated the different site characteristics. The sites affected by buses emissions (LAP10, LAP13 and ARN) were strongly correlated; also well correlated were the samples collected in the ROD and in TRA, impacted by diesel emissions. JTQ01 and JQT11 samples presented poor correlations, probably due to truck restriction after 2008.
PCAs were calculated in two ways: for large and small concentrations. In sites with large values, most of n-alkanes were explained by factor 1, attributed to mixed sources (vehicular and tires emissions), whereas factor 2 was more affected by light-duty vehicles emissions. PCA for small values were attributed to bus emissions (factor 1) and for unknown sources (factor 2).
The use of alternative fuels such as those used in the Brazilian fleet can lead to cleaner emissions, but this should be further studied. It would be interesting if the legislation were more rigid, recommending lower concentrations of particulate material, consequently reducing the concentrations of many pollutants.

Author Contributions

Conceptualization, P.C.V.; data curation, S.C. and P.C.V.; methodology, S.C.; software, S.C. and R.E.B.; validation, S.C. and R.E.B.; formal analysis, S.C.; investigation, S.C.; resources, P.C.V.; writing—original draft preparation, S.C.; writing—review and editing, P.C.V.; supervision, P.C.V.; project administration, P.C.V.; funding acquisition, S.C., and P.C.V. All authors have read and agreed to the published version of the manuscript.

Funding

This research was funded by FAPESP (grant number 2016/23339-1 and grant number 2008/58104-8) and CNPq (grant number 301503/2018-4).

Acknowledgments

The authors thank Rogério L. da Silva and Pedro A.P. Pereira for collaboration. The authors gratefully acknowledge INCT-Energy and Environment.

Conflicts of Interest

The authors declare no conflict of interest.

Appendix A

Table A1. Factors of principal components analysis.
Large ValuesSmall Values
PC1PC2 PC1PC2
C17--C17−0.931-
C180.4720.781C18−0.931-
C190.7570.444C19−0.8640.324
C200.7610.481C20−0.6720.716
C210.870−0.394C21−0.5450.768
C220.964-C22−0.892-
C230.968-C23−0.923-
C240.952-C24−0.926-
C250.964-C25−0.873−0.303
C26-0.961C26−0.970-
C270.976-C27−0.984-
C28-0.967C28−0.984-
C290.913-C29−0.980-
C30−0.3280.925C30−0.910-
C31-0.634C31−0.966-
Values lower than 0.250 in module are omitted; values higher than 0.700 in module are in bold.

References

  1. Denatran—Departamento Nacional de Trânsito. Frota de Veículos. 2018. Available online: https://www.denatran.gov.br/estatistica/635-frota-2018 (accessed on 30 June 2018).
  2. Brito, J.; Rizzo, L.V.; Herckes, P.; Vasconcellos, P.; Caumo, S.E.S.; Fornaro, A.; Ynoue, R.; Artaxo, P.; Andrade, M.F. Physical–chemical characterisation of the particulate matter inside two road tunnels in the São Paulo Metropolitan Area. Atmos. Chem. Phys. Discuss. 2013, 13, 12199–12213. [Google Scholar] [CrossRef] [Green Version]
  3. Pereira, G.; Caumo, S.E.S.; Soares, S.; Teinilä, K.; Custódio, D.; Hillamo, R.; Vasconcellos, P.C.; Alves, N.D.O.; Alves, C. Chemical composition of aerosol in São Paulo, Brazil: Influence of the transport of pollutants. Air Qual. Atmosphere Health 2016, 10, 457–468. [Google Scholar] [CrossRef]
  4. WHO. Air Quality Guidelines for Particulate Matter, Ozone, Nitrogen Dioxide and Sulfur Dioxide; WHO: Geneva, Switzerland, 2005; Available online: http://www.euro.who.int/Document/E87950.pdf (accessed on 10 December 2019).
  5. Simoneit, B.R.; Sheng, G.; Chen, X.; Fu, J.; Zhang, J.; Xu, Y. Molecular marker study of extractable organic matter in aerosols from urban areas of China. Atmos. Environ. Part A. Gen. Top. 1991, 25, 2111–2129. [Google Scholar] [CrossRef]
  6. Omar, N.Y.M.J.; Bin Abas, M.R.; Rahman, N.A.; Tahir, N.M.; Rushdi, A.; Simoneit, B.R.T. Levels and distributions of organic source tracers in air and roadside dust particles of Kuala Lumpur, Malaysia. Environ. Earth Sci. 2007, 52, 1485–1500. [Google Scholar] [CrossRef]
  7. Simoneit, B.R.; Kobayashi, M.; Mochida, M.; Kawamura, K.; Lee, M.; Lim, H.; Turpin, B.J.; Komazaki, Y. Composition and major sources of organic compounds of aerosol particulate matter sampled during the ACE-Asia campaign. J. Geophys. Res. Space Phys. 2004, 109, 1–22. [Google Scholar] [CrossRef] [Green Version]
  8. Duan, F.; He, K.; Liu, X. Characteristics and source identification of fine particulate n-alkanes in Beijing, China. J. Environ. Sci. 2010, 22, 998–1005. [Google Scholar] [CrossRef]
  9. Finlayson-Pitts, B.J.; Pitts, J.N. Kinetics and Atmospheric Chemistry. In Chemistry of the Upper and Lower Atmosphere; Elsevier: Amsterdam, The Netherlands, 2000; pp. 130–178. [Google Scholar]
  10. Atkinson, R. Gas-phase tropospheric chemistry of volatile organic compounds: 1. Alkanes and alkenes. J. Phys. Chem. Ref. Data 1997, 26, 215–290. [Google Scholar] [CrossRef] [Green Version]
  11. Bidleman, T.F.; Billings, W.N.; Foreman, W.T. Vapor-Particle Partitioning of Semivolatile Organic Compounds: Estimates from Field Collections. Environ. Sci. Technol. 1986, 20, 1038–1043. [Google Scholar] [CrossRef]
  12. Gill, C.O.; Ratledge, C. Toxicity of n-Alkanes, n-Alk-1-enes, n-Alkan-1-ols and n-Alkyl-1-bromides towards Yests. J. Gen. Microbiol. 1972, 72, 165–172. [Google Scholar] [CrossRef] [Green Version]
  13. Barnes, I.; Bastian, V.; Becker, K.; Fink, E.; Zabel, F. Reactivity studies of organic substances towards hydroxyl radicals under atmospheric conditions. Atmos. Environ. (1967) 1982, 16, 545–550. [Google Scholar] [CrossRef]
  14. Pitts, J.N. Nitration of gaseous polycyclic aromatic hydrocarbons in simulated and ambient urban atmospheres: A source of mutagenic nitroarenes. Atmos. Environ. (1967) 1987, 21, 2531–2547. [Google Scholar] [CrossRef]
  15. Enya, T.; Suzuki, H.; Watanabe, T.; Hirayama, T.; Hisamatsu, Y. 3-Nitrobenzanthrone, a Powerful Bacterial Mutagen and Suspected Human Carcinogen Found in Diesel Exhaust and Airborne Particulates. Environ. Sci. Technol. 1997, 31, 2772–2776. [Google Scholar] [CrossRef]
  16. Sicre, M.; Marty, J.; Saliot, A.; Aparicio, X.; Grimalt, J.O.; Albaiges, J. Aliphatic and aromatic hydrocarbons in different sized aerosols over the Mediterranean Sea: Occurrence and origin. Atmos. Environ. (1967) 1987, 21, 2247–2259. [Google Scholar] [CrossRef]
  17. Abu-Allaban, M.; A Gillies, J.; Gertler, A.W.; Clayton, R.; Proffitt, D. Tailpipe, resuspended road dust, and brake-wear emission factors from on-road vehicles. Atmos. Environ. 2003, 37, 5283–5293. [Google Scholar] [CrossRef]
  18. Rogge, W.F.; Hildemann, L.M.; Mazurek, M.A.; Cass, G.R.; Simoneit, B.R.T. Sources of fine organic aerosol. 3. Road dust, tire debris, and organometallic brake lining dust: Roads as sources and sinks. Environ. Sci. Technol. 1993, 27, 1892–1904. [Google Scholar] [CrossRef]
  19. Rogge, W.F.; Hildemann, L.M.; Mazurek, M.A.; Cass, G.R.; Simoneit, B.R.T. Sources of fine organic aerosol. 2. Noncatalyst and catalyst-equipped automobiles and heavy-duty diesel trucks. Environ. Sci. Technol. 1993, 27, 636–651. [Google Scholar] [CrossRef]
  20. Readman, J.W.; Fillmann, G.; Tolosa, I.; Bartocci, J.; Villeneuve, J.-P.; Catinni, C.; Mee, L.D. Petroleum and PAH contamination of the Black Sea. Mar. Pollut. Bull. 2002, 44, 48–62. [Google Scholar] [CrossRef]
  21. Instituto Brasileiro de Geografia e Estatística. Estatística Populacional Brasileira. 2017. Available online: https://cidades.ibge.gov.br/brasil/sp/sao-paulo/panorama (accessed on 30 June 2018).
  22. Vasconcellos, P.; Souza, D.Z.; Magalhães, D.; Da Rocha, G.O. Seasonal Variation of n-Alkanes and Polycyclic Aromatic Hydrocarbon Concentrations in PM10 Samples Collected at Urban Sites of São Paulo State, Brazil. Water Air Soil Pollut. 2011, 222, 325–336. [Google Scholar] [CrossRef]
  23. Da Silva, R.L. Hidrocarbonetos Alifáticos (n-alcanos) Associados ao Material Particulado Atmosferico da Estação da Lapa e Regiões no Entorno da Baía de Todos os Santos; Universidade Federal da Bahia: Salvador, Brazil, 2014. [Google Scholar]
  24. Vasconcellos, P.; Zacarias, D.; Pires, M.A.; Pool, C.S.; Carvalho, L.R. Measurements of polycyclic aromatic hydrocarbons in airborne particles from the metropolitan area of São Paulo City, Brazil. Atmos. Environ. 2003, 37, 3009–3018. [Google Scholar] [CrossRef]
  25. Caumo, S.; Vicente, A.; Custódio, D.; Alves, C.; Vasconcellos, P. Organic compounds in particulate and gaseous phase collected in the neighbourhood of an industrial complex in São Paulo (Brazil). Air Qual. Atmosphere Health 2017, 11, 271–283. [Google Scholar] [CrossRef]
  26. Wei, S.; Huang, B.; Liu, M.; Bi, X.; Ren, Z.; Sheng, G.; Fu, J. Characterization of PM2.5-bound nitrated and oxygenated PAHs in two industrial sites of South China. Atmos. Res. 2012, 109, 76–83. [Google Scholar] [CrossRef]
  27. Alves, C.A. Characterisation of solvent extractable organic constituents in atmospheric particulate matter: An overview. Anais da Academia Brasileira de Ciências 2008, 80, 21–82. [Google Scholar] [CrossRef] [Green Version]
  28. Gupta, S.; Gadi, R.; Mandal, T.; Sharma, S. Seasonal variations and source profile of n-alkanes in particulate matter (PM10) at a heavy traffic site, Delhi. Environ. Monit. Assess. 2016, 189. [Google Scholar] [CrossRef]
  29. Scala, R.S.; Smith, J.E. An improved measure of the odd-even predominance in the normal alkanes of sediment extracts and petroleum. Geochem. Et Cosmochim. Acta 1970, 34, 611–620. [Google Scholar] [CrossRef]
  30. Kavouras, I.G.; Stratigakis, N.; Stephanou, E.G. Iso- and anteiso-alkanes: Specific tracers of environmental tobacco smoke in indoor and outdoor particle-size distributed urban aerosols. Environ. Sci. Technol. 1998, 32, 1369–1377. [Google Scholar] [CrossRef]
  31. Kavouras, I.G.; Lawrence, J.; Koutrakis, P.; Stephanou, E.G.; Oyola, P. Measurement of particulate aliphatic and polynuclear aromatic hydrocarbons in Santiago de Chile: Source reconciliation and evaluation of sampling artifacts. Atmos. Environ. 1999, 33, 4977–4986. [Google Scholar] [CrossRef]
  32. Andrade, M.F.; Kumar, P.; Freitas, E.D.; Ynoue, R.Y.; Martins, J.; Martins, L.D.; Nogueira, T.; Perez-Martinez, P.J.; De Miranda, R.M.; Albuquerque, T.T.D.A.; et al. Air quality in the megacity of São Paulo: Evolution over the last 30 years and future perspectives. Atmos. Environ. 2017, 159, 66–82. [Google Scholar] [CrossRef] [Green Version]
  33. Gaffney, J.S.; Marley, N.A. Atmospheric chemistry and air pollution. Sci. World J. 2003, 3, 199–234. [Google Scholar] [CrossRef] [Green Version]
  34. CONAMA Conselho Nacional do Meio Ambiente. RESOLUÇÃO/conama/N.o 003 de 28 de junho de 1990. Brasil, 1990. Available online: http://www2.mma.gov.br/port/conama/res/res90/res0390.html (accessed on 25 June 2019).
  35. CETESB. Padrões de Qualidade do Ar. 2018. Available online: https://cetesb.sp.gov.br/ar/padroes-de-qualidade-do-ar/ (accessed on 6 June 2019).
  36. Alves, C.; Oliveira, C.; Martins, N.C.T.; Mirante, F.; Caseiro, A.; Pio, C.; Matos, M.; Silva, H.; Oliveira, C.; Camões, F. Road tunnel, roadside, and urban background measurements of aliphatic compounds in size-segregated particulate matter. Atmos. Res. 2016, 168, 139–148. [Google Scholar] [CrossRef]
  37. Liu, Y.; Gao, Y.; Yu, N.; Zhang, C.; Wang, S.; Ma, L.; Zhao, J.; Lohmann, R. Particulate matter, gaseous and particulate polycyclic aromatic hydrocarbons (PAHs) in an urban traffic tunnel of China: Emission from on-road vehicles and gas-particle partitioning. Chemosphere 2015, 134, 52–59. [Google Scholar] [CrossRef]
  38. Brito, J.; Carbone, S.; Dos Santos, D.A.M.; Dominutti, P.; Alves, N.D.O.; Rizzo, L.V.; Artaxo, P. Disentangling vehicular emission impact on urban air pollution using ethanol as a tracer. Sci. Rep. 2018, 8, 10679. [Google Scholar] [CrossRef] [PubMed] [Green Version]
  39. Simoneit, B.R.T.; Cardoso, J.N.; Robinson, N. An assessment of the origin and composition of higher molecular weight organic matter in aerosols over Amazonia. Chemosphere 1990, 21, 1285–1301. [Google Scholar] [CrossRef]
  40. Simoneit, B.R.T. Organic matter of the troposphere-III. Characterization and sources of petroleum and pyrogenic residues in aerosols over the western united states. Atmos. Environ. (1967) 1984, 18, 51–67. [Google Scholar] [CrossRef]
  41. Vasconcellos, P.C.; Carvalho, L.R.F.; Pool, C.S. Volatile organic compounds inside urban tunnels of São Paulo City, Brazil. J. Br. Chem. Soc. 2005, 16, 1210–1216. [Google Scholar] [CrossRef] [Green Version]
  42. WHO. Air Quality Guidelines; WHO: Geneva, Switzerland, 2000. [Google Scholar]
  43. Pereira, P.A.D.P.; Lopes, W.A.; Carvalho, L.S.; Da Rocha, G.O.; Bahia, N.D.C.; Loyola, J.; Quiterio, S.L.; Escaleira, V.; Arbilla, G.; De Andrade, J.B. Atmospheric concentrations and dry deposition fluxes of particulate trace metals in Salvador, Bahia, Brazil. Atmos. Environ. 2007, 41, 7837–7850. [Google Scholar] [CrossRef]
  44. Wang, H.; Kawamura, K.; Shooter, D. Wintertime organic aerosols in Christchurch and Auckland, New Zealand: Contributions of residential wood and coal burning and petroleum utilization. Environ. Sci. Technol. 2006, 40, 5257–5262. [Google Scholar] [CrossRef] [PubMed]
  45. Vasconcellos, P.; Souza, D.Z.; Ávila, S.G.; Araújo, M.P.; Naoto, E.; Nascimento, K.H.; Cavalcante, F.S.; Dos Santos, M.; Smichowski, P.; Behrentz, E.; et al. Comparative study of the atmospheric chemical composition of three South American cities. Atmos. Environ. 2011, 45, 5770–5777. [Google Scholar] [CrossRef]
  46. Booth, A.M.; Sutton, P.A.; Lewis, C.A.; Lewis, A.C.; Scarlett, A.G.; Chau, W.; Widdows, J.; Rowland, S.J. Unresolved Complex Mixtures of Aromatic Hydrocarbons: Thousands of Overlooked Persistent, Bioaccumulative, and Toxic Contaminants in Mussels. Environ. Sci. Technol. 2007, 41, 457–464. [Google Scholar] [CrossRef] [PubMed]
  47. Paulo, F. Lei Ordinária 316—2001 São Paulo, SP. Legislacao Municipal do Estado de Sao Paulo; 2003. Available online: https://www.al.sp.gov.br/propositura/?id=107180&tipo=1&ano=2001 (accessed on 15 June 2019).
  48. Masiol, M.; Harrison, R.M. Aircraft engine exhaust emissions and other airport-related contributions to ambient air pollution: A review. Atmos. Environ. 2014, 95, 409–455. [Google Scholar] [CrossRef] [Green Version]
  49. Chen, Y.; Cao, J.; Zhao, J.; Xu, H.; Arimoto, R.; Wang, G.; Han, Y.; Shen, Z.; Li, G. n-Alkanes and polycyclic aromatic hydrocarbons in total suspended particulates from the southeastern Tibetan Plateau: Concentrations, seasonal variations, and sources. Sci. Total. Environ. 2014, 470, 9–18. [Google Scholar] [CrossRef] [PubMed]
  50. Li, W.; Peng, Y.; Bai, Z. Distributions and sources of n-alkanes in PM 2.5 at urban, industrial and coastal sites in Tianjin, China. J. Environ. Sci. 2010, 22, 1551–1557. [Google Scholar] [CrossRef]
  51. Wang, G.; Kawamura, K. Molecular characteristics of urban organic aerosols from Nanjing: A case study of a mega-city in China. Environ. Sci. Technol. 2005, 39, 7430–7438. [Google Scholar] [CrossRef]
  52. Tang, X.L.; Bi, X.H.; Sheng, G.Y.; Tan, J.; Fu, J.M. Seasonal Variation of the Particle Size Distribution of n-Alkanes and Polycyclic Aromatic Hydrocarbons (PAHs) in Urban Aerosol of Guangzhou, China. Environ. Monit. Assess. 2006, 117, 193–213. [Google Scholar] [CrossRef]
  53. Oros, D.R.; Standley, L.J.; Chen, X.; Simoneit, B.R. Epicuticular Wax Compositions of Predominant Conifers of Western North America. Zeitschrift für Naturforschung C 1999, 54, 17–24. [Google Scholar] [CrossRef]
  54. Sun, Q.; Xie, M.; Shi, L.; Zhang, Z.; Lin, Y.; Shang, W.; Wang, K.; Li, W.; Liu, J.; Chu, G. Alkanes, compound-specific carbon isotope measures and climate variation during the last millennium from varved sediments of Lake Xiaolongwan, northeast China. J. Paleolimnol. 2013, 50, 331–344. [Google Scholar] [CrossRef]
  55. Ladji, R.; Yassaa, N.; Balducci, C.; Cecinato, A.; Meklati, B.Y. Annual variation of particulate organic compounds in PM10 in the urban atmosphere of Algiers. Atmos. Res. 2009, 92, 258–269. [Google Scholar] [CrossRef]
  56. De Miranda, R.M.; Perez-Martinez, P.J.; Andrade, M.D.F.; Ribeiro, F.N.D. Relationship between black carbon (BC) and heavy traffic in São Paulo, Brazil. Transp. Res. Part D Transp. Environ. 2019, 68, 84–98. [Google Scholar] [CrossRef]
  57. Pacheco, M.T.; Parmigiani, M.M.M.; Andrade, M.D.F.; Morawska, L.; Kumar, P. A review of emissions and concentrations of particulate matter in the three major metropolitan areas of Brazil. J. Transp. Health 2017, 4, 53–72. [Google Scholar] [CrossRef] [Green Version]
  58. Ministério do Meio Ambiente. Proconve: Programa de Controle de Poluição do ar Por Veículos Automotores; Ministério do Meio Ambiente: Brasilia, Brazil, 2018.
  59. Bozzetti, C.; El Haddad, I.; Salameh, D.; Daellenbach, K.R.; Fermo, P.; Gonzalez, R.; Minguillon, M.C.; Iinuma, Y.; Poulain, L.; Elser, M.; et al. Organic aerosol source apportionment by offline-AMS over a full year in Marseille. Atmos. Chem. Phys. Discuss. 2017, 17, 8247–8268. [Google Scholar] [CrossRef] [Green Version]
  60. Xie, M.; Wang, G.; Hu, S.; Han, Q.; Xu, Y.; Gao, Z. Aliphatic alkanes and polycyclic aromatic hydrocarbons in atmospheric PM10 aerosols from Baoji, China: Implications for coal burning. Atmos. Res. 2009, 93, 840–848. [Google Scholar] [CrossRef]
Figure 1. Map of Brazil showing the location of sampling sites in Salvador and São Paulo.
Atmosphere 11 00643 g001
Figure 2. n-alkanes distribution (ng m−3) for (a) Salvador and (b) São Paulo sites.
Atmosphere 11 00643 g002aAtmosphere 11 00643 g002b
Figure 3. Chromatograms of four different sites (ROD, JQT, ARN and TRA) analyzed by gas chromatography coupled to flame ionization detection (GC-FID).
Atmosphere 11 00643 g003
Figure 4. Odd-to-even predominance (OEP) curve of the homologues series of n-alkanes.
Atmosphere 11 00643 g004
Figure 5. Ratio of n-alkanes and sum of total n-alkanes concentrations for the tunnels studied.
Atmosphere 11 00643 g005
Figure 6. Cluster analysis for all sampling sites.
Atmosphere 11 00643 g006
Figure 7. Score graphs of the two principal components for each site with (a) large concentrations and (b) small concentrations.
Atmosphere 11 00643 g007
Table 1. City, particulate matter (PM) size, number of samples (N), sampling durations (in hours), number of sampling days, and months and years for each sampling campaign.
CitySitePM SizeNSampling
Duration (h)
Days of SamplingMonthYear
São PauloJQT01TSP362August2001
MMTTSP262August2001
JQT11PM2.5663May2011
RODPM2.5462July2011
ARNPM2.57247September2013
TRAPM2.54244May2015
SalvadorLAP10PM102789April–May2010
LAP13PM102588October2013
Table 2. Means, minima, maxima and standard deviation for PM mass concentrations (µg m-3) of samples collected at each site.
SiteMeanMinMaxSD
LAP10 **1418217137.0
LAP13 **915612729.0
JQT01 ***48841957162.1
MMT ***25319930844.5
JQT11 *5249594.2
ROD *23320228232.9
TRA *924614540.5
ARN *794412432.7
* PM2.5 mass concentration; ** PM10 mass concentration; *** TSP; SD: Standard Deviation.
Table 3. Carbon preference index (CPI), average chain length (ACL) values and Cmax for the n-alkanes at all sites.
SiteCPI1CPI2ACL%PNACmax
LAP101.11.22797C32
LAP130.91.12897C29
JQT011.31.22875C21
MMT1.01.02696C24
JQT110.20.32999C30
ROD0.20.42899C30
ARN1.11.22893C26
TRA0.91.42897C30

