Article

Classification of Intense Rainfall Days in Southern West Africa and Associated Atmospheric Circulation

1
Centre de Recherches de Climatologie/Biogéosciences, Université Bourgogne Franche-Comté, 25000 Dijon, France
2
Laboratoire Pierre Pagney: Climat, Eau, Ecosystèmes et Développement, Université d’Abomey-Calavi, 01 B.P. 526 Cotonou, Benin
*
Author to whom correspondence should be addressed.
Atmosphere 2020, 11(2), 188; https://doi.org/10.3390/atmos11020188
Submission received: 18 December 2019 / Revised: 3 February 2020 / Accepted: 8 February 2020 / Published: 11 February 2020
(This article belongs to the Special Issue Trends in Hydrological and Climate Extremes in Africa)

Abstract

:
Daily rainfall in southern West Africa (4–8° N, 7° W–3° E) is analyzed with the aim of documenting the intense rainfall events which occur in coastal Ivory Coast, Ghana, Togo, and Benin. The daily 99th percentile (P99) shows that the coastline experiences higher intensity rainfall than inland areas. Using Tropical Rainfall Measuring Mission (TRMM) rainfall data for 1998–2014, a novel way of classifying the intense events is proposed. We consider their space-time structure over a window of 8° latitude-longitude and five days centered on the event. A total 39,680 events (62 at each location) are classified into three major types, mainly found over the oceanic regions south of 5° N, the Bight of Benin, and the inland regions respectively. These types display quite distinct rainfall patterns, propagation features, and seasonal occurrence. Three inland subtypes are also defined. The atmospheric circulation anomalies associated with each type are examined from ERA-interim reanalysis data. Intense rainfall events over the continent are mainly a result of westward propagating disturbances. Over the Gulf of Guinea, many intense events occur as a combination of atmospheric disturbances propagating westward (mid-tropospheric easterly waves or cyclonic vortices) and eastward (lower tropospheric zonal wind and moisture anomalies hypothesized to reflect Kelvin waves). Along the coast, there is a mixture of different types of rainfall events, often associated with interacting eastward- and westward-moving disturbances, which complicates the monitoring of heavy precipitation.

1. Introduction

Heavy rainfall events constitute a major risk for West African urban areas, where poor drainage facilities, deficient town planning, and rapid urban growth contribute to human and economic losses at times of flooding. In the coastal countries facing the South Atlantic Ocean, the concentration of human population and activities over low-elevation areas close to the shoreline causes a very high vulnerability to flooding. Based on the Gridded Population of the World data [1], in Ivory Coast, Ghana, Togo, and Benin, between 27% and 38% of the total population lives less than 50 km from the Atlantic Ocean, including main cities like Abidjan, Accra, Lomé, and Cotonou (Figure 1). Their high vulnerability is well illustrated by the case of Abidjan. The economic capital city of Ivory Coast, with its more than four million inhabitants, ranks fifth among the 136 largest coastal cities of the world in terms of flood-related annual economic losses, which amount to 0.72% of its gross domestic product [2].
Although some flooding events result from the high water levels of the rivers coming down from inland areas, most coastal (especially urban) floods are generated by heavy in situ rainfall. These heavy rains can occur in any season, but they are much more frequent around June, in connection with the mean rainfall regimes in Southern West Africa which display a main rainy season between May and July. In the last 10 years, all the metropoles of West African southern coastal countries have been severely affected by such events. In early June 2016, Accra was hit by severe floods caused by several days of precipitation, culminating on 12 June with 185 mm. On 2–3 June 2015, Abidjan, Accra, Lomé, and Cotonou all suffered destructive floods resulting from heavy rains exceeding 50 mm in 24 hours at each of these four locations. For coastal cities, future changes in the frequency of extreme rainfall raise great concerns [3,4], which are superimposed on those related to sea level rise [5].
A major issue for both the operational forecasting of intense rainfall events and a projection of their future trends is to gain a better knowledge of the atmospheric dynamics and weather disturbances which generate these events. Several studies have dealt with the mechanisms of intra-seasonal and synoptic rainfall variability over West Africa, but in most cases, they did not specifically target the southern coast. Mounier et al. [6] and Mekonnen et al. [7] found evidence of eastward-moving convectively coupled Kelvin wave activity over West Africa in boreal summer, peaking around 10° N, with strong 850-hPa wind anomalies near the equator. Kamsu-Tamo et al. [8] analysed March–June convective activity in Guinean West Africa. They found that while individual rain-producing systems were moving westwards, their activity is strongly modulated at regional scale by eastward propagating signals (convectively coupled equatorial Kelvin waves and the Madden-Julian Oscillation [MJO]). Over West Africa as a whole, it is considered that westward-moving, mesoscale convective system (MCS) bring most rainfall. Sometimes organized in the form of squall lines, they are often related to easterly waves. Easterly waves over West Africa show two main periodicities, at 3–5 days and 6–9 days. The former ones display two main tracks, at 15° N and 5° N, close to Guinean coast [9]. Schlueter et al. [10] found a strong modulation of 3-hourly to daily rainfall by African easterly waves (AEWs) in Guinean West Africa, but on longer timescales equatorial waves (including Equatorial Rossby waves, Kelvin waves and the MJO) also markedly affect rainfall variations. Knippertz et al. [11] documented the mesoscale weather systems across southern West Africa during a field campaign in June–July 2016. Several of these weather systems could not be attributed unequivocally to the tropical waves and disturbances described in the literature and deserve further study, including their effect on coastal rainfall.
In the coastal zone, besides organized convective systems, other rainfall types include light showers in the morning, developing into strong afternoon thunderstorms while propagating inland [12]. In southern Benin, the rainfall contribution from propagating convective systems amounts to no more than 50% of the annual rainfall [13], while in the coastal region of Ghana it is comprised between 2% and 32% [14]. There were few attempts to provide an exhaustive classification of rainfall types in the region. Fink et al. [13], over central Benin, differentiated three main rainfall types: (i) advective, long-lived organized convective systems moving westward, often outside the peak of the rainy season (August); (ii) MCS, occurring in a moist tropospheric environment near the height of the rainy season; (iii) events occurring south of a cyclonic vortex. This issue was further examined by Maranan et al. [15] who carried out an objective classification of rainfall types over southern West Africa based on TRMM precipitation radar. Seven types were distinguished. They include organized convective systems (MCS) which strongly contribute to annual rainfall (56% in the coastal zone). Several types of weakly organized systems are identified, which are the most frequent but of smaller size, shorter lived and which occur in conjunction with a cyclonic vortex while the convective available potential energy (CAPE) is low to moderate.
Some studies have investigated the role played by coupled air-sea dynamics in the South Atlantic Ocean on rainfall in the region bordering the Gulf of Guinea [16,17,18,19]. Nguyen at al. [17] studied the spring rains in Guinean West Africa, especially the heavy rainfall season lasting from 11 May to 26 June on average. They found that the coastal onset and its demise were mainly driven by changes in sea-surface temperature (SST) between the equator and the Guinean coast. Leduc-Leballeur et al. [18] noted that the cold SST south of equator and warm SST further north produce an increased coastal convergence which intensifies the lower atmosphere local circulation (LALC) and enhances moisture advection and precipitation on the coast for one or two days. Meynadier et al. [19] found that the onset of strong southerlies at 2° N, due to an SST decrease associated with the equatorial cold tongue development, in late May to early June, corresponds to the start of intense Guinea Coast rainfall, which lasts about two weeks. However, it is still not well understood how these mechanisms relate to easterly waves.
More generally, the atmospheric patterns specifically associated with intense rainfall events in West Africa in general, and Guinean West Africa in particular, are poorly known. The spatial patterns of extreme rainfall distribution were analysed [20] as well as their recent trends [21,22], but these studies did not consider the atmospheric circulation. Sossa et al. [23] found that intense daily rainfall events in West Africa were modulated by the MJO in March-May and June-September. Although the expected modulation of mean rainfall by the MJO is stronger during March-May, the modulation of the largest events (i.e., daily rainfall above the 90th percentile) is comparable in both seasons. Crétat et al. [24] found that intense rainfall events (percentile approach) occurring over West Africa west of 8° E are clearly related to active 3–5-day AEWs in both observations and regional climate simulations. Case studies of extreme rainfall events are available for Ouagadougou in Burkina Faso [25,26] and Abakaliki in Nigeria [27] which show that the rains are associated with the passage of MCS, exceptionally high atmospheric moisture and a lower-tropospheric vortex.
An improved knowledge of the intense rainfall events in the coastal zone of southern West Africa, especially the atmospheric mechanisms driving these events, is essential. This study therefore addresses the following questions: (1) How distinct are heavy rainfall events of the coastal areas from those of inland West Africa? (2) What is their spatial signature, e.g., do they occur as part of organized disturbances? (3) What are the atmospheric dynamics associated with these intense rainfall events, in terms of monsoon flow, upper wind anomalies and equatorial waves?
Here, a novel approach is used to classify intense rainfall events (defined as days above the 99th percentile of daily rainfall amounts) by considering the space-time continuum in which they occur. For each event at a given location, the spatial rainfall pattern over a window centered on this location, on the day of the rainfall event as well as a few days before and after the event, is considered. Each event is therefore described in terms of the rainfall environment in which it occurs over a time-sequence of a few days, to account for the possible propagation of the rainfall systems.
The data and method used to identify and classify the intense rainfall events are described in Section 2. Section 3 presents the results. They first include (Section 3.1.) the classification of the events and the characteristics of each type of event (spatial pattern, seasonal distribution, interannual variability). Then (Section 3.2.), the atmospheric anomalies associated with each type and their dynamics over a five-day period are analyzed using an adaptive window centered on the location of the intense rainfall events. A summary and a discussion close the article.

2. Data and Methods

2.1. Data Sets

Daily rainfall data are extracted from the Tropical Rainfall Measuring Mission (TRMM) Multisatellite Precipitation Analysis (TMPA) 3B42 data base [28], version 7, available at a 0.25° resolution, for the years 1998–2014, over the area comprised between 4° N and 8° N, 7° W and 3°E, which includes the southern parts of Ivory Coast, Ghana, Togo and Benin, as well as the adjacent part of the Gulf of Guinea (Figure 1). TMPA 3B42 is a multi-satellite product, incorporating microwave and infrared precipitation estimates, calibrated with gauge data, developed by the Mesoscale Atmospheric Processes Laboratory at NASA Goddard Space Flight Center. This data set was selected because of its relatively high spatial resolution, an important requirement in a coastal region characterized by strong rainfall gradients, and its overall good performance over Africa in general and West Africa in particular [29,30,31], as well as over the study region (see below). Over Ghana, a comparison between TRMM rainfall estimates and rain gauge data yielded high correlation coefficients and low biases [32]. TRMM data showed reasonable performance in the estimation of heavy rainfall over India [33].
Given the uncertainties attached to climate extremes in gridded precipitation products [34], TRMM data will be compared with two other satellite rainfall estimate products, PERSIANN-CDR and CHIRPS, in order to assess their accuracy in reproducing the statistics of intense rainfall events and their geography (Section 2.2.). The PERSIANN-CDR data set (Precipitation Estimation from Remotely Sensed Information using Artificial Neural Networks–Climate Data Record [35]) provides daily rainfall estimates at 0.25° resolution over the period 1983-2015. The full period is used in order to better match the observed data, however the statistics of intense rainfall events for the time span common with TRMM data are close to those obtained over the longer period (see Table 1 in Section 2.2.). The CHIRPS daily rainfall estimates (Climate Hazards group InfraRed Precipitation with Station data [36]), available at a 0.05° resolution from 1981 to now, are produced in two steps. The first step uses cold cloud detection from infrared satellite images calibrated using TRMM precipitation estimates and a long-term high-resolution rain gauge climatology. In the second step the estimates are merged with daily rain gauge data to obtain the final CHIRPS product.
A set of daily rain gauge observations, covering the period 1951–2014, was also used to assess the skill of the TRMM data set. Thirty-eight stations having at least 30 years of data are selected. Data originate from the Global Historical Climate Network (GHCN [37]), from the Global Surface Summary of the Day (GSOD, compiled by NOAA), and from the national meteorological services of Benin, Togo, Ghana and Ivory Coast.
ERA-interim reanalysis data [38] from the European Centre for Medium-Range Weather Forecasts (ECMWF), at a 0.75° latitudinal and longitudinal resolution and a daily time-scale (average of the 0000, 0600, 1200, and 1800 GMT observations), are used to document the atmospheric circulation associated with the intense rainfall events. Zonal and meridional winds and specific humidity are taken at 925 hPa, 700 hPa, and 200 hPa. The vertically integrated convective available potential energy (CAPE) is also examined.

2.2. Definition of Intense Rainfall Events

The local percentiles were used to select the intense events at a daily timescale, in accordance with other studies carried out at continental or sub-continental scale [39,40,41]. Along the coast, mean annual precipitation shows a large range of values, from less than 900 mm at Lomé (Togo) to over 2000 mm at Axim (Ghana) and Tabou (Ivory Coast). A single threshold is therefore unsuitable to identify intense rainfall events all across the region. We take into account this variability by including dry days in the computation of the percentiles, which has an additional advantage for the purpose of this study, that of enabling to retain the same number of intense events for all the grid-points. Hence, at each grid-point, the 99th percentile (P99) computed from all days (365 days × 17 years) was the threshold retained to define local intense events. The same choice was made by Sossa et al. [23], although at a lower threshold.
Figure 1 shows the spatial patterns of mean annual rainfall (MAR) and P99 of daily rainfall, using TRMM data. The region is relatively wet, but more so over the Atlantic ocean and in the coastal areas orientated at a right angle with the southwesterly monsoon flow (1500 to 2500 mm.yr−1) [42]. Inland areas are somewhat drier. The coastal stretch along southeastern Ghana, Togo, and Benin is even drier (700–1000 mm.yr−1) due to coastal upwelling and low-level wind divergence during the monsoon season [43]. The 99th percentile displays quite similar patterns, with higher values over the Atlantic Ocean and along the coast (55–80 mm), except in southeastern Ghana and southern Togo where P99 values are close to those found inland. This is despite the lower annual rainfall characteristic of this part of the coast, suggesting a higher relative intensity along the coast. Kpanou et al. [44] underlined the higher daily rainfall intensity along the coastline of southern West Africa compared to inland areas. Some spurious patterns, with strong gradients over short distances, appear in the Bight of Benin (Figure 1). Such patterns could be related to the different algorithms used to retrieve rainfall amounts over land and sea, with a special difficulty in near-coastal areas. This is an additional reason why in this study of intense events it is desirable to use the 99th percentile computed at each grid-point, rather than a fixed threshold or the 99th percentile computed on wet days only (possibly biased by an improper wet days to dry days ratio). This choice enables us to have exactly the same number of events (62) at each location, therefore indirectly removing biases in the TRMM estimates.
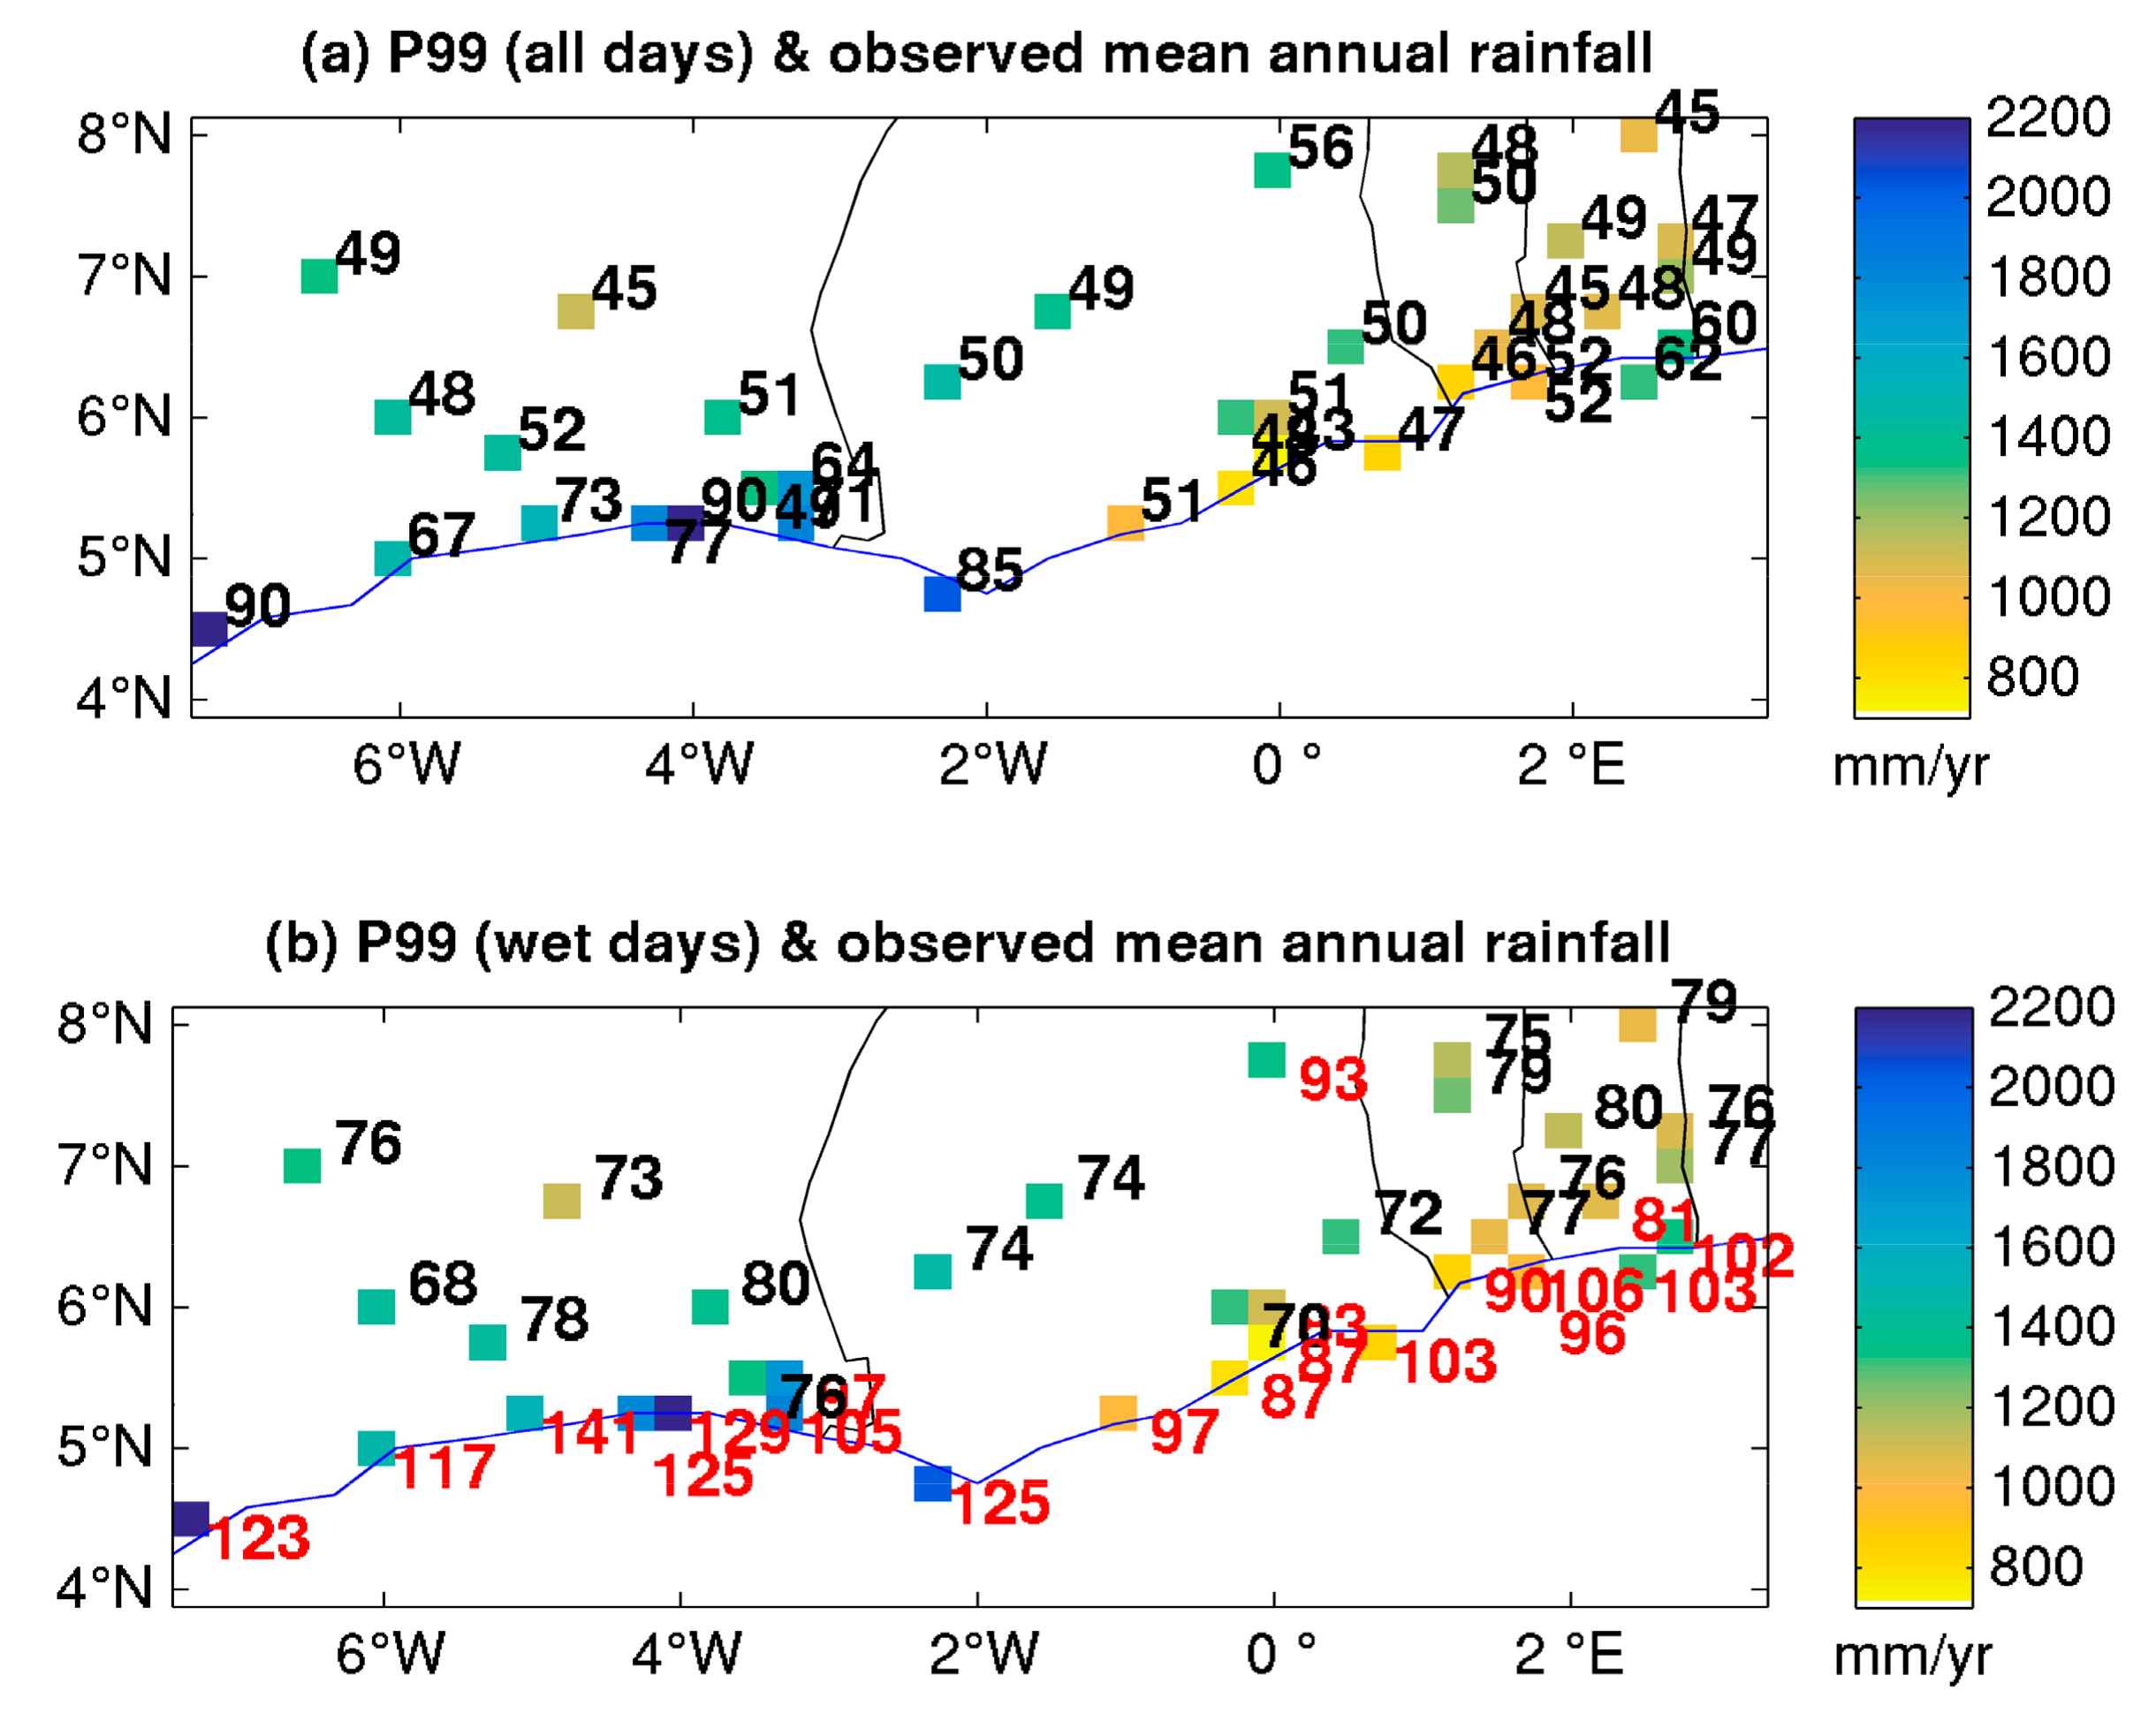
A comparison is made between the TRMM data and both raingauge observations and other satellite rainfall estimation products (PERSIANN and CHIRPS) (Table 1 and Figure 2a). Although the periods covered do not completely overlap, there is a fair agreement between the different data sets. Compared to the observation, TRMM data reflect quite well the distribution of mean annual rainfall amounts, although there is some under-estimation along the Ivorian coast (Figure 2a). With respect to intense rainfall events, the mean P99 for the grid-points nearest to the 38 raingauges (49 mm) compares favorably with the observation (55 mm). TRMM underestimates P99 along the Ivorian coast, but elsewhere the agreement is very good (Figure 2a). The bias for PERSIANN is considerably larger (Table 1). CHIRPS has a smaller bias, but still higher than that of TRMM. The error (root-mean-square-error, RMSE) is also much lower for TRMM than for both PERSIANN and CHIRPS. A temporal analysis is additionally carried out to find out whether the intense events extracted from TRMM match daily rainfall at station level. It is found that intense days in TRMM show a sharp rainfall peak at the rain gauges (31 mm on average over 8 stations with records overlapping those of TRMM, while the average rainfall is 5 mm 2 days before and 2 days after). These results suggest that TRMM is one of the best available products to study the space-time patterns of intense rainfall events over the region, although a bias exists along the Ivorian coast and the patterns over the ocean cannot be suitably validated.
The higher intensity along the coastline is even better shown when calculating P99 on wet days only. From TRMM data (Figure 1b), it exceeds 70 mm all along the coast, even in the drier sector in southeastern Ghana. Observations (Figure 2b) also delineate the coast, whose rain gauges all record a P99 (wet days only) above 80 mm, contrasting to most inland stations.
In order to emphasize the specificity of the coast, Figure 3 shows scatterplots of MAR versus P99 for the 38 rain gauges. Coastal stations (circles) stand out by having higher P99 values than inland stations (crosses), for a given mean annual rainfall amount. This is found when using both all days (Figure 3a) and wet days only (Figure 3b) as a base of calculation of P99. This confirms that the frequency of intense rainfall events is higher along the coast. The same conclusion arises based on the 95th centile (not shown). These heavy coastal rains are concentrated in the May–July season, with a strong peak in June, in agreement with other studies [39,44].

2.3. Classification of the Rainfall Events

A classification of all intense rainfall events is made based on the spatial distribution of rainfall in order to assess whether coastal events (and oceanic events) show features distinct from those of inland West Africa. An intense rainfall event is defined at grid level as a day recording more than P99, and is identified by D0, its day of occurrence and L, its geographical coordinates (in latitude and longitude). All events, whatever their location and season, are subject to the classification. A given calendar day may appear several times if it is characterized by intense rainfall at several grid-points, but the classification is meant to describe local precipitation occurrence and not to provide statistics on discrete rainfall disturbances.
Each event is described by the rainfall amount (square-root transformed in order to reduce skewness of daily precipitation distributions) at all grid-points within a spatial window centered on L. Based on sensitivity tests and the size of mobile disturbances in the region, the longitudinal and latitudinal extent of this window was set to 8 degrees, i.e., roughly 900 km, giving a surface area of about 770,000 km2. Similarly, a temporal window is defined which extends both before and after the day of occurrence D0 of each intense event. With similar consideration of the lifetime of disturbances in the region, the window was set to 2 days before (D-2) and 2 days after (D2) the reference day D0. Therefore, each event is depicted by rainfall amounts at each grid-point within the spatial window and on each day of the above-defined temporal window, i.e., N = 4805 values (5 days × 31 latitude bands × 31 longitude bands). Note that contrary to studies focusing on mesoscale convective systems (e.g., Mathon and Laurent [45]) the size of the rain area is not explicitly defined, and a given convective cluster may be described as two separate events if several grid-points record a rainfall amount exceeding P99. However, the clustering will implicitly take into account the size of the cloud system by considering rainfall amounts over a large spatial window around each grid-point.
Because of the use of the local P99 (defined from both wet and dry days) as a threshold, the number of events is the same for each grid-point (62 days; i.e., 0.01 × 365 days × 17 years). Therefore, all grid-points have the same weight in the analysis, each grid-point being represented by 62 intense events, which amounts to a total of 39,680 events to be classified. A clustering algorithm is then used to classify the events by comparing their similarities in terms of space-time rainfall patterns, as depicted by the 4805 observations, therefore taking into account the possible propagation of the rainfall structures. The k-means method, adapted to large data sets, is retained [46]. The squared Euclidean distance is used to assign the intense events to each cluster.
The number of clusters is set to three, based on the robustness of the associated spatial rainfall patterns. A classifiability index [46,47] has also been computed but it shows very little variation between successive solutions (i.e., number of classes). A five-cluster solution displays a modest local peak in the index. However, since three of these clusters mostly depict land areas, with many similarities in the space-time rainfall patterns and the atmospheric dynamics, the three-cluster solution will be preferred in the main analysis. In order to get more detail on the rainfall types which affect land areas, the cluster mostly depicting land pixels is further divided into three subtypes using the same method. Note that the resulting subtypes are very similar to those obtained from a direct five-cluster solution applied to the whole data set, but the two-step approach makes easier the presentation of the results.
Each cluster will be depicted by (i) rainfall maps (in relative geographical coordinates around each grid-point) for each day of the 5-day sequence, enabling to show the spatial pattern of the rainfall field associated with the intense event from two days before to two days after the event; (ii) plots showing the seasonal distribution of the events and their interannual variations; (iii) a map showing the number of intense events pertaining to the cluster.

2.4. Atmospheric Patterns Associated with Each Cluster of Intense Events

Daily composite anomalies of ERA-interim atmospheric fields are computed from deseasonalised data, for each class of intense rainfall events (with the Student’s t-test being used to assess the statistical significance at P = 0.999). Deseasonalisation is carried out by computing the average for each calendar day of the period 1998-2014, removing this average from the actual values and dividing by the corresponding standard-deviation. Note that the annual cycles of the averages and standard-deviations are smoothed out using a low-pass filter prior to deseasonalisation.
Since the reference point of each event shifts in space, the atmospheric patterns are plotted in relative coordinates around each grid-point for which intense rainfall events are analyzed, over a 2000 km square-window, and from two days prior to the event to one day after. However, a map in geographical coordinates can also plotted by considering the average latitude and longitude of all events included in a given cluster.
Time-longitude cross-sections (from 6 days before the event to 4 fours after) are also plotted in order to better show the propagative features attached to each cluster.

3. Results

3.1. Classification of Intense Rainfall Events

The seasonal distribution of the intense rainfall events over the whole study area (Figure 4) shows two peaks, the main one in June and a secondary one in October. This bimodal distribution almost replicates that of the mean monthly rainfall amounts, with the main rainy season from April to June, a drop in August (little dry season) followed by the small rainy season (September–October) and the main dry season (boreal winter). As much as 25% of all intense events occur in the single month of June, and this proportion is even higher along the coast (47% of the 62 intense events at Abidjan, 33% at Accra, based on observed data). The contribution of intense events to the monthly total precipitation also peaks in June (29.7% on average over the region). Due to the northern shift of the ITCZ in boreal summer, August records almost no intense event on the coast but quite a number in the north, at the limit of Sudanian climates which display a summer maximum [43].
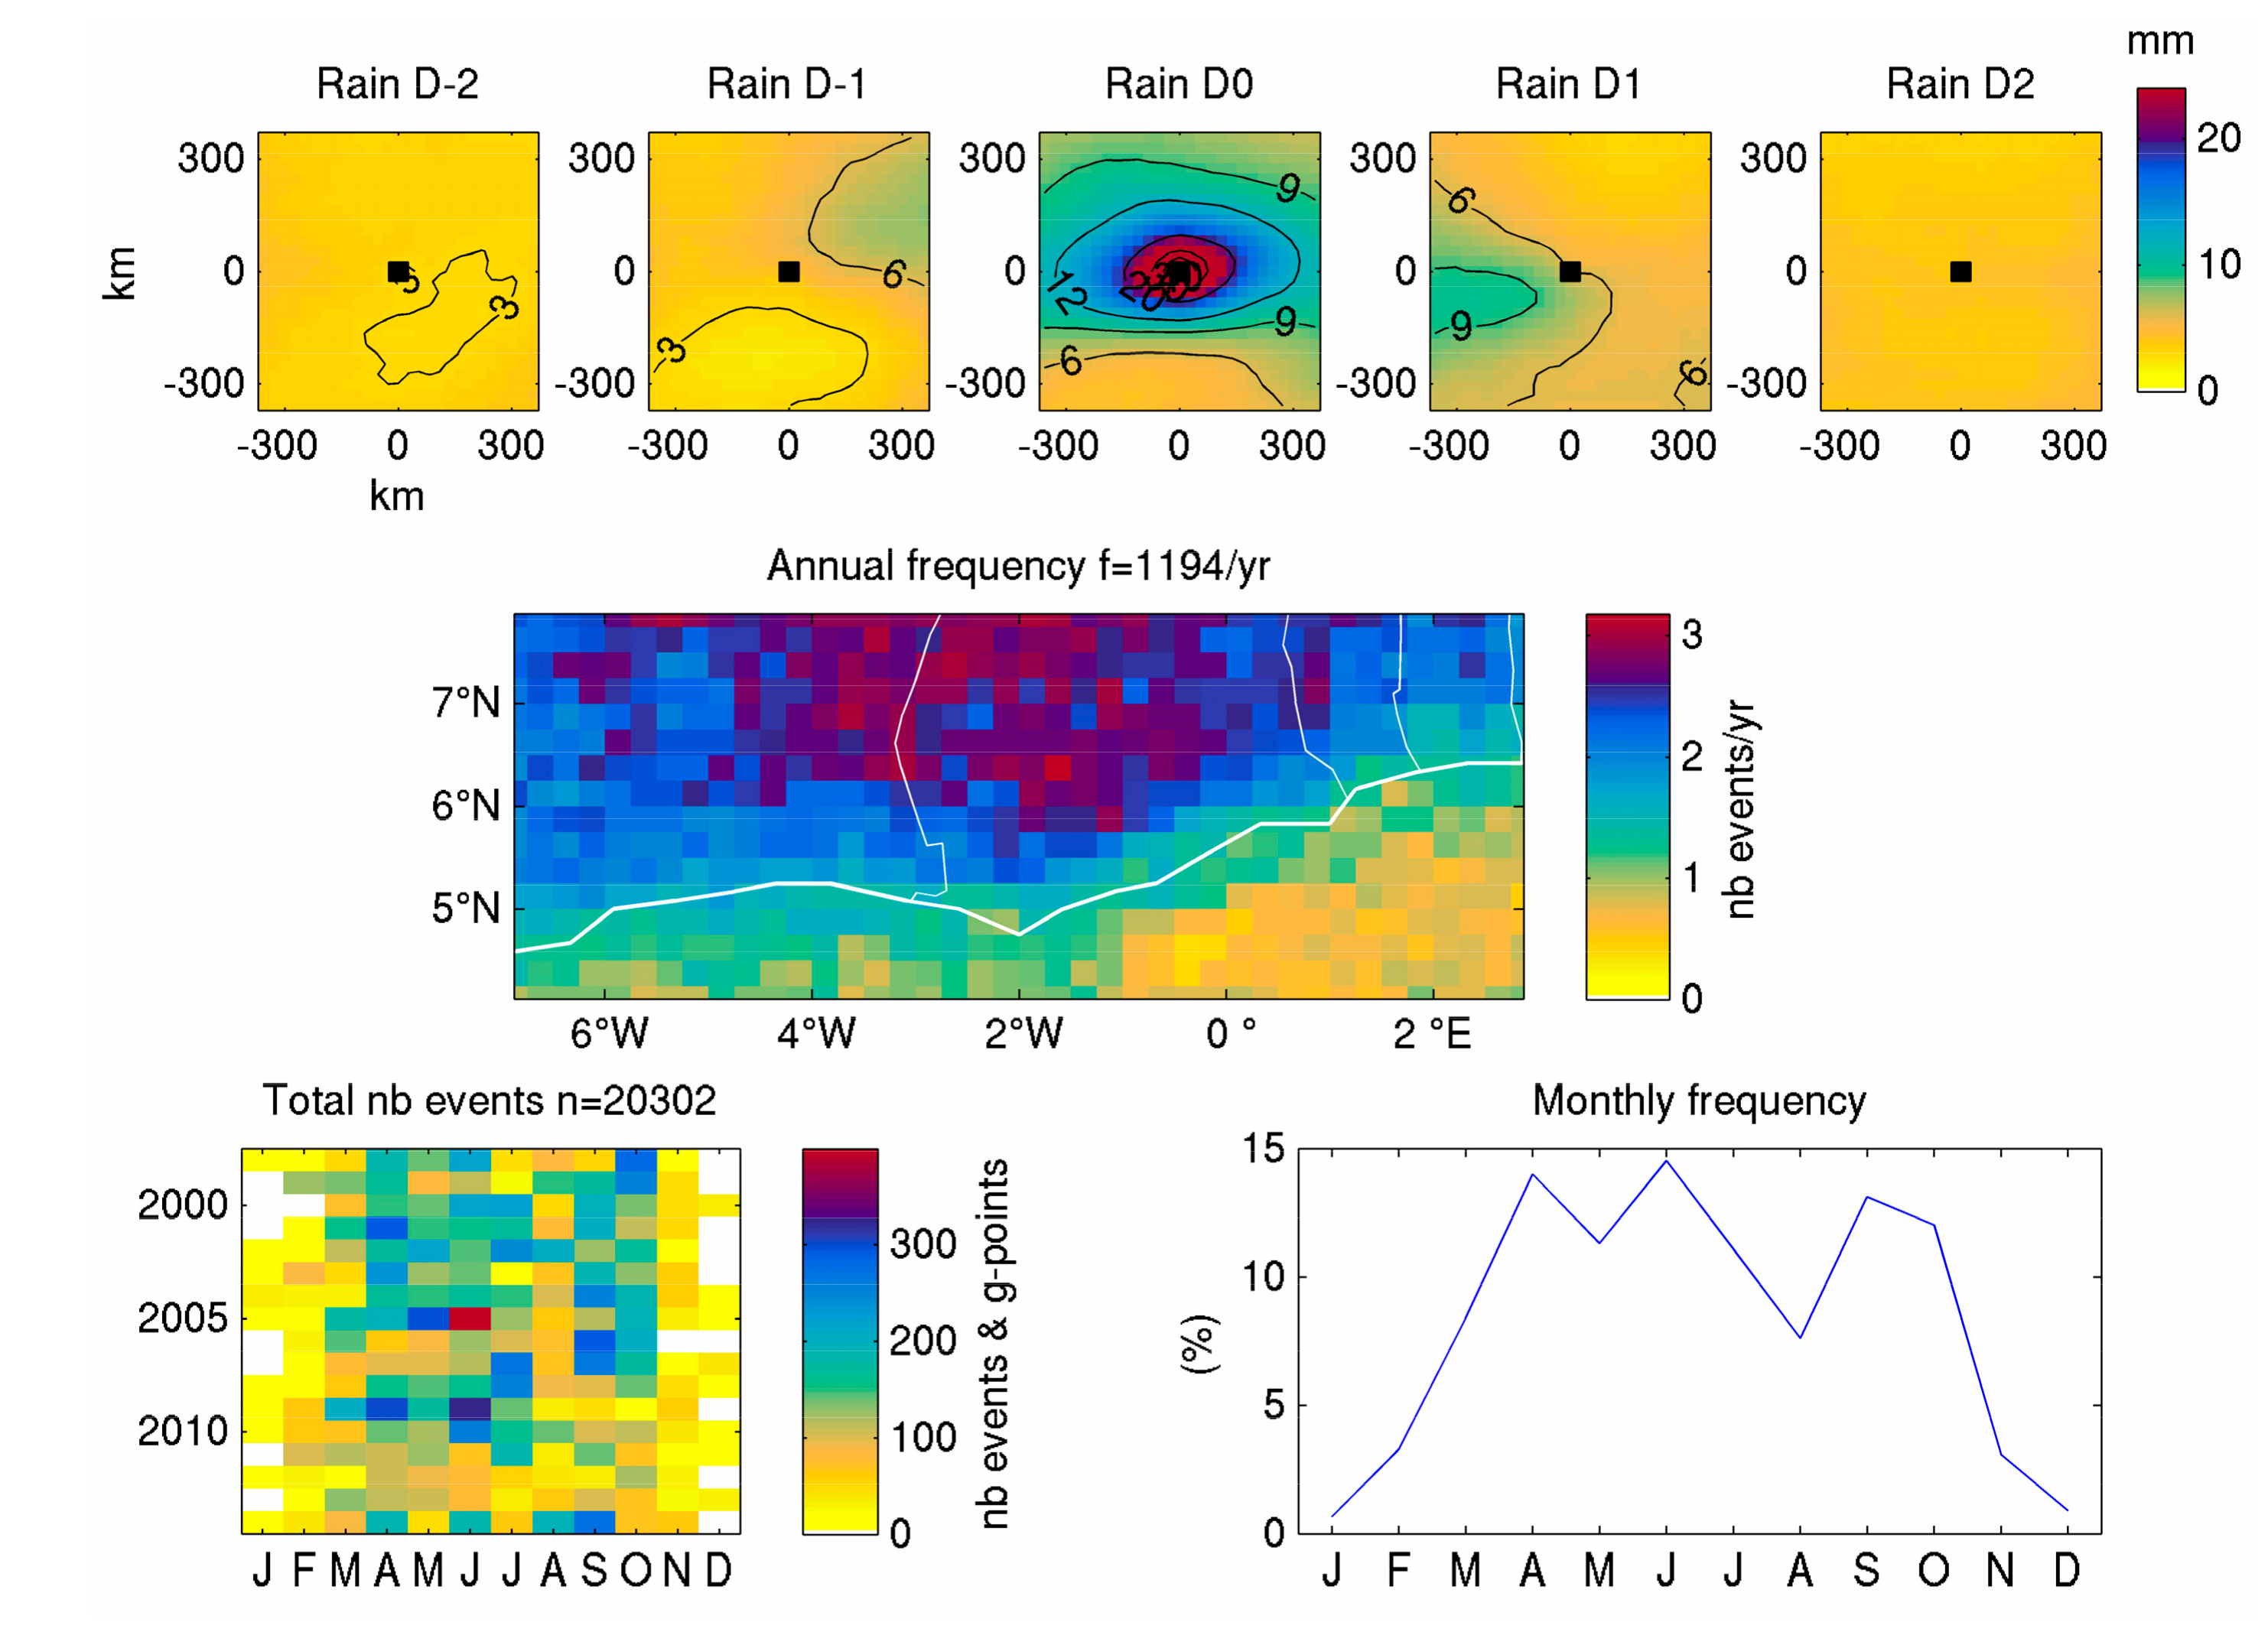
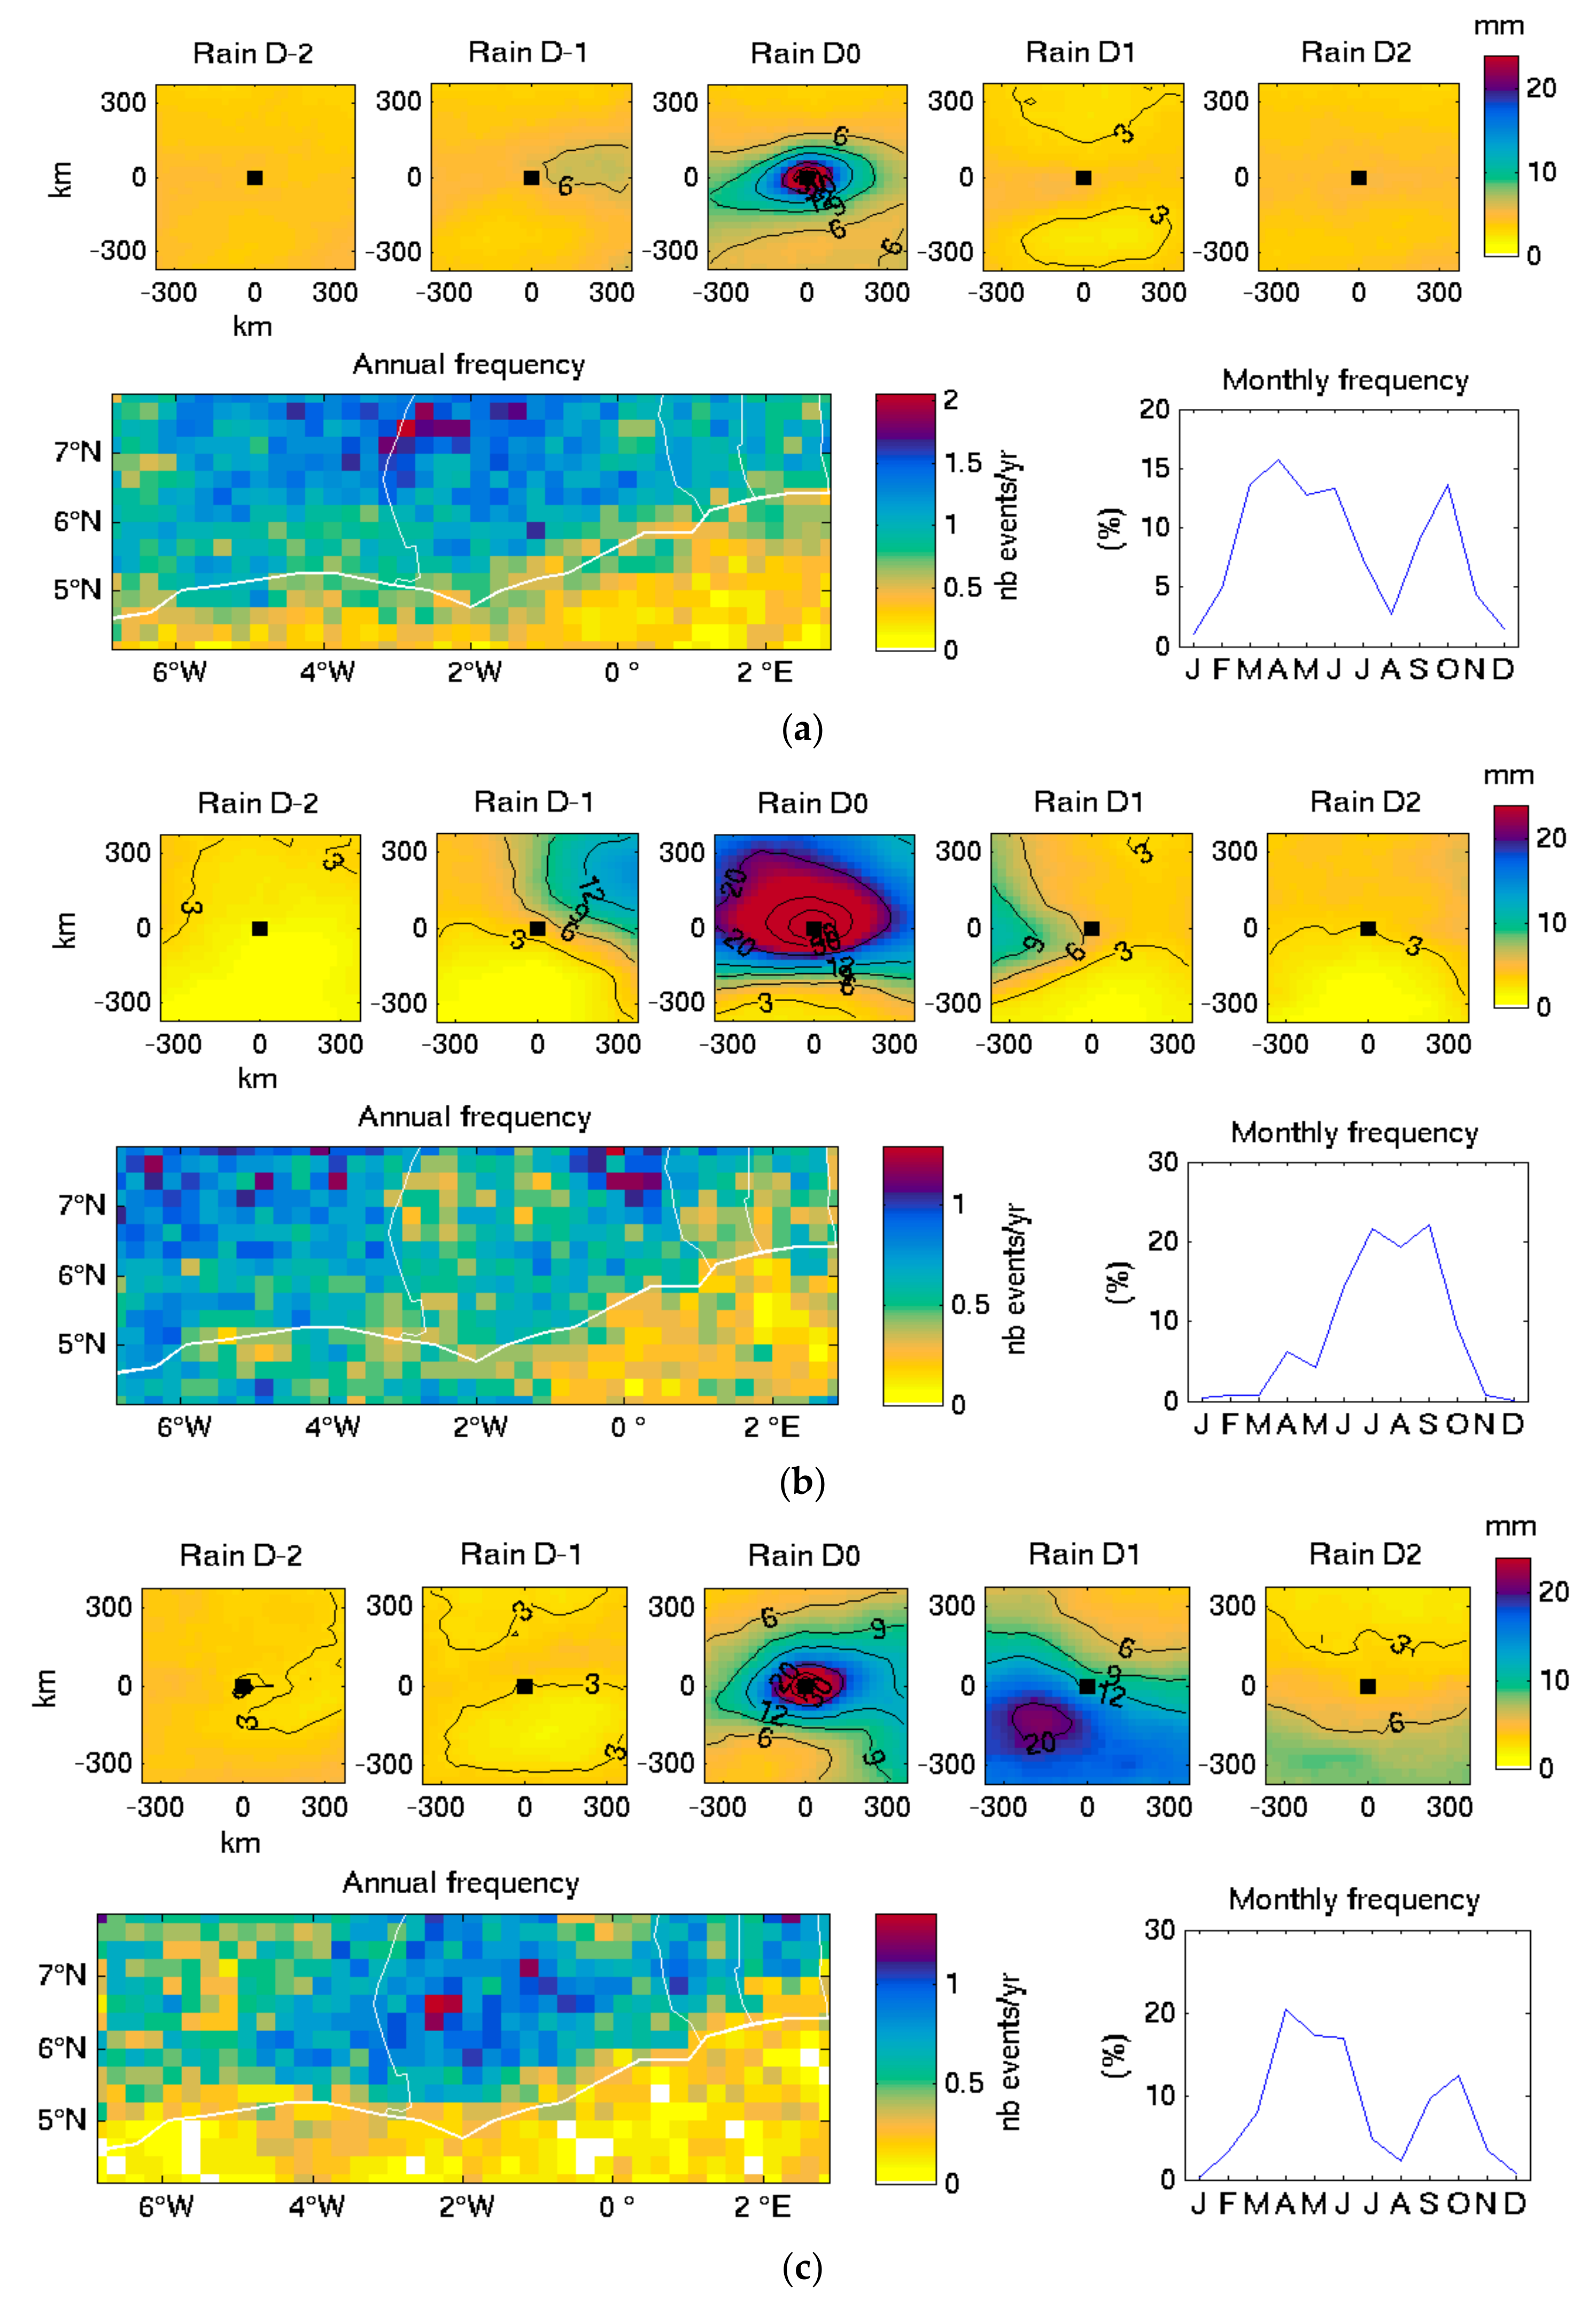
The spatial patterns of the intense rainfall events were stratified in three main classes, each one showing quite a distinct geography, although some overlaps do exist. Cluster 1 is the most frequent one, with over 20,302 events which occurred mainly over the continent, at a rate of 2–3 events per year per grid-point (Figure 5, central panel). The five-day sequence resulting in the intense event on D0 starts by dry conditions on D-2 (Figure 5, upper panels) then the appearance of weak rains to the north-east of the target grid-point a day before the event. The central day of the sequence displays an oval rain area, with rainfall over 12 mm on average over a 600 × 300 km longitude × latitude zone. A day after the event, rainfall over 6 mm is still found in the west and southwest, while dry conditions return on D2. This sequence suggests the occurrence of westward or southwestward moving disturbances. The frequency of these disturbances is quite even from March to October, although with a decrease in August (Figure 5, lower panels).
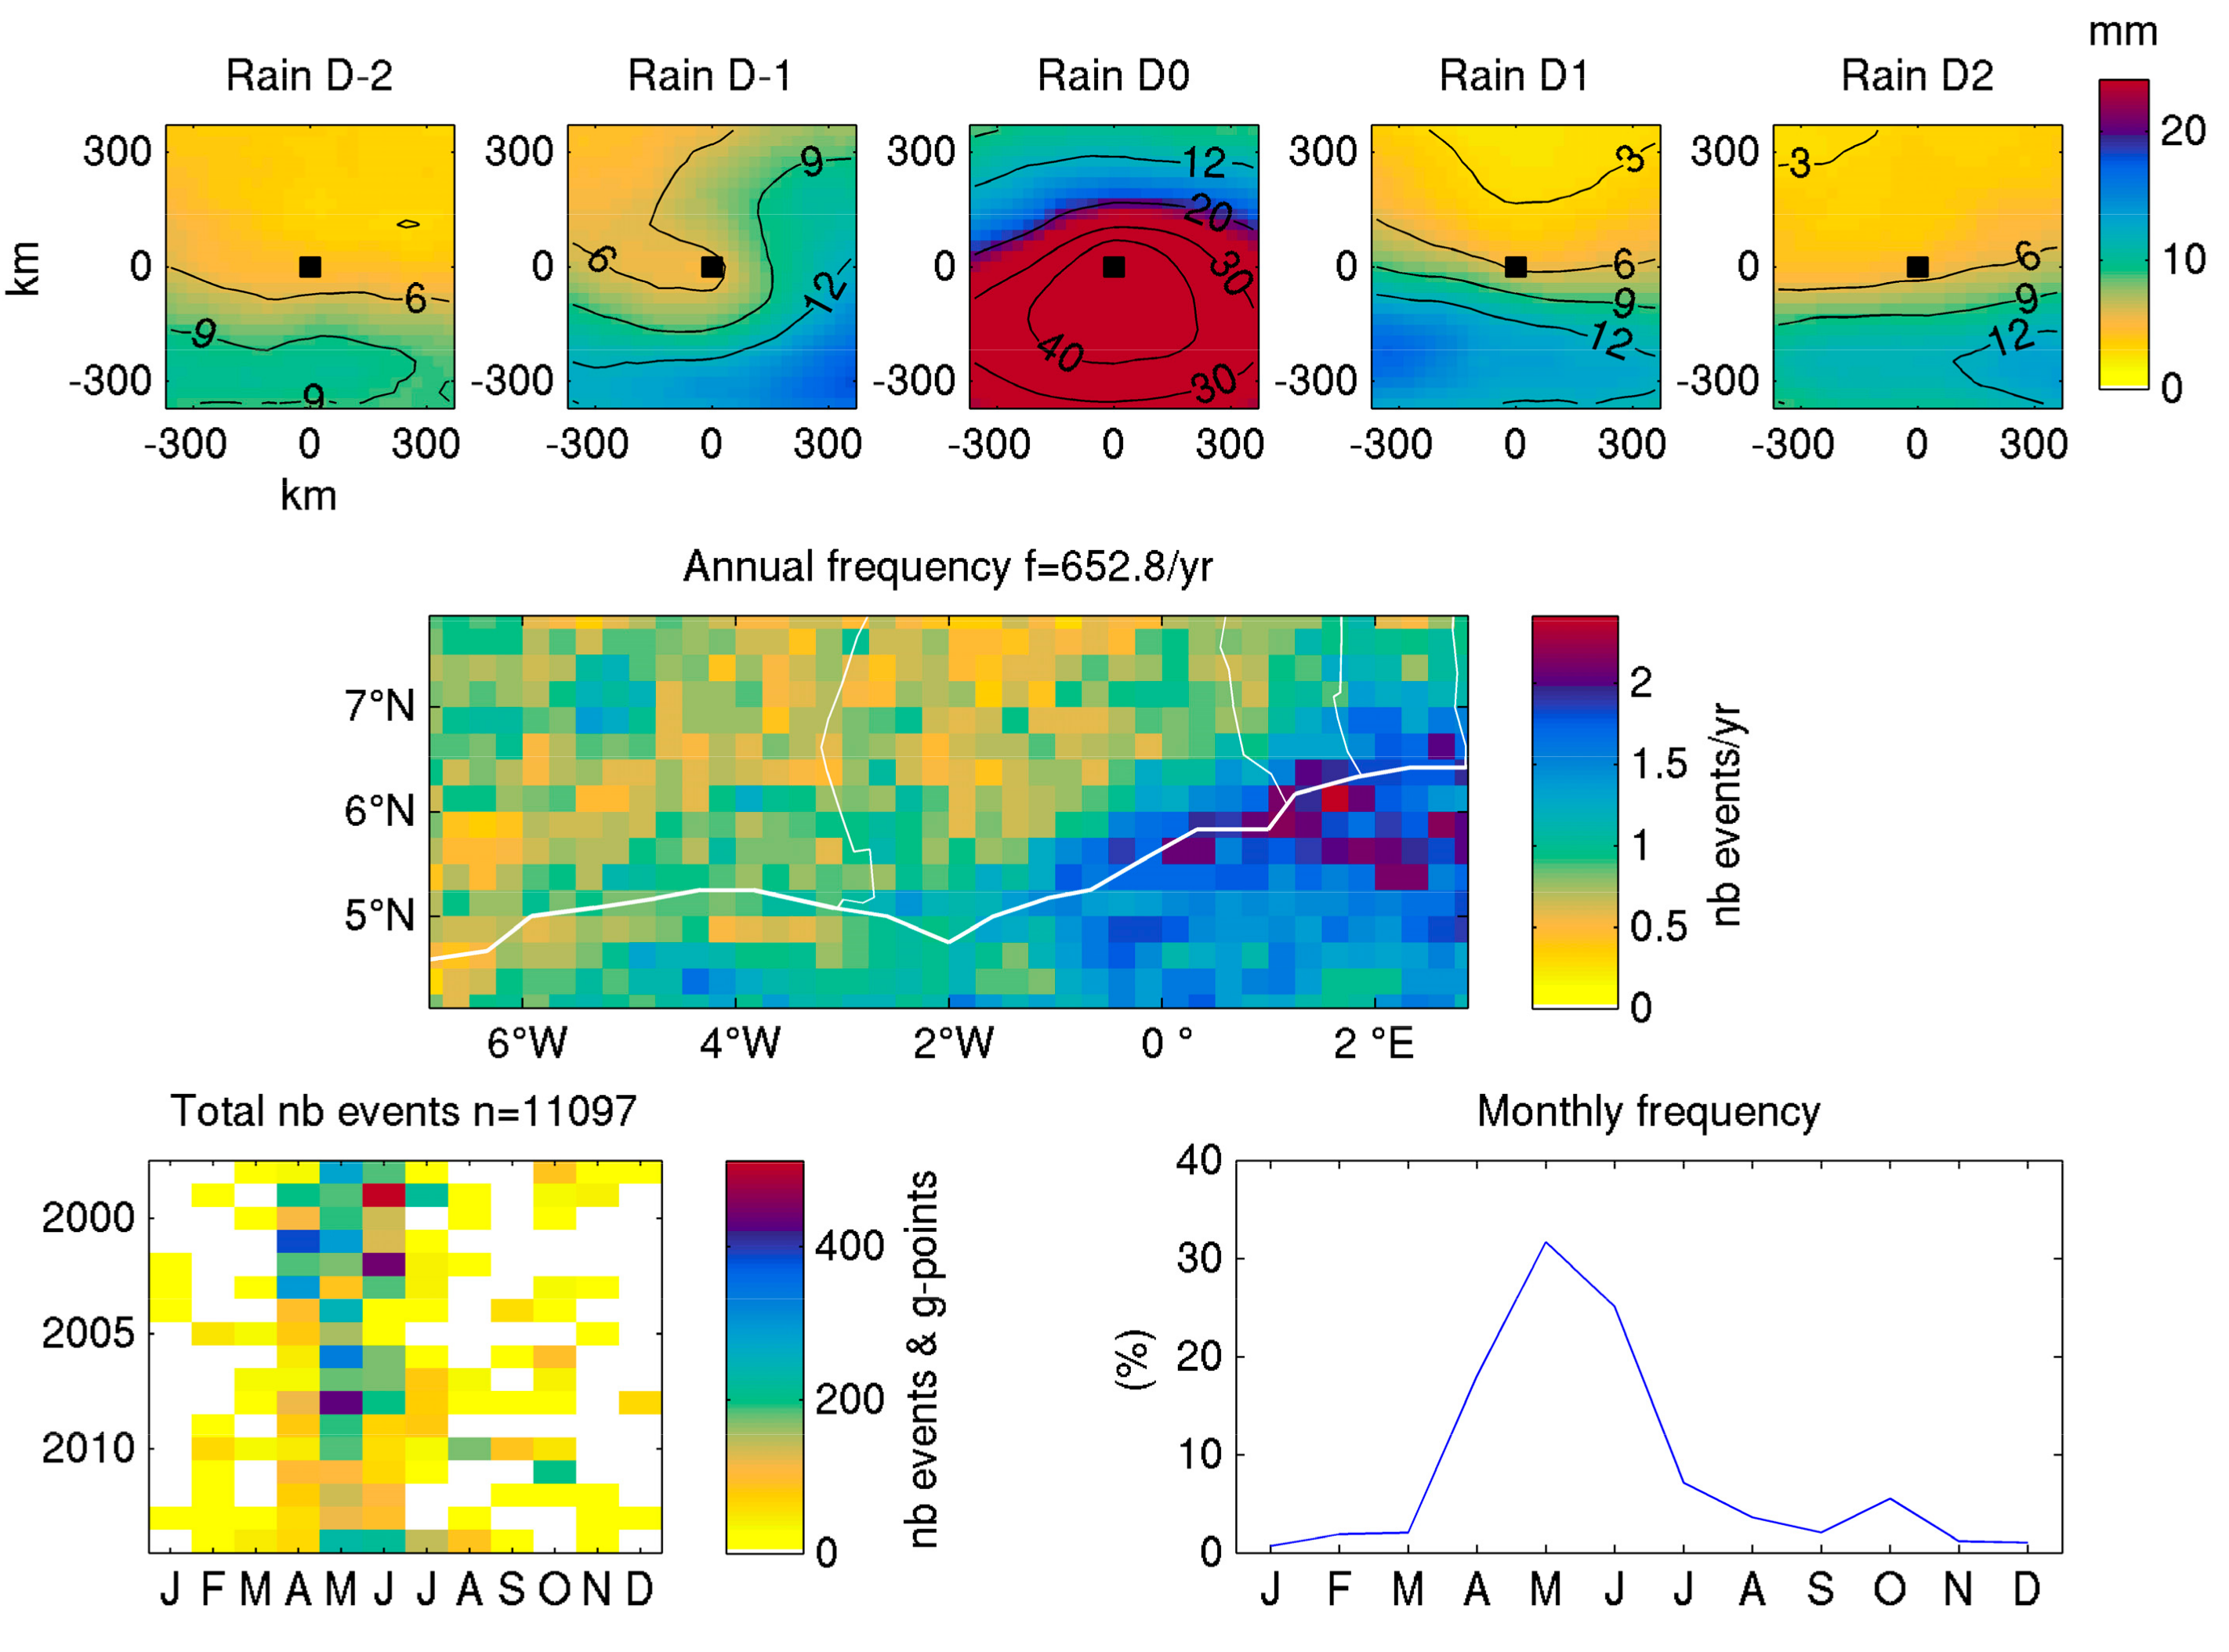
Cluster 2 (8279 events) depicts intense events occurring mostly over the Atlantic Ocean south of 5° N (Figure 6, central panel). They have a very distinct seasonal distribution (Figure 6, bottom panels), with a sharp June maximum (45% of all events belonging to this cluster), 10%–15% of the events in both May and July, a weak secondary maximum in September (9%) and almost no event during the main dry season from November to March. These rainfall events are embedded in a persistent (from D-2 to D2), zonally elongated rain belt (Figure 6, upper panels) covering the Gulf of Guinea north of the equator, and bounded to the south by dry conditions associated with the equatorial upwelling zone which develops in boreal summer in the Atlantic Ocean. The intense event starts on D-1 by a rainfall enhancement within the rain belt and to the east of the target point. The rain belt broadens to the north and intensifies on D0. Rainfall activity decreases moderately on D1, although quite heavy rains (about 15 mm) still occur. A further decrease is noted on D2. This cluster shows some evidence of a westward propagating disturbance, although less distinctly than in cluster 1. There is a large interannual variability in the frequency of these intense rainfall events. For instance, none occurred in June 2004 while over 300 grid-points-days were found in June 2000, 2002, 2003, 2010, 2013, and 2014.
Cluster 3 has a preferred location over the Bight of Benin and nearby coastal areas (Figure 7, central panel). Over these regions, cluster 3 events occur about 2 days/year/grid-point on average, while they may also be found elsewhere in the region but less than once a year. The seasonal pattern is very distinct, with almost 79% of the events from April to June (Figure 7, bottom panels). Cluster 3 differs from cluster 2 in that it occurs in an otherwise relatively drier context, slightly to the north of the rain belt covering the equatorial Atlantic Ocean. The intense events are initiated on D-1 with a spiral-like pattern of rainfall encircling the target point, involving a rainfall increase to the south and the east. Rainfall further increases on D0, with heavy rainfall (>20 mm) over an extensive area (at least 600–800 km wide). Rainfall decreases on D1 from the north, although the activity remains significant in the south, especially the southwest. On D2, while there is a further decrease in the southwest, rainfall again picks up in the southeast. This pattern shows clear evidence of a westward moving disturbance, with an asymmetrical shape. Note that fewer of these events are found after 2008, but the short period of study does not enable a thorough trend analysis.
Remarkably, by comparing the three clusters, it is found that the coastal zone exhibits a mixture of different types of intense rainfall events: type 1 and type 2 along the Ivorian and western Ghanaian coasts, type 1 and type 3 along the eastern Ghanaian, Togolese and Beninese coasts (Figure 8). This suggests that the coast distinguishes itself from the rest of the region by experiencing a combination of different types of disturbances at the origin of intense rainfall events, with an additional separation between the western and the eastern coast. Note that when the clustering is repeated on the coastline pixels only (those located at less than 30 km inland from the coast), the three-cluster solution is remarkably similar (not shown) to that obtained over the full region. This first indicates that the rainfall types found at the coast are not unique to this environment, and second that the clusters we extracted are fully relevant to describe the patterns of intense events at the coast.
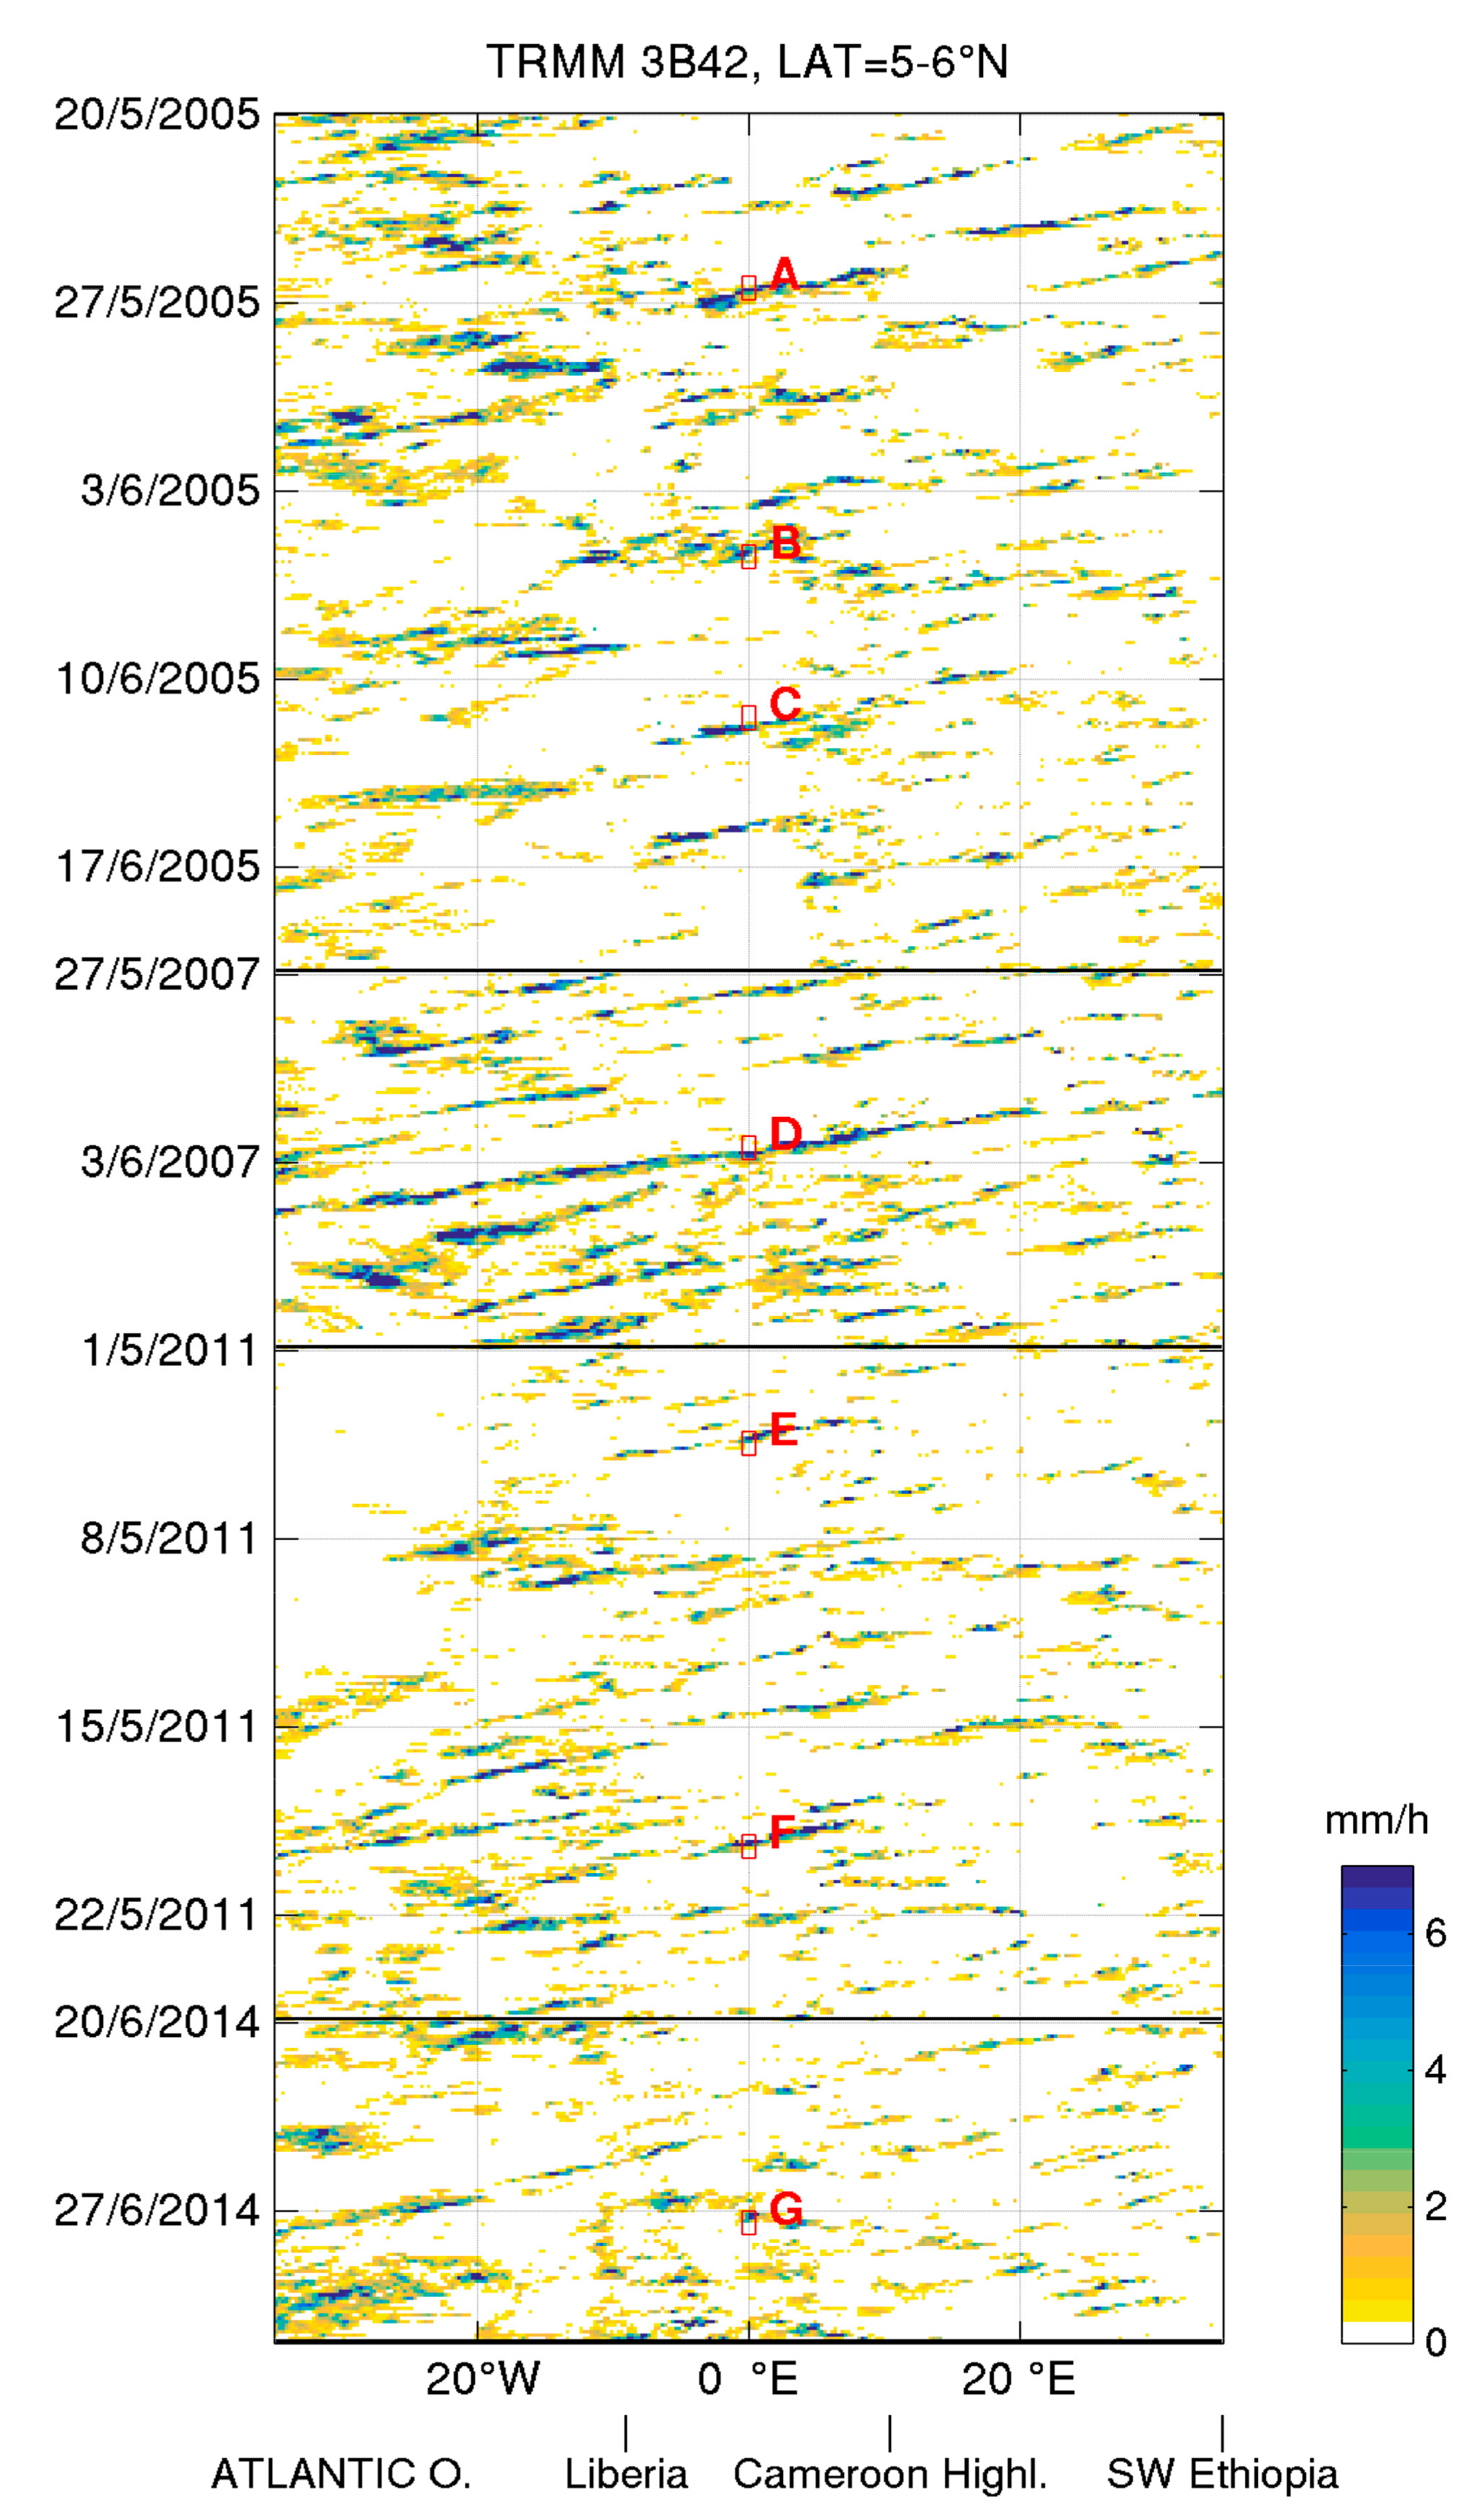
A Hovmöller (time × longitude) plot is constructed (Figure 9) to illustrate the zonal propagation of rainfall structures on seven representative intense rainfall events around Accra, Ghana. These events all recorded daily rainfall over the local P99 in the area 5–6° N, 0.5° W–0.5° E (red squares on Figure 9). Three-hourly TRMM data are extracted along 5–6° N. This region is mainly affected by cluster 3 events, and some cluster 1 events. Most of the sample events are clearly associated with westward-propagating disturbances. This is evident for events A, C, D, E, and F. Most of these disturbances originate around the Cameroon Highlands near 10° E, and cannot be traced down to the west beyond 5–12° W, with a lifetime of about 24–36 hours. However, event C shows evidence of an origin further east around 20° E, and event D singularizes by propagating over a very long-distance, over five days, from the Ethiopian Highlands (35° E) to beyond 30° W. For event B, the story differs. While a short-lived westward-moving disturbance is still found, it is embedded in a larger-scale rainfall structure propagating from west to east. Some evidence of this eastward-propagating disturbance can actually be found about three days before near 30–20° W. A weak eastward-moving disturbance is also noticeable for event G. Other cases of a modulation of rainfall activity with a propagation to the east can be found in Figure 9, though the signal is spatially discontinuous and does not always give birth to an intense rainfall event over Ghana. This combination of westward- and (less clearly) eastward-moving structures is not easily seen on the clusters, since the small number of clusters initially retained smoothed out the weakest signals.
In order to refine the classification of the rainfall events over the land areas, mostly depicted by cluster 1, the corresponding events are further classified in 3 subtypes (1A to 1C; Figure 10). Pattern 1A shows daily rainfall events of relatively small size (zonal extension of 300 km, and meridional extension of 200 km based on the area receiving over 12 mm.day−1), short-lived and with little evidence of any propagation (rainfall on D-2 and D-1 is absent or low, except for moderate rainfall to the east on D-1, and rainfall on D1 and D2 is again very low). It therefore mainly corresponds to a rain system generated locally, or a small size, weak rainstorm drifting from the east. These events are the most frequent ones (9262 out of the 20,302 cluster 1 events) and occur almost throughout the year except for the driest periods (November–February and August). They are found throughout the land regions except for the coastline, with a maximum occurrence near the Ghana-Ivory Coast border. Such events can be seen as local convective storms, possibly related to the effect of sea-breeze.
Pattern 1B (Figure 10, central panels) depicts long-lasting events which start on D-1 with enhanced rainfall to the east / north-east of the target grid-point, then expand and intensify on D0 over a large area (rainfall over 12 mm.day−1 everywhere except along the southern boundary), and finally evacuate to the west on D1. These events can be seen as major rainfall disturbances (e.g., squall lines) originating from outside the region and drifting westward. They are fairly widespread (many events also occur over the ocean), but distinct maxima are found close to the Togo / Akwapim Hills (near the Ghana-Togo border) and in west-central Ivory Coast (also a region of higher elevation). These events have quite a uniform distribution between June and September, and are virtually absent from the rest of the year, which is consistent with the occurrence of squall lines.
Pattern 1C (Figure 10, bottom panels) also depicts moving disturbances, but generated locally on D0 (day D-1 is mostly dry), then evolving into a large-scale active disturbance (above 20 mm.day−1) which drifts to the southwest over the ocean on day D1. These events have a distinct preferred location over land at a distance of 50 to 200 km from the coastline (hence possibly initiated by the sea breeze) and are particularly frequent in western Ghana. Their occurrence clearly peaks from April to June, with a secondary maximum in September–October.
Table 2 summarizes the contribution of the different types of events to the local number of intense rain days at a few locations in southern West Africa. Inland (Kumasi), as expected, the contribution of cluster 1 (mainland type) is overwhelming (especially that of large-scale disturbances 1B and 1C, over 27% each). Along the coast (the three other stations), there is a mix of different types of events, with 40%–48% of type 1 events at all locations, while type 3 is equally very frequent at Accra and Cotonou on the shores of the Bight of Benin. Type 2 events only have a high contribution at Abidjan. These results further demonstrate the interface character of the coast in terms of rainfall structures associated with intense events.

3.2. Atmospheric Circulation Associated with Intense Rainfall Events

Deseasonalised ERA-interim data are used to analyze atmospheric anomalies associated with the main types and subtypes of intense rainfall depicted in Section 3.1. Sequential composites (from two days before to one day after the events) are produced at 925, 700, and 200 hPa using three variables: the zonal and meridional components of the wind and specific humidity. The composite is computed over an approximately 2000-km square window centered on the grid point P where the intense event is located (see Section 2).
For cluster 1 (intense events over the African mainland), weak low-level positive humidity anomalies appear on D-3 (not shown) and D-2 (Figure 11, bottom). In the mid-troposphere (700 hPa, Figure 11, middle panels) a distinct tilted ridge, orientated from the NE to the SW and associated with dry air, is found slightly east of the target grid-point P on D-2. This ridge shifts westward on D-1, being replaced by strong northeasterly anomalies and moister than normal conditions in the east. The lower troposphere also becomes moister east of P, with northerly wind anomalies appearing in the northeast. These wind and humidity anomalies strengthen and shift westward on D0. At 925 hPa, a SW-NE tilted shear line separates northerly anomalies (to the north of point P) from westerly to southwesterly anomalies (south and east of P). Positive humidity anomalies are also found on D0 in the mid- and upper troposphere. At 700 hPa, they are accompanied by northeasterlies ahead of a tilted trough, while an upper anticyclonic outward flow is clearly seen at 200 hPa (Figure 11, top panels). A day after the intense rainfall event, the moisture signal is weaker and shifted to the west. In the low- and mid-troposphere, as the trough moves westward, it gives way to southwesterly anomalies. This sequence of events is quite typical of easterly waves occurring at relatively low latitudes over West Africa. During June-September, Diedhou et al. [9] found at 5° N and 15° N a similar association between a 700 hPa trough, resulting in southerly wind anomalies typical of an easterly wave, and a positive rainfall anomaly slightly west of the trough, moving westward.
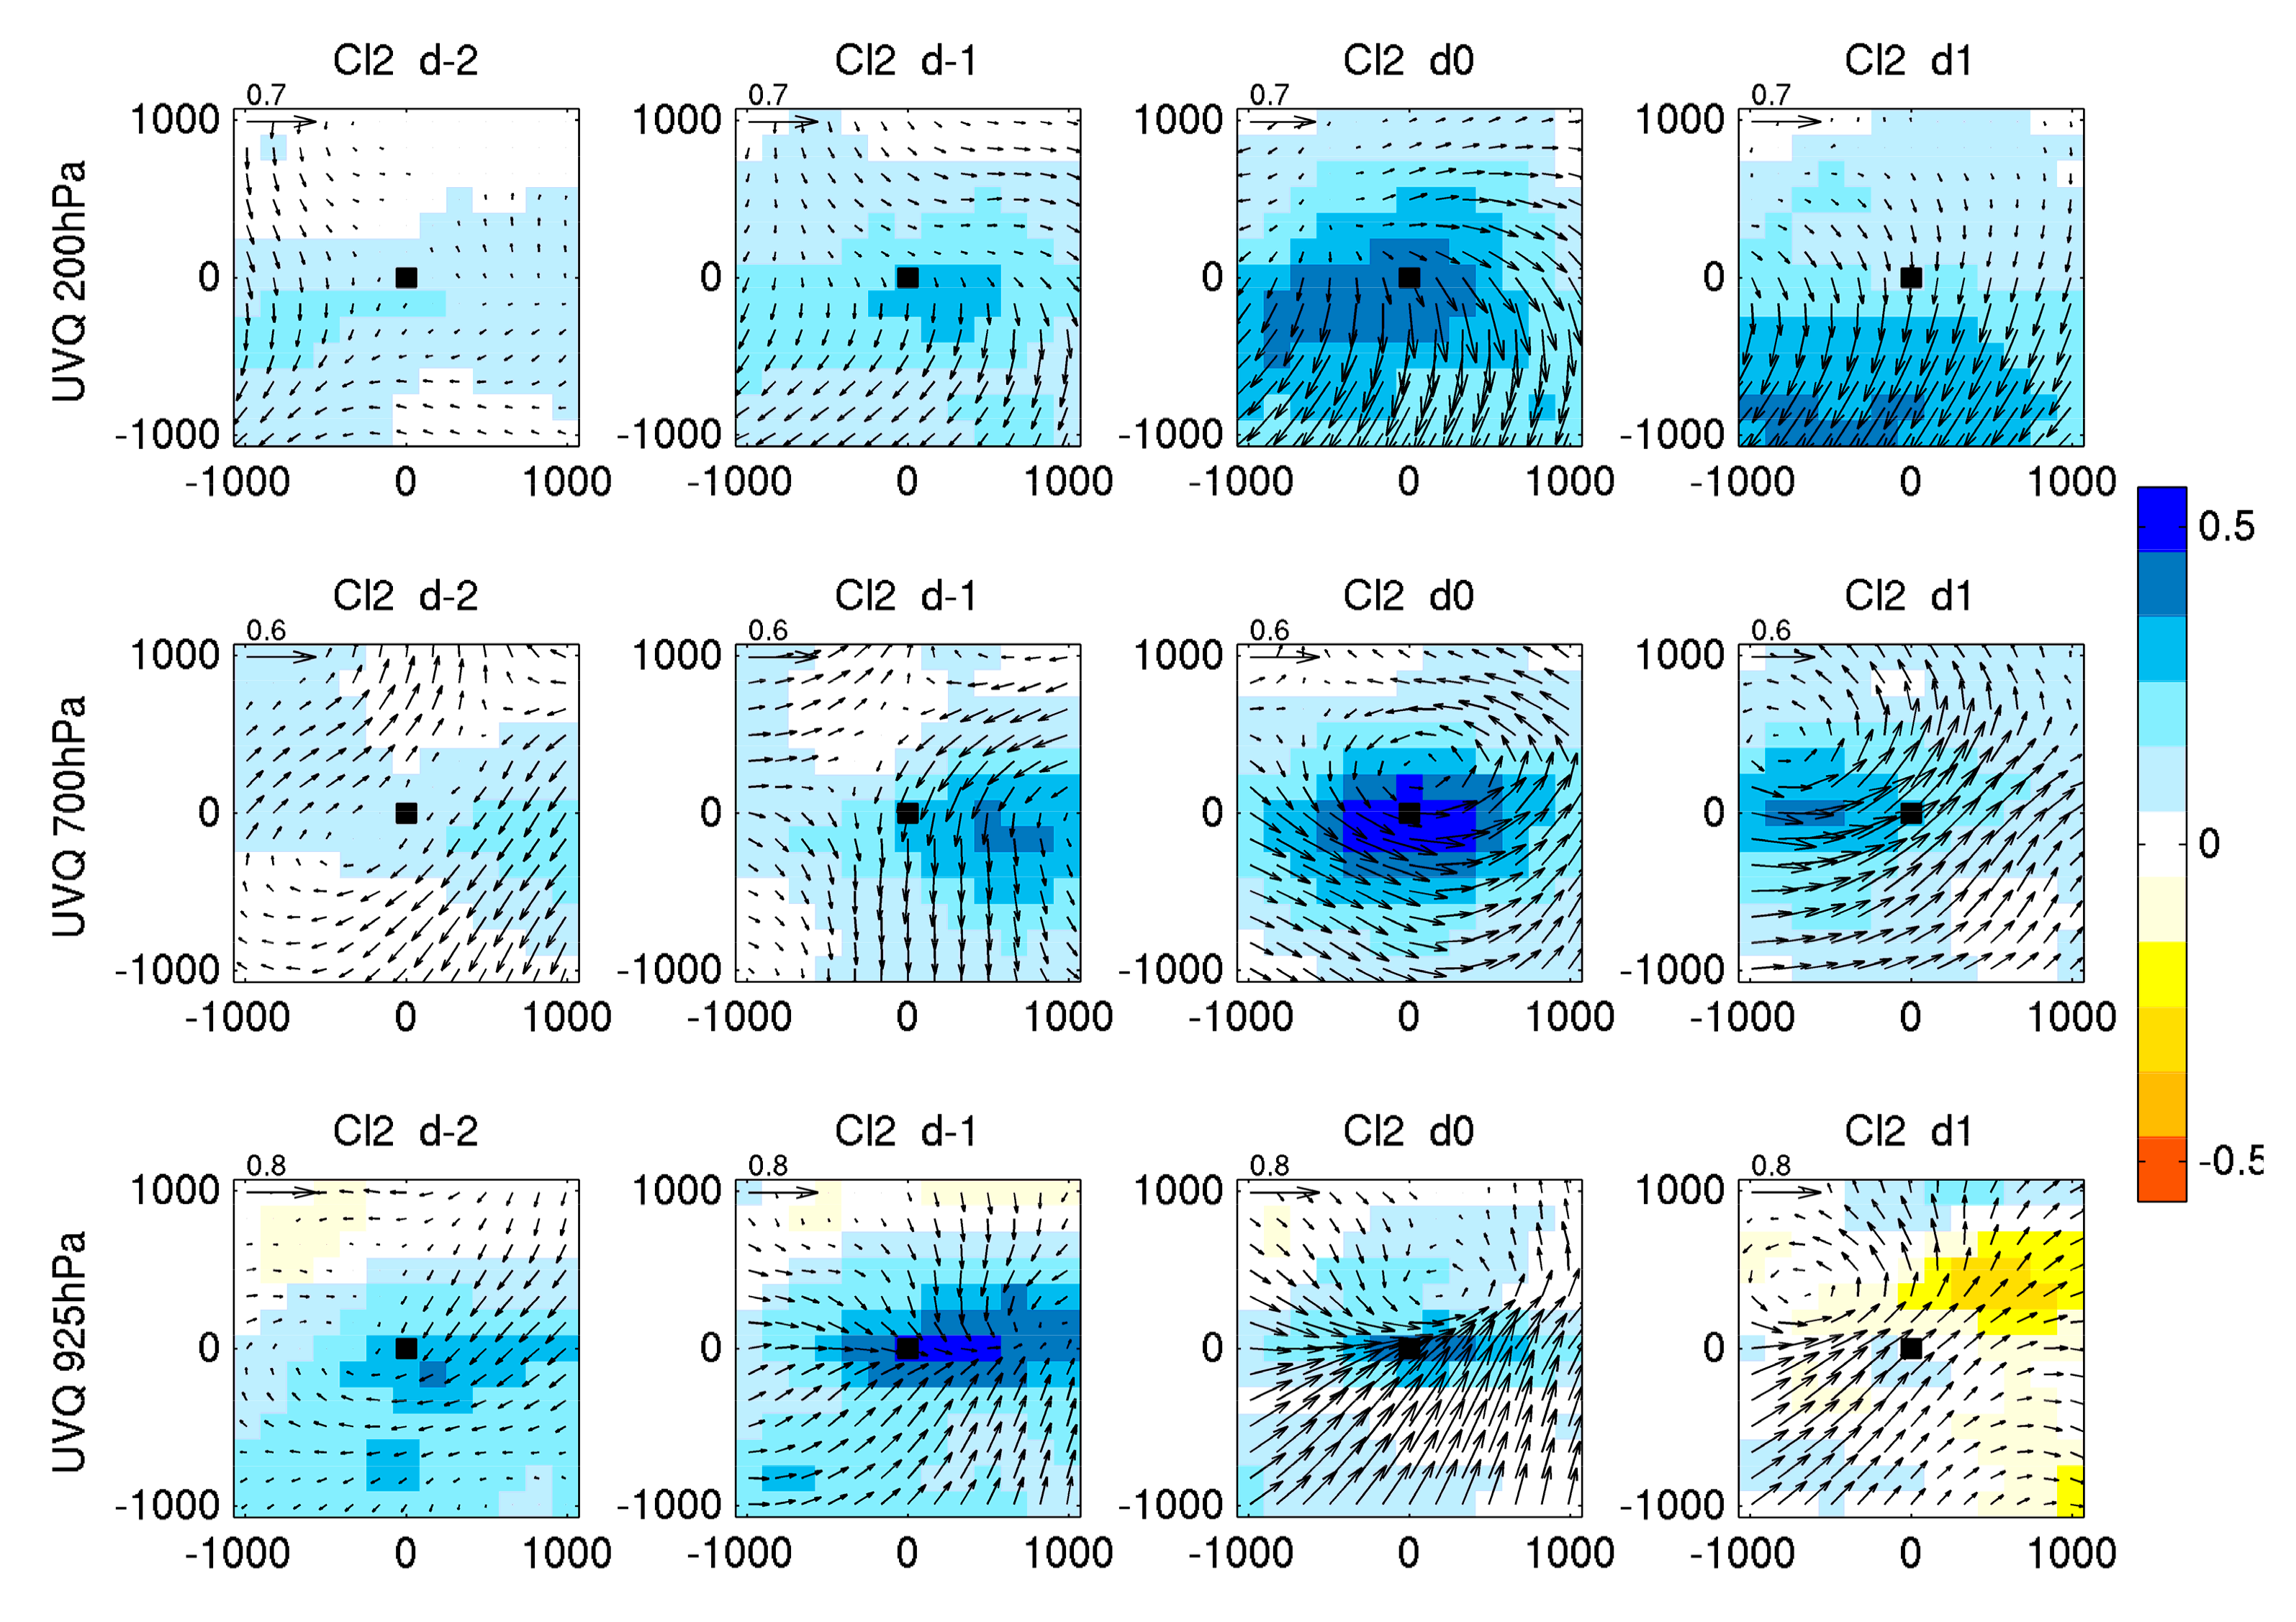
Intense rainfall events occurring south of 5° N over the Atlantic Ocean (cluster 2, Figure 12) show atmospheric features quite different from those associated with cluster 1. Positive moisture anomalies are already found a few days before the event, particularly in the low-troposphere southeast of the reference grid-point P in association with anomalous northeasterlies (D-2). There is further evidence of moisture convergence on D-1 in the low-level meridional wind flow, with strongly enhanced moisture content at the latitude of P. A southward flow is found in both the middle and upper troposphere from the latitude of point P. The low-level southwesterlies strengthen on D0, south of a cyclonic vortex centered 400 km to the north of P. At 700 hPa, the vortex is also very clear, and it shifts westward on D1, being located about 900 km northeast of P in both the low and mid troposphere. The upper tropospheric northerly anomalies strengthen and moisten on D0, which is suggestive of the outflow associated with deep convection. Together with the low-level south-westerlies, this indicates an enhanced meridional circulation south of the rainfall event. The prior (D-1) 700 hPa northerly anomalies could also denote a strengthened low atmosphere local circulation cell (LALC) as depicted by Leduc-Leballeur et al. [18]. However, south of P, the replacement of the 700 hPa easterly anomalies (D-1) by westerly anomalies (D0) also suggests the role of an eastward-moving wave, possibly a Kelvin wave, whose role on convection over the Gulf of Guinea has been earlier demonstrated [7,8].
For cluster 3 (intense events in the Bight of Benin, Figure 13), at 925 hPa, a gradual build-up of positive moisture anomalies is found south and east of the target area from D-3 (not shown) to D-1, with a strong maximum about 800 km east of point P. Like for cluster 2, it is associated with a change from easterly anomalies (D-3) to strong westerly and northwesterly anomalies (D-1), with a clear zonal moisture convergence at D-2 and meridional moisture convergence at D-1 slightly south of P. The westerlies persist on D0 and expand to the north, advecting moisture towards the target grid-point. At 700 hPa (Figure 13, middle), anomalous westerlies develop at D-2 southwest of point P and spread all over the region situated south of P. North of P northeasterly anomalies develop on D-1, ahead of a cyclonic vortex which moves westward and nearly reaches the target point on D0, then is found 800 km west of it on D1. A large 700 hPa positive moisture anomaly shifts from east to west between D-1 and D1. At 200 hPa (Figure 13, top), weak northerly anomalies prevail before the intense event. On D0 they are quickly replaced by a strong outward flow, in all directions from the reference grid-point, accompanying strongly positive moisture anomalies. This suggests an upper-level response to a deep convective cell associated with the intense rainfall. These features show many similarities with cluster 2, especially the combination between eastward and westward propagative systems, the latter associated with a cyclonic vortex. However, this vortex is found at both 925 and 700 hPa in cluster 2, while for cluster 3 it is clearly defined at 700 hPa only. Note that all the three clusters are also associated with significant (P = 0.999) positive anomalies of CAPE (Figure S1), building east of point P while strengthening from D-2 to D0, with relatively minor variations between the clusters. These anomalies range from 0.4 to 0.8 standard-deviations, which during the month of June (a peak month for the number of intense events) roughly corresponds to a 30% CAPE increase.
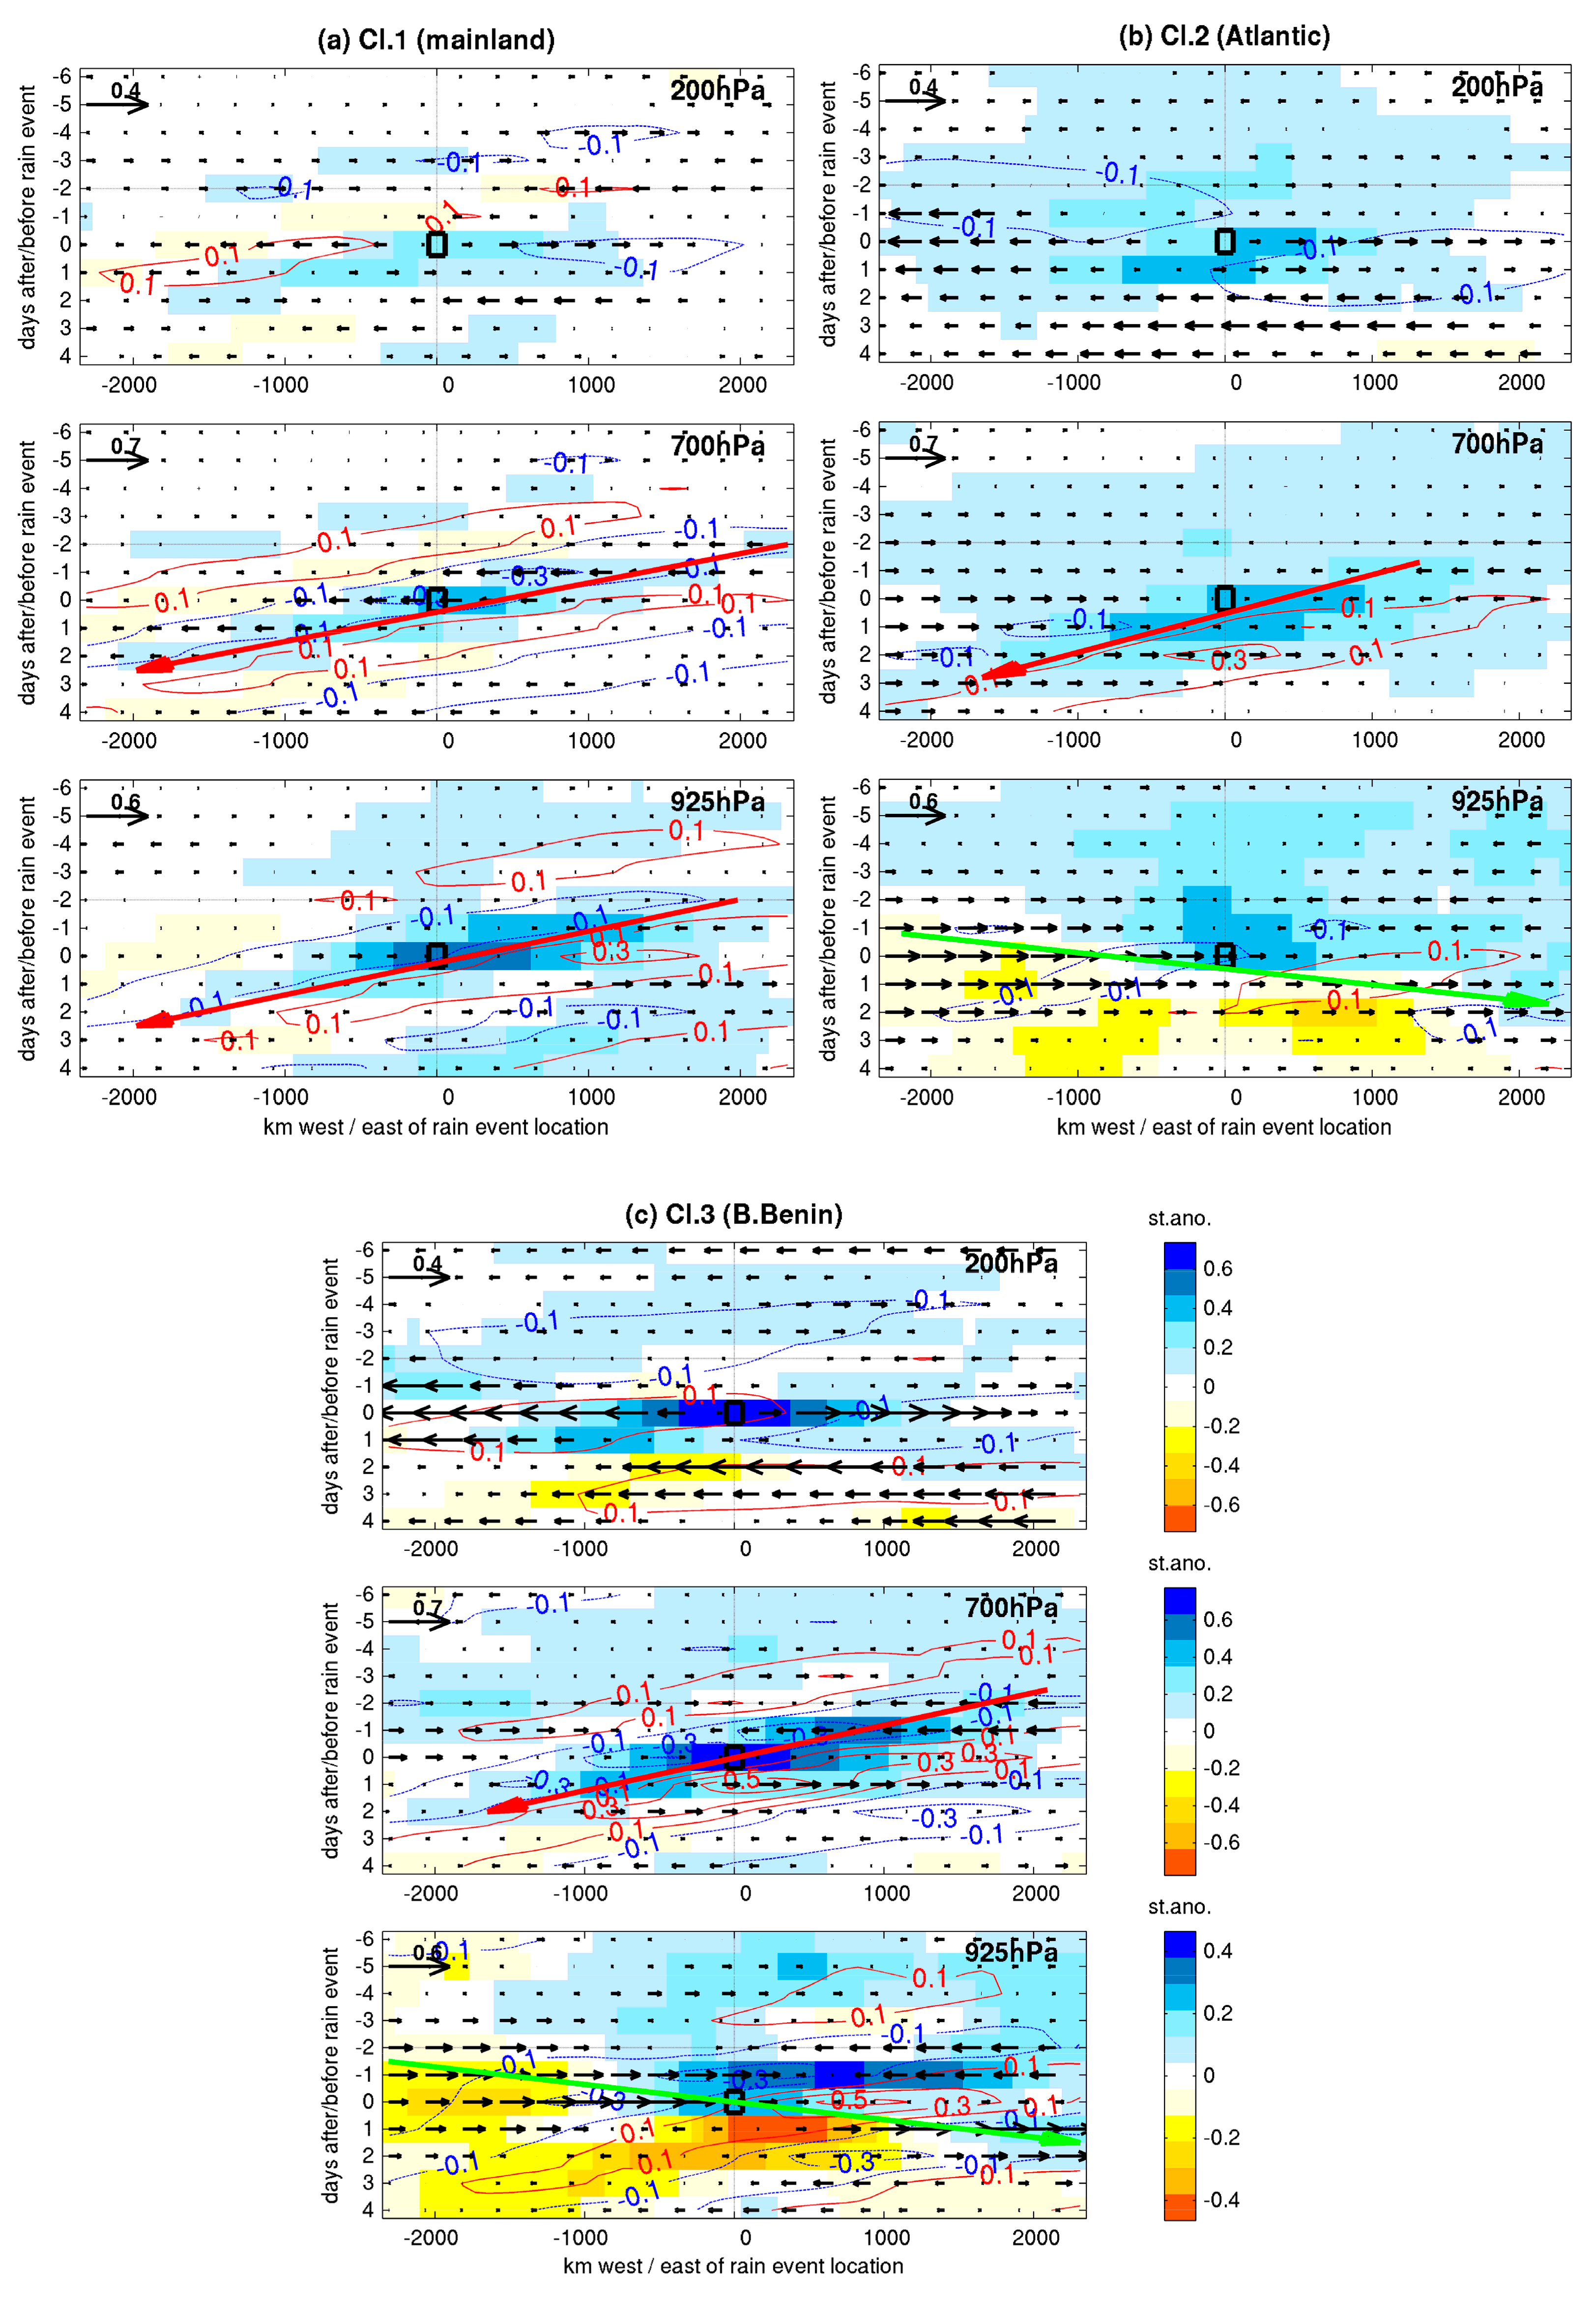
In order to further show the propagation features associated with the three types of events, time-longitude plots are drawn for a sequence of 11 days encompassing the wet event (the time-span is larger than above in order to better show the propagation speeds). The plots (Figure 14) show the deseasonalised zonal wind (vectors), meridional wind (contours) and specific humidity anomalies at 925, 700, and 200 hPa, for intense events belonging to cluster 1 (mainland, along latitudes 7–8° N), cluster 2 (Atlantic Ocean, along latitudes 4–5° N), and cluster 3 (Bight of Benin, along latitudes 4–5° N), respectively.
There are both similarities and differences between the three types of events. An identical feature is at 700 hPa (Figure 14, central panels) the westward propagation of moisture and meridional wind anomalies (as well as geopotential height, not shown). The propagative signal, in the form of a ridge-trough system, is found two days before the event around 2000 km east of the reference grid-point P, and two days after the event around 1500 km west of P (red arrows on Figure 14). This suggests a propagation speed of about 9 to 10 m/s, highly consistent with the values found for African easterly waves [48,49,50]. The wavelength, about 4000 km, is also quite typical of AEWs. However, while for cluster 1 (and cluster 3 to some extent) the northeasterly wind anomalies accompany the positive moisture anomalies, shifting westward from D-2 to D+2, for cluster 2 the pattern is different (Figure 14b). A gradual strengthening of the convergence between westerly and easterly wind anomalies is found prior to the event, with only a limited westward shift, and westerly anomalies become widespread after the rain burst.
A major contrast between the three clusters is found in both the upper and the lower troposphere (Figure 14, top and bottom panels, respectively). At 200 hPa, while for cluster 1 (mainland events) an attenuated westward propagation of both moisture and wind anomalies is reminiscent of what is observed at 700 hPa, for clusters 2 and 3 (oceanic events) the wind propagation is unclear or of very short duration after D0.
At 925 hPa, for clusters 2 and 3 (Figure 14b,c), the period leading to the intense event is characterized by a persistent positive moisture anomaly near the longitude of the wet event. Strong negative geopotential height anomalies (not shown) also predate (2–5 days) the rain burst, over a wide area covering much of the Gulf of Guinea. Westerly wind anomalies gradually build up from the west, then spread eastward. A closer inspection of the plots, especially for cluster 3, reveals a combination of westward and eastward propagation features. While 925 hPa meridional wind anomalies clearly show a westward propagation (the intense precipitation occurs in the trough, when northerly anomalies are replaced by southerly anomalies), zonal wind anomalies and to some extent moisture anomalies show an eastward propagation (green arrow on Figure 14). The propagation speed is about 17 m.s−1. This eastward propagation is also quite well defined in the 925 hPa moisture field of cluster 2. This is in line with typical patterns associated with convectively coupled equatorial Kelvin waves (CCEK) [51]. Mekonnen et al. [7], based on filtered July-September cloud brightness temperature and velocity potential at 7–12° N, found that CCEK waves were propagating at 14 m.s−1 over tropical Africa, a value close to that obtained from our unfiltered data. Kamsu-Tano et al. [8] estimated CCEK phase speed at 13 m.s−1 over the Gulf of Guinea, and Mounier et al. [6] at 15 m.s−1. This is quite consistent with the values found in this study.
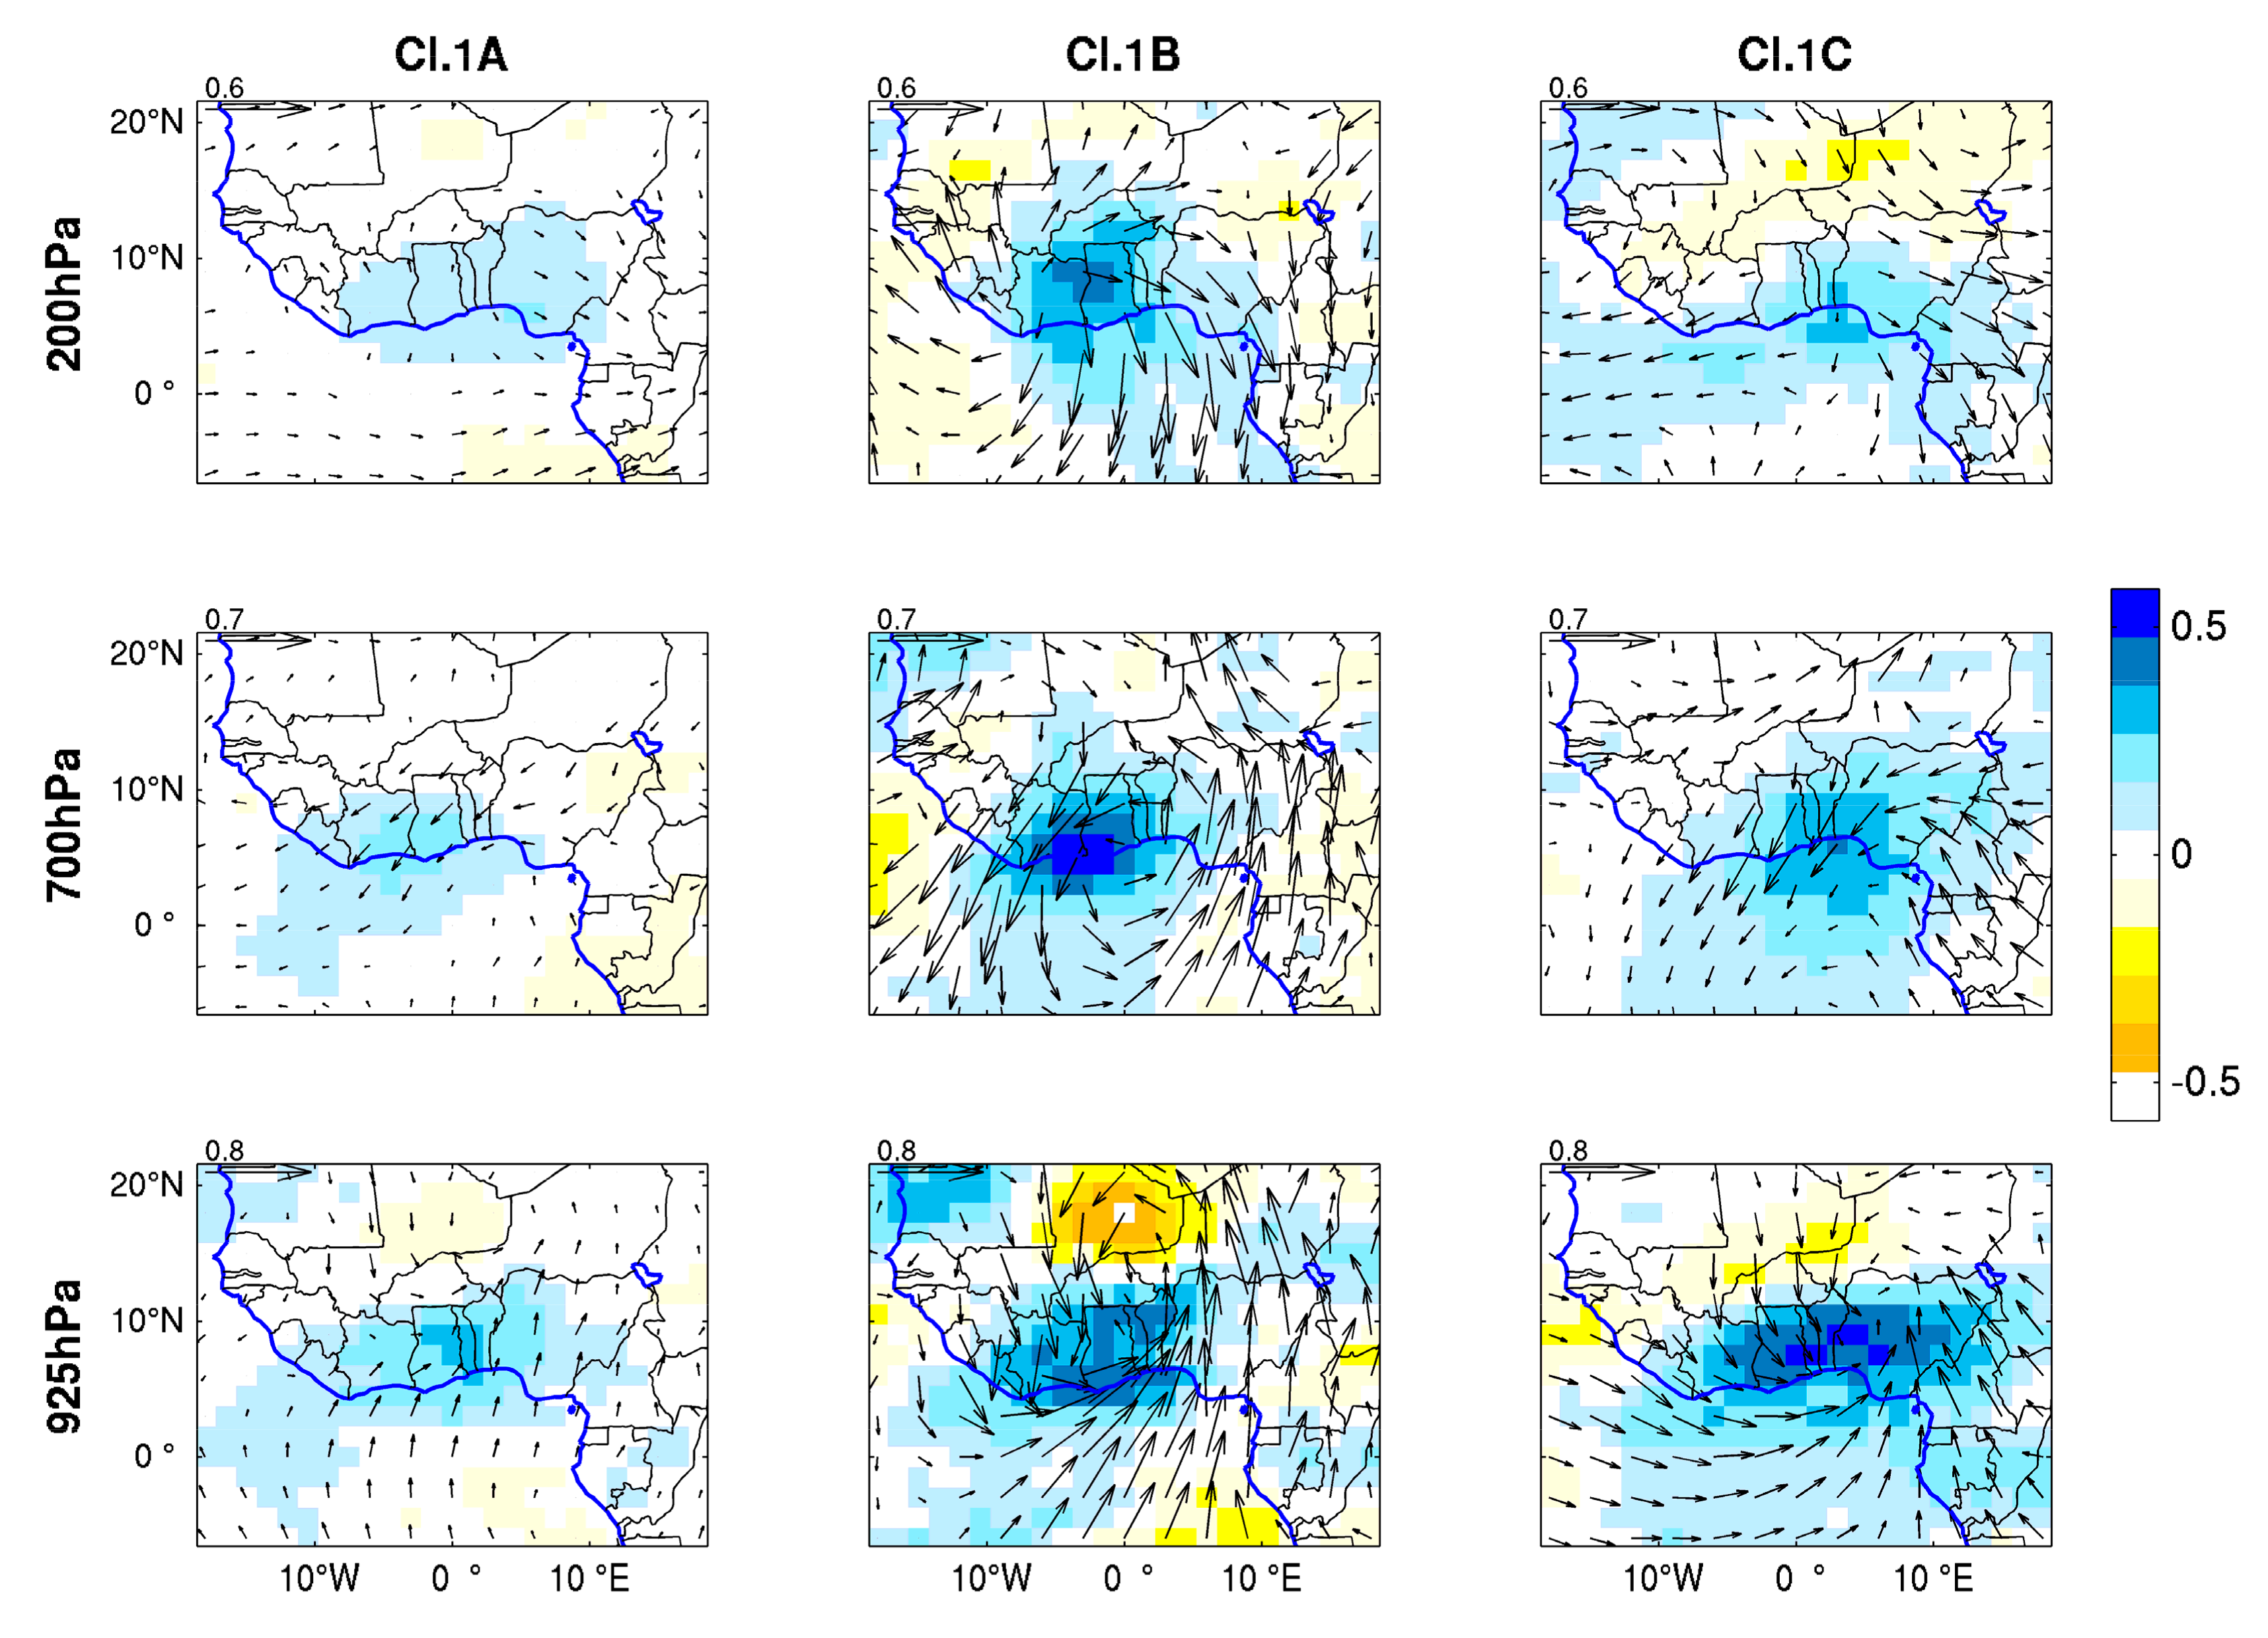
As different sub-types have been defined for the rainfall events occurring mostly over land (Section 3.1.), the corresponding days have been composited to find out whether the three clusters correspond to different atmospheric dynamics. We present the atmospheric anomalies from a fixed map (by considering the average geographical location of all the events), which does not strongly differ from the plots expressed in relative geographical coordinates but enables to better differentiate the patterns between the ocean and land surfaces. Figure 15 shows day0, and composite anomalies from d-2 to d1 for each cluster are displayed as Supplementary Materials Figures S2–S4.
Cluster 1A (rainfall events of relatively small size) is associated with weak wind and specific humidity anomalies, whatever the level (Figure 15, left panels). The most prominent wind signal is a north-easterly anomaly at 700 hPa shifting westward from South Cameroon (D-2, Figure S2) to Ghana and Ivory Coast (D0). A persistent positive humidity anomaly is also found over the study region from D-2 to D1 at 925 hPa, also detectable in the mid- and upper-troposphere on D0 and further west on D1.
By contrast, cluster 1B is associated with a large-scale atmospheric disturbance, characteristic of an easterly wave. On D0 (Figure 15), a cyclonic flow is found at 700 hPa, centered over southern Ghana (about 0°), and is accompanied by very strong positive humidity anomalies over the same region. Low-level winds are characterized by enhanced south-westerlies over the Gulf of Guinea, converging with weaker northerly anomaly winds over the continent, over a large region showing positive humidity anomalies. An anticyclonic outflow is present in the upper troposphere, with the strongest wind anomalies to the south of the region. The sequence of four days (Supplementary Materials Figure S3) provides evidence of a westward shift of this disturbance. At 700 hPa, a south-west/north-east tilted ridge gradually shifts westward between D-2 and D1. The system’s wavelength is about 4000 km. The 925 hPa flow mirrors that of 700 hPa, and a very high moisture content is already present over the Gulf of Guinea two days prior to the event, caused by a marked weakening of the south-westerly monsoon. The upper tropospheric anomalies are mainly a response to the convective outburst.
Cluster 1C shows some similarities with cluster 1B, although the wind and moisture anomalies are weaker (Figure 15, right panels). A few other specific features are to be noted: the upper tropospheric outflow, which starts on D0, peaks on D1, almost 24 hours later than for cluster 1B (Figure S4). The alternating 700 hPa tilted ridge-trough pattern characteristic of cluster 1B is more elusive in cluster 1C, suggesting the absence of a true easterly wave. Another difference is the low-level wind over the Gulf of Guinea, where easterly anomalies recede to the east from D-2, giving way to westerly anomalies which swamp the whole Gulf of Guinea on D0 and reach Central Africa on D1. This suggests the occurrence of a westerly wave near the equator, a pattern which is absent from cluster 1B. Compared to type 1B, whose circulation pattern seems to be relatively independent from the land-ocean interface, it can be surmised that type 1C is more hybrid, with more interaction between the ocean and the continent.

4. Summary and Discussion

In this study, a novel approach was tested to define the rainfall and atmospheric patterns associated with intense rainfall events at daily scale over the southern part of West Africa. The aims were to demonstrate the singularity of the coastal band along the Gulf of Guinea in terms of intense rainfall occurrence and rainfall types and to contribute to isolate the mechanisms which drive the heavy rains.
The coastal belt of Ivory Coast, Ghana, Togo, and Benin differentiates from the interior by a higher mean rainfall intensity, which is evident from the 99th centile (P99) computed from both observations and rainfall products. This is conspicuous over Ivory Coast, where the very wet coastal belt stands out on mean annual rainfall maps, as well as over the drier coastline from Ghana to Benin, where P99 (on wet days) is about 90–100 mm while it generally ranges between 70 and 80 mm inland. The seasonal distribution of these events replicates the bimodal rainfall regime, with a main peak in June (25% of all intense events over the whole region), particularly sharp along the coast.
Intense events were extracted by considering P99 at each grid-point in the region between 4–8° N and 7° W–3° E. A cluster analysis was carried out to classify these rainfall events based on their spatial pattern (8° square window) and temporal evolution (two days before to two days after the event). Three main types were distinguished (Table 3) with a very distinctive geographical signature: the first one (type 1) for the land areas, the second one (type 2) for the Gulf of Guinea south of 5°N and the last one (type 3) for the Bight of Benin. They all show some form of westward propagation, within different precipitation contexts and with rainfall structures of different shapes. For instance, type 2 intense events are embedded in a zonal belt of heavy rains (generally oceanic), while type 3 occurs on the northern rim of this belt as an initially spiral-shaped, westward propagation disturbance. Over land, three subtypes are delineated depending on the size and propagation pattern of the rain zone: (i) relatively isolated, short-duration events (1A); (ii) large-scale long-lived westward-moving disturbances (1B); (iii) locally generated rain cells north and ahead of an intensifying westward-moving disturbance (1C). We did not find evidence of a rainfall type specific to the coastline. Rather, the coastline gets intense events associated with a variety of the above rainfall types. While continental types still account for over 40% of the events (1.5 events a year at Accra and Cotonou, 1.8 at Abidjan), ocean types dominate. Type 2 (once a year on average at Abidjan) is slightly more frequent than type 3 on the western coast, west of the Cape of Three Points in Ghana. Type 3 is most common on the eastern coast (1.7 events a year at Accra, 1.8 at Cotonou). Since oceanic precipitation is on average more intense, this could help to explain the higher coastal intensity compared to inland areas. P99 maps (Figure 1) actually show that these higher coastal intensities are a mere extension of those of the oceanic domain.
The six rainfall types and subtypes all show quite distinctive associations with ERA-Interim atmospheric fields (Table 3, right part). A common feature to all types is the existence of westward-propagating signals in the 700-hPa wind field. Besides this, the continental and oceanic types strongly demarcate from each other. If we except the small-scale, short-lived rainfall systems whose atmospheric signature is weak (type 1A), continental types are clearly related to easterly waves, identified by westward propagating meridional wind anomalies (9–10 m.s−1 phase speed and about 4000 km wavelength) and associated variations in zonal wind and atmospheric moisture. Quite similar but weaker propagative signals are found for oceanic rainfall types, but they occur to the north of the rain event and are more distinctly associated with a closed cyclonic vortex. This vortex is found in both the lower and mid-troposphere for the Gulf of Guinea type (type 2), and restricted to mid-troposphere for the Bight of Benin type (type 3). The oceanic types were also distinct by the occurrence of eastward propagating signals south of the rain event. The characteristics of these signals, mostly found in the low-level zonal wind and moisture anomalies, implying enhanced moisture convergence around the time of the rain event, are consistent with those of Kelvin waves. However, some rainfall events occurring over the continent (type 1C) also show a similar but weak eastward-propagating signal, superimposed on the westward propagating signal to the north.
The comparison of the above results with other studies on rainfall types is not always straightforward because of methodological differences in the definition of these types, and because the most intense rains are not necessarily related to deep convective systems. Maranan et al. [15] classified rainfall types and found that very deep convective systems occur predominantly during the so-called “coastal phase” (March–June). They showed that on the coastline itself this category of events peaks in March. This is not necessarily inconsistent with our study which shows that the prominent months of intense events for types 2 and 3 (dominant on the coast) are May and June, since some of the rains belonging to these clusters may be of a warm type. However, the upper-tropospheric outflow suggests that deep convection is often associated with the intense events retained in our study. The positive CAPE anomalies are less indicative, since previous studies found that very high CAPE values can be associated with both intense and non-intense events [15,52].
On the whole our results are in line with earlier findings that MCSs associated with easterly waves have a decreasing contribution to local rainfall (and intense precipitation) from north to south over Western Africa. Gaye et al. [53] found that squall lines only contributed to a minor part (10%–30%) of rainfall amounts in the Guinean zone (5–8° N) during July-September 1986 and 1987. Crétat et al. [24] found that a large percentage of the intense rainfall events occurring over Benin, Togo, Ghana, and northern Ivory Coast are associated with AEWs, but this percentage quickly decreases towards the Gulf of Guinea.
Besides the “classical” AEWs, whose signature distinctly accounts for many intense rainfall events occurring inland, evidence was also found of less documented rainfall structures associated with other atmospheric patterns. Many rainfall events occurring over the Gulf of Guinea, including the Bight of Benin, display a cyclonic vortex at 925 and/or 700 hPa. Over central Benin, Fink et al. [12] noted that some rainfall events, accounting for 9% of summer rainfall in 2002, occurred south of a closed cyclonic vortex. They suggested that these events denote “monsoon rains”, of low intensity but persistent as the vortex is often quasi-stationary. While the intensity of the rains associated with our rainfall types 2 and 3 suggests other mechanisms, both show the distinct low- to mid-tropospheric vortex to the north of the rains. Although still possibly connected to easterly waves (the 700 hPa westward propagation speeds are consistent), these events differ from the “canonical” AEW pattern by showing persistent low level westerly wind anomalies and, at least for type 2, no mid-tropospheric enhancement of the African Easterly Jet, contrary to type 1 events and to characteristic features of the convectively active part of an AEW. Knippertz et al. [11] also found cyclonic and anticyclonic vortices during the 2016 DACCIWA field campaign that could not be readily associated with AEWs, and which explain some of the rainfall variability. For instance, they note the passage of a westward-propagating cyclonic vortex on 12–13 June 2016, related to an intense MCS [27], with a strong increase in rainfall over the ocean.
Our study also emphasizes the role of Kelvin waves, whose signature can be identified even without any prior data filtering. Kelvin waves were documented to move eastward from Amazonia [54] or even the Pacific Ocean [6] towards the Gulf of Guinea, and to have a noticeable effect on rainfall in West and Central Africa. This effect is particularly strong in boreal spring when the ITCZ is close to the equator [8,10], but it is still distinct in boreal summer [7]. Our results suggest that Kelvin waves contribute to the occurrence of intense rainfall events, especially over the Gulf of Guinea and nearby areas, interacting with AEWs or other westward-moving disturbances (e.g., vortex-type). This is manifest for types 2 and 3 rainfall events. Type 1C was identified as a highly localized intense rainfall event occurring ahead (west of) a large-scale westward-propagating disturbance. However, we found evidence of an interaction with an eastward propagating disturbance in the low-level wind flow over the Gulf of Guinea. The anomalous wind flow is actually highly similar to that shown over this region by Mekonnen et al. [7] in their maps of Kelvin-filtered 850 hPa winds regressed against satellite brightness temperature (their Figure 3). The pattern is also very consistent with the maps obtained by Schlueter et al. [55]. This suggests that events 1C are related to a Kelvin-wave propagation along the equator interacting with a westward-moving disturbance. Schlueter et al. [10] found that over the Guinea Coast region (5° W–5° E, 5–10° N), during the transition season (April to June plus October), AEWs and Kelvin waves were the two equatorial waves which have the strongest impact on rainfall anomalies, with mean modulation intensities of 5.7 and 4.2 mm.day−1 respectively. The present study shows that the modulation signal seems to be particularly strong for intense rainfall events.
It was uneasy in this study to find direct evidence of the role of enhanced southerlies from the South Atlantic Ocean on intense rainfall events. Leduc-Leballeur et al. [18] showed that coastal precipitation increase in May–June was a local process, induced by strong southerlies between the equator and the coast (as a result of cooler SST south of the equator and warmer north of the equator), which increase coastal convergence and drive a lower atmosphere local circulation cell. Our study suggests that, at least for the most intense rainfall events, changes in meridional winds are strongly related to zonally propagating waves, especially easterly waves. This does not mean that changes in southerlies have no impact on heavy precipitation in the region, but the dominant mechanism involves equatorial waves. For cluster 2 (intense events mostly over the ocean), the enhanced 925 hPa southerlies and 700 hPa northerly anomalies, a day before the event, are however reminiscent of the strengthened low atmospheric local circulation (LALC) described in Leduc-Leballeur et al. [18]. However, it is postulated that the LALC is mostly associated with lasting rains, producing a high rainfall accumulation over a spell of a few days, but seldom delivering very high 24-hr rainfall (the target of the present paper) unless it combines with an equatorial wave.
Given that in the present study the infra-daily timescales were not resolved, it was not possible to assess the role of diurnal coastal circulations on the genesis of the rainfall events. This is certainly an important issue which needs to be considered in further studies. Southern West Africa is affected by well-developed sea and land breezes which interact with the large-scale southwesterly monsoon in a complex way [56], depending on the orientation of the coastline [57].
Finally, this study demonstrated that the simple detection of major rainfall structures monitored over a five-day window enables the identification of different types of rainfall systems associated with quite distinct atmospheric signals. Even without any filtering of the data, it was possible to recognize different wave signatures (AEWs, Kelvin waves). The analysis also showed how these rainfall types project geographically on southern West Africa, enabling a better knowledge of the mechanisms attached to intense rainfall events in the various parts of the region. While projections for West Africa found contrasted future trends in AEWs frequency [58,59] and an increase of rainfall intensity [40,60], more focused high-resolution studies need to be carried out for the coastal area in view of its specificity in terms of rainfall intensity.

Supplementary Materials

The following are available online at https://www.mdpi.com/2073-4433/11/2/188/s1.

Author Contributions

Data curation and some analyses, M.K.; project administration, discussion of methodology, review and editing, P.R.; conceptualization, methodology and draft writing, P.C. All authors have read and agreed to the published version of the manuscript.

Funding

This research received no external funding.

Acknowledgments

The authors thank Télésphore Brou, University of La Reunion (France), Patrick Laux, IMCR, Karlsruhe Institute of Technology (Germany), and Ernest Amoussou, University of Parakou (Benin), for the provision of some observed daily rainfall data.

Conflicts of Interest

The authors declare no conflict of interest.

References

  1. CIESIN (Center for International Earth Science Information Network, Columbia University). Gridded Population of the World, Version 4 (GPWv4): Administrative Unit Center Points with Population Estimates; NASA Socioeconomic Data and Applications Center (SEDAC): Palisades, NY, USA, 2016; Available online: http://dx.doi.org/10.7927/H4F47M2C (accessed on 25 November 2019).
  2. Hallegatte, S.; Green, C.; Nicholls, R.J.; Corfee-Morlot, J. Future flood losses in major coastal cities. Nat. Clim. Chang. 2013, 3, 802–806. [Google Scholar] [CrossRef]
  3. Douglas, I.; Alam, K.; Maghenda, M.; Mcdonnell, Y.; McLean, L.; Campbell, J. Unjust waters: Climate change flooding and the urban poor in Africa. In Environ. Urban; 2008; Volume 20, pp. 187–205. [Google Scholar]
  4. Goussard, J.J.; Ducrocq, M. West African coastal area: Challenges and outlook. In The Land/Ocean Interactions in the Coastal Zone of West and Central Africa; Springer: Cham, Switzerland, 2014; pp. 9–21. [Google Scholar]
  5. Appeaning Addo, K.; Larbi, L.; Amisigo, B.; Ofori-Danson, P.K. Impacts of coastal inundation due to climate change in a cluster of urban coastal communities in Ghana, West Africa. Remote Sens. 2011, 3, 2029–2050. [Google Scholar] [CrossRef] [Green Version]
  6. Mounier, F.; Kiladis, G.N.; Janicot, S. Analysis of the dominant mode of convectively coupled Kelvin waves in the West African monsoon. J. Clim. 2007, 20, 1487–1503. [Google Scholar] [CrossRef]
  7. Mekonnen, A.; Thorncroft, C.D.; Aiyyer, A.R.; Kiladis, G.N. Convectively coupled Kelvin waves over tropical Africa during the boreal summer: Structure and variability. J. Clim. 2008, 21, 6649–6667. [Google Scholar] [CrossRef]
  8. Kamsu-Tamo, P.H.; Janicot, S.; Monkam, D.; Lenouo, A. Convection activity over the Guinean coast and Central Africa during northern spring from synoptic to intra-seasonal timescales. Clim. Dyn. 2014, 43, 3377–3401. [Google Scholar] [CrossRef] [Green Version]
  9. Diedhiou, A.; Janicot, S.; Viltard, A.; De Felice, P.; Laurent, H. Easterly wave regimes and associated convection over West Africa and tropical Atlantic: Results from the NCEP/NCAR and ECMWF reanalyses. Clim. Dyn. 1999, 15, 795–822. [Google Scholar] [CrossRef]
  10. Schlueter, A.; Fink, A.H.; Knippertz, P.; Vogel, P. A systematic comparison of tropical waves over northern Africa. Part I: Influence on rainfall. J. Clim. 2019, 32, 1501–1523. [Google Scholar] [CrossRef] [Green Version]
  11. Knippertz, P.; Fink, A.H.; Deroubaix, A.; Morris, E.; Tocquer, F.; Evans, M.J.; Marsham, J.H. A meteorological and chemical overview of the DACCIWA field campaign in West Africa in June–July 2016. Atmos. Chem. Phys. 2017, 17, 10893–10918. [Google Scholar] [CrossRef] [Green Version]
  12. Fink, A.H.; Vincent, D.G.; Ermert, V. Rainfall types in the West African Sudanian zone during the summer monsoon 2002. Mon. Weather Rev. 2006, 134, 2143–2164. [Google Scholar] [CrossRef] [Green Version]
  13. Fink, A.H.; Paeth, H.; Ermert, V.; Pohle, S.; Diederich, M. Meteorological processes influencing the weather and climate of Benin. In Impacts of Global Change on the Hydrological Cycle in West and Northwest Africa; Speth, P., Christoph, M., Diekkrueger, B., Eds.; Springer: Heidelberg, Germany, 2010; pp. 135–149. [Google Scholar]
  14. Acheampong, P.K. Rainfall anomaly along the coast of Ghana—Its nature and causes. Geogr. Ann. Ser. A Phys. Geogr. 1982, 64, 199–211. [Google Scholar]
  15. Maranan, M.; Fink, A.H.; Knippertz, P. Rainfall types over southern West Africa: Objective identification, climatology and synoptic environment. Q. J. R. Meteorol. Soc. 2018, 144, 1628–1648. [Google Scholar] [CrossRef] [Green Version]
  16. Thorncroft, C.D.; Nguyen, H.; Zhang, C.; Peyrillé, P. Annual cycle of the West African monsoon: Regional circulations and associated water vapour transport. Q. J. R. Meteorol. Soc. 2011, 137, 129–147. [Google Scholar] [CrossRef]
  17. Nguyen, H.; Thorncroft, C.D.; Zhang, C. Guinean coastal rainfall of the West African Monsoon. Q. J. R. Meteorol. Soc. 2011, 137, 1828–1840. [Google Scholar] [CrossRef]
  18. Leduc-Leballeur, M.; De Coëtlogon, G.; Eymard, L. Air-sea interaction in the Gulf of Guinea at intraseasonal time-scales: Wind bursts and coastal precipitation in boreal spring. Q. J. R. Meteorol. Soc. 2013, 139, 387–400. [Google Scholar] [CrossRef]
  19. Meynadier, R.; De Coëtlogon, G.; Leduc-Leballeur, M.; Eymard, L.; Janicot, S. Seasonal influence of the sea surface temperature on the low atmospheric circulation and precipitation in the eastern equatorial Atlantic. Clim. Dyn. 2016, 47, 1127–1142. [Google Scholar] [CrossRef] [Green Version]
  20. Panthou, G.; Vischel, T.; Lebel, T.; Blanchet, J.; Quantin, G.; Ali, A. Extreme rainfall in West Africa: A regional modeling. Water Resour. Res. 2012, 48, W08501. [Google Scholar] [CrossRef]
  21. Panthou, G.; Vischel, T.; Lebel, T. Recent trends in the regime of extreme rainfall in the Central Sahel. Int. J. Climatol. 2014, 34, 3998–4006. [Google Scholar] [CrossRef]
  22. Nkrumah, F.; Vischel, T.; Panthou, G.; Klutse, N.A.B.; Adukpo, D.C.; Diedhiou, A. Recent trends in the daily rainfall regime in Southern West Africa. Atmosphere 2019, 10, 741. [Google Scholar] [CrossRef] [Green Version]
  23. Sossa, A.; Liebmann, B.; Bladé, I.; Allured, D.; Hendon, H.H.; Peterson, P.; Hoell, A. Statistical connection between the madden—Julian oscillation and large daily precipitation events in West Africa. J. Clim. 2017, 30, 1999–2010. [Google Scholar] [CrossRef]
  24. Crétat, J.; Vizy, E.K.; Cook, K.H. The relationship between African easterly waves and daily rainfall over West Africa: Observations and regional climate simulations. Clim. Dyn. 2015, 44, 385–404. [Google Scholar] [CrossRef]
  25. Engel, T.; Fink, A.H.; Knippertz, P.; Pante, G.; Bliefernicht, J. Extreme precipitation in the West African cities of Dakar and Ouagadougou: Atmospheric dynamics and implications for flood risk assessments. J. Hydrometeorol. 2017, 18, 2937–2957. [Google Scholar] [CrossRef]
  26. Lafore, J.P.; Beucher, F.; Peyrillé, P.; Diongue-Niang, A.; Chapelon, N.; Bouniol, D.; Poan, E. A multi-scale analysis of the extreme rain event of Ouagadougou in 2009. Q. J. R. Meteorol. Soc. 2017, 143, 3094–3109. [Google Scholar] [CrossRef]
  27. Maranan, M.; Fink, A.H.; Knippertz, P.; Francis, S.D.; Akpo, A.B.; Jegede, G.; Yorke, C. Interactions between convection and a moist vortex associated with an extreme rainfall event over Southern West Africa. Mon. Weather Rev. 2019, 147, 2309–2328. [Google Scholar] [CrossRef]
  28. Huffman, G.J.; Bolvin, D.T.; Nelkin, E.J.; Wolff, D.B.; Adler, R.F.; Gu, G.; Stocker, E.F. The TRMM Multisatellite Precipitation Analysis (TMPA): Quasi-global, multiyear, combined-sensor precipitation estimates at fine scales. J. Hydrometeorol. 2007, 8, 38–55. [Google Scholar] [CrossRef]
  29. Nicholson, S.E.; Some, B.; McCollum, J.; Nelkin, E.; Klotter, D.; Berte, Y.; Noukpozounkou, J.N. Validation of TRMM and other rainfall estimates with a high-density gauge dataset for West Africa. Part II: Validation of TRMM rainfall products. J. Appl. Meteorol. 2003, 42, 1355–1368. [Google Scholar] [CrossRef]
  30. Thiemig, V.; Rojas, R.; Zambrano-Bigiarini, M.; Levizzani, V.; De Roo, A. Validation of satellite-based precipitation products over sparsely gauged African river basins. J. Hydrometeorol. 2012, 13, 1760–1783. [Google Scholar] [CrossRef]
  31. Gosset, M.; Viarre, J.; Quantin, G.; Alcoba, M. Evaluation of several rainfall products used for hydrological applications over West Africa using two high-resolution gauge networks. Q. J. R. Meteorol. Soc. 2013, 139, 923–940. [Google Scholar] [CrossRef]
  32. Amekudzi, L.K.; Osei, M.A.; Atiah, W.A.; Aryee, J.N.; Ahiataku, M.A.; Quansah, E.; Fink, A.H. Validation of TRMM and FEWS satellite rainfall estimates with rain gauge measurement over Ashanti region, Ghana. Atmos. Clim. Sci. 2016, 6, 500–518. [Google Scholar] [CrossRef] [Green Version]
  33. Prakash, S.; Mitra, A.K.; Pai, D.S.; AghaKouchak, A. From TRMM to GPM: How well can heavy rainfall be detected from space? Adv. Water Resour. 2016, 88, 1–7. [Google Scholar] [CrossRef]
  34. Sylla, M.B.; Giorgi, F.; Coppola, E.; Mariotti, L. Uncertainties in daily rainfall over Africa: Assessment of gridded observation products and evaluation of a regional climate model simulation. Int. J. Climatol. 2013, 33, 1805–1817. [Google Scholar] [CrossRef]
  35. Ashouri, H.; Hsu, K.; Sorooshian, S.; Braithwaite, D.K.; Knapp, K.R.; Cecil, L.D.; Nelson, B.R.; Prat, O.P. PERSIANN-CDR: Daily precipitation climate data record from multisatellite observations for hydrological and climate studies. Bull. Amer. Meteor. Soc. 2015, 96, 69–83. [Google Scholar] [CrossRef] [Green Version]
  36. Funk, C.; Peterson, P.; Landsfeld, M.; Pedreros, D.; Verdin, J.; Shukla, S.; Husak, G.; Rowland, J.; Harrison, L.; Hoell, A.; et al. The climate hazards infrared precipitation with stations—A new environmental record for monitoring extremes. Sci. Data 2015, 2, 150066. [Google Scholar] [CrossRef] [PubMed] [Green Version]
  37. Menne, M.J.; Durre, I.; Vose, R.S.; Gleason, B.E.; Houston, T.G. An overview of the global historical climatology network daily database. J. Atmos. Ocean. Technol. 2012, 29, 897–910. [Google Scholar] [CrossRef]
  38. Dee, D.P.; Uppala, S.M.; Simmons, A.J.; Berrisford, P.; Poli, P.; Kobayashi, S.; Bechtold, P. The ERA-Interim reanalysis: Configuration and performance of the data assimilation system. Q. J. R. Meteorol. Soc. 2011, 137, 553–597. [Google Scholar] [CrossRef]
  39. Crétat, J.; Vizy, E.K.; Cook, K.H. How well are daily intense rainfall events captured by current climate models over Africa? Clim. Dyn. 2014, 42, 2691–2711. [Google Scholar] [CrossRef]
  40. Sylla, M.B.; Giorgi, F.; Pal, J.S.; Gibba, P.; Kebe, I.; Nikiema, M. Projected changes in the annual cycle of high-intensity precipitation events over West Africa for the late twenty-first century. J. Clim. 2015, 28, 6475–6488. [Google Scholar] [CrossRef]
  41. Ta, S.; Kouadio, K.Y.; Ali, K.E.; Toualy, E.; Aman, A.; Yoroba, F. West Africa extreme rainfall events and large-scale ocean surface and atmospheric conditions in the tropical Atlantic. Adv. Meteorol. 2016. [Google Scholar] [CrossRef] [Green Version]
  42. Soro, G.É.; Dao, A.; Fadika, V.; Goula Bi, T.A.; Srohorou, B. Estimation des pluies journalières extrêmes supérieures à un seuil en climat tropical: Cas de la Côte d’Ivoire. Physio-Géo Géogr. Phys. Environ. 2016, 10, 211–227. [Google Scholar] [CrossRef]
  43. Fink, A.H.; Engel, T.; Ermert, V.; van der Linden, R.; Schneidewind, M.; Redl, R.; Janicot, S. Mean climate and seasonal cycle. In Meteorology of Tropical West Africa: The Forecasters’ Handbook; John Wiley & Sons Ltd.: Hoboken, NY, USA, 2017; pp. 1–39. [Google Scholar]
  44. Kpanou, M.; Laux, P.; Brou, T.; Vissin, E.; Camberlin, P.; Roucou, P. Spatial patterns and trends of extreme rainfall over the southern coastal belt of West Africa. Theor. Appl. Climatol. 2019. under review. [Google Scholar]
  45. Mathon, V.; Laurent, H. Life cycle of Sahelian mesoscale convective cloud systems. Q.J.R. Meteorol. Soc. 2001, 127, 377–406. [Google Scholar] [CrossRef]
  46. Michelangeli, P.-A.; Vautard, R.; Legras, B. Weather regimes: Recurrence and quasi stationarity. J. Atmos. Sci. 1995, 52, 1237–1256. [Google Scholar] [CrossRef]
  47. Moron, V.; Robertson, A.W.; Ward, M.N.; Ndiaye, O. Weather types and rainfall over Senegal. Part I: Observational analysis. J. Clim. 2008, 21, 266–287. [Google Scholar] [CrossRef] [Green Version]
  48. Reed, R.J.; Klinker, E.; Hollingsworth, A. The structure and characteristics of African easterly wave disturbances as determined from the ECMWF operational analysis/forecast system. Meteor. Atmos. Phys. 1988, 38, 22. [Google Scholar] [CrossRef]
  49. Kiladis, G.N.; Thorncroft, C.D.; Hall, N.M. Three-dimensional structure and dynamics of African easterly waves. Part I: Observations. J. Atmos. Sci. 2006, 63, 2212–2230. [Google Scholar] [CrossRef]
  50. Berry, G.; Thorncroft, C.; Hewson, T. African easterly waves during 2004—Analysis using objective techniques. Mon. Weather Rev. 2007, 135, 1251–1267. [Google Scholar] [CrossRef]
  51. Kiladis, G.N.; Wheeler, M.C.; Haertel, P.T.; Straub, K.H.; Roundy, P.E. Convectively coupled equatorial waves. Rev. Geophys. 2009, 47. [Google Scholar] [CrossRef]
  52. Nicholls, S.D.; Mohr, K.I. An analysis of the environments of intense convective systems in West Africa in 2003. Mon. Weather Rev. 2010, 138, 3721–3739. [Google Scholar] [CrossRef] [Green Version]
  53. Gaye, A.; Viltard, A.; de Félice, P. Lignes de grains et pluies en Afrique de l’Ouest: Part des lignes de grains à la pluie totale des étés 1986 et 1987. Sci. Chang. Planétaires/Sécheresse 2005, 16, 269–273. [Google Scholar]
  54. Wang, H.; Fu, R. The influence of Amazon rainfall on the Atlantic ITCZ through convectively coupled Kelvin waves. J. Clim. 2007, 20, 1188–1201. [Google Scholar] [CrossRef] [Green Version]
  55. Schlueter, A.; Fink, A.H.; Knippertz, P. A systematic comparison of tropical waves over northern Africa. Part II: Dynamics and thermodynamics. J. Clim. 2019, 32, 2605–2625. [Google Scholar] [CrossRef]
  56. Gbambie, A.S.B.; Steyn, D.G. Sea breezes at Cotonou and their interaction with the West African monsoon. Int. J. Climatol. 2013, 33, 2889–2899. [Google Scholar] [CrossRef]
  57. Cautenet, S.; Rosset, R. Numerical simulation of sea breezes with vertical wind shear during dry season at cape of three points, West Africa. Mon. Weather Rev. 1989, 117, 329–339. [Google Scholar] [CrossRef] [Green Version]
  58. Skinner, C.B.; Diffenbaugh, N.S. Projected changes in African easterly wave intensity and track in response to greenhouse forcing. PNAS 2014, 111, 6882–6887. [Google Scholar] [CrossRef] [PubMed] [Green Version]
  59. Martin, E.R.; Thorncroft, C. Representation of African easterly waves in CMIP5 models. J. Clim. 2015, 28, 7702–7715. [Google Scholar] [CrossRef]
  60. Dosio, A.; Jones, R.G.; Jack, C.; Lennard, C.; Nikulin, G.; Hewitson, B. What can we know about future precipitation in Africa? Robustness, significance and added value of projections from a large ensemble of regional climate models. Clim. Dyn. 2019, 53, 5833–5858. [Google Scholar] [CrossRef] [Green Version]
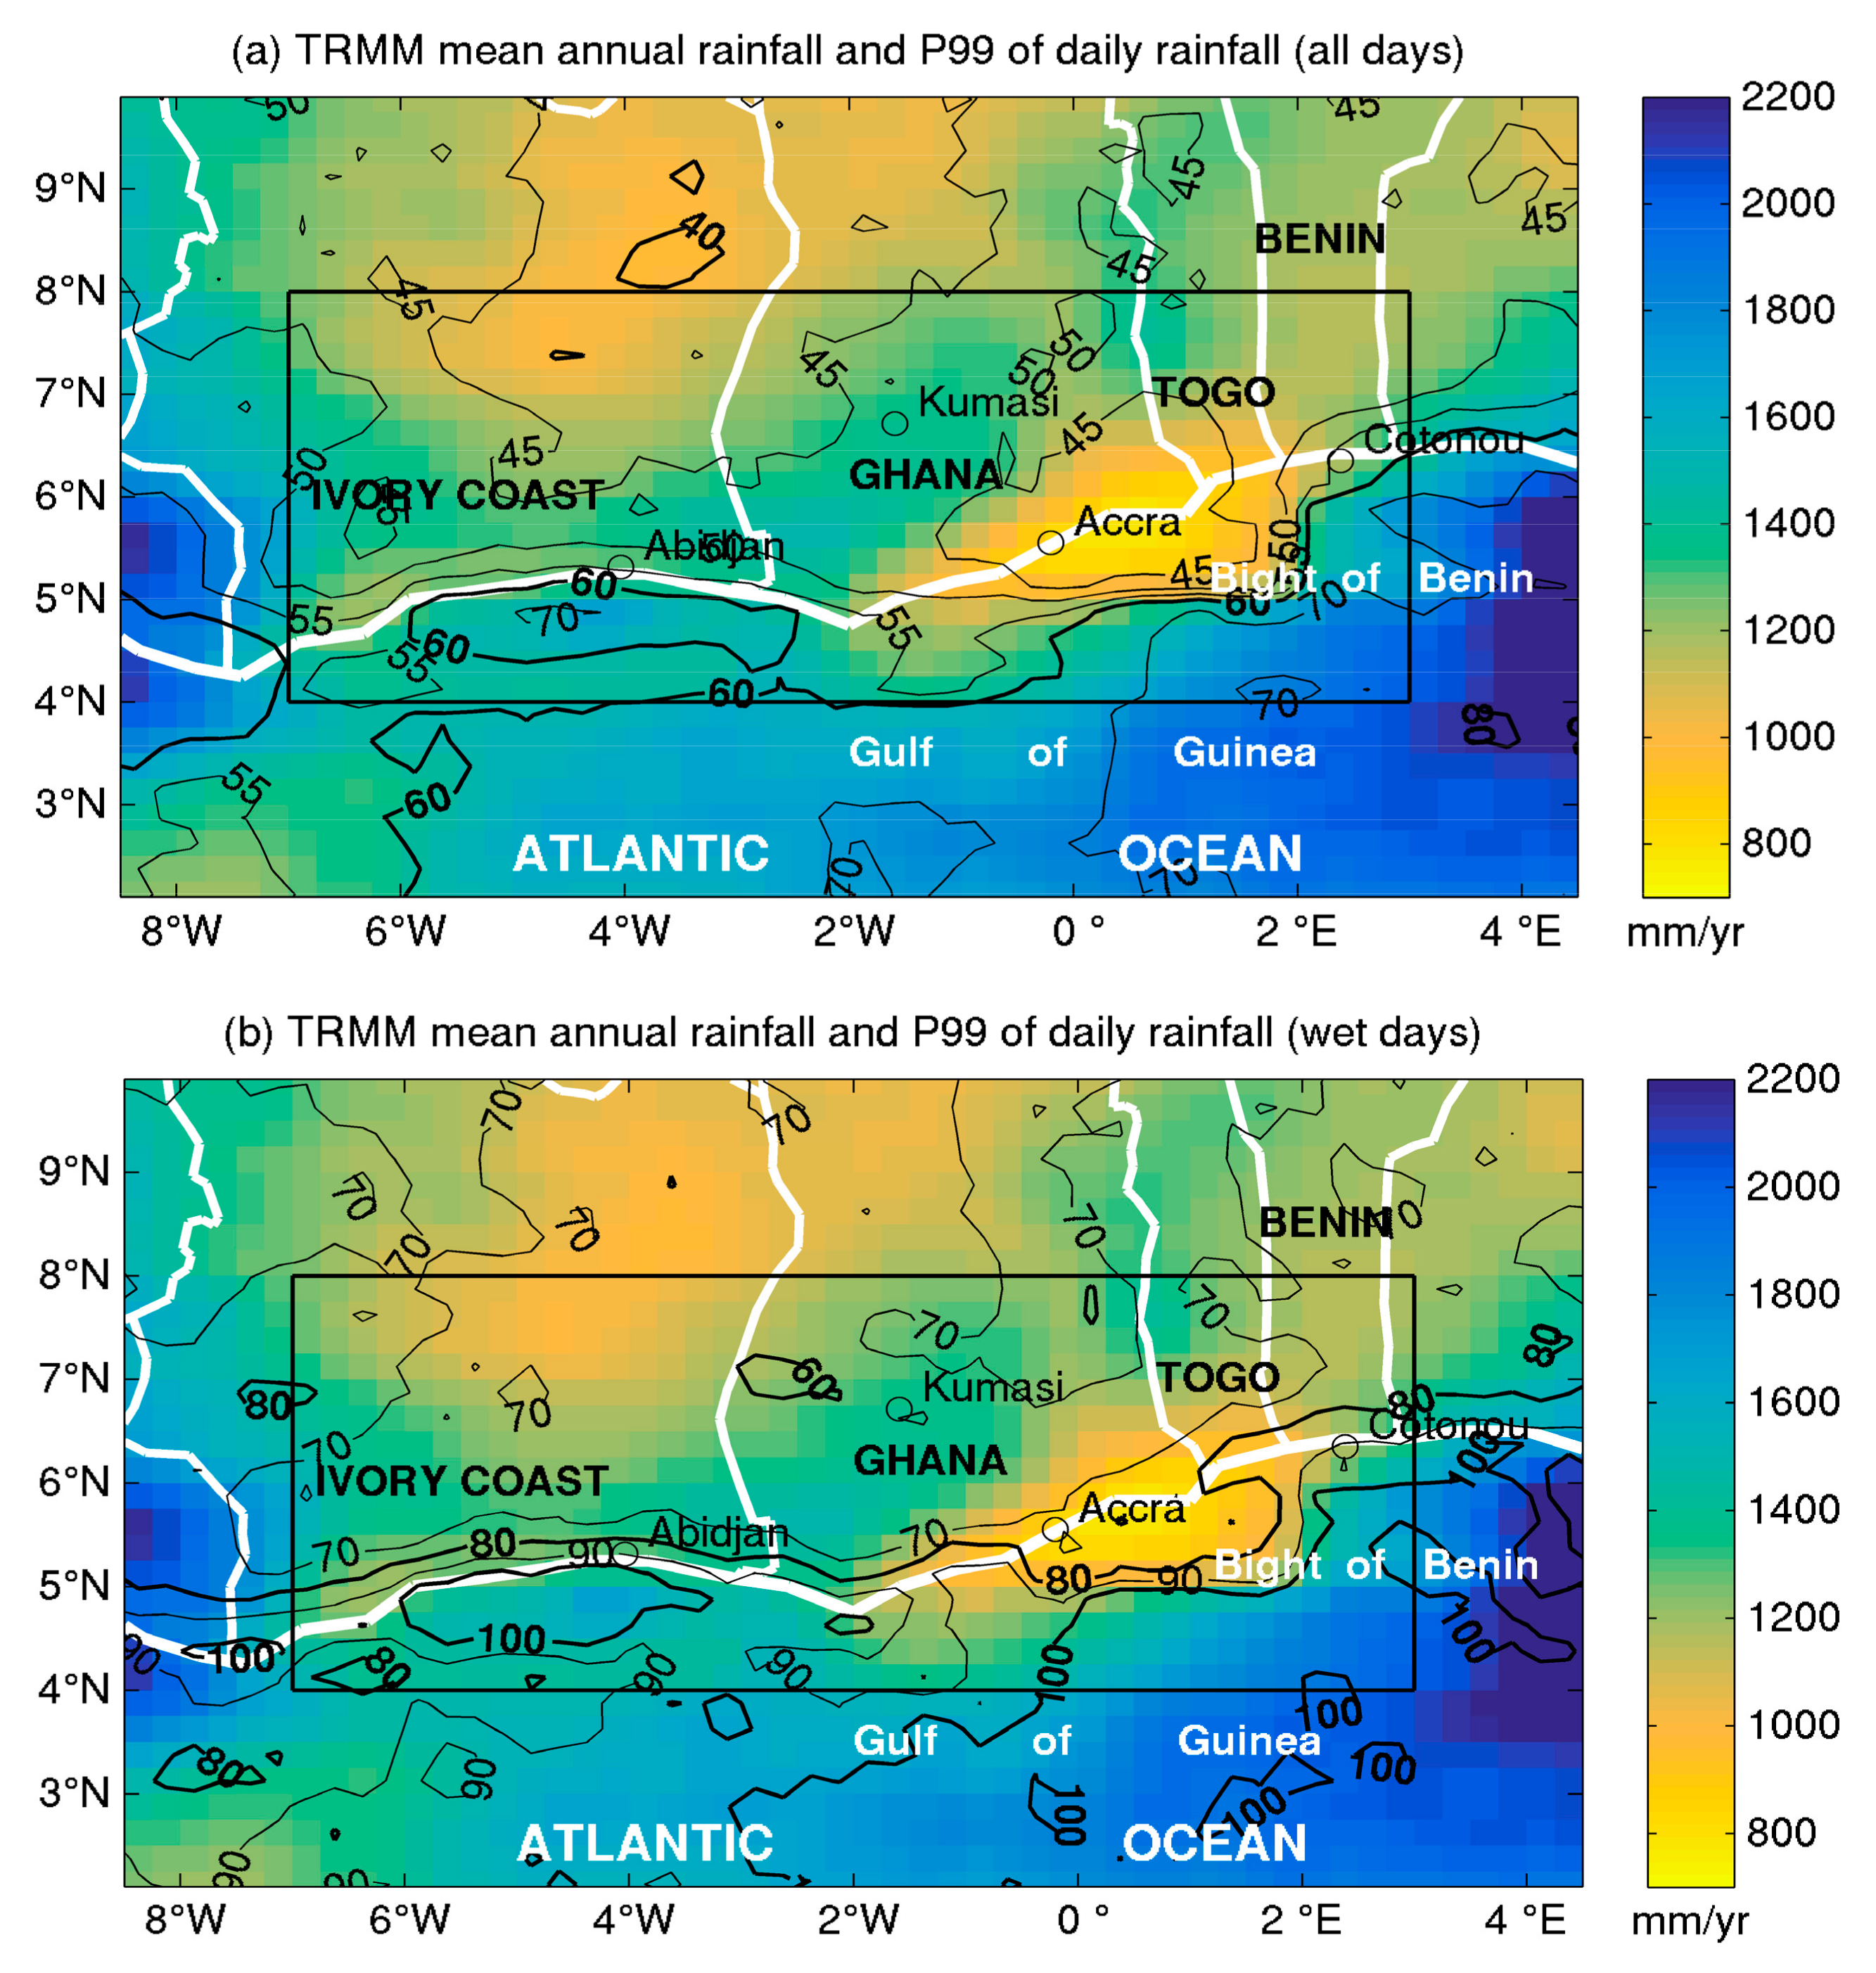
Figure 1. Mean annual rainfall (contours in mm) and 99th percentile of daily rainfall (P99, shadings) from TRMM data. P99 is computed from both wet and dry days (a) or from wet days only (b). The area over which intense rainfall events are analyzed is boxed.
Atmosphere 11 00188 g001
Figure 2. Spatial distribution of observed mean annual rainfall (color squares) and values of the 99th percentile (P99) of daily rainfall (values in mm). (a) P99 computed using all days (wet and dry); (b) P99 computed using wet days only, with values above 80 mm in red.
Atmosphere 11 00188 g002
Figure 3. Mean annual precipitation and 99th percentile of daily precipitation at the 38 stations (observed data, 1951–2015): (a) all days; (b) wet days only.
Atmosphere 11 00188 g003
Figure 4. Mean monthly rainfall and number of intense rainfall events averaged over the study area (4–8° N, 7° W–3° E TRMM data).
Atmosphere 11 00188 g004
Figure 5. Typing of intense rainfall events: cluster 1. Top panels: spatial rainfall patterns, in relative coordinates (km around the grid-point where the event occurs, denoted by a black square), for each day of the 5-day sequence (2 days before to 2 days after the event). Central panel: geographical distribution of the number of intense events pertaining to the cluster. Bottom panels: seasonal distribution of the events (right) and interannual variations of the number of events (left).
Atmosphere 11 00188 g005
Figure 6. Same as Figure 5 but for cluster 2.
Atmosphere 11 00188 g006
Figure 7. Same as Figure 5 but for cluster 3.
Atmosphere 11 00188 g007
Figure 8. Percentage of intense local rainfall events pertaining to each cluster.
Atmosphere 11 00188 g008
Figure 9. Hovmöller diagram of 3-hour TRMM 3B42 rainfall along latitude 5–6° N for a sample of intense rainfall events in the region around Accra, Ghana (daily rainfall above the 99th percentile in the area 5–6° N, 0.5° W–0.5° E). The intense rainfall events are shown as red squares and labelled.
Atmosphere 11 00188 g009
Figure 10. Sub-types (a) 1A, (b) 1B, and (c) 1C of daily rainfall distribution patterns associated with cluster 1 (mainly land areas). Small panels: rainfall maps centered on the grid-point where the event occurs (black square), for each day of the 5-day sequence (2 days before to 2 days after the event). Larger panels: geographical distribution of the number of intense events pertaining to each subtype and monthly frequency of each subtype.
Atmosphere 11 00188 g010
Figure 11. Composite anomalies of wind (vectors) and specific humidity (shadings) associated with intense rainfall events over the continent (cluster 1), from 3 days before to 1 day after the event. Blank: non-significant anomalies (P = 0.999). Units: normalized anomalies on deseasonalised data. Vertical axes are latitudes and horizontal axes are longitudes, scaled in kilometers from the grid-point where the rainfall event occurs (P, black square). Dashed lines show the approximate location of 700 hPa ridges (R) and troughs (T).
Atmosphere 11 00188 g011
Figure 12. Same as Figure 11 but for cluster 2.
Atmosphere 11 00188 g012
Figure 13. Same as Figure 11 but for cluster 3.
Atmosphere 11 00188 g013
Figure 14. Time-longitude plots of zonal wind (black vectors), meridional wind (contours) and specific humidity (shading) anomalies, for intense rainfall events belonging to cluster 1 (7–8° N, panel a), cluster 2 (4–5° N, panel b) and cluster 3 (4–5° N, panel c). Time varies from 6 days before (d-6) to 4 days after (d4) the intense rainfall event (d0). The x-axis shows distances west and east of point P where the intense event occurs (black square). Positive meridional wind anomalies are in red (southerlies) and negative anomalies in blue (northerlies). Large arrows show approximate westward (red) and eastward (green) propagations based on zonal wind and humidity anomalies.
Atmosphere 11 00188 g014
Figure 15. Composite anomalies of wind (vectors) and specific humidity (shadings) associated with rainfall events of clusters 1A, 1B and 1C at the time of the event (day D0). The locations of all events being different from each other, the composite is based on the average location. Blank: non-significant anomalies (P = 0.999). Units: normalized anomalies on deseasonalised data.
Atmosphere 11 00188 g015
Table 1. Values of P99 (mm/day, computed from both wet and dry days) averaged from the 38 stations (OBS) and the nearest grid-point of three rainfall estimation products (TRMM, PERSIANN and CHIRPS), and corresponding skill scores (absolute bias and RMSE, in mm). For PERSIANN and CHIRPS, bracketed values indicate the mean for the period 1998–2014 instead of the full record.
OBSTRMMPERSIANNCHIRPS
Mean554929 (28)40 (39)
Bias −6−26−15
RMSE 112717
Table 2. Mean annual number of days for the different types of events at major towns of southern West Africa (the total number is 3.6 events per year for each location). Abidjan, Accra and Cotonou are coastal towns while Kumasi is located inland.
TypeAbidjanAccraCotonouKumasi
11,81,51,52,7
1A0,60,30,60,6
1B0,30,30,31,0
1C0,80,90,51,1
21,00,50,40,2
30,91,71,80,7
Table 3. Summary of the rain types and associated atmospheric patterns.
Rainfall typesRainfall Pattern Most Frequent Location (and season)Atmospheric Pattern
1Oval-shaped, westward to southwestward- moving disturbanceLand areas
(Whole year except winter)
Easterly wave
1AIsolated, small-size and short duration eventLand areas, especially Ghana-Ivory Coast border
(March-June + October)
Very weak anomalies – low-level moisture convergence and westward-moving easterly wind anomaly
1BLarge-scale, westward-moving disturbanceMostly land areas, Eastern Ghana and Central Ivory Coast
(June-October)
Clearly defined easterly wave and low-level westward-moving vortex, upper tropospheric outflow
1CIsolated rain cell, ahead of a westward to southwestward-moving disturbanceLand areas, 50-200 km the Ghana, Togo and Benin coast
(April-June + September-October)
Less-well defined easterly wave, eastward-moving low level zonal wind anomalies over G. of Guinea (likely Kelvin wave), upper tropospheric outflow
2Zonal band, very persistent, with secondary westward-moving disturbanceOcean (south of 5°N)
(May-July, sharp peak in June)
Westward propagating cyclonic vortex (mid- and low troposphere) to the north
Kelvin wave to the south (low troposphere zonal wind and moisture anomalies)
Southward upper-tropospheric outflow
3Westward-moving disturbance north of a persistent rainbandOcean (Bight of Benin)
(April-June)
Westward propagating cyclonic vortex (mid- troposphere) to the north
Kelvin wave to the south (low troposphere zonal wind and moisture anomalies)
Upper-tropospheric outflow