Article

Can the Aerosol Absorption Ångström Exponent Represent Aerosol Color in the Atmosphere: A Numerical Study

1
Collaborative Innovation Center on Forecast and Evaluation of Meteorological Disasters, Nanjing University of Information Science & Technology, Nanjing 210044, China
2
Key Laboratory for Aerosol-Cloud-Precipitation of China Meteorological Administration, School of Atmospheric Physics, Nanjing University of Information Science & Technology, Nanjing 210044, China
*
Author to whom correspondence should be addressed.
Atmosphere 2020, 11(2), 187; https://doi.org/10.3390/atmos11020187
Submission received: 8 January 2020 / Revised: 28 January 2020 / Accepted: 5 February 2020 / Published: 11 February 2020
(This article belongs to the Special Issue Atmospheric Carbonaceous Aerosols)

Abstract

:
The aerosol absorption Ångström exponent (AAE) is widely used to indicate aerosol absorption spectrum variations and is an important parameter for characterizing aerosol optical absorption properties. This study discusses the relationship between aerosol AAEs and their colors numerically. By combining light scattering simulations, a two-stream radiative transfer model, and an RGB (Red, Green, and Blue) color model, aerosol colors that can be sensed by human eyes are numerically generated with both the solar spectrum and human eye response taken into account. Our results indicate that the responses of human eyes to visible light might be more significant than the incident spectrum in the simulation of aerosol color in the atmosphere. Using the improved numerical simulation algorithm, we obtain the color change of absorption aerosols with different AAEs. When the AAE value is small, the color of the aerosol is generally black and gray. When the AAE value increases to approximately 2 and the difference between the light transmittances at wavelengths of 400 nm and 730 nm is greater than 0.2, the aerosol will appear brown or yellow.

1. Introduction

Aerosols have important influences on global radiation, the formation of clouds, environmental problems, and climate [1,2]. The optical and physical properties of aerosols determine their radiation effects. The color of aerosols observed by the human eye is the first impression of matter, which is possible to be helpful to better understand the optical and physical properties of aerosols. The optical properties of aerosols are significantly affected by particle shape, scale distribution, and composition. As these properties change considerably when aerosols exist in the ambient atmosphere, the color of an aerosol can differ from the color of its substance or the color of its solution [3]. Meanwhile, light-absorbing aerosols such as black carbon (BC) and brown carbon (BrC) are directly named after their visual color appearance [4]. Because nearly 40% of solar energy is concentrated in the 400–600 nm band, the color of an aerosol is largely determined by the absorption and scattering of the aerosol in the visible light band [5]. The assessment of the influence of aerosols on climate is determined not only by the distribution of aerosols but also by their size, composition, and optical properties, including absorption properties [6]. The differences in black carbon, organic carbon and mineral aerosol composition in mixed aerosols will lead to differences in their optical properties [7]. The study of the optical properties of aerosols can be used as the basis for the classification of aerosol composition. The optical properties of aerosols produced by wood combustion were studied with the photochemical aging of aerosols. Results showed that the residence time of the organic carbon color in biomass combustion was prolonged by a high NOX content and that the dissipation of aerosol color was accelerated by high relative humidity [8]. The aerosol color ratio over Wuhan was investigated, and the research showed that an aerosol color ratio between 0.3 and 2.0 km is large, suggesting that there are a large number of coarse particles in this range. The color ratio and its relationship with the spatial aerosol distribution under different weather conditions was also analyzed [9]. In conclusion, the color of aerosols can be used as an intuitive means to understand the optical properties, scale distribution, and chemical components of aerosols and their absorption and scattering of radiation from the earth.
Observational research and numerical simulation are two common methods used to reveal aerosol colors. Observation by using instruments such as scanning or transmission electron microscopes can offer intuitive appearances of a single aerosol particle [10,11,12]. The colors of aerosol samples are usually shown as photos. The colors of carbonaceous aerosols are typically found to be black, brown, or yellow [4,13]. Interestingly, the colors of aerosol layers in the atmosphere are also briefly revealed by numerical modelling. A numerical model was developed for simulating the colors of carbonaceous aerosols in the atmosphere that offers some interesting discussions on aerosol color features [14]. However, this model was oversimplified because the complexity of the spectrum and the characteristics of eyes can influence the color seen by human eyes, but they were not considered in the model at all. Simulations under different conditions (configurations of spectrum and response function) have been performed, and the importance of the solar spectrum and human eye response function to color simulations of aerosols have been discussed.
Absorbing carbonaceous aerosols have been considered; for example, BC aerosols are an important component of atmospheric aerosols that are mainly released from the incomplete combustion of materials composed of carbon, such as fossil fuels and biofuels [15,16]. BC aerosols strongly absorb solar radiation and have shown to have significant warming effects on the climate [17]. BC has a strong ability to absorb visible part of the solar radiation, so it has an important influence on the distribution of visible light in the atmosphere [18]. The color of different carbonaceous aerosol layers under solar radiation will also be obviously different.
The absorption Ångström exponent (AAE) describes the wavelength dependence of aerosol absorption and is widely used in representing the aerosol composition or type. After calculation of the aerosol absorption optical depth (AAOD) spectra at 11 sites representative of different aerosol types whose data are from AERONET [19], the AAE values were found to be strongly correlated with aerosol composition or type [7]. In aerosol automatic observation networks or other experimental results, the AAE is often used as the key parameter to understand aerosol properties [20,21]. The AAE is also widely used in the estimation of aerosol radiative forcing [22,23]. The AAE can control the color of aerosols to a great extent, and the value of the AAE is affected by the size and geometry of the aerosols [24]. The AAE values of aerosol layers cannot only be obtained by remote sensing measurements, but also by calculating the microphysical parameters of the material. In our research, the colors of aerosols are simulated by using our improved simulation algorithm, and the AAE values of aerosols are calculated at the same time under different settings of aerosol layer optical properties, which means we can quantitatively obtain the correspondence between the AAE values and the colors of aerosol layers. The color simulation results of aerosols whose AAE values vary from 1 to 7 are shown in this paper. The aerosol layer parameters that have characteristic colors are defined in our research.

2. Improvement and Discussion of the Numerical Model for Color Simulation

The configuration of our simulation is illustrated in Figure 1. Solar light passes an aerosol layer and reaches an observer. The incident light is scattered and absorbed by the aerosol layer. The transmitted light is understood as the light seen by human eyes. The optical properties of the whole layer determine the amount of transmitted energy of each wavelength, i.e., the spectral radiances.
In brief numerical modeling, three monochromatic waves with the same intensity at three monochromatic wavelengths, i.e., 700 nm, 546 nm, and 436 nm, are assumed to be the incident light [14], whereas the actual incident solar spectrum is continuous. Thus, we improved the previous model from two aspects. First, we consider a more accurate high-resolution solar spectrum instead of a discontinuous monochromatic spectrum as the incident light. Second, we incorporate the spectral response function of human photoreceptors into the color simulation model. The human eye has different sensitivities to different wavelengths of light and will produce different color visual responses. The human eye is only sensitive to light in the visible band, so we consider a high-resolution spectrum with wavelengths from 400 to 730 nm in steps of 5 nm.
The color of BC aerosol is simulated in three steps. First, according to the optical parameters of a single BC particle, the bulk optical properties of an aerosol layer with different sized particles are obtained. Second, radiative transfer simulations are performed to obtain the intensities of light passing through the aerosol layer. Last, we convert the intensities of the transmitted light at single wavelengths into parameters that describe colors and visualize them. The required data in the color simulation of BC aerosols include the refractive indices as a function of wavelength, the solar spectrum, and the response curves of the human eye.
The refractive index is one of the basic optical parameters of BC aerosols. Different refractive indices, as a function of material wavelengths, are the fundamental reason why different materials show different colors. The refractive indices used in this study are from the research of Chang and Charalampopoulos [25]. Based on the refractive indices, the bulk properties of BC aerosol layers (e.g., extinction cross section, single scattering albedo, and asymmetry factor) as a function of wavelength are calculated. A few assumptions are made when we calculate these factors. The shapes of BC particles are shown to be complex non-spherical in the atmosphere [26,27], the effects of which are found to be minor for our numerical results, and we consider simple spherical particles in this study. We consider that all the particles in the aerosol layer are spherical and independent, and the Lorenz-Mie theory [28] is used to calculate their optical properties. A lognormal distribution [29] is considered to describe BC size distributions:
n ( D )   =   N 2 π rln σ g e x p [ ( l n D     l n D g ) 2 2 l n 2 σ g ]
where D g is the geometric mean diameter and σ g is the geometric standard deviation. The geometric mean diameter is set to vary from 0 to 0.3 μm [30]. The geometric standard deviation is set to 1.5 [23].
The two-stream radiative transfer approximation is used to account for the transmission of light in the aerosol layer. The two-stream approximation provides approximated isotropic reflected and transmitted radiation and simplifies the variations related to incident and viewing geometries [31]. The model can provide reasonable results of transmitted energy for a wide range of incident angles and optical thicknesses.
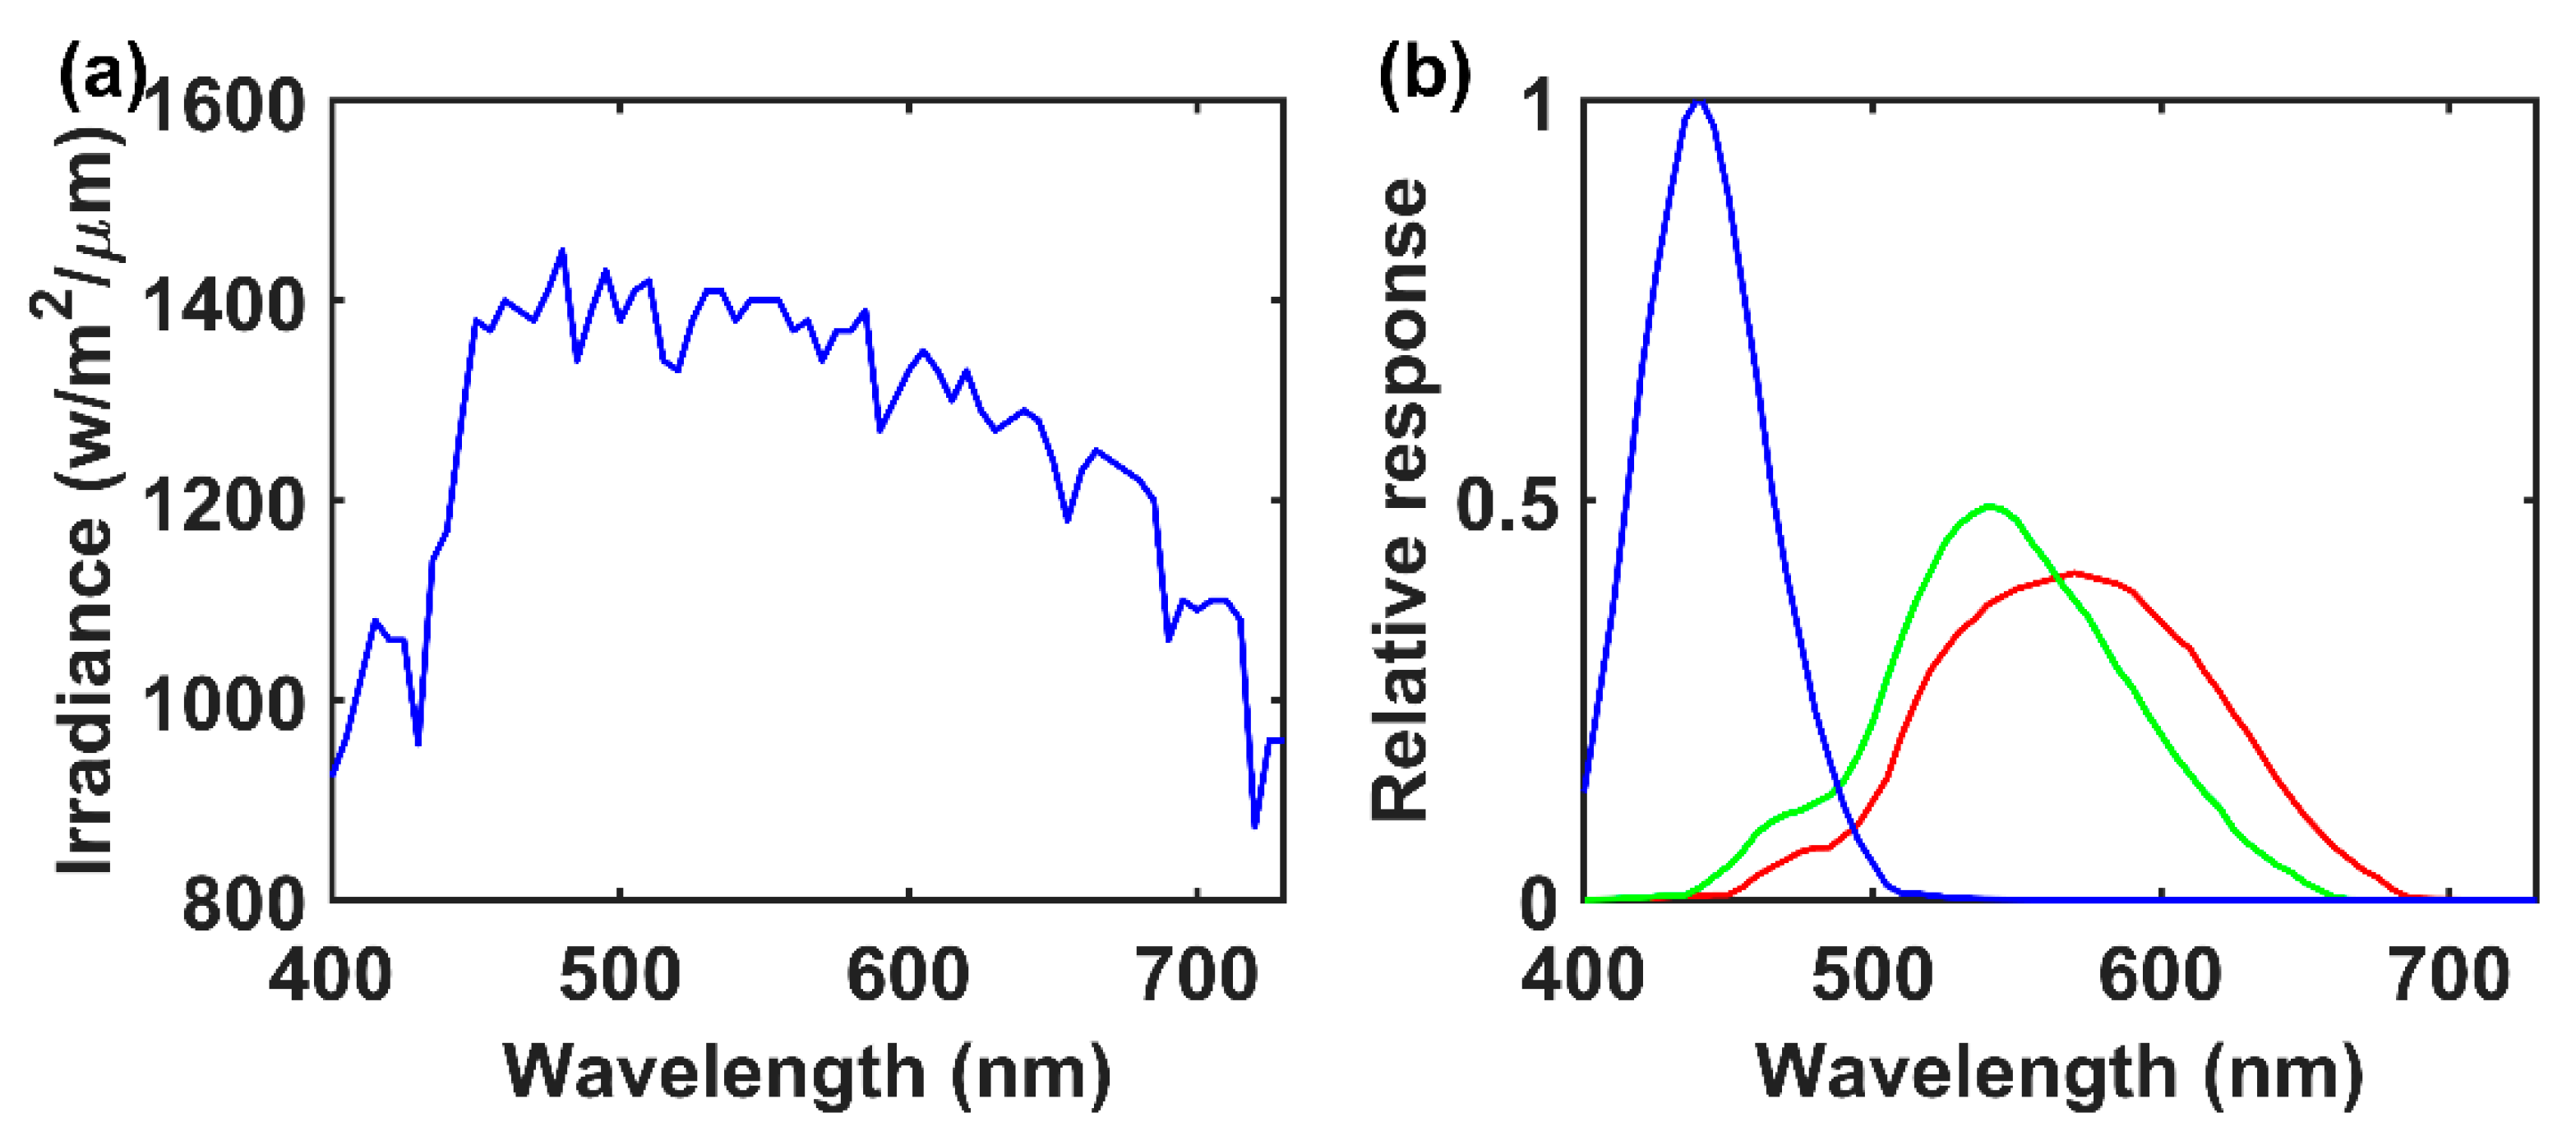
The incident light spectrum in the improved model is set to be the terrestrial direct solar radiation spectrum. The intensity of solar radiation decreases as it passes through the atmosphere because the atmosphere leads to a certain absorption, scattering, and reflection of solar radiation. We select the terrestrial direct solar radiation reaching the upper boundary of the layer. The terrestrial direct solar spectrum data are calculated from the SBDART radiative transfer model [32] based on the US62 atmospheric profile. Figure 2a shows the resulting radiation spectrum considered as the energy reaching the top of the aerosol layer. The incident solar zenith angle is set to be 30°.
The color of aerosols seen by the human eye is determined not only by the transmitted light but also by the visual process produced by the information response of the human eye. The photoreceptors in the eye respond to the transmitted light, and the brain produces color signals with different intensities associated with the light in response. The hypothesis of trichromacy assumes that there are three types of photoreceptors in human eyes based on the fact that there are three independent attributes of color: hue, saturation, and lightness [33]. The three receptors correspond to short wavelength light, intermediate wavelength light, and long wavelength light, respectively, whose signals can be interpreted by the brain as “blue”, “green”, and “red”. The three receptors are named the blue cone, green cone, and red cone. Figure 2b is from the research of Falk et al. [34] and shows the spectral response curves of human eyes. The spectral absorption of light by the three cone types are determined by microspectrophotometry, a physical measurement of the amount of light of each wavelength absorbed by each cone type. Assuming that the signal produced by the brain, which is associated with each type of cone, is directly related to the amount of light absorbed by its pigment, the curves represent color signals of each wavelength, which are interpreted as “blue”, “green”, and “red” [34].
The amount of light absorbed by each type of cone can be approximated by
α i ( F )   =   400 730 F ( λ ) R i ( λ ) d λ ,   i   =   1 , 2 , 3
where F ( λ ) is the amount of light of each wavelength reaching the human eye, R i ( λ ) is the spectral response function of each photoreceptor, and i from 1 to 3 indicates red, green, and blue, respectively. It should be noted that F ( λ ) in our research is the light transmitted through the BC aerosol layer. The number of signals of the three fundamental colors are in proportion to α i ( F ) .
We select the RGB color model to present the simulated colors. In the RGB color model, a color is expressed as an RGB triplet (r, g, b), with each component value ranging from 0 to 1, quantifying the amount of red, green, or blue light in this color. For example, white is represented by (1, 1, 1), and red, green and blue are represented by (1, 0, 0), (0, 1, 0), and (0, 0, 1), respectively. We normalize the three kinds of color signals into values from 0 to 1 and assign them to RGB triplets, i.e., ( T R , T G , T B ), and then the color can be displayed.
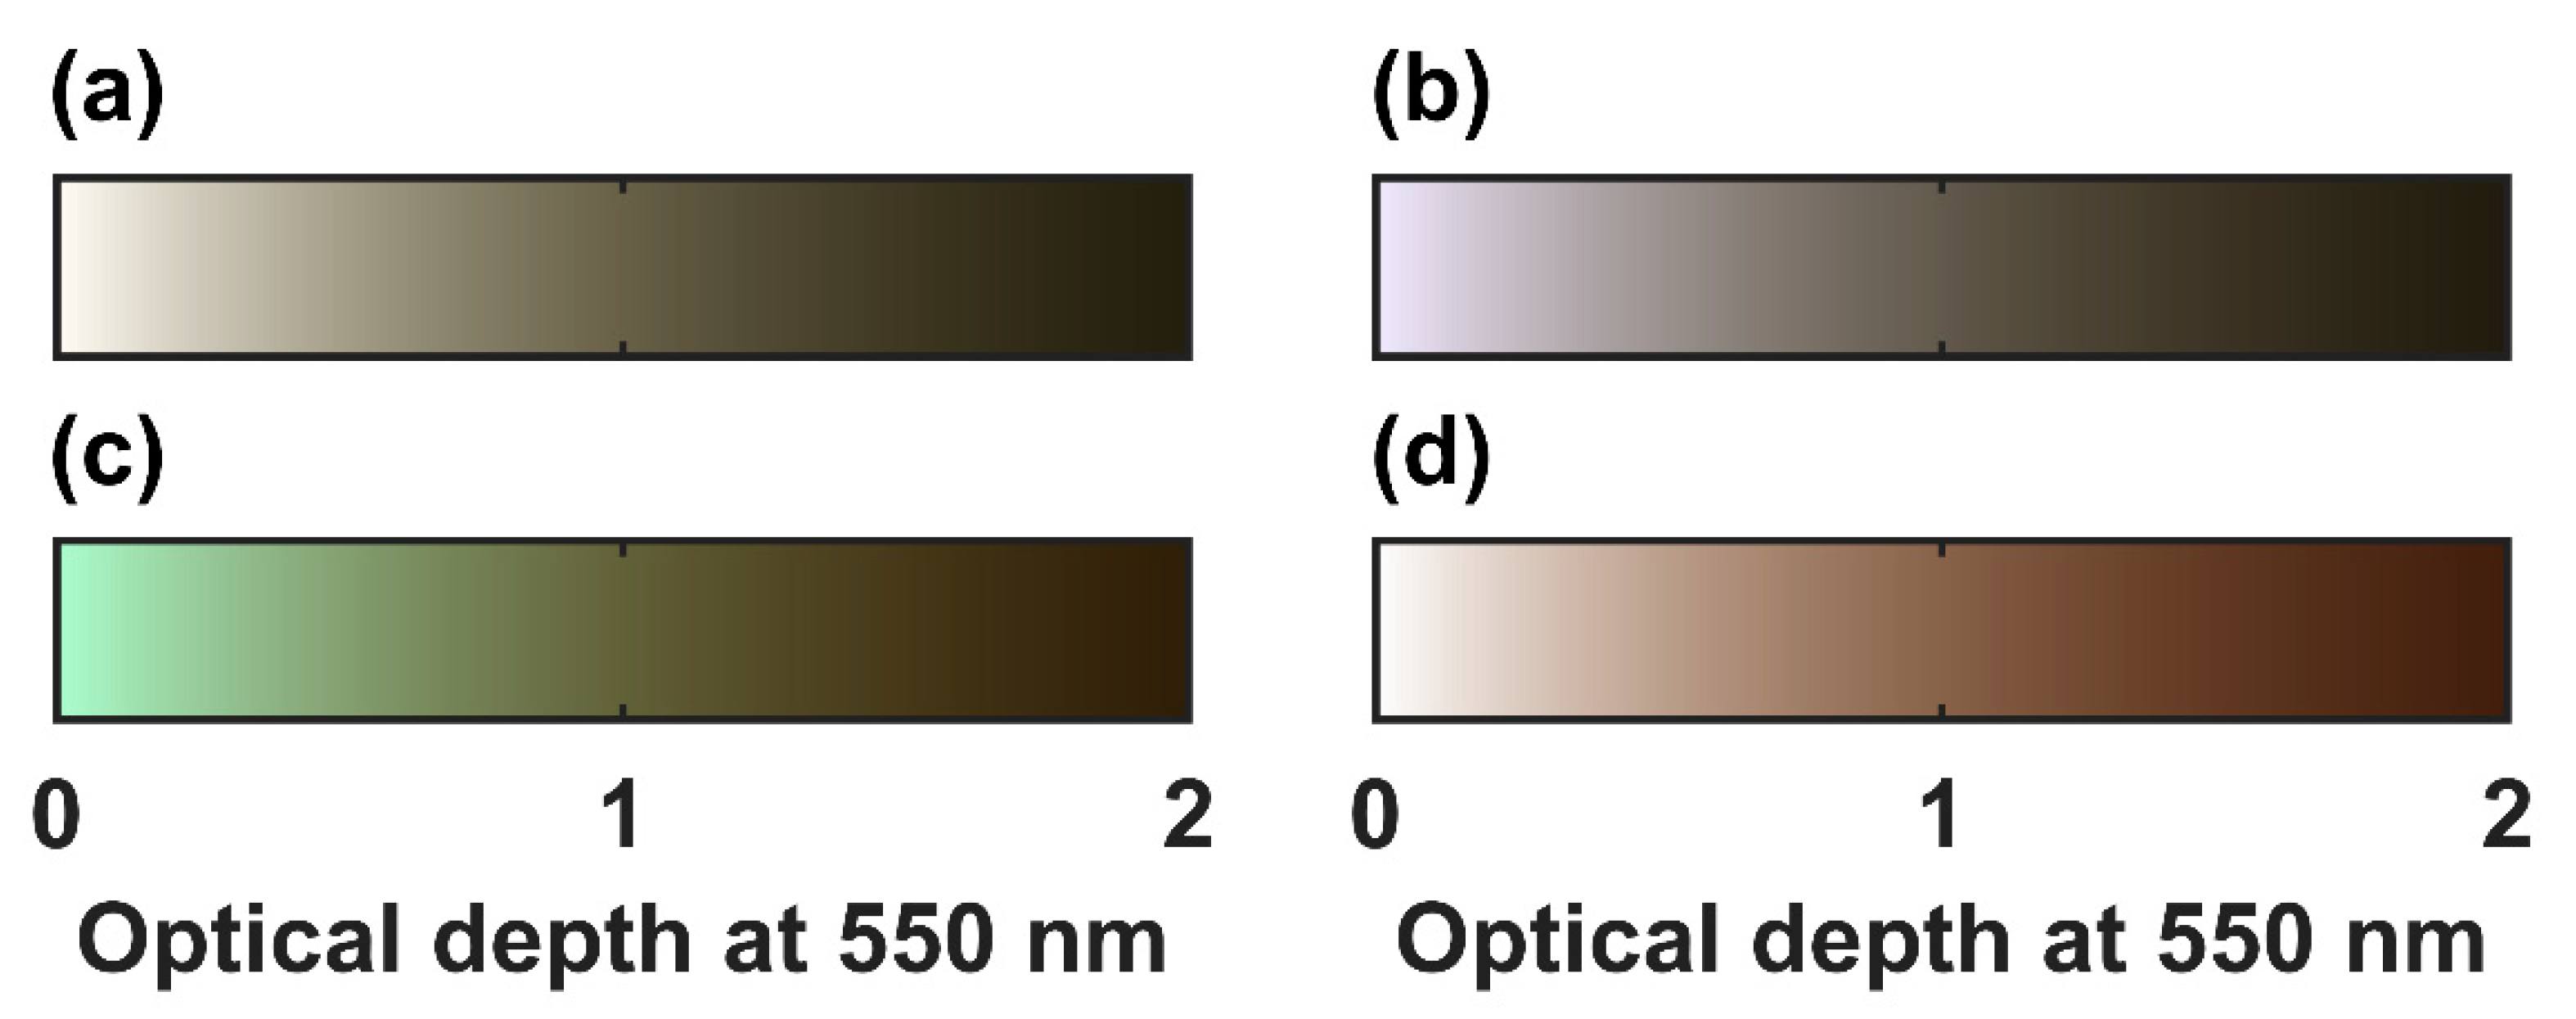
Figure 3 illustrates the colors of the BC aerosol layers with different optical depths simulated under four configurations: (a) Solar spectrum and eye response. (b) Simplified spectrum and eye response. (c) Solar spectrum and simplified response. (d) Simplified spectrum and simplified response. The simplified spectrum is set to have the same irradiance at each wavelength and is used to discuss the influence of the spectrum on the color simulation of BC aerosols. The simplified response is set to only have a response at three wavelengths (i.e., 435 nm, 550 nm and 700 nm), and the eye can change all light information into color information. The particle geometric mean diameter of the size distribution is set to 0.1 μm, which is the most popular size distribution of BC aerosols [29,35,36]. Figure 3 shows the colors of aerosol layers with optical depths ranging from 0 to 2. The optical depth is for the value of the aerosol layer at the wavelength of 550 nm.
Figure 3a shows the results of the color simulation for BC aerosol layers using the improved model. The colors shown in Figure 3b,c are obtained by considering the factors of the solar spectrum and eye response only, respectively. Figure 3d shows the colors of BC aerosol layers using the method designed by Liu et al. [14]. To distinguish the influences of the two variables (i.e., solar spectrum and eye response) on the color simulation results, we fit the RGB parameters of the color simulation results in the above four cases, and the correlation between them is described by linear fitting. The regression equation is as follows:
Y   =   X β   +   ε
where β and ε are the slope and intercept of the regression equation, respectively. X and Y represent the arguments and the dependent variables, respectively [37]. The results of the fittings are shown in Table 1.
β represents the slope of the regression equation fitted by two cases, which can be used to reflect the similar degree of the two cases. We find that the β of the regression equations of (a) and (c) has a larger deviation of 1 than the other two fittings, which shows that the RGB parameters of the color simulations have larger deviations when the human eye response changes; in other words, the human eye response has a larger influence than the spectral energy distribution on the simulation of the color of the observed BC aerosol layer. Meanwhile, we find that the colors in Figure 3c have the largest difference from the colors in Figure 3a. Smaller values of the β of R and B in the regression equation of (a) and (c) mean that there are lower amounts of red and blue light in the mixing colors of (c); meanwhile, relatively more green light, as seen in Figure 3c, seems greener.
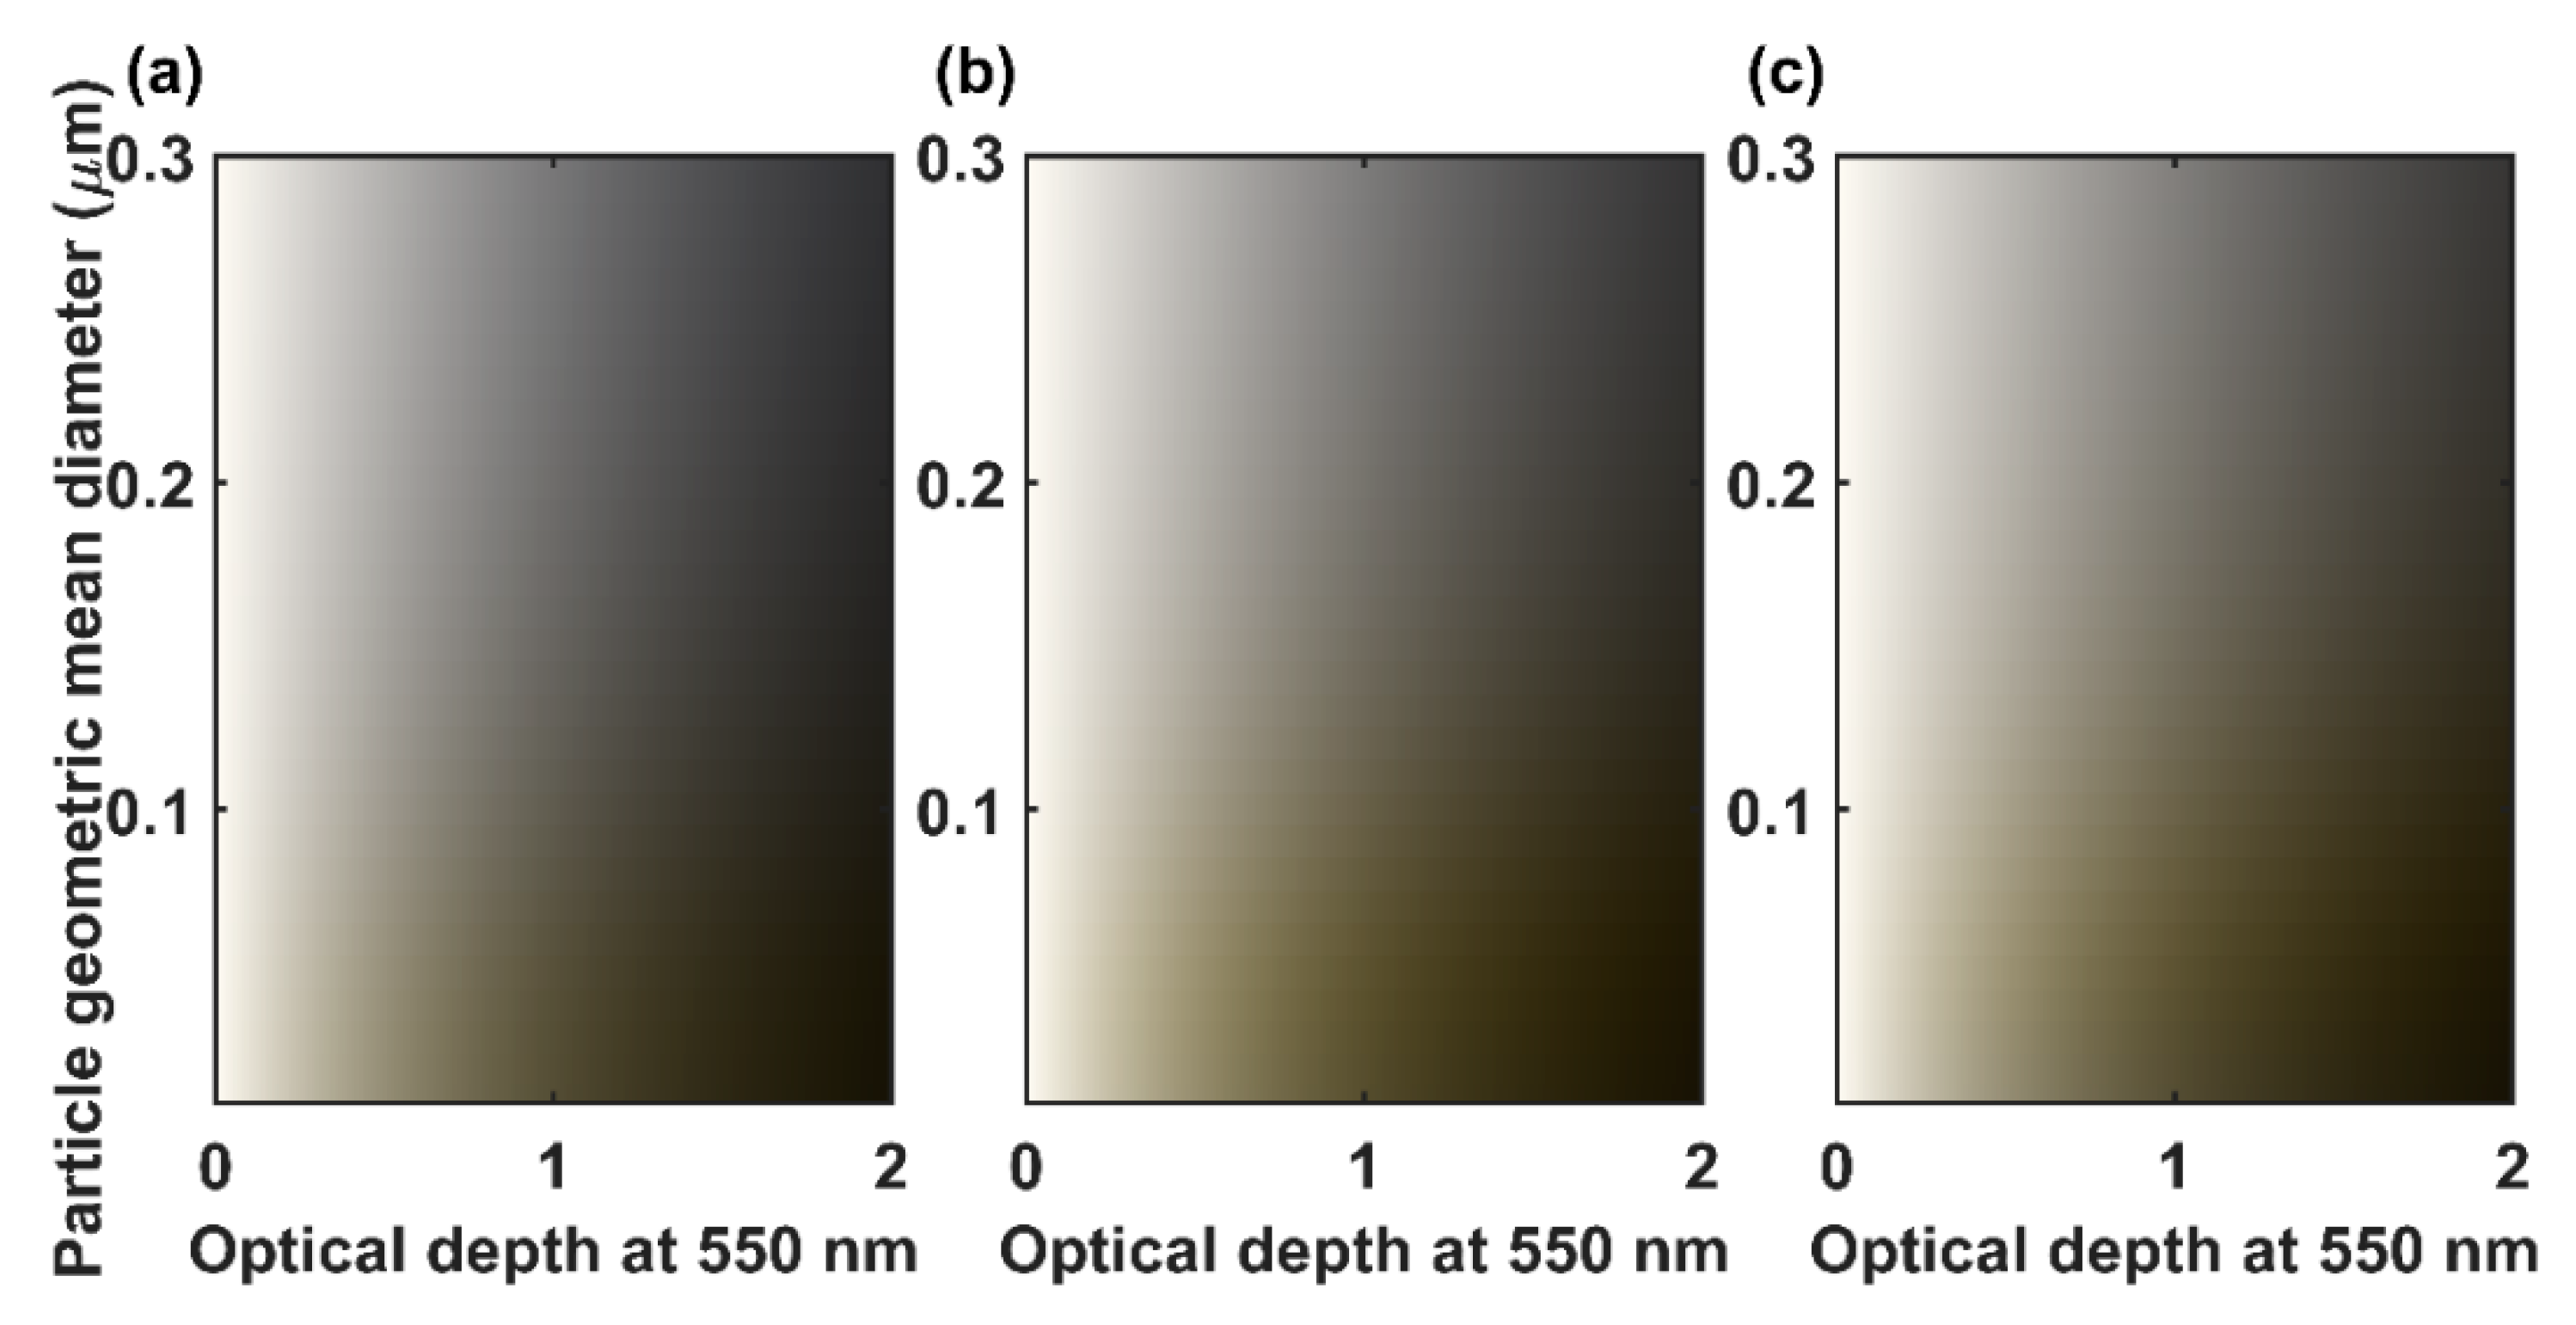
Figure 4 illustrates the colors of the three types of BC with different refractive indices at different optical depths and geometric mean diameters. The refractive indices used in the color simulations of Figure 4a–c are from the studies of Schnaiter et al. [38], Chang and Charalampopoulos [25], and D’Almeida et al. [39]. There is some uncertainty in the complex refractive index of BC aerosols, which will affect their optical properties to a certain extent [40]. Some observational studies of the colors of BC aerosols exist, and they show that black carbon always appears black, gray, or dark brown [13]. After comparing the color simulation results of BC aerosols shown in Figure 4 with those of the previous observations, it is found that although there is a slight gap between the color simulation results of the three groups of BC aerosols with different complex refractive indices, they are basically close to the previous observation and research results, which verifies the rationality of our color simulation method. Figure 4 also shows that the color of the BC aerosol layer is significantly influenced by the optical depth, i.e., the aerosol amount. When the optical depth is shallow, the BC layer shows a white colour. As the optical depth increases, the color of the BC layer becomes darker. The color can be described as black until the optical depth is close to 2. The changes due to the particle size are not as obvious as changes because of the optical depth.

3. Is the AAE an Indicator of Aerosol Color?

The absorption Ångström exponent (AAE) indicates aerosol absorption ability at different wavelengths, and it is defined as:
C a b s ( λ )   =   b a b s λ A A E
where C a b s ( λ ) is the absorption cross section at the wavelength of λ , and b a b s is a constant independent of wavelength [41]. The AAE characterizes the rate at which the absorption cross section varies with the wavelength. Large AAE values indicate that the absorption cross section decreases rapidly with increasing wavelength. The AAEs can approximate the slopes of the fitted spectra of the absorption cross section responding to wavelengths in the log-log distribution [39].
The three types of BCs shown in Figure 4 have AAE values of 0.49, 1.01, and 1.08. The AAE values of BCs shown in Figure 4b,c are very close, and they have more similar colors compared with Figure 4a, indicating that the AAE values and colors of aerosol layers are in correspondence.
The AAE values are determined by the particle size distribution, geometry, and complex refractive indices of aerosols. To reveal the relationship between the AAE and color, we change the complex refractive indices to obtain different AAE values, and 7 groups of refractive indices with different imaginary parts and the same real parts of complex refractive indices are assumed for carbonaceous aerosols. The same particle shape and size distribution are considered, i.e., spheres with a lognormal distribution of geometric mean diameter of 0.1 μm. Because the scale distribution of aerosols in the 7 groups of simulations in our study is the same, the effect of the extinction Ångström exponent (EAE) on aerosol color is not considered. The EAE is typically used to characterize particle size [7,21,42,43]. In the color simulation of the aerosol layer, the absorption of different wavelengths of light by the aerosol layer is taken as the main influencing factor. We focus on the relationship between the AAE and color and do not discuss the impact of each influencing factor on the AAE value in detail.
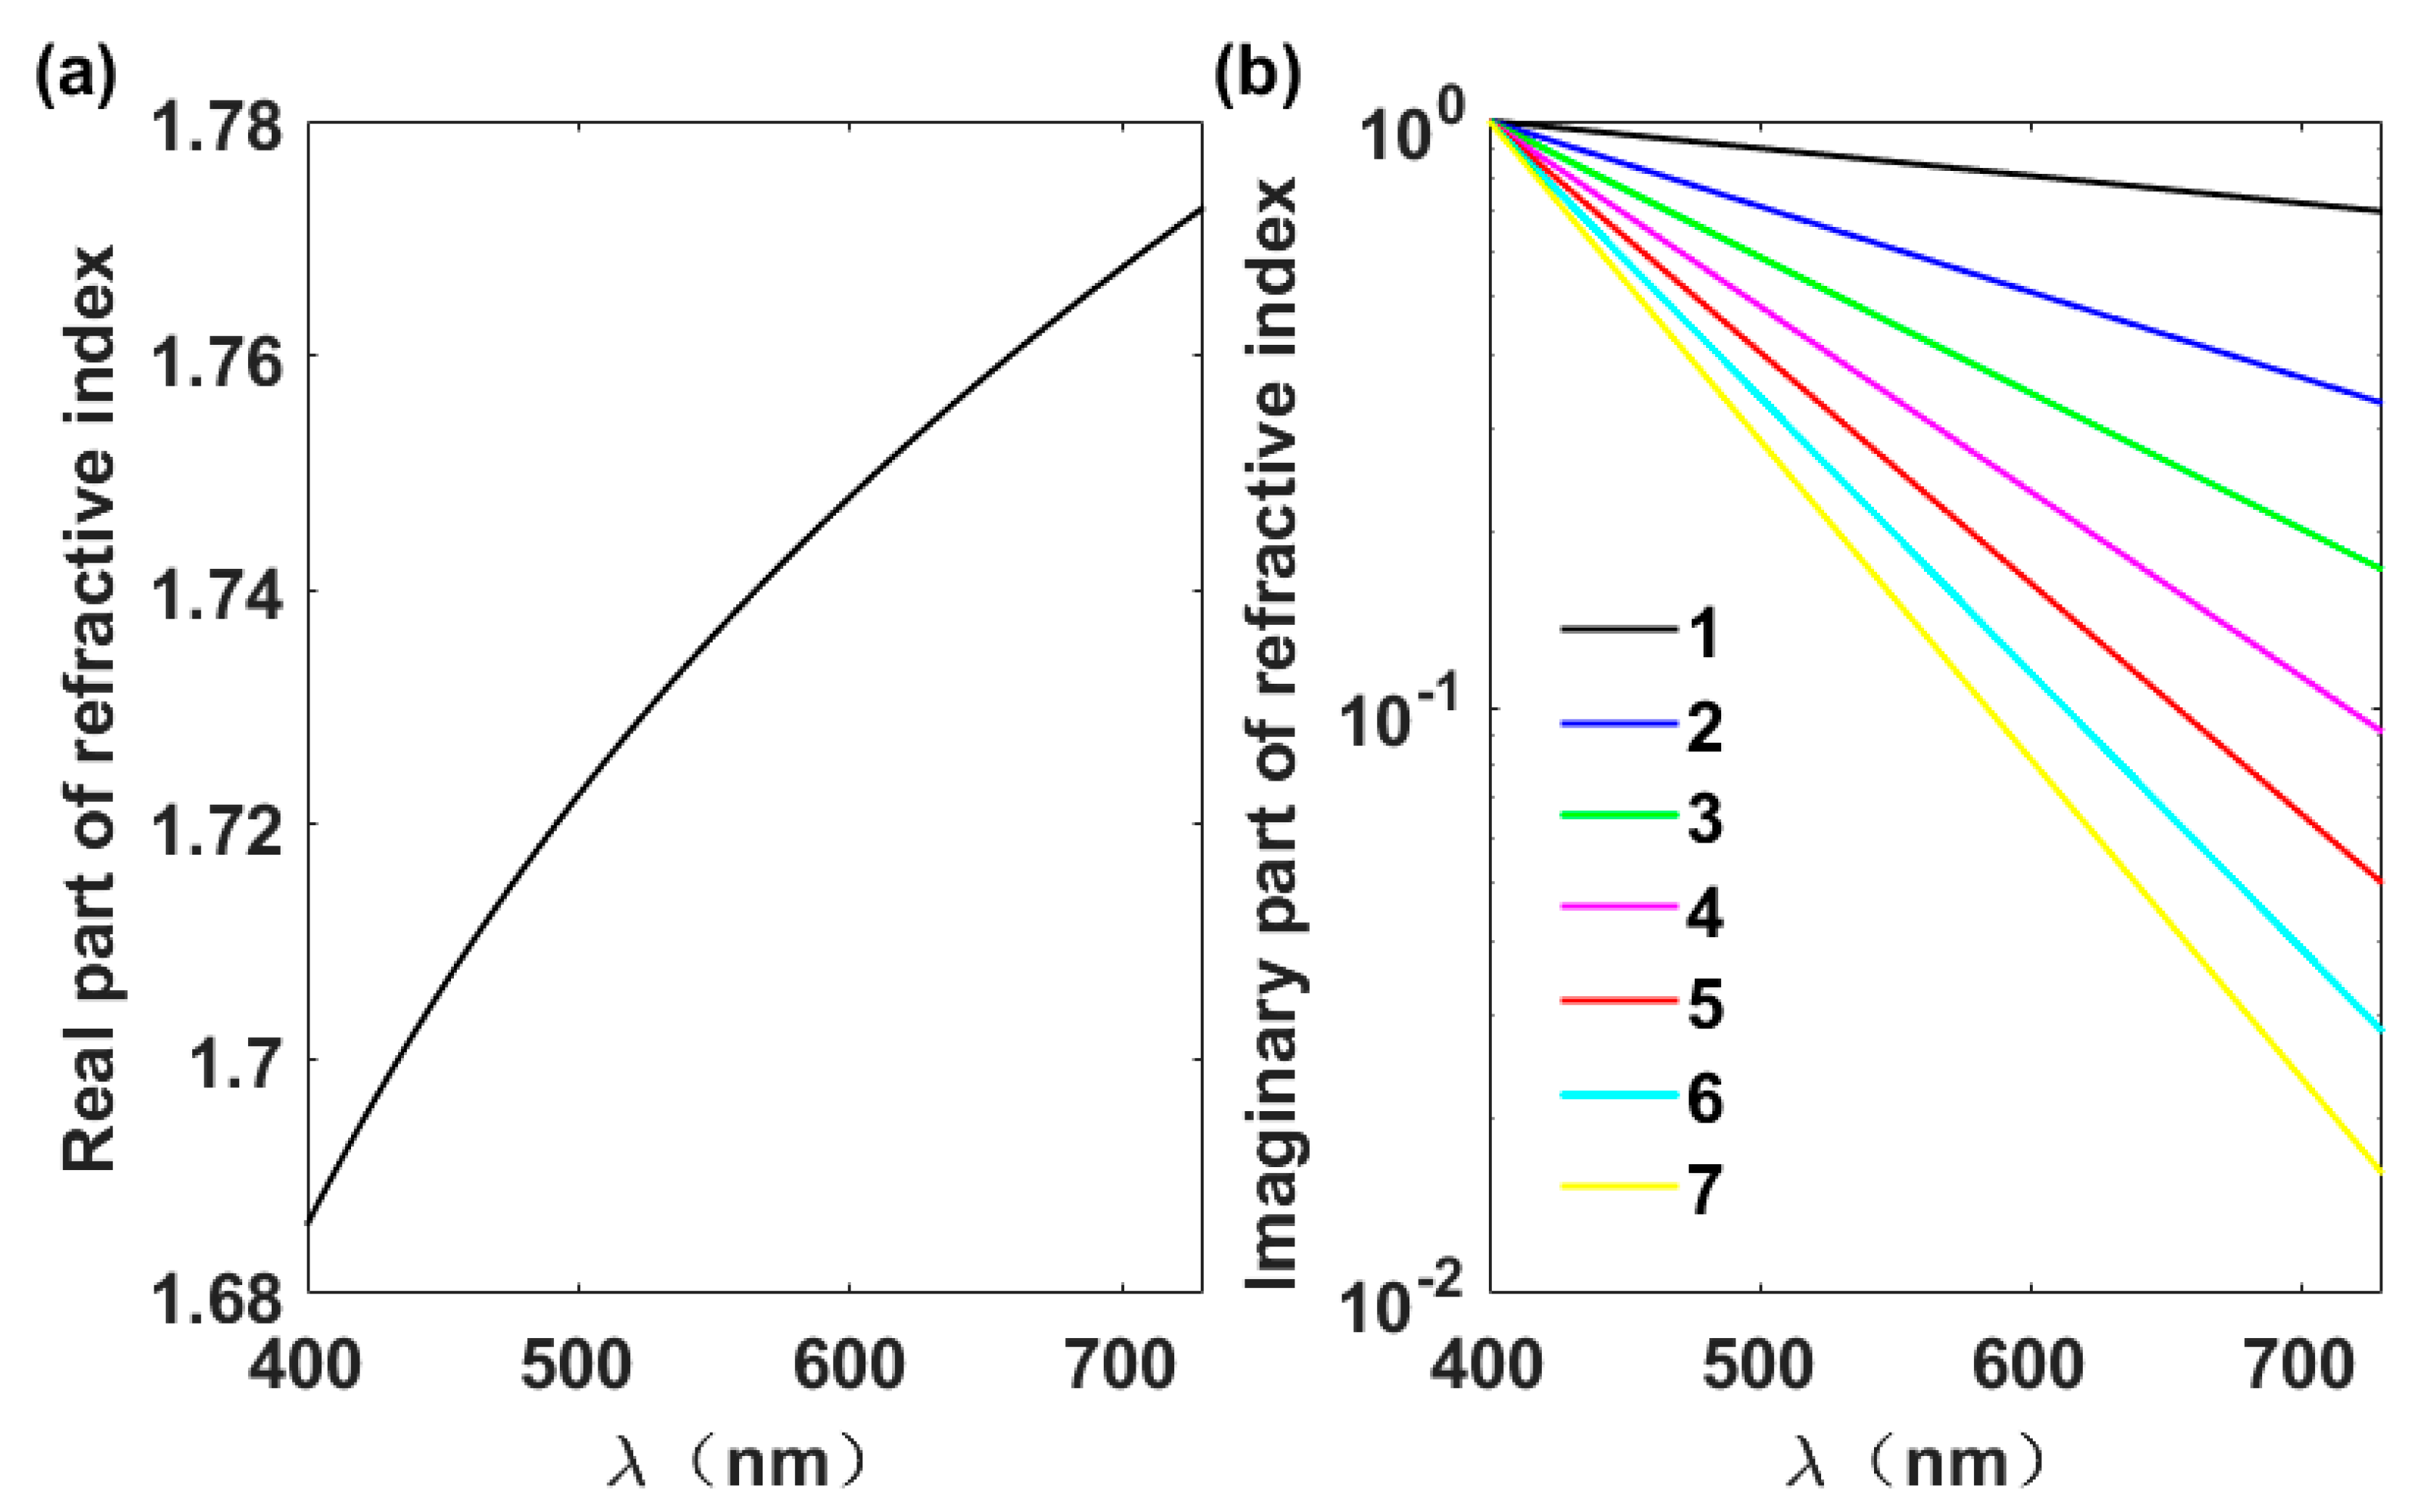
Figure 5 shows the seven assumed refractive indices. The real part of refractive indices is from the research of Chang and Charalampopoulos [25]. The imaginary part is set to be a linear change in logarithmic coordinates. Following the corresponding complex refractive indices, the AAE values of the corresponding aerosol particles increase from 1 to 7.
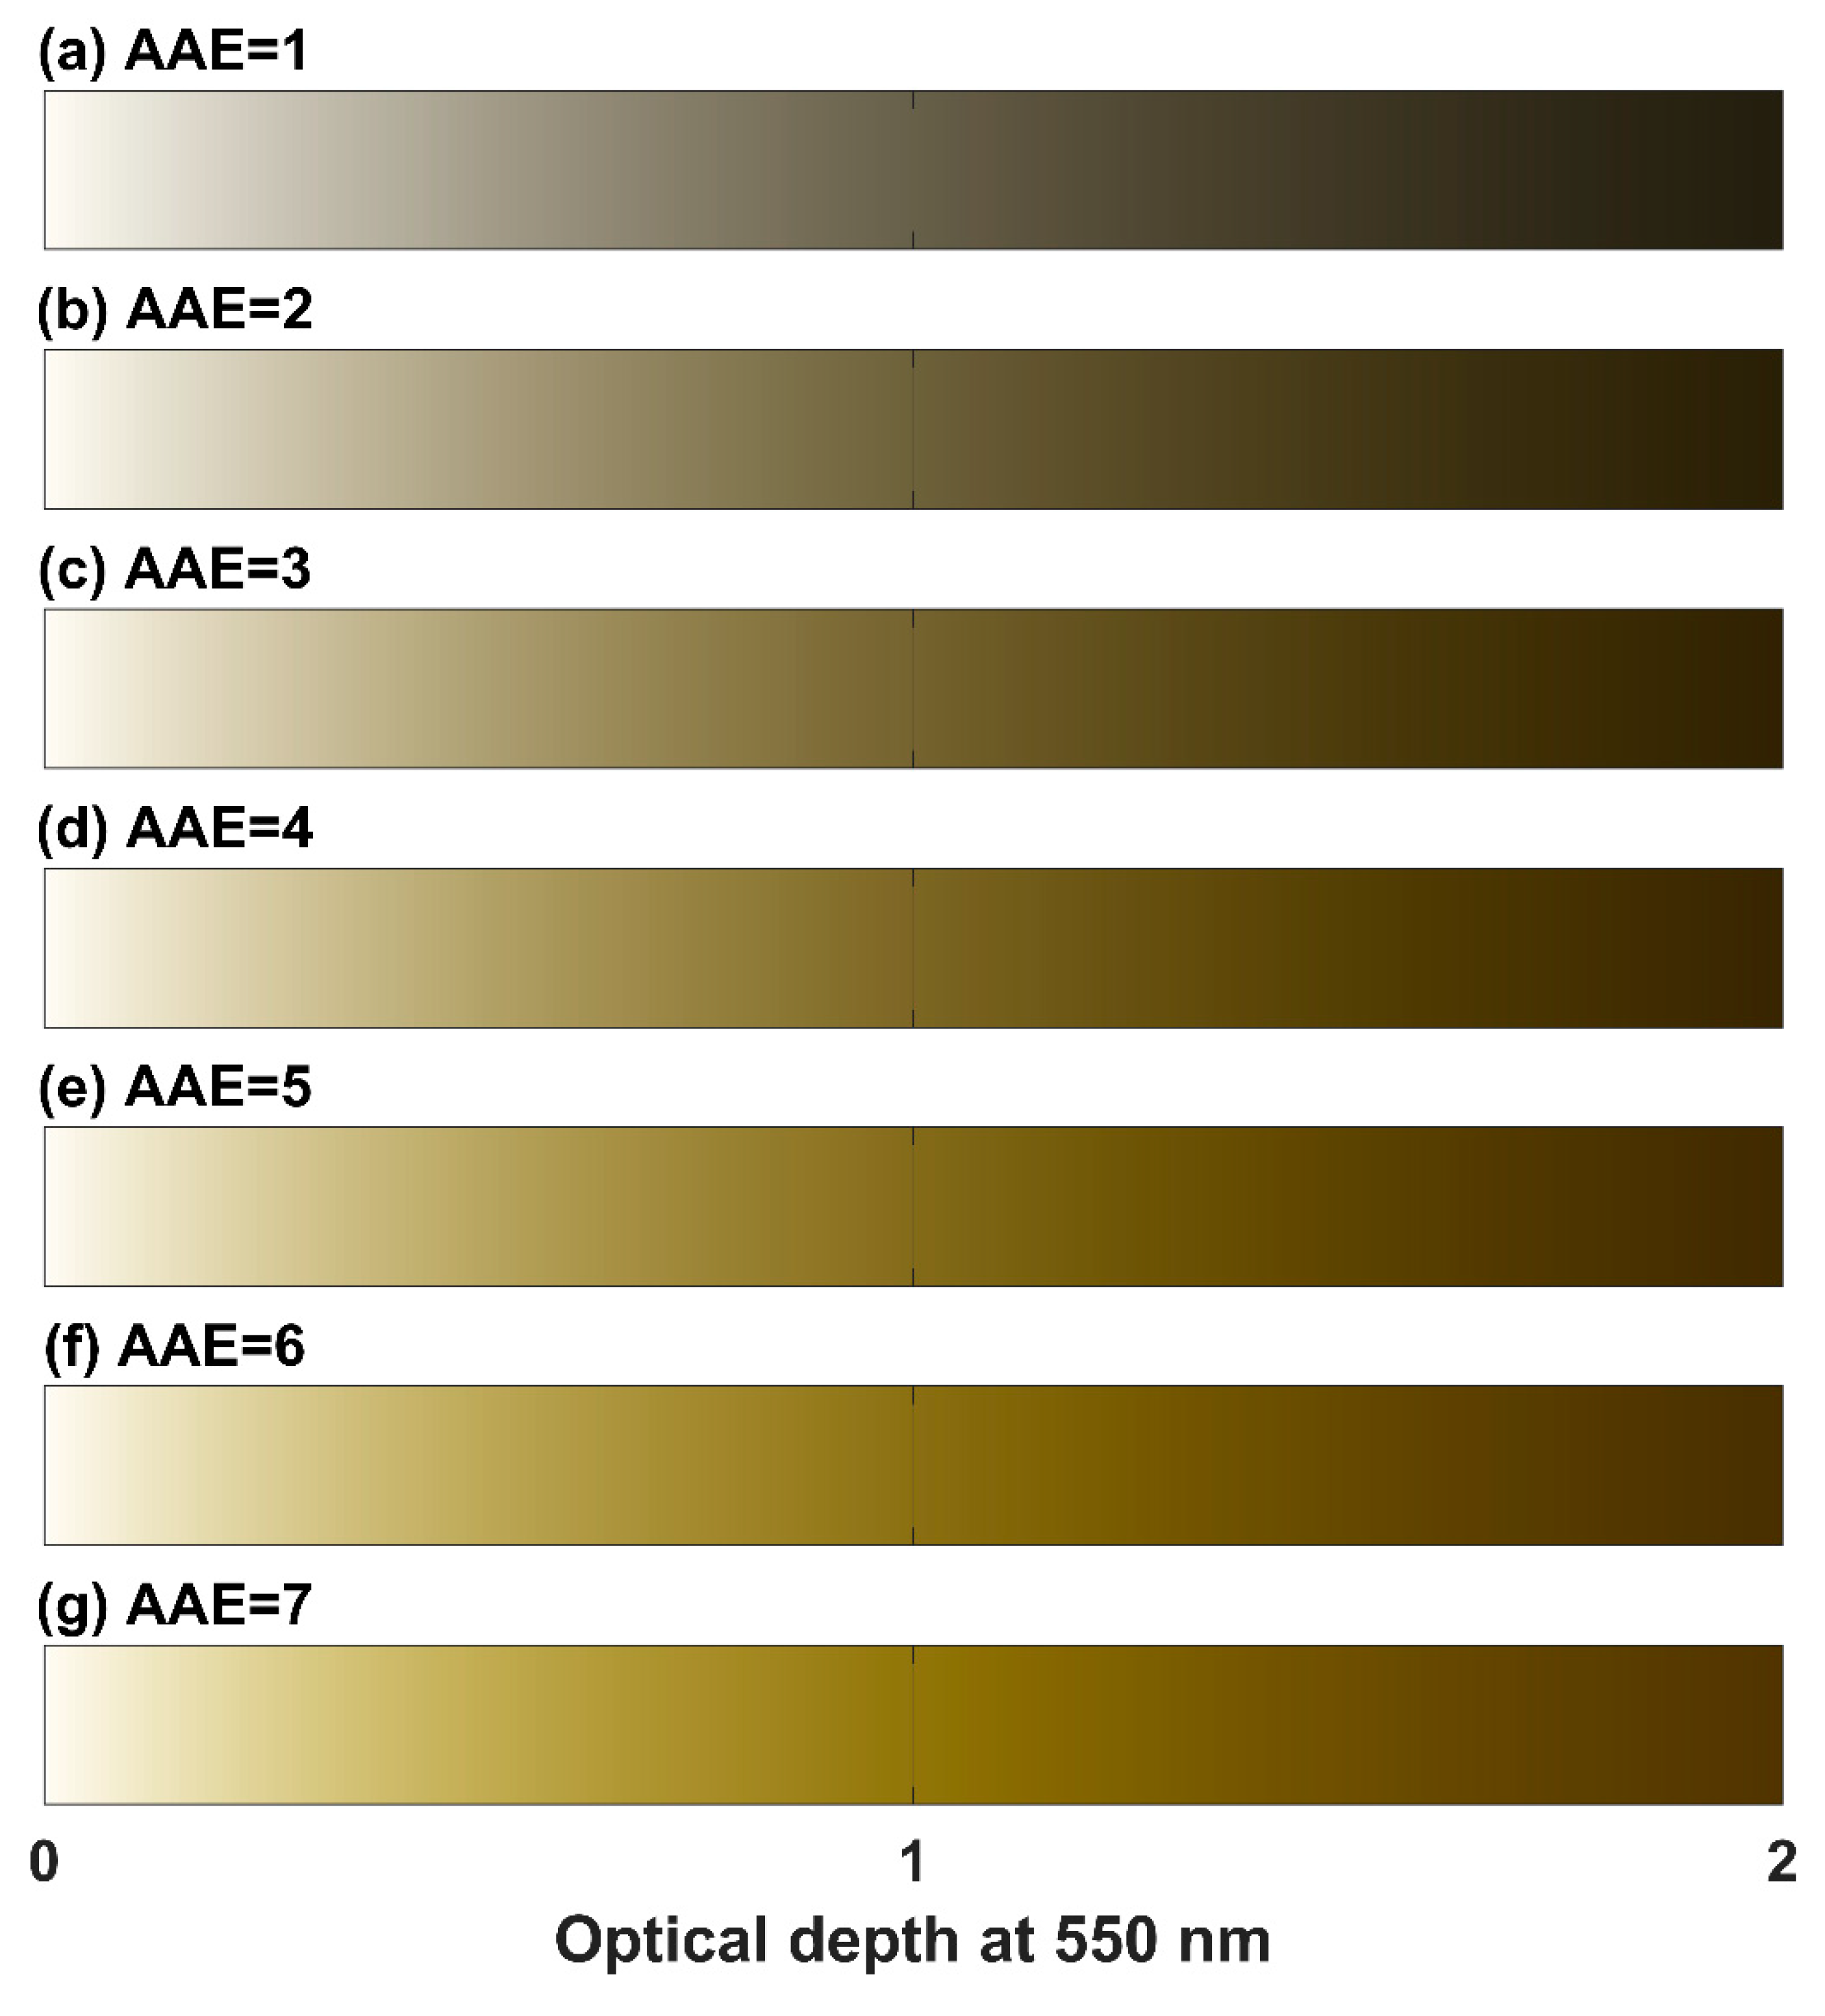
The simulated colors are shown in Figure 6. The AAE value of 1 is the theoretical value of aerosol layers dominated by BC [44,45,46,47,48], and the colors are gray or black (as shown in Figure 6a). Aerosols containing mineral dust [39], environmental tobacco smoke [49], particles produced by oxygen-deficient combustion of propane [47], aerosols collected near a lignite combustion plant [45], biomass burning [50,51] and rural aerosols [52] may show AAE values between 2 and 4. The color of the aerosol layer with AAE values from 2 to 4 is brown (as shown in Figure 6b–d). Figure 6e–g show the colors of aerosol layers with AAE values from 5 to 7. Examples of those particles include water-soluble materials, methanol-soluble ambient samples and humic organic carbon [5,53,54]. Their colors are yellowish. As shown in Figure 6, the colors of aerosol layers change from gray to brown and then yellow as the AAE values increase. As the wavelength increases, the absorption cross section decreases at a faster rate as the AAE increases, and more light with longer wavelengths passes through the aerosol layer. Compared with Figure 6a, when light passes through the aerosol layer shown in Figure 6g, more shortwave light is absorbed, and a relatively large amount of long wavelength light passes through the aerosol layer. The color of the aerosol layer is determined by the light passing through the aerosol layer, which causes the color of the aerosol layer in Figure 6g to have a warmer hue. Meanwhile, Figure 6 makes a clear illustration on the relationship between aerosol AAE and its colors in the atmosphere.
We define the characteristic colors of aerosol layers as gray, brown, or yellow. The data given in Table 2 show the range of the optical depths of the aerosol layer when the aerosol layer displays the characteristic color, the transmittance of the light at 550 nm wavelength at the optical depths, and the difference between the transmittance of light at 400 nm and 730 nm at the optical depths. τ 1 and τ 2 are the minimum and maximum values of the optical depth range of the aerosol layer showing the characteristic color, respectively. The optical depth is also defined by 550 nm monochromatic light. When the AAE is 1 and the optical depth of the aerosol layer is between 0.2 and 0.9, the aerosol layer shows the characteristic color of gray instead of black. T 550 , 1 and T 550 , 2 represent the transmittances of light at 550 nm through the aerosol layers whose optical depths are τ 1 and τ 2 , respectively. The aerosol layer exhibits a characteristic color when the transmittance of light at a wavelength of 550 nm is in the range of 0.3 to 0.9. Δ T 1 and Δ T 2 represent the deviations of the transmittance of the light at 400 nm and 730 nm whose optical depths are τ 1 and τ 2 , respectively. We find that if the deviation of the transmittance of the light at 400 nm and 730 nm is larger than 0.2 and the AAE of the aerosol is larger than 2, the aerosol layer shows as brown or yellow instead of grey or black.

4. Conclusions and Discussion

Our research aims to better address the interesting question of “the color of aerosols in the ambient atmosphere”. The color of aerosols in the ambient atmosphere is assessed using a simplified numerical model. In this paper, we improved methods to simulate the aerosol color in the ambient atmosphere. We use the solar spectrum instead of RGB three-wavelength mixed light, and we use the spectral relative response of the human optical receiver instead of the simulation condition that humans have the same response to different wavelengths of light. The color of black carbon aerosols in the ambient atmosphere changes with the optical depth, and the geometric mean diameter is simulated by using this method. The contrast of the color simulation results of the aerosol layer under different assumptions shows that our improvement is reasonable, and the improved simulation results are closer to the color of the aerosol in the ambient atmosphere. By comparing the simulation results of the aerosol color under the condition of a changing solar spectrum and human eye response function, we find that the response of the human eye is a more important condition for the aerosol color than the spectra in our simulation study.
The AAE is an indicator of the aerosol color. When the AAE is large, the color tone of the aerosol is warm; when the AAE is small, the color tone of the aerosol is cool. By changing the complex refractive indices of the material, we obtain the color of the aerosol layer with an AAE value from 1 to 7. Through reasonable discussion, we obtain the correlation between the AAE value and the color. If the deviations of the transmittance of the light at 400 nm and 730 nm are larger than 0.2 and the AAE of the aerosol is larger than 2, the aerosol layer is brown or yellow instead of gray or black. Last but not least, the numerical method to illustrate aerosol color in the atmosphere discussed in this paper can be extended to better understand aerosol species, visibility, atmospheric light pollution, and even rough retrieval of aerosol properties.

Author Contributions

Conceptualization, D.Z.; Methodology, D.Z., Y.Y. and C.L. (Chao Liu); Visualization, D.Z., Y.Y., C.L. (Chao Liu) and X.X.; Investigation, D.Z., C.L. (Chao Liu), C.L. (Chao Liu) and X.X.; Writing—Original Draft Preparation, D.Z., Y.Y. and C.L. (Chao Liu); and Writing-Review and Editing, D.Z., Y.Y., C.L. (Chunsong Lu) and C.L. (Chao Liu). All authors have read and agreed to the published version of the manuscript.

Funding

This research was funded by the National Natural Science Foundation of China under grant no. 41590873.

Acknowledgments

The first author are grateful for the help of the other authors and the resources provided by the Nanjing University of Information Science & Technology. The first author would like to thank Yanan Wu for her support.

Conflicts of Interest

The authors declare no conflict of interest.

References

  1. Kaufman, Y.J.; Tanré, D.; Boucher, O. A satellite view of aerosols in the climate system. Nature 2002, 419, 215–223. [Google Scholar] [CrossRef] [PubMed]
  2. Twomey, S.A.; Piepgrass, M.; Wolfe, T.L. An assessment of the impact of pollution on global cloud albedo. Tellus B Chem. Phys. Meteorol. 2017, 36, 356–366. [Google Scholar] [CrossRef]
  3. Kirchstetter, T.W.; Novakov, T.; Hobbs, P.V. Evidence that the spectral dependence of light absorption by aerosols is affected by organic carbon. J. Geophys. Res. Atmos. 2004, 109, D21208. [Google Scholar] [CrossRef] [Green Version]
  4. Andreae, M.; Gelencsér, A. Black carbon or brown cabon? The nature of light-absorbing carbonaceous aerosols. Atmos. Chem. Phys. Discuss. 2006, 6, 3131–3148. [Google Scholar] [CrossRef] [Green Version]
  5. Sun, H.; Biedermann, L.; Bond, T.C. Color of brown carbon: A model for ultraviolet and visible light absorption by organic carbon aerosol. Geophys. Res. Lett. 2007, 34, 17. [Google Scholar] [CrossRef]
  6. Myhre, G. Consistency Between Satellite-Derived and Modeled Estimates of the Direct Aerosol Effect. Science 2009, 325, 187–190. [Google Scholar] [CrossRef]
  7. Russell, P.B.; Bergstrom, R.W.; Shinozuka, Y.; Clarke, A.D.; DeCarlo, P.F. Absorption Angstrom Exponent in AERONET and related data as an indicator of aerosol composition. Atmos. Chem. Phys. 2010, 10, 1155–1169. [Google Scholar] [CrossRef] [Green Version]
  8. Zhong, M.; Jang, M. Dynamic light absorption of biomass-burning organic carbon photochemically aged under natural sunlight. Atmos. Chem. Phys. 2014, 14, 1517–1525. [Google Scholar] [CrossRef] [Green Version]
  9. Liu, B.; Ma, Y.; Gong, W.; Zhang, M. Observations of aerosol color ratio and depolarization ratio over Wuhan. Atmos. Pollut. Res. 2017, 8, 1113–1122. [Google Scholar] [CrossRef]
  10. Oberlin, A. High-resolution TEM studies of carbonization and graphitization. Chem. Phys. Carbon. 1989, 22, 1. [Google Scholar]
  11. Dal Farra, A.; Kaspari, S.; Beach, J.; Bucheli, T.D.; Schaepman, M. Spectral signatures of submicron scale light-absorbing impurities in snow and ice using hyperspectral microscopy. J. Glaciol. 2018, 64, 377–386. [Google Scholar] [CrossRef] [Green Version]
  12. Schnaiter, M.; Linke, C.; Ibrahim, I.; Kiselev, A.; Waitz, F. Specifying the light-absorbing properties of aerosol particles in fresh snow samples, collected at the Environmental Research Station Schneefernerhaus (UFS), Zugspitze. Atmos. Chem. Phys. 2019, 19, 10829–10844. [Google Scholar] [CrossRef] [Green Version]
  13. Huang, J.; Fu, Q.; Zhang, W.; Wang, X.; Zhang, R. Dust and Black Carbon in Seasonal Snow Across Northern China. Bull. Am. Meteorol. Soc. 2011, 92, 175–181. [Google Scholar] [CrossRef] [Green Version]
  14. Liu, C.; Chung, C.E.; Zhang, F.; Yin, Y. The colors of biomass burning aerosols in the atmosphere. Sci. Rep. 2016, 6, 28267. [Google Scholar] [CrossRef] [PubMed]
  15. Jacobson, M.Z. Strong radiative heating due to the mixing state of black carbon in atmospheric aerosols. Nature 2001, 409, 695–697. [Google Scholar] [CrossRef] [PubMed]
  16. Bond, T.C.; Sun, H. Can Reducing Black Carbon Emissions Counteract Global Warming? Environ. Sci. Technol. 2005, 39, 5921–5926. [Google Scholar] [CrossRef] [Green Version]
  17. Ramanathan, V.; Carmichael, G.R. Global and regional climate changes due to black carbon. Nat. Geosci. 2008, 1, 221–227. [Google Scholar] [CrossRef]
  18. Scarnato, B.; Vahidinia, S.; Richard, D.; Kirchstetter, T. Effects of internal mixing and aggregate morphology on optical properties of black carbon using a discrete dipole approximation model. Atmos. Chem. Phys. 2013, 13, 5089–5101. [Google Scholar] [CrossRef] [Green Version]
  19. Dubovik, O.; Holben, B.; Eck, T.F.; Smirnov, A.; Kaufman, Y.J. Variability of absorption and optical properties of key aerosol types observed in worldwide locations. J. Atmos. Sci. 2002, 59, 590–608. [Google Scholar] [CrossRef]
  20. Soni, K.; Singh, S.; Bano, T.; Tanwar, R.S.; Nath, S. Wavelength Dependence of the Aerosol Angstrom Exponent and Its Implications Over Delhi, India. Aerosol Sci. Technol. 2011, 45, 1488–1498. [Google Scholar] [CrossRef]
  21. Toledano, C.; Cachorro, V.E.; Berjon, A.; Frutos, A.M.D.; Sorribas, M. Aerosol optical depth and Ångström exponent climatology at El Arenosillo AERONET site (Huelva, Spain). Q. J. R. Meteorol. Soc. 2010, 133, 795–807. [Google Scholar] [CrossRef]
  22. Reid, J.G.; Eck, T.F.; Christopher, S.A.; Hobbs, P.V.; Holben, B.N. Use of the Ångstrom exponent to estimate the variability of optical and physical properties of aging smoke particles in Brazil. J. Geophys. Res. 1999, 104, 27473–27489. [Google Scholar] [CrossRef]
  23. Chung, C.E.; Lee, K.; Muller, D. Effect of internal mixture on black carbon radiative forcing. Tellus B 2012, 64, 10925. [Google Scholar] [CrossRef] [Green Version]
  24. Liu, C.; Chung, C.E.; Yin, Y.; Schnaiter, M. The absorption Ångström exponent of black carbon: From numerical aspects. Atmos. Chem. Phys. 2018, 18, 6259–6273. [Google Scholar] [CrossRef] [Green Version]
  25. Chang, H.; Charalampopoulos, T.T. Determination of the Wavelength Dependence of Refractive Indices of Flame Soot. Proc. R. Soc. A Math. Phys. Eng. Sci. 1990, 430, 577–591. [Google Scholar]
  26. He, C.; Liou, K.-N.; Takano, Y.; Zhang, R.; Levy Zamora, M. Variation of the radiative properties during black carbon aging: Theoretical and experimental intercomparison. Atmos. Chem. Phys. 2015, 15, 11967–11980. [Google Scholar] [CrossRef] [Green Version]
  27. China, S.; Scarnato, B.; Owen, R.C.; Zhang, B.; Ampadu, M.T. Morphology and mixing state of aged soot particles at a remote marine free troposphere site: Implications for optical properties. Geophys. Res. Lett. 2015, 42, 1243–1250. [Google Scholar] [CrossRef]
  28. Mie, G. Beiträge zur Optik trüber Medien, speziell kolloidaler Metallösungen. Ann. Phys. 1908, 330, 377–445. [Google Scholar] [CrossRef]
  29. Johnson, N.L.; Kotz, S.; Balakrishnan, N. Continuous Univariate Distributions; Houghton Mifflin: Boston, MA, USA, 1970. [Google Scholar]
  30. Reddington, C.L.; McMeeking, G.; Mann, G.W.; Coe, H.; Frontoso, M.G. The mass and number size distributions of black carbon aerosol over Europe. Atmos. Chem. Phys. 2013, 13, 4917–4939. [Google Scholar] [CrossRef] [Green Version]
  31. Meador, W.; Weaver, W. Two-stream approximations to radiative transfer in planetary atmospheres: A unified description of existing methods and a new improvement. J. Atmos. Sci. 1980, 37, 630–643. [Google Scholar] [CrossRef] [Green Version]
  32. Ricchiazzi, P.; Yang, S.; Gautier, C.; Sowle, D. SBDART: A research and teaching software tool for plane-parallel radiative transfer in the Earth’s atmosphere. Bull. Am. Meteorol. Soc. 1998, 79, 2101–2114. [Google Scholar] [CrossRef] [Green Version]
  33. Young, T. The Bakerian lecture. On the mechanism of the eye. Philos. Trans. R. Soc. London 1801, 91, 23–88. [Google Scholar]
  34. Falk, D.R.; Brill, D.R.; Stork, D.G. Seeing the light: Optics in nature, photography, color, vision, and holography. In Seeing the Light: Optics in Nature, Photography, Color, Vision, and Holography; Falk, D.R., Brill, D.R., Stork, D.G., Eds.; Wiley-VCH: Weinheim, Germany, 1985; p. 480. ISBN 0-471-60385-6. [Google Scholar]
  35. Qin, S.; Tang, J.; Wen, Y. Black carbon and its importance in climate change studies. Meteorol. Mon. 2001, 27, 3–7. (In Chinese) [Google Scholar]
  36. Chakrabarty, R.K.; Moosmüller, H.; Garro, M.A.; Arnott, W.P.; Walker, J. Emissions from the laboratory combustion of wildland fuels: Particle morphology and size. J. Geophys. Res. Atmos. 2006, 111, D7. [Google Scholar] [CrossRef] [Green Version]
  37. Schmidt, A.F.; Finan, C. Linear regression and the normality assumption. J. Clin. Epidemiol. 2018, 98, 146–151. [Google Scholar] [CrossRef] [Green Version]
  38. Schnaiter, M.; Horvath, H.; Möhler, O.; Naumann, K.-H.; Saathoff, H. UV-VIS-NIR spectral optical properties of soot and soot-containing aerosols. J. Aerosol Sci. 2003, 34, 1421–1444. [Google Scholar] [CrossRef]
  39. D’Almeida, G.A.; Koepke, P.; Shettle, E.P. Atmospheric Aerosols: Global Climatology and Radiative Characteristics; A Deepak Pub: Hampton, VA, USA, 1991; p. 561. [Google Scholar]
  40. Liu, C.; Xu, X.; Yin, Y.; Schnaiter, M.; Yung, Y.L. Black carbon aggregates: A database for optical properties. J. Quant. Spectrosc. Radiat. Transf. 2019, 222, 170–179. [Google Scholar] [CrossRef]
  41. Lewis, K.; Arnott, W.P.; Moosmüller, H.; Wold, C.E. Strong spectral variation of biomass smoke light absorption and single scattering albedo observed with a novel dual-wavelength photoacoustic instrument. J. Geophys. Res. Atmos. 2008, 113, D16203. [Google Scholar] [CrossRef] [Green Version]
  42. Schuster, G.L.; Dubovik, O.; Holben, B.N. Angstrom exponent and bimodal aerosol size distributions. J. Geophys. Res. 2006, 111, D07207. [Google Scholar] [CrossRef] [Green Version]
  43. Li, J.; Liu, C.; Yin, Y.; Kumar, K.R. Numerical investigation on the Ångström exponent of black carbon aerosol. J. Geophys. Res. Atmos. 2016, 121, 3506–3518. [Google Scholar] [CrossRef] [Green Version]
  44. Dubovik, O.; Holben, B.; Kaufman, Y.; Yamasoe, M.; Smirnov, A. Single-scattering albedo of smoke retrieved from the sky radiance and solar transmittance measured from ground. J. Geophys. Res. Atmos. 1998, 103, 31903–31923. [Google Scholar] [CrossRef]
  45. Bond, T.C.; Bussemer, M.; Wehner, B.; Keller, S.; Charlson, R. Light absorption by primary particle emissions from a lignite burning plant. Environ. Sci. Technol. 1999, 33, 3887–3891. [Google Scholar] [CrossRef]
  46. Lawless, P.A.; Rodes, C.E.; Ensor, D.S. Multiwavelength absorbance of filter deposits for determination of environmental tobacco smoke and black carbon. Atmos. Environ. 2004, 38, 3373–3383. [Google Scholar] [CrossRef]
  47. Bond, T.C.; Bergstrom, R.W. Light absorption by carbonaceous particles: An investigative review. Aerosol Sci. Technol. 2006, 40, 27–67. [Google Scholar] [CrossRef]
  48. Bohren, C.F.; Huffman, D.R. Absorption and Scattering of Light by Small Particles; John Wiley & Sons: Hoboken, NJ, USA, 2008. [Google Scholar]
  49. Bergstrom, R. Extinction and absorption coefficients of the atmospheric aerosol as a function of particle size. Contr. Atmos. Phys. 1973, 46, 223–234. [Google Scholar]
  50. Schnaiter, M.; Schmid, O.; Petzold, A.; Fritzsche, L.; Klein, K. Measurement of wavelength-resolved light absorption by aerosols utilizing a UV-VIS extinction cell. Aerosol Sci. Technol. 2005, 39, 249–260. [Google Scholar] [CrossRef] [Green Version]
  51. Schmid, O.; Artaxo, P.; Arnott, W.; Chand, D.; Gatti, L.V. Spectral light absorption by ambient aerosols: Influenced by biomass burning in the Amazon Basin. I: Comparison and field calibration of absorption measurement techniques. Atmos Chem. Phys. 2006, 6, 3443–3462. [Google Scholar] [CrossRef] [Green Version]
  52. Lindberg, J.D.; Douglass, R.E.; Garvey, D.M. Carbon and the optical properties of atmospheric dust. Appl. Opt. 1993, 32, 6077–6081. [Google Scholar] [CrossRef]
  53. Hoffer, A.; Gelencsér, A.; Guyon, P.; Kiss, G.; Schmid, O. Optical properties of humic-like substances (HULIS) in biomass-burning aerosols. Atmos Chem. Phys. 2006, 6, 3563–3570. [Google Scholar] [CrossRef] [Green Version]
  54. Phillips, S.M.; Smith, G.D. Spectroscopic comparison of water-and methanol-soluble brown carbon particulate matter. Aerosol Sci. Technol. 2017, 51, 1113–1121. [Google Scholar] [CrossRef]
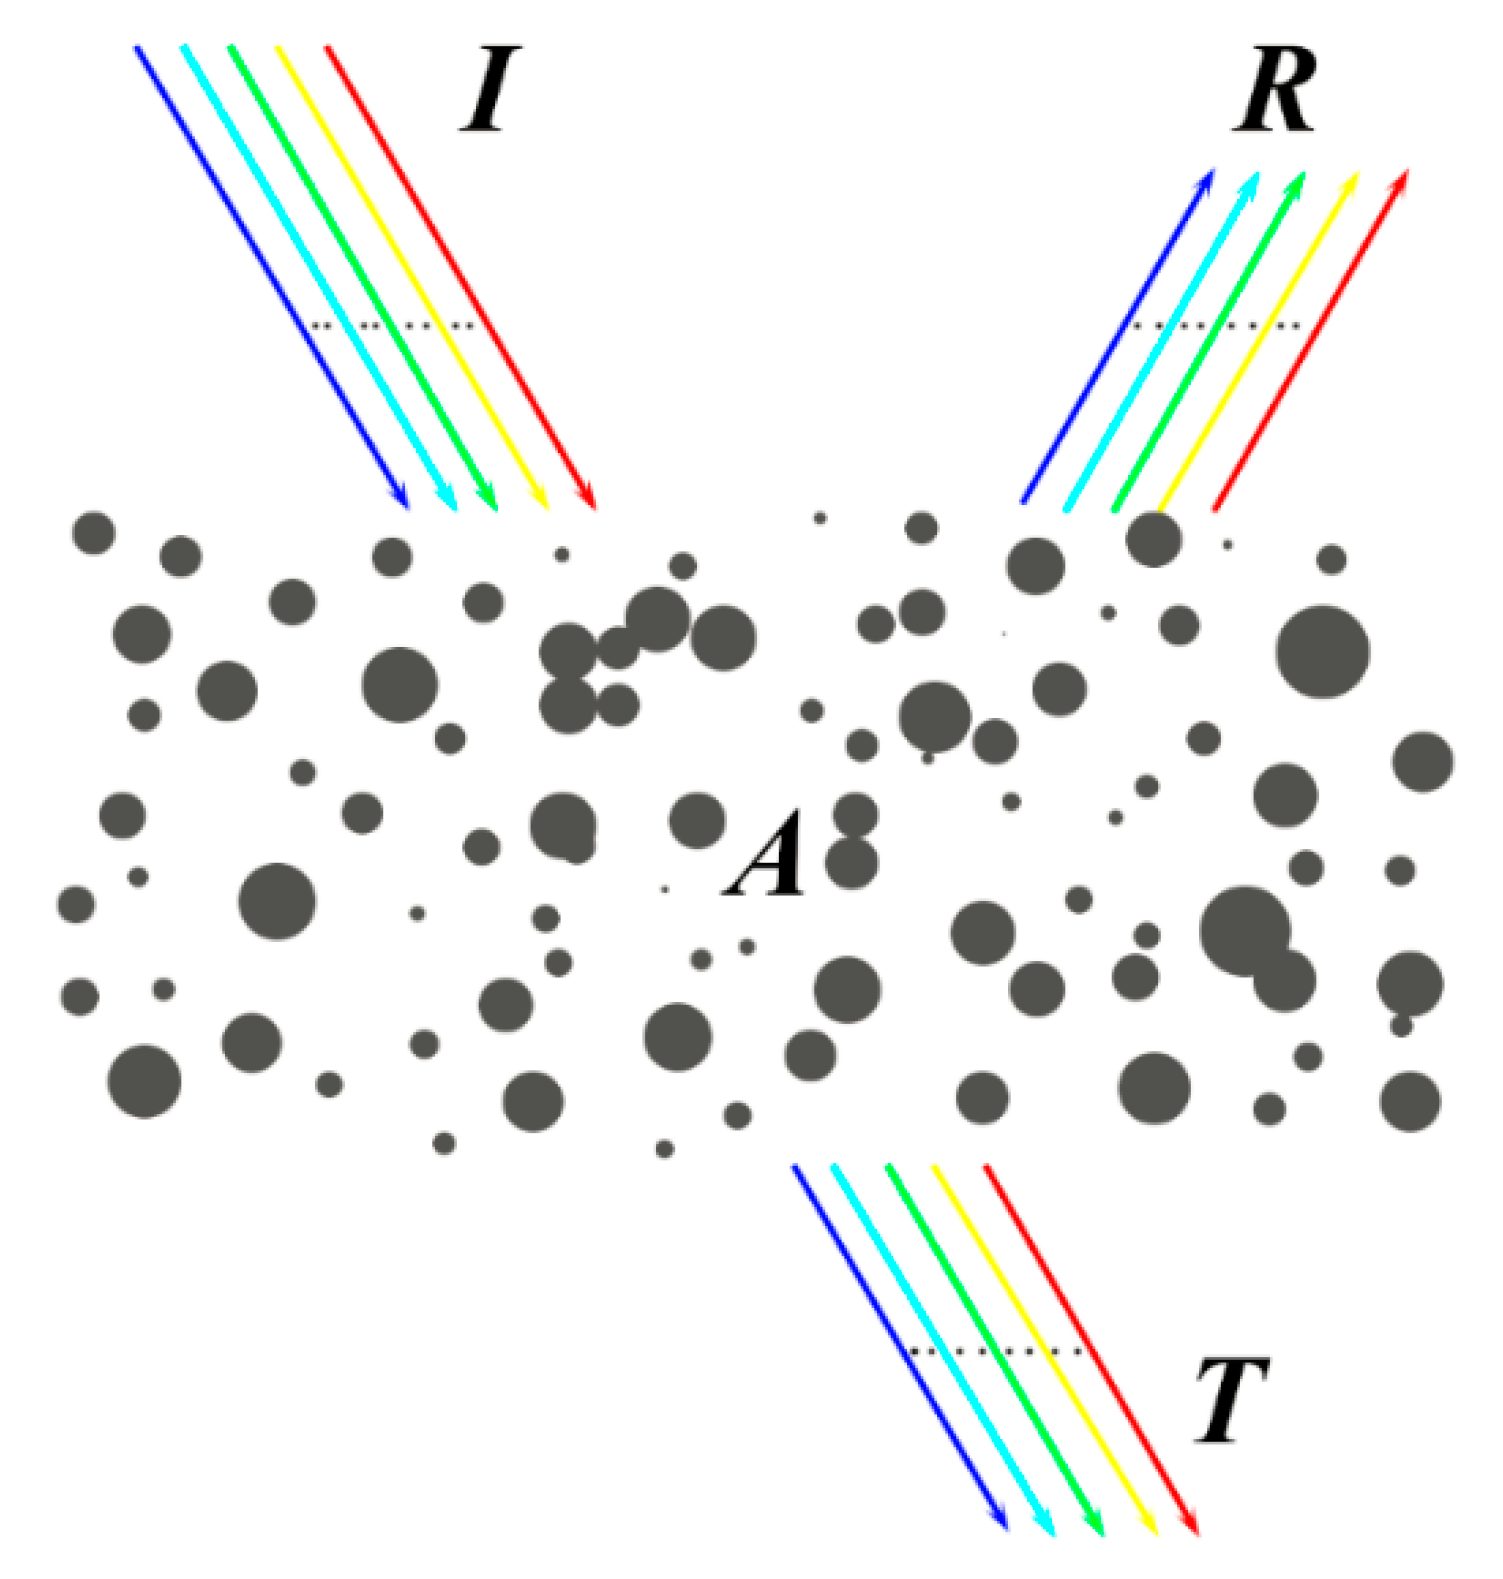
Figure 1. Configuration to simulate the colors of a black carbon (BC) aerosol layer in the atmosphere. “I” represents the incident light. “T” represents the transmitted light. “R” and “A” represent the reflected light and absorbed light, respectively. Randomly distributed spheres represent particles in the aerosol layer.
Atmosphere 11 00187 g001
Figure 2. (a) Terrestrial direct solar spectrum. (b) Spectral response curves of human photoreceptors (i.e., spectral absorption of light by the three cone types).
Atmosphere 11 00187 g002
Figure 3. Colors of BC aerosol layers with different optical depths. (ad) are four conditions differing in assumptions of simulation. (a) Solar spectrum and eye response. (b) Simplified spectrum and eye response. (c) Solar spectrum and simplified response. (d) Simplified spectrum and simplified response. The simplified spectrum is set to have the same irradiance at each wavelength. The simplified response is set to only have a response at the three wavelengths, 435 nm 550 nm and 700 nm, and the eye can change all light information into color information.
Atmosphere 11 00187 g003
Figure 4. Three series of colors of BC aerosols with different optical depths and particle mean geometric diameters. The refractive indices used in the color simulations of (ac) are from the studies of Schnaiter et al. [38], Chang and Charalampopoulos [25], and D’Almeida et al. [39].
Atmosphere 11 00187 g004
Figure 5. Seven series of hypothetical refractive indices. (a) The real part of the refractive index. (b) The imaginary part of the refractive index, which is set to be a linear change in logarithmic coordinates.
Atmosphere 11 00187 g005
Figure 6. (ag) show the seven series of colors of aerosols corresponding to AAE values from 1 to 7. The particle geometric mean diameter of aerosol layers is 0.1 μm.
Atmosphere 11 00187 g006
Table 1. Comparisons between four conditions. (a), (b), (c), and (d) are the four conditions explained in Figure 3. R, G, and B represent the fitting of red, green and blue color parameters, respectively. β and ε represent the slope and intercept of the regression equation fitted by two cases, respectively.
Relation between (b) and (a)Relation between (c) and (a)Relation between (d) and (a)
regression equationR: β = 0.93, ε = 1 × 10⁻⁴R: β = 0.77, ε = 1 × 10⁻²R: β = 0.99, ε = 1 × 10⁻²
G: β = 0.92, ε = 1 × 10⁻⁴G: β = 1.01, ε = −6 × 10⁻⁴G: β = 1.01, ε = −5 × 10⁻⁴
B: β = 1.04, ε = −1 × 10⁻⁴B: β = 0.84, ε = −6 × 10⁻⁴B: β = 1.04, ε = −8 × 10⁻⁴
Table 2. Parameters of characteristic color.
AAE τ 1 τ 2 T 550 , 1 T 550 , 2 Δ T 1 Δ T 2
10.200.900.830.420.090.23
20.201.200.830.320.170.44
30.181.300.850.300.210.58
40.161.450.870.270.230.68
50.131.550.900.270.230.74
60.101.600.930.270.200.78
70.091.650.940.290.200.80