Abstract
This study evaluates projected changes to surface wind characteristics for the 2071–2100 period over North America (NA), using four Global Environmental Multiscale regional climate model simulations, driven by two global climate models (GCMs) for two Representative Concentration Pathway scenarios. For the current climate, the model simulates well the climatology of mean sea level pressure (MSLP) and associated wind direction over NA. Future simulations suggest increases in mean wind speed for northern and eastern parts of Canada, associated with decreases in future MSLP, which results in more intense low-pressure systems situated in those regions such as the Aleutian and Icelandic Lows. Projected changes to annual maximum 3-hourly wind speed show more spatial variability compared to seasonal and annual mean wind speed, indicating that extreme wind speeds are influenced by regional level features associated with instantaneous surface temperature and air pressure gradients. The simulations also suggest some increases in the future 50-year return levels of 3-hourly wind speed and hourly wind gusts, mainly due to increases in the inter-annual variability of annual maximum values. The variability of projected changes to both extreme wind speed and gusts indicate the need for a larger set of projections, including those from other regional models driven by many GCMs to better quantify uncertainties in future wind extremes and their characteristics.
1. Introduction
Wind is a critical climate variable, as it transfers heat, moisture, and momentum between the Earth’s surface and the atmosphere [1,2], transports air pollutants [3], and affects evaporation rates in vegetated areas [4,5]. Wind is influenced by changes in atmospheric circulation, brought by climate variability and change, due to natural and anthropogenic forcing. Changes in surface wind speed and direction have significant implications for water cycle components [4], air pollution [6], arid and semiarid environments [7,8,9,10,11,12], fire activity [13], and wind energy production [14]. Moreover, changes in surface wind extremes and gusts have direct implications for buildings, infrastructure, agriculture, power lines, desert, and forestry [8,9,10,11,12,15,16,17,18,19,20]. Despite these implications, relatively fewer studies have focused on projected changes to wind characteristics compared to the temperature and precipitation fields [21,22].
Many studies detected decreasing/increasing changes in the mean and extreme values of 10-m near surface wind speed (hereafter, wind speed) based on observations. McVicar et al. [4] summarized 148 studies from across the globe. Several of these studies reported decreasing trends over many parts of North America (NA), but increasing trends for the Alaska, Yukon, and Central Arctic regions of Canada [2,23,24]. Griffin et al. [25] evaluated long-term trends in extreme wind speed for 92 meteorological stations located in the Pacific Northwest regions of NA and showed downward trends in maximum daily wind speed for inland stations, and no significant trends for stations in coastal regions. Hundecha et al. [26] reported increases in annual maximum wind speeds based on a regional reanalysis over southeastern parts of Canada for the 1979–2003 period.
Several studies concentrated on projected changes to mean and extreme wind speeds using global climate model (GCM) outputs. Mclnnes et al. [21] suggest consistent increases in mean wind speeds for south-eastern and northern parts of NA by the end of the 21st century based on the CMIP3 (Coupled Model Intercomparison Project Phase 3) multi-model ensemble for the SRES (Special Report on Emissions Scenarios) A1B scenario. Kumar et al. [22] reported projected increases in extreme wind speeds for some parts of the south-eastern USA and south-central and north-western Canada, and decreases for most parts of the USA and south-western and north-eastern Canada by the end of the 21st century, using the CMIP5 (CMIP Phase 5) multi-model ensemble for the Representative Concentration Pathway (RCP) 8.5 scenario, although the changes are mostly less than 6%. The IPCC [27], however, reported that projected changes to extreme wind speeds based on GCMs are more uncertain than those to mean wind speeds because of relatively fewer studies on extreme wind speeds and the difficulties in simulating these events with GCMs.
Regional climate models (RCMs), which are used for dynamical downscaling of GCM outputs, were employed in regional-scale studies to analyze climate change impacts on mean and extreme wind speeds over Europe [28,29] and an East Asian region [30]. Over the contiguous USA, Pryor et al. [31] evaluated future wind climates based on an ensemble of RCM simulations, obtained from the North American Regional Climate Change Assessment Program (NARCCAP), for the A2 emissions scenario for the middle of the 21st century (2041–2062). They found some decreases in mean wind speeds for the western USA in future climate, but no significant changes to extreme wind speeds were reported. However, regional-scale projections of wind speed characteristics and directions based on RCM outputs and RCP emission scenarios are not widely available for Canada and NA. Canadian RCMs have been used in regional-scale studies to analyze climate change impacts on different climate variables and their extremes over NA, such as precipitation [32], temperature [33,34], snow [35], floods [36], freezing rain [37], and droughts [38]; however, they have not been used extensively to study wind characteristics.
The main purpose of this study is to evaluate projected changes to wind speed characteristics (i.e., seasonal and annual mean wind speeds, diurnal cycles, directional distributions, and extreme values) for the 2071–2100 period, with respect to the 1981–2010 period over NA, using four transient climate change simulations performed with the Global Environmental Multiscale (GEM) model, in limited area configuration, driven by two GCMs, Canadian Earth System Model 2 (CanESM2) and the Max-Planck-Institute Earth System Model (MPI-ESM), for the RCP 4.5 and 8.5 scenarios. As surface pressure gradient is a main factor that determines wind characteristics, projected changes to mean sea level pressure (MSLP) and its gradient are also assessed. Besides, projected changes to wind gusts are also evaluated for Canada for the same time period, based on GEM model simulations driven by CanESM2 for RCP 4.5 and 8.5 scenarios.
2. Model Simulations and Observation Datasets
2.1. GEM Simulations
The RCM used in this study is the limited area version of the GEM model, which is used by Environment and Climate Change Canada (ECCC) for numerical weather predictions in Canada [39]. Deep convection in the model is based on Kain and Fritsch [40], while shallow convection follows Bélair et al. [41]. Resolvable large-scale precipitation is calculated following Sundqvist et al. [42] and the planetary boundary layer scheme follows Benoit et al. [43] and Delage [44]. Radiation is computed by Correlated K solar and terrestrial radiation suggested by Li and Barker [45]. Canadian Land Surface Scheme (CLASS) 3.5 is used for simulating land components [46]. This version of CLASS allows for a user-defined number of soil layers, and employs prognostic equations for energy and water conservation. It also has a thermally and hydrologically distinct snowpack, which is treated as an additional variable-depth soil layer. The GEM model employs a physical approach to estimate wind gusts following Brasseur [47]. This approach assumes that the surface wind gust occurs with the deflection of air particles flowing higher in the boundary layer, which are transported by turbulent eddies to the surface.
The simulation domain covers whole of NA and neighboring oceans at 0.44° horizontal resolution. Atmospheric lateral boundary conditions are obtained from the ECMWF (European Centre for Medium-Range Weather Forecasts) gridded ERA-Interim reanalysis [48], CanESM2 [49], and MPI-ESM [50]. The simulation driven by ERA-Interim (hereafter, GEM-ERA) for the 1981–2010 period is used for evaluating the model and the simulations driven by CanESM2 and MPI-ESM (hereafter, GEM-CanHist and GEM-MPIHist) for the same time period are used to investigate boundary-forcing errors [33,34,51]. Four GEM model simulations driven by CanESM2 and MPI-ESM for RCP 4.5 and 8.5 scenarios for the 2011–2100 period are considered for the analysis of projected changes. These simulations are referred to as GEM-CanRCP4.5, GEM-CanRCP8.5, GEM-MPIRCP4.5, and GEM-MPIRCP8.5. RCP 4.5 is a medium-emission scenario in which radiative forcing reaches 4.5 W/m2 by 2100 compared to pre-industrial values [27]. However, RCP 8.5 is a high-emission scenario in which total radiative forcing reaches 8.5 W/m2 by 2100. It is an appropriate scenario for business-as-usual and non-climate policy conditions. Particularly, RCP 8.5 is reported to closely follow the recent emissions trend [52]. The outputs from these climate change simulations are generally available at 3-hourly intervals. However, simulations at a shorter time scale are essential to derive robust changes to wind gusts. Therefore, hourly data from GEM-ERA, GEM-CanHist, GEM-CanRCP4.5, and GEM-CanRCP8.5 are used to evaluate projected changes to wind gusts.
2.2. Observed Datasets
For the validation of seasonal and annual mean wind speeds, the Climate Normals dataset of average wind speed for the USA [53] and homogenized surface wind speed dataset for Canada [2] for the 1981–2010 period are used. The Climate Normals dataset is the latest three-decade averages of climatological variables, including wind speed obtained from observations from 455 stations of National Oceanographic and Atmospheric Administration (NOAA)’s National Weather Service. The Canadian dataset is developed based on homogenized monthly mean wind speeds obtained from 156 stations of ECCC. As gridded sub-daily observations of wind speed are not available for the USA and Canada, the ERA-Interim reanalysis product, with 0.75° horizontal and 3-hourly time resolutions, for the 1981–2010 period (hereafter, ERA-Interim) is used for validating 3-hourly annual maximum wind speed. For validating wind gust, this study uses raw dataset of observed daily maximum gust for the 1981–2010 period from 166 stations of ECCC, located across Canada.
3. Methodology
The ability of the GEM model in simulating wind speed and gust was validated, prior to the investigation of future projections. GEM-ERA, GEM-CanHist, and GEM-MPIHist simulated 3-hourly wind speeds were validated by comparing the magnitude and spatial patterns of seasonal and annual mean wind speeds and characteristics of annual maximum values (i.e., mean, standard deviation, and 50-year return level (RL)) with those derived from station observations and ERA-Interim over NA for the 1981–2010 period. GEM-ERA and GEM-CanHist simulated hourly wind gusts are evaluated by comparing selected characteristics of annual maximum values to those obtained from raw station datasets over Canada for the same time period.
For all GEM model simulations and ERA-Interim, annual maximum 3-hourly wind speeds were compiled for the North American landmass for both current and future periods. Similarly, annual maximum values of hourly wind gust were compiled from the GEM model simulations driven by CanESM2 for the same time periods. Fifty-year RLs of wind speed and gust were estimated based on the Gumbel distribution, which is commonly considered for extreme value analysis of wind data in Canada [54,55]. The parameters of this distribution are estimated by the method of moments.
Spatial patterns of projected changes to the mean and extreme values of wind speed and gust and other important characteristics of wind speed (i.e., directional distribution, and seasonal and diurnal variability) for the future period relative to the current period are evaluated and discussed in the paper. Although the projected changes are assessed for all future years, given relatively small changes for near future periods, the projected changes are presented mainly for the 2071–2100 period.
4. Results
4.1. Surface Wind Speed
4.1.1. Validation
As wind is a response of air pressure differences, seasonal and annual MSLP and associated wind directions are evaluated first (Figure 1). ERA-Interim shows clearly, the climatic low and high pressure centers over NA and neighboring oceans in winter; i.e., the Aleutian Low located in the North Pacific Ocean, the Icelandic Low located in the North Atlantic, the Pacific High located in the middle-eastern part of the Pacific Ocean, the Beaufort High located over the Beaufort Sea in the Arctic Ocean, and the Canadian High located across North American continent. This dataset also shows a stronger Pacific High and weaker Aleutian Low and Icelandic Low in summer than in winter. Instead of the Canadian High, the thermal low is situated over the western and southern parts of NA in summer. The GEM model simulations generally reproduce well, the pressure systems and associated surface wind directions of ERA-Interim. The simulations, however, yield a more intense Canadian High than ERA-Interim for most of the North American continent in winter. Larger differences are noted for western coastal and central parts of Canada and most parts of the USA compared to the other regions. The simulations also display higher MSLP compared to ERA-Interim for the western coastal regions of Canada and the north-western USA in summer. GEM-CanHist (GEM-MPIHist) exhibits higher (lower) MSLP than ERA-Interim for the eastern USA in summer.
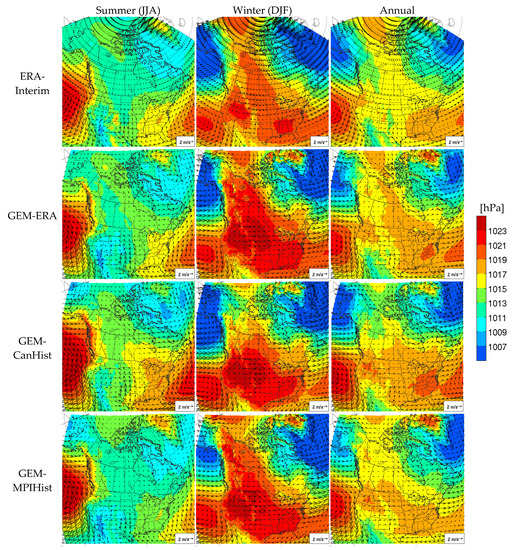
Figure 1.
Summer (JJA), winter (DJF), and annual mean wind vector (arrow) and mean sea level pressure for ERA-Interim and three GEM model simulations (i.e., GEM-ERA, GEM-CanHist, and GEM-MPIHist) over North America for the 1981–2010 period.
In Figure 2, observations indicate higher seasonal and annual mean wind speeds over north-eastern and north-western coastal regions of NA, the Great Plains (i.e., east of the Rocky Mountains of the United States and Canada), and the East Arctic (i.e., environs of Hudson Bay and northern Quebec). The observations display low wind speeds in western mountainous (Rocky Mountains) regions of NA, eastern mountainous (Appalachian Mountains) regions of the USA, and boreal forest regions of Canada because of high roughness length. The GEM model simulations (i.e., GEM-ERA, GEM-CanHist, and GEM-MPIHist) underestimate the observed annual mean wind speeds with negative mean biases in the range of −0.12 to approximately 0.3 m/s, whereas ERA-Interim overestimates with positive mean bias of 0.15 m/s. Seasonally, ERA-Interim shows a larger overestimation in winter with mean bias of 0.38 m/s, while the GEM model simulations yield similar mean biases in the range of −0.31–0.08 m/s, compared to their annual mean biases. The more intense Canadian High in GEM model simulations leads to reduced mean wind speed in winter over the North American continent compared to ERA-Interim. Overestimation of the annual mean wind speed was also noticed in the previous version of ERA-Interim; i.e., ERA-40, over the USA compared to station observations and other global reanalysis datasets [24]. However, the GEM model simulations and ERA-Interim reproduce well the spatial patterns of station-based observations and yield 0.70–0.68 and 0.68 spatial correlation coefficients, respectively. Results from the two GCM driven simulations (i.e., GEM-CanHist and GEM-MPIHist) are very similar to those of GEM-ERA, indicating that boundary forcing errors, i.e., the differences associated with the GCM boundary forcing data, reflected in the differences between the GEM model simulation driven by ERA-Interim and those driven by two GCMs, are generally modest. However, lower MSLPs of GEM-MPIHist result in higher mean wind speeds in summer over the eastern part of the USA compared to other simulations.
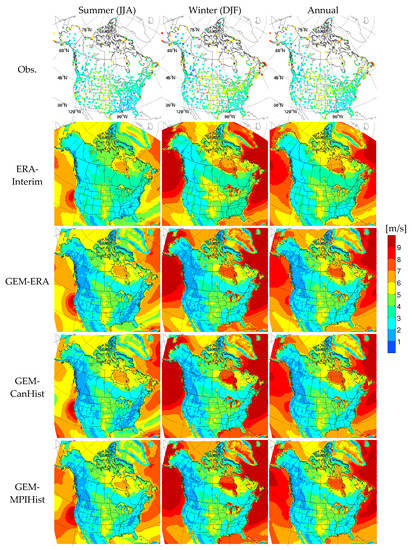
Figure 2.
Summer (JJA), winter (DJF), and annual mean wind speed for observations, ERA-Interim, and GEM model simulations (i.e., GEM-ERA, GEM-CanHist, and GEM-MPIHist) for the 1981–2010 period. Observed mean wind speeds are presented using circles, which are color coded following the side bar.
The mean and the 50-year RL of the annual maximum 3-hourly wind speed for ERA-Interim and GEM model simulations (Figure 3) exhibit similar spatial patterns as those of annual mean wind speed (Figure 2). Over the contiguous USA, spatial patterns of the mean and 50-year RL are in general agreement with those of the RCM-simulated and NCEP-2 reanalysis-derived mean annual 95th percentile wind speeds given in Pryor et al. [31]. Over Canada, spatial patterns of the mean and 50-year RL are mostly consistent with the contour maps presented in Hong et al. [55]. The contour maps were developed based on hourly wind speeds from 235 weather stations and the ordinary kriging method. It should be noted that GEM-ERA shows better consistency with observation-based contour maps than ERA-Interim for spatial patterns of the coefficient of variation (CV) over the western mountainous regions and of the mean and 50-year RL over northern parts of Canada, showing added value of GEM-ERA in simulating extreme wind speeds compared to its driving ERA-Interim reanalysis.
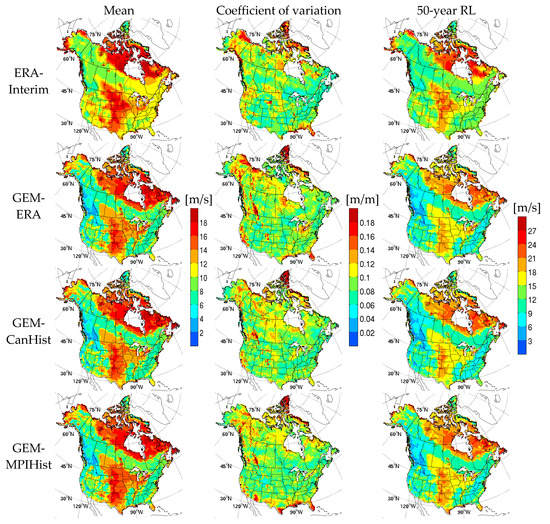
Figure 3.
Mean (first column), coefficient of variation (second column), and 50-year return level (RL) (third column) of annual maximum 3-hourly wind speed for ERA-Interim reanalysis and GEM model simulations for the 1981–2010 period.
4.1.2. Projected Changes
Projected changes to summer, winter and annual mean wind speeds and MSLP are presented in Figure 4. The four climate change simulations consistently suggest increases in annual mean wind speeds for the northern parts of NA, particularly for regions between Beaufort Sea and Hudson Bay, as well as northern parts of Quebec. The simulations, however, suggest decreases in future annual MSLP for most of North American landmass and neighboring oceans, particularly for the northern parts of NA by more than 1.5 hPa in winter, which are collocated with regions of increases in mean annual wind speed. Increased future temperatures will lead to a reduced sea ice fraction, and therefore, increases in open water fraction in the Arctic and adjoining seas and oceans, which lead to further increases in winter temperature, lower-tropospheric thickness, and sensible heat flux, and decreases in sea level pressure [56]. Decreases in future MSLP can increase (decrease) intensities of low (high) pressure systems situated in the northern regions such as Aleutian Low, Icelandic Low, and Beaufort High, which in turn result in increases in future wind speed. The increases in mean wind speed are larger in winter than in summer in terms of both magnitude and areal extent over the northern parts of NA. Similarly, the increases in mean wind speed are larger for RCP 8.5 scenario compared to RCP 4.5 scenario. Increases in seasonal and annual mean wind speeds for the northern regions by the end of the 21st century have also been reported by Mclnnes et al. [21] and Kumar et al. [22], based on the CMIP3 multi-model ensemble for SRES A1B scenario and the CMIP5 multi-model ensemble for RCP 8.5 scenario, respectively. The GEM model simulations, however, suggest decreases in mean wind speed for western parts of NA in winter and for most of NA in summer.
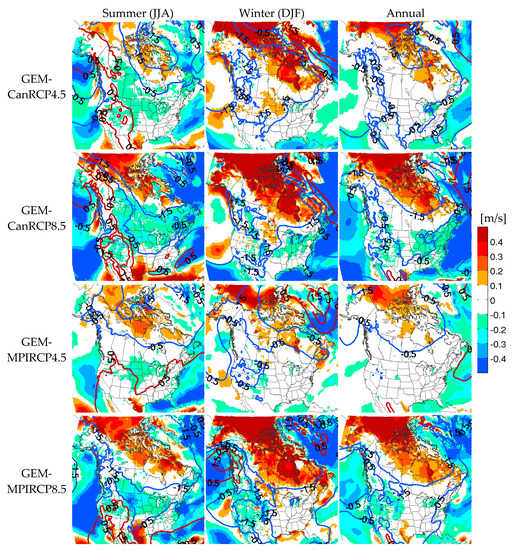
Figure 4.
Projected changes to summer, winter, and annual mean wind speeds (legend) for the future 2071–2100 period relative to the current 1981–2010 period. Projected changes to mean sea-level pressure (MSLP, unit: hPa) are represented by red (for increases) and blue (for decreases) contours.
Projected changes to seasonal mean wind speeds are presented in Figure 5 for seven sub-regions of NA (see Figure 2), with different mean wind speed characteristics. The previously discussed overestimation of ERA-Interim and underestimation of GEM-ERA for mean wind speed can be clearly seen in this figure. Although projected changes to seasonal mean wind speed for the future period are mostly within ±6%, the simulations show an overall good agreement with respect to the climate change signal for the seven sub-regions of NA. For instance, the four climate change simulations suggest an increase in regional median values of winter mean wind speed for Far North (FN), North Central (NC), and North East (NE) regions and in spring mean wind speed for NC, NE, and South Central (SC) regions. Similarly, the simulations suggest a decrease in regional median values of summer mean wind speed for North West (NW), NC, NE, South West (SW), SC, and South East (SE) regions and in fall mean wind speed for SW, SC, and SE regions.
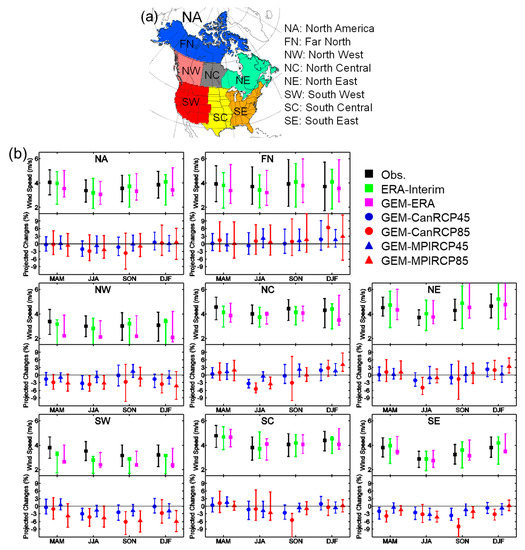
Figure 5.
Seasonal mean wind speeds for observations, ERA-Interim, and GEM-ERA for North America (NA) and seven sub-regions of NA, shown in (a), for the 1981–2010 period (upper panels in sub-plots in (b)). For ERA-Interim and GEM-ERA, grid points nearest to the observation stations are considered for calculation. Projected changes (in %) to seasonal mean wind speeds for the four GEM model simulations for the future 2071–2100 period, with respect to the current 1981–2010 period, are presented in the lower panel of each sub-plot in (b) based on all grid points of each region. Symbol and error-bar represent median and 1-sigma (15.9%–84.1%) range, respectively.
Wind speed generally shows highest values during ~13/15 h local time (i.e., ~18/21 h UTC) over Canada e.g., [57] and the USA; e.g., [58]. ERA-Interim and GEM-ERA reproduce well these diurnal cycles (Figure 6). The diurnal variation is known to be influenced by the diurnal evolution of the boundary layer thermal structure, as well as the presence of low clouds [59]. The simulations suggest overall increases in future diurnal mean wind speed for FN, NC, and NE regions and a slight increase for SC, particularly for 18–21 h UTC, in winter. The simulations, in particular, yield larger increases for NC, NE, and SC and smaller decreases for NW, SW, and SE in mean wind speed for the high wind speed hours compared to other times.
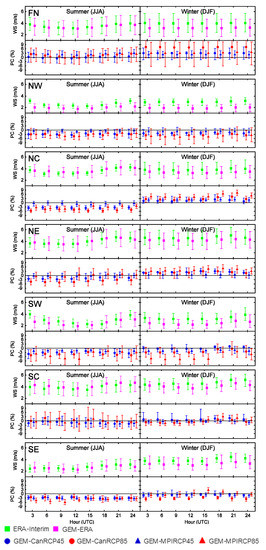
Figure 6.
Diurnal 3-hourly mean wind speed (WS) for ERA-Interim reanalysis and GEM-ERA simulation for the seven sub-regions of NA for the 1981–2010 period (upper panel in each sub-plot) for summer and winter based on all grid pints of each sub-region. Projected change (PC; in %) to 3-hourly mean wind speeds for the four GEM model simulations for the 2071–2100 period with respect to the 1981–2010 period are presented in the lower panel of each sub-plot. Symbol and error-bar represent median and 1-sigma (15.9~84.1%) range, respectively.
The climate change simulations suggest quite different spatial patterns of projected changes to the mean and CV of annual maximum 3-hourly wind speeds, reflecting the influence of the driving GCM and emissions scenario (Figure 7). Projected changes to the CV are larger compared to those in the mean values, indicating changes in the scale parameter are generally larger than the changes in the location parameter of the distribution which governs annual maximum wind speeds. Statistically insignificant differences between current and future periods are noted for the annual maximum wind speed for many cases. Projected changes to the annual maximum wind speeds yield more spatial variability relative to the changes to seasonal and annual mean wind speed presented in Figure 4. This might be because extremes of wind speed can be affected more by regional air circulations, due to instantaneous surface temperature and air pressure gradients and many other regional-scale effects [35]. Projected changes to 50-year RLs display strong spatial consistency with those for the CV, suggesting that changes in the inter-annual variability of annual maximum wind speed rather than those in the mean values are the main drivers for changes in the 50-year RLs. Pryor et al. [29] also reported increases in extreme wind speed over northern Europe, and attributed it to increases in the inter-annual variability. The change in the inter-annual variability could be due to the quasi-periodic inherent variability within the modeled climate system, possibly linked to the phase of large-scale climate oscillations (e.g., North Atlantic Oscillation). However, coincident increases in both extreme wind speed and MSLP gradient are shown in some cases, including GEM-CanRCP8.5 and GEM-MPIRCP8.5 over western Alaska and Hudson Bay coastal regions.
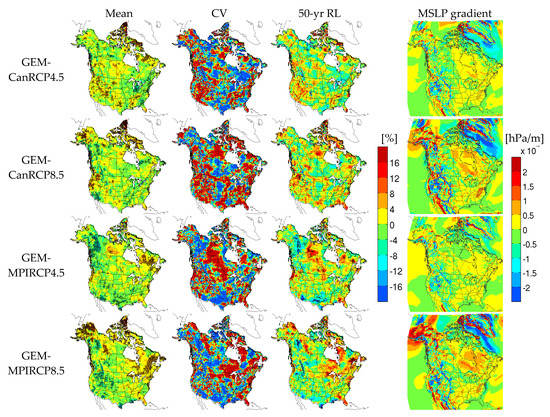
Figure 7.
Projected changes to the mean, coefficient of variation (CV), and 50-year RL of annual maximum wind speed for the future 2071–2100 period with respect to the current 1981–2010 period. Grid points are marked by open circles when the mean and 50-year return period values for current and future periods are statistically different at the 10% significance level. Projected changes to annual MSLP gradient are provided in the fourth column.
Spatial and temporal variability of annual mean and maximum wind speeds for each sub-region are investigated further in Figure 8. GEM-CanRCP4.5 and GEM-MPIRCP8.5 suggest increases in the spatial variability of both mean and extreme wind speeds, represented by the range of blue and red bands, for the FN region in the future period compared to the current 1981–2010 period, with generally increasing trends in the areal mean values. The two simulations also show increases in the inter-annual variability, represented by fluctuations of the time series, for both annual mean and maximum wind speeds for the FN region in the future. The two simulations, however, show disagreement in projections for some regions. For instance, increases in the spatial and inter-annual variability of annual mean and maximum wind speeds are suggested only by GEM-CanRCP4.5 for NW and SW regions and by GEM-MPIRCP8.5 for NE and SE regions. General decreases in annual mean wind speeds, but increases or approximately no changes in annual maximum wind speeds, are suggested by GEM-CanRCP4.5 for the NW, SW, and SE regions and by GEM-CanMPIRCP8.5 for the SE region.
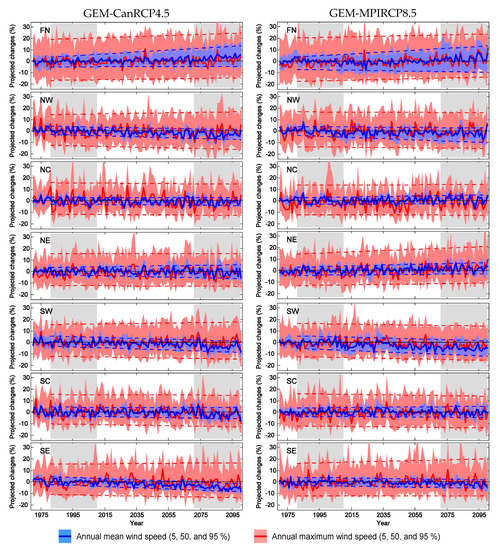
Figure 8.
Projected changes to the annual mean (blue) and maximum (red) wind speeds with respect to the mean values for the current 1981–2010 period for GEM-CanRCP4.5 (first column) and GEM-MPIRCP8.5 (second column) for the seven sub-regions (shown in Figure 5a) of North America. Lower and upper boundaries and solid lines respectively represent the 5th, 95th, and 50th percentiles of the projected changes from the grid points located in each sub-region. Blue and red dotted lines represent linear trends of the 5th and 95th percentiles of the projected changes. Current and future analysis periods are indicated with grey background.
Directional distributions of winter mean and annual maximum 3-hourly wind speeds simulated by GEM-CanHist and GEM-CanRCP8.5 for the seven sub-regions are shown in Figure 9. For winter mean wind speed, GEM-CanHist shows diverse directions for FN but a general westerly for other sub-regions (Figure 9a). These westerly directional distributions of winter wind speed, based on observed data, are shown by several studies over southern Canada [57,60] and the USA [61]. For the directional distributions, GEM-CanRCP8.5 shows relatively high degree of agreement with GEM-CanHist for the seven sub-regions. Mean wind speeds for other seasons show different directional distributions compared to those for the winter. For instance, southerly winds are typical for the southern USA, as shown by Klink [61] and also shown in Figure 2 of this study. Seasonal variations in the mean wind speed are strongly related to seasonal changes in MSLP [61]. Although the four climate change simulations suggest some changes to future MSLP (Figure 4), absolute changes to future MSLP are small. Therefore, these changes may not result in significant changes to the directional distributions of seasonal mean wind speeds. The directional distributions of annual maximum 3-hourly wind speed certainly exhibit more diversity than the winter mean values (Figure 9b). Particularly, the current and future simulations display some southerly directional distributions for the annual maximum wind speeds for SC and SE regions and that might be due to South Atlantic tropical cyclones in summer. Again, GEM-CanRCP8.5 yields relatively high degree of agreement with GEM-CanHist for the directional distributions for the seven sub-regions. However, there are some notable differences as well, particularly for northern parts of NA. For example, future wind directions as simulated by GEM-CanRCP8.5 are more diverse for NW and NC regions, but less so and more westerly for the NE region.
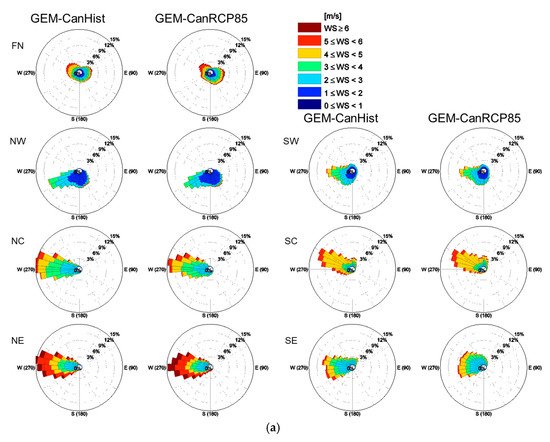

Figure 9.
Directional distributions of (a) winter mean and (b) annual maximum wind speeds (3-hourly) for seven sub-regions of NA (shown in Figure 5a) for the GEM-CanHist current 1981–2010 simulation (left column) and GEM-CanRCP8.5 future 2071–2100 simulation (right column). Radial axes represent the relative frequency (in each 15° sector), and color bins indicate wind speeds shown in the legend.
4.2. Wind Gust
According to the station-based raw observation dataset, mean values of annual maximum wind gusts show high values for western, eastern, and northern coastal regions, and south-central regions, compared to the western mountainous and boreal forest regions. These observed spatial distributions are reproduced well by GEM-ERA and GEM-CanHist (Figure 10a). Unlike the case of mean wind speed, the two climate change simulations do not display an underestimation of the annual maximum wind gusts for the boreal forest and western mountainous regions. The underestimation of surface wind speed could be due to the overestimated forest canopy height, and therefore roughness length; however, gust parameterization is not directly influenced by these fields. Observations show higher magnitudes and larger spatial variability for the CV, particularly for southern parts of Canada, compared to the two climate change simulations. Uncertainty in the raw observation dataset due to missing data and observation error could result in large spatial variability in observations, while underrepresented inter-annual variability in the model could lead to underestimation in the simulated values of CV. Consequently, model simulations show lower 50-year RLs, particularly for southern Canada, compared to the raw observation dataset. The gust factor, the ratio of 50-year RL of annual maximum hourly wind gust to that of annual maximum hourly wind speed, is higher for the western mountainous and boreal forest regions compared to the other regions. Wind speed for forest regions is usually smaller than other regions due to higher canopy height and roughness length. However, general underestimation of 50-year RLs of annual maximum wind speed also could result in overestimation of gust factors for forest regions. Projected changes to the mean, CV, and 50-year RL of annual maximum wind guest (Figure 10b) show similar spatial patterns as of annual maximum 3-hourly wind speed (Figure 7). Increases in extreme wind gust, driven by increases in inter-annual variability, for northern Europe was also reported by Pryor et al. [29]. High spatial variability in the projected changes to extreme wind gust was also noted in that region [28,29]. General increases in future gust factor are noted in areas where increases in future 50-year RLs of annual maximum wind gust are identified.
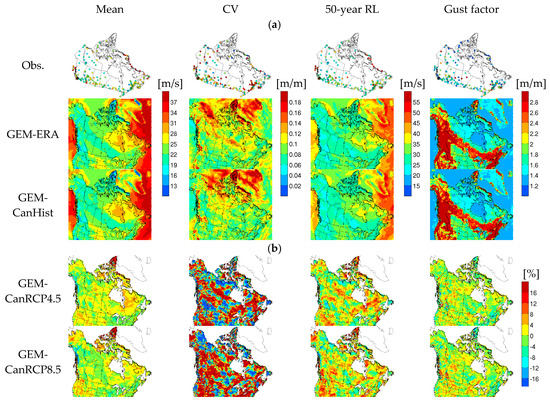
Figure 10.
(a) Mean, coefficient of variation (CV), and 50-year RL of annual maximum wind gust, as well as gust factor (the ratio of 50-year RL of annual maximum wind gust to that of annual maximum wind speed), for observations and two GEM model simulations (i.e., GEM-ERA and GEM-CanHist), for the 1981–2010 period. (b) Projected changes to the same characteristics as shown in (a) for the future 2071–2100 period with respect to the current 1981–2010 period.
5. Summary and Discussion
This study investigates projected changes to near-surface wind speed (10-m) characteristics (i.e., annual and seasonal means, diurnal cycle, directional distribution, and extreme values) for the 2071–2100 period relative to the 1981–2010 period over NA, using four simulations from the GEM model, driven by two GCMs for RCP 4.5 and 8.5 scenarios. Projected changes to wind gusts for the same future period over Canada, using the GEM model simulations driven by CanESM2 under the same two RCP scenarios are also evaluated. Validation of an ERA-Interim driven GEM model simulation (GEM-ERA) indicates that the model reproduces well, the spatial distributions of annual and seasonal MSLP and associated mean wind speed and direction, diurnal cycle, and characteristics of annual maximum values when compared to ERA-Interim. GEM-ERA can also reproduce observed spatial patterns of annual maximum wind gust. GEM-ERA, however, shows slight underestimation of MSLP and associated mean wind speed over NA compared to ERA-Interim. This simulation also shows some underestimation of mean wind speed for western and south-eastern mountainous regions and boreal forest regions of NA, but not for wind gust, indicating that geophysical fields in the GEM model, such as the canopy height of forests, may need to be verified/modified. The model yields modest boundary forcing errors, as the two GCM driven simulations (i.e., GEM-CanHist and GEM-MPIHist) show results that are similar to those of GEM-ERA for studied wind speed and gust characteristics.
The climate change simulations show increases in future annual mean wind speed for the northern parts of NA, possibly due to decreases in future MSLP, which can increase (or decrease) intensities of low (or high) pressure systems situated in those regions, such as the Aleutian Low, Icelandic Low, and Beaufort High. The increases in future mean wind speed are larger in winter than in summer and are so, too, for RCP 8.5 simulations than RCP 4.5 simulations. The climate change simulations also suggest increases in future winter mean wind speed for the Far North, North Central, and North East regions and in future spring mean wind speed for North Central, North East, and South-Central regions of NA. In addition, the simulations also suggest larger increases for North Central, North East, and South-Central regions and smaller decreases for North West, South West, and South East regions in winter mean wind speed for the high diurnal wind speed hours (i.e., 12~15 h local times) compared to other times of the day. Although, sea level pressure is a dominant parameter in controlling surface wind speed [62], changes in sea surface temperature, meridional temperature gradient, and atmospheric moisture levels in response to global climate change can also explain, partly, the noted changes in surface wind speed [61,63]. The changes in sea level pressure and the associated atmospheric circulation changes can be driven by regional changes in precipitation, surface temperature, ocean circulation, and the greenhouse gas concentrations [64]. Therefore, further investigation of the relationship between projected changes to surface wind speed and relevant climate variables is needed.
Spatial patterns of projected changes to the 50-year RL of annual maximum wind speed are different from those for the mean wind speed. Important differences are also noted among the simulations, particularly in the spatial patterns of projected changes to the 50-year RL of annual maximum 3-hourly wind speed, reflecting the influence of the driving GCM and RCP scenario. Changes in the inter-annual variability of the annual maximum wind speed are detected as the main attributable component to changes in the 50-year RLs, as the GEM model simulations show strong spatial consistency between the projected changes to the 50-year RL and the variance of the annual maximum wind speed. Directional distributions of annual maximum wind speed show more diversity than those of winter mean wind speed. However, future directional distributions for both annual mean and maximum wind speeds exhibit a high degree of agreement with their historical distributions. Projected changes to the 50-year RL of annual maximum wind gust, evaluated based on two hourly simulations, generally show similar spatial patterns as those of annual maximum 3-hourly wind speed. It is important to note that small increases in extreme wind speed could have significant impacts on the design and management of buildings and other structures, as design wind pressure is directly proportional to the square of the design wind speed [35,54].
Projected changes to extreme wind speed characteristics evaluated in this study, based on high-resolution GEM model simulations, will be useful to assess detailed regional impacts, particularly for air pollution, fire activity, and wind-energy production related studies. Similarly, the results of the analyses, focused on wind extremes and gusts, presented here will be useful for the better design and management of built (e.g., buildings, power transmission lines, and other infrastructures) and natural (e.g., trees, crops, etc.) environments. However, finer resolution (<10 km) regional climate simulations should be considered to simulate regional wind extremes, as 50 km resolution climate model simulations have difficulty in simulating small-scale phenomena, such as tornados and convective wind storms. Moreover, the climate change signal associated with extreme wind speed and gust, found here to be dependent on the driving GCM and emissions scenario, warrants a broader set of projections, considering many regional models and driving global models to properly quantify uncertainties in future projections.
Author Contributions
Conceptualization, D.I.J. and L.S.; formal analysis, D.I.J.; methodology, D.I.J. and L.S.; writing—original draft, D.I.J. and L.S.
Funding
This research was funded by the Natural Sciences and Engineering Research Council (NSERC) of Canada and the Trottier Institute for Sustainability in Engineering and Design, McGill University. The GEM simulations considered in this study were performed on the supercomputer managed by Calcul Québec and Compute Canada.
Conflicts of Interest
The authors declare no conflict of interest.
References
- Klink, K. Trends and interannual variability of wind speed distributions in Minnesota. J. Clim. 2002, 15, 3311–3317. [Google Scholar] [CrossRef]
- Wan, H.; Wang, X.L.; Swail, V.R. Homogenization and trend analysis of Canadian near-surface wind speeds. J. Clim. 2010, 23, 1209–1225. [Google Scholar] [CrossRef]
- Seaman, N.L. Meteorological modeling for air-quality assessments. Atmos. Environ. 2000, 34, 2231–2259. [Google Scholar] [CrossRef]
- McVicar, T.R.; Roderick, M.L.; Donohue, R.J.; Li, L.T.; Van Niel, T.G.; Thomas, A.; Grieser, J.; Jhajharia, D.; Himri, Y.; Mahowald, N.M.; et al. Global review and synthesis of trends in observed terrestrial near-surface wind speeds: Implications for evaporation. J. Hydrol. 2012, 416, 182–205. [Google Scholar] [CrossRef]
- Kim, J.; Paik, K. Recent recovery of surface wind speed after decadal decrease: A focus on South Korea. Clim. Dyn. 2015, 45, 1699–1712. [Google Scholar] [CrossRef]
- Arain, M.A.; Blair, R.; Finkelstein, N.; Brook, J.R.; Sahsuvaroglu, T.; Beckerman, B.; Zhang, L.; Jerrett, M. The use of wind fields in a land use regression model to predict air pollution concentrations for health exposure studies. Atmos. Environ. 2007, 41, 3453–3464. [Google Scholar] [CrossRef]
- Okin, G.S.; Gillette, D.A.; Herrick, J.E. Multi-scale controls on and consequences of aeolian processes in landscape change in arid and semi-arid environments. J. Arid. Environ. 2006, 65, 253–275. [Google Scholar] [CrossRef]
- Li, J.; Okin, G.S.; Alvarez, L.; Epstein, H. Quantitative effects of vegetation cover on wind erosion and soil nutrient loss in a desert grassland of southern New Mexico, USA. Biogeochemistry 2007, 85, 317–332. [Google Scholar] [CrossRef]
- Kaplan, M.L.; Vellore, R.K.; Lewis, J.M.; Young, M. The role of unbalanced mesoscale circulations in dust storms. J. Geophys. Res. 2011, 116, D23101. [Google Scholar] [CrossRef]
- Lewis, J.M.; Kaplan, M.L.; Vellore, R.; Rabin, R.M.; Hallett, J.; Cohn, S.A. Dust storm over the Black Rock Desert: Larger-scale dynamic signatures. J. Geophys. Res. 2011, 116, D06113. [Google Scholar] [CrossRef]
- Pokharel, A.K.; Kaplan, M.L.; Fiedler, S. The role of jet adjustment processes in subtropical dust storms. J. Geophys. Res. Atmos. 2017, 122, 12122–12139. [Google Scholar] [CrossRef]
- Pokharel, A.K.; Kaplan, M.L.; Fiedler, S. Subtropical dust storms and downslope wind events. J. Geophys. Res. Atmos. 2017, 122, 10–191. [Google Scholar] [CrossRef]
- Le Goff, H.; Flannigan, M.D.; Bergeron, Y. Potential changes in monthly fire risk in the eastern Canadian boreal forest under future climate change. Can. J. For. Res. 2009, 39, 2369–2380. [Google Scholar] [CrossRef]
- Pryor, S.C.; Barthelmie, R.J. Assessing the vulnerability of wind energy to climate change and extreme events. Clim. Chang. 2013, 121, 79–91. [Google Scholar] [CrossRef]
- Dore, M.H. Forecasting the conditional probabilities of natural disasters in Canada as a guide for disaster preparedness. Nat. Hazards 2003, 28, 249–269. [Google Scholar] [CrossRef]
- Changnon, S.A. Temporal and spatial distributions of wind storm damages in the United States. Clim. Chang. 2009, 94, 473–482. [Google Scholar] [CrossRef]
- Lopes, A.; Oliveira, S.; Fragoso, M.; Andrade, J.A.; Pedro, P. Wind risk assessment in urban environments: The case of falling trees during windstorm events in Lisbon. In Bioclimatology and Natural Hazards; Springer: Amsterdam, The Netherlands, 2009; pp. 55–74. [Google Scholar]
- Pinto, J.G.; Neuhaus, C.P.; Leckebusch, G.C.; Reyers, M.; Kerschgens, M. Estimation of wind storm impacts over Western Germany under future climate conditions using a statistical–dynamical downscaling approach. Tellus A 2010, 62, 188–201. [Google Scholar] [CrossRef]
- Steenbergen, R.D.; Koster, T.; Geurts, C.P. The effect of climate change and natural variability on wind loading values for buildings. Build. Environ. 2012, 55, 178–186. [Google Scholar] [CrossRef]
- Rezaei, S.N.; Chouinard, L.; Langlois, S.; Légeron, F. Analysis of the effect of climate change on the reliability of overhead transmission lines. Sustain. Cities Soc. 2016, 27, 137–144. [Google Scholar] [CrossRef]
- Mclnnes, K.L.; Erwin, T.A.; Bathols, J.M. Global Climate Model projected changes in 10 m wind speed and direction due to anthropogenic climate change. Atmos. Sci. Lett. 2011, 12, 325–333. [Google Scholar] [CrossRef]
- Kumar, D.; Mishra, V.; Ganguly, A.R. Evaluating wind extremes in CMIP5 climate models. Clim. Dyn. 2015, 45, 441–453. [Google Scholar] [CrossRef]
- Hartmann, B.; Wendler, G. The significance of the 1976 Pacific climate shift in the climatology of Alaska. J. Clim. 2005, 18, 4824–4839. [Google Scholar] [CrossRef]
- Pryor, S.C.; Barthelmie, R.J.; Young, D.T.; Takle, E.S.; Arritt, R.W.; Flory, D.; Gutowski, W.J., Jr.; Nunes, A.; Roads, J. Wind speed trends over the contiguous United States. J. Geophys. Res. Atmos. 2009, 114, D14105. [Google Scholar] [CrossRef]
- Griffin, B.J.; Kohfeld, K.E.; Cooper, A.B.; Boenisch, G. Importance of location for describing typical and extreme wind speed behavior. Geophys. Res. Lett. 2010, 37, L22804. [Google Scholar] [CrossRef]
- Hundecha, Y.; St-Hilaire, A.; Ouarda, T.B.M.J.; El Adlouni, S.; Gachon, P. A nonstationary extreme value analysis for the assessment of changes in extreme annual wind speed over the Gulf of St. Lawrence, Canada. J. Appl. Meteorol. Climtol. 2008, 47, 2745–2759. [Google Scholar] [CrossRef]
- Field, C.B.; Barros, V.; Stocker, T.F.; Qin, D.; Dokken, D.J.; Ebi, K.L.; Mastrandrea, M.D.; Mach, K.J.; Plattner, G.-K.; Allen, S.K.; et al. (Eds.) IPCC Managing the Risks of Extreme Events and Disasters to Advance Climate Change Adaptation: A Special Report of Working Groups I and II of the Intergovernmental Panel on Climate Change; Cambridge University Press: New York, NY, USA, 2012; p. 582. [Google Scholar]
- Nikulin, G.; Kjellström, E.; Hansson, U.L.F.; Strandberg, G.; Ullerstig, A. Evaluation and future projections of temperature, precipitation and wind extremes over Europe in an ensemble of regional climate simulations. Tellus A 2011, 63, 41–55. [Google Scholar] [CrossRef]
- Pryor, S.C.; Barthelmie, R.J.; Clausen, N.E.; Drews, M.; MacKellar, N.; Kjellström, E. Analyses of possible changes in intense and extreme wind speeds over northern Europe under climate change scenarios. Clim. Dyn. 2012, 38, 189–208. [Google Scholar] [CrossRef]
- Kim, J.Y.; Kim, D.Y.; Oh, J.H. Projected changes in wind speed over the Republic of Korea under A1B climate change scenario. Int. J. Clim. 2014, 34, 1346–1356. [Google Scholar] [CrossRef]
- Pryor, S.C.; Barthelmie, R.J.; Schoof, J.T. Past and future wind climates over the contiguous USA based on the North American Regional Climate Change Assessment Program model suite. J. Geophys. Res. Atmos. 2012, 117, D19119. [Google Scholar] [CrossRef]
- Diaconescu, E.P.; Gachon, P.; Laprise, R.; Scinocca, J.F. Evaluation of precipitation indices over North America from various configurations of regional climate models. Atmos. Ocean 2016, 54, 418–439. [Google Scholar] [CrossRef]
- Jeong, D.I.; Sushama, L.; Diro, G.T.; Khaliq, M.N. Projected changes to winter temperature characteristics over Canada based on an RCM ensemble. Clim. Dyn. 2016, 47, 1351–1366. [Google Scholar] [CrossRef][Green Version]
- Jeong, D.I.; Sushama, L.; Diro, G.T.; Khaliq, M.N.; Beltrami, H.; Caya, D. Projected changes to high temperature events for Canada based on a regional climate model ensemble. Clim. Dyn. 2016, 46, 3163–3180. [Google Scholar] [CrossRef]
- Jeong, D.I.; Sushama, L. Projected changes to extreme wind and snow environmental loads for buildings and infrastructure across Canada. Sustain. Cities Soc. 2018, 36, 225–236. [Google Scholar] [CrossRef]
- Teufel, B.; Diro, G.T.; Whan, K.; Milrad, S.M.; Jeong, D.I.; Ganji, A.; Huziy, O.; Winger, K.; Gyakum, J.R.; de Elia, R.; et al. Investigation of the 2013 Alberta flood from weather and climate perspectives. Clim. Dynam. 2017, 48, 2881–2899. [Google Scholar] [CrossRef]
- Jeong, D.I.; Cannon, A.J.; Zhang, X. Projected changes to extreme freezing precipitation and design ice loads over North America based on a large ensemble of Canadian regional climate model simulations. Nat. Hazards Earth Syst. Sci. 2019, 19, 857–872. [Google Scholar] [CrossRef]
- Jeong, D.I.; Sushama, L.; Khaliq, M.N. The role of temperature in drought projections over North America. Clim. Chang. 2014, 127, 289–303. [Google Scholar]
- Côté, J.; Gravel, S.; Méthot, A.; Patoine, A.; Roch, M.; Staniforth, A. The operational CMC-MRB global environmental multiscale (GEM) model. Part I: Design considerations and formulation. Mon. Weather. Rev. 1998, 126, 1373–1395. [Google Scholar] [CrossRef]
- Kain, J.; Fritsch, J. The role of the convective “trigger function” in numerical forecasts of mesoscale convective systems. Meteorol. Atmos. Phys. 1992, 49, 93–106. [Google Scholar] [CrossRef]
- Bélair, S.; Mailhot, J.; Girard, C.; Vaillancourt, P. Boundary layer and shallow cumulus clouds in a medium-range forecast of a large-scale weather system. Mon. Weather. Rev. 2005, 133, 1938–1960. [Google Scholar] [CrossRef]
- Sundqvist, H.; Berge, E.; Kristjánsson, J.E. Condensation and cloud parameterization studies with a mesoscale numerical weather prediction model. Mon. Weather. Rev. 1989, 117, 1641–1657. [Google Scholar] [CrossRef]
- Benoit, R.; Côté, J.; Mailhot, J. Inclusion of a TKE boundary layer parameterization in the Canadian regional finite-element model. Mon. Weather. Rev. 1989, 117, 1726–1750. [Google Scholar] [CrossRef]
- Delage, Y. Parameterising sub-grid scale vertical transport in atmospheric models under statically stable conditions. Bound. Layer. Meteorol. 1997, 82, 23–48. [Google Scholar] [CrossRef]
- Li, J.; Barker, H.W. A radiation algorithm with correlated-k distribution. Part I: Local thermal equilibrium. J. Atmos. Sci. 2005, 62, 286–309. [Google Scholar] [CrossRef]
- Verseghy, D. CLASS-The Canadian Land Surface Scheme (Version 3.6); Techical Report; Climate Research Division, Science and Technology Branch, Environment Canada: Gatineau, QC, Canada, 2012; p. 179. [Google Scholar]
- Brasseur, O. Development and application of a physical approach to estimating wind gusts. Mon. Weather. Rev. 2001, 129, 5–25. [Google Scholar] [CrossRef]
- Dee, D.P.; Uppala, S.M.; Simmons, A.J.; Berrisford, P.; Poli, P.; Kobayashi, S.; Andrae, U.; Balmaseda, M.A.; Balsamo, G.; Bauer, P.; et al. The ERA-Interim reanalysis: Configuration and performance of the data assimilation system. Q. J. R. Meteor. Soc. 2011, 137, 553–597. [Google Scholar] [CrossRef]
- Arora, V.K.; Scinocca, J.F.; Boer, G.J.; Christian, J.R.; Denman, K.L.; Flato, G.M.; Kharin, V.V.; Lee, W.G.; Merryfield, W.J. Carbon emission limits required to satisfy future representative concentration pathways of greenhouse gases. Geophys. Res. Lett. 2011, 38, L05805. [Google Scholar] [CrossRef]
- Giorgetta, M.A.; Jungclaus, J.; Reick, C.H.; Legutke, S.; Bader, J.; Bottinger, M.; Brovkin, V.; Crueger, T.; Esch, M.; Fieg, K.; et al. Climate and carbon cycle changes from 1850 to 2100 in MPI-ESM simulations for the Coupled Model Intercomparison Project phase 5. J. Adv. Model. Earth. Syst. 2013, 5, 572–597. [Google Scholar] [CrossRef]
- Jeong, D.I.; Sushama, L.; Khaliq, M.N.; Roy, R. A copula-based multivariate analysis of Canadian RCM projected changes to flood characteristics for northeastern Canada. Clim. Dyn. 2014, 42, 2045–2066. [Google Scholar] [CrossRef]
- Sanford, T.; Frumhoff, P.C.; Luers, A.; Gulledge, J. The climate policy narrative for a dangerously warming world. Nat. Clim. Chang. 2014, 4, 164–166. [Google Scholar] [CrossRef]
- Arguez, A.; Durre, I.; Applequist, S.; Vose, R.S.; Squires, M.F.; Yin, X.; Heim, R.R., Jr.; Owen, T.W. NOAA’s 1981–2010 US Climate normals: An overview. Bull. Amer. Meteorol. Soc. 2012, 93, 1687–1697. [Google Scholar] [CrossRef]
- NRCC. NRCC National Building Code of Canada; Institute for Research in Construction, National Research Council of Canada: Ottawa, ON, Canada, 2015. [Google Scholar]
- Hong, H.P.; Mara, T.G.; Morris, R.; Li, S.H.; Ye, W. Basis for recommending an update of wind velocity pressures in Canadian design codes. Can. J. Civ. Engiron. 2014, 41, 206–221. [Google Scholar] [CrossRef]
- Hines, K.M.; Bromwich, D.H.; Bai, L.; Bitz, C.M.; Powers, J.G.; Manning, K.W. Sea ice enhancements to Polar WRF. Monthly Weather Rev. 2015, 143, 2363–2385. [Google Scholar] [CrossRef]
- Li, M.; Li, X. Investigation of wind characteristics and assessment of wind energy potential for Waterloo region, Canada. Energ. Convers. Manag. 2005, 46, 3014–3033. [Google Scholar] [CrossRef]
- Belu, R.; Koracin, D. Wind characteristics and wind energy potential in western Nevada. Renew. Energy 2009, 34, 2246–2251. [Google Scholar] [CrossRef]
- He, Y.; Monahan, A.H.; McFarlane, N.A. Diurnal variations of land surface wind speed probability distributions under clear-sky and low-cloud conditions. Geophys. Res. Lett. 2013, 40, 3308–3314. [Google Scholar] [CrossRef]
- Hugenholtz, C.H.; VanVeller, G.A. Wind hazard in the alpine zone: A case study in Alberta, Canada. Weather 2016, 71, 27–31. [Google Scholar] [CrossRef][Green Version]
- Klink, K. Trends in mean monthly maximum and minimum surface wind speeds in the coterminous United States, 1961 to 1990. Clim. Res. 1999, 13, 193–205. [Google Scholar] [CrossRef]
- Li, H.; Dai, A.; Zhou, T.; Lu, J. Responses of East Asian summer monsoon to historical SST and atmospheric forcing during 1950–2000. Clim. Dyn. 2010, 34, 501–514. [Google Scholar] [CrossRef]
- Bichet, A.; Wild, M.; Folini, D.; Schär, C. Causes for decadal variations of wind speed over land: Sensitivity studies with a global climate model. Geophys. Res. Lett. 2012, 39, L11701. [Google Scholar] [CrossRef]
- Gillett, N.P.; Fyfe, J.C.; Parker, D.E. Attribution of observed sea level pressure trends to greenhouse gas, aerosol, and ozone changes. Geophys. Res. Lett. 2013, 40, 2302–2306. [Google Scholar] [CrossRef]
© 2019 by the authors. Licensee MDPI, Basel, Switzerland. This article is an open access article distributed under the terms and conditions of the Creative Commons Attribution (CC BY) license (http://creativecommons.org/licenses/by/4.0/).