1. Introduction
Encouraging energy savings in residential buildings has been a topic of scientific interest since the 1970s, when the energy crisis made people aware of the possible exhaustion of fossil fuels. Almost 50 years later, it is clear that all intervention addressed to improve the energy efficiency of buildings should be combined with actions aimed at increasing the awareness and participation of end users, also through more frequent and detailed information on energy consumption [
1]. In the absence of frequent information, two buildings with similar thermo-physical characteristics and energy performances, even designed consistently with N-ZEB (Net-Zero Energy Buildings) criteria, can consume one twice the other depending upon the occupants’ behavior [
2]. In recent years, smart devices and information and communication technologies (ICT) allowed the possibility to set up integrated systems to support decisions at the building, district, and city stages, but they are not common owing to the complexity of the problem, the reduced interoperability among the different systems, and high costs [
3]. In addition, the effectiveness of user’s feedback actions addressed at the energy savings is a still debated topic in the scientific literature.
On the basis of the results of 38 different studies addressing the effectiveness of interventions aimed at encouraging families to reduce their energy consumption [
4], two macro-categories are identified, depending on the kind of information provided to families: (i) antecedent strategies; (ii) consequent strategies. Antecedent strategies include media campaigns, workshops, educational conferences, and energy audits for targeted and personalized information [
5,
6]. It is proven that antecedent strategies raise user awareness, but do not necessarily lead to behavioral changes or sure energy savings. This category includes any type of user feedback for example, real-time feedback, information presented via in-home displays, mobile apps, or online services [
7,
8,
9]. Feedback actions can be direct, when learned directly from the instrument display (meter, sub-meter, and so on) or indirect, when information on data consumption is preliminary processed before reaching the user. The inconsistencies in behaviors related to the use of energy in families are the result of the following reasons [
10]: (i) temporal coherence of decisions, (ii) difficulty in processing consumption data and in assuming simple decisions, and (iii) effects of presentation.
The available literature identifies three key problems related to the feedback: (i) the poor evidence of effectiveness, (ii) the need for involving users, and (iii) the potential occurrence of unwanted consequences. The main finding is that actual in-home displays could not be effective in orientating users’ behaviors. Thus, it is necessary to develop and test novel feedback devices accounting for the degree of user involvement [
11]. In a recent experimental campaign [
12], many interviewed users reported difficulties in the interpretation of the units (kW, kWh) and poor feedback (e.g., lack in the corresponding economic value). This research also highlighted the usefulness of presenting disaggregated data for each device (sub-metering), at least for the most energy-consuming devices (stove, oven, dishwasher, washing machine, dryer, and so on) and of benchmarks with historical consumption.
In this scenario, low-income families, such as those living in public housing, are a particular category of users to be approached in a specific way. A recent experimental study in seven European Union (EU) countries highlighted several problems both in the implementation of smart-metering solutions and in the use of personalized feedback for low-income families in the Mediterranean region [
13]. The experimental results proved that the use of smart-meters associated with in-home displays is not so effective. On the other hand, the monitoring of individual electrical devices, the allocation of consumption inside the dwelling, and suggestions for energy retrofits are appreciated. The joint implementation of these measures and the personalization of user feedback resulted in electricity consumption savings varying in the range from 22% to 27% [
14]. Unfortunately, the adoption of energy saving strategies in social housing could lead to a potential worsening of comfort conditions [
15]. For example, the reduction of the average winter indoor air temperature could result in condensation phenomena and mold. In the same research paper, the authors also point out that providing end-users with information about their energy consumption is more effective when people live in relatively energy-efficient dwellings, but is less useful for users living in public housing.
Rating the performances of energy devices and benchmarking energy consumption is a highly debated topic, as they could represent effective tools to help users in managing their energy costs. In an interesting guidance on energy consumption benchmarks on residential customers of the Australian Energy Regulator [
16], indications about displaying the most appropriate electricity consumption benchmarks are given. In the same document, it is suggested that benchmarks tailored on household size, climatic zone, type of heating system, seasonal factors, and so on are more effective and better explain the variability of users’ energy consumption. Benchmarking methodologies can be classified in four different categories [
17,
18]: (i) regression model-based, requiring extensive data sets of buildings having similar characteristics; (ii) points-based rating system, comparing the measured energy consumption to best practice standards; (iii) simulation model-based, in which energy consumption is modeled in the building energy simulation environment; and (iv) hierarchal and end-use metrics, in which set of performance metrics is developed for the underlying system performance data. Kavousian et al. [
19] presented a method to rank residential buildings based on their appliance energy efficiency, as the definition of a scale indicating the position within a distribution is considered to be more definitive than a comparison to a simple value. A literature review on up to date energy benchmarking methods and their performance levels is also provided in the work of [
20], where twelve methods for benchmarking building energy consumption, including six black box methods, two gray box methods, and four white box methods, are analyzed, highlighting that many methods, although simple, can still achieve satisfactory performance. In the work of [
18], research projects, tools, and programs focused on energy benchmarking methods, energy rating procedures, and classification schemes for the building sector are also reviewed and discussed.
Moreover, these technologies may also result in a series of issues related to the access to confidential information on users’ activities and habits, privacy, confidentiality, and availability of data (also considering the greater quantity and vulnerability of data). This is for authorized parties (e.g., utility companies, metering companies); unauthorized parties (e.g., competitors, thieves, real estate owners); and, finally, for final users who are often unable to access and use their own data. In addition, the remote billing brings up problems related to data security and integrity (e.g., the risk of deletion/modification of information). Different privacy preservation techniques may be based on information theory, multiple source energy engineering, and cryptographic network protocols.
It is thus clear that, to achieve energy saving through more frequent and detailed information to the user via individual metering devices and smart technologies, a strategic feedback design is needed.
In this framework, the paper is aimed at addressing the problem of measuring, processing, and transmitting energy consumption data to final users through a suitably designed feedback strategy, without the intention of investigating deeper the social/behavioral causes underlying the eventual energy consumption variation. The development of tailored benchmark indicators applicable to metering and sub-metering in residential buildings is designed and proposed with the aim of making the information about energy consumption to the user more understandable. Three case-studies for thermal and electrical energy are presented and discussed. Finally, the communication strategy about energy consumption in terms of temporal, spatial, and typological aggregation is evaluated.
2. Architecture and Data Transmission
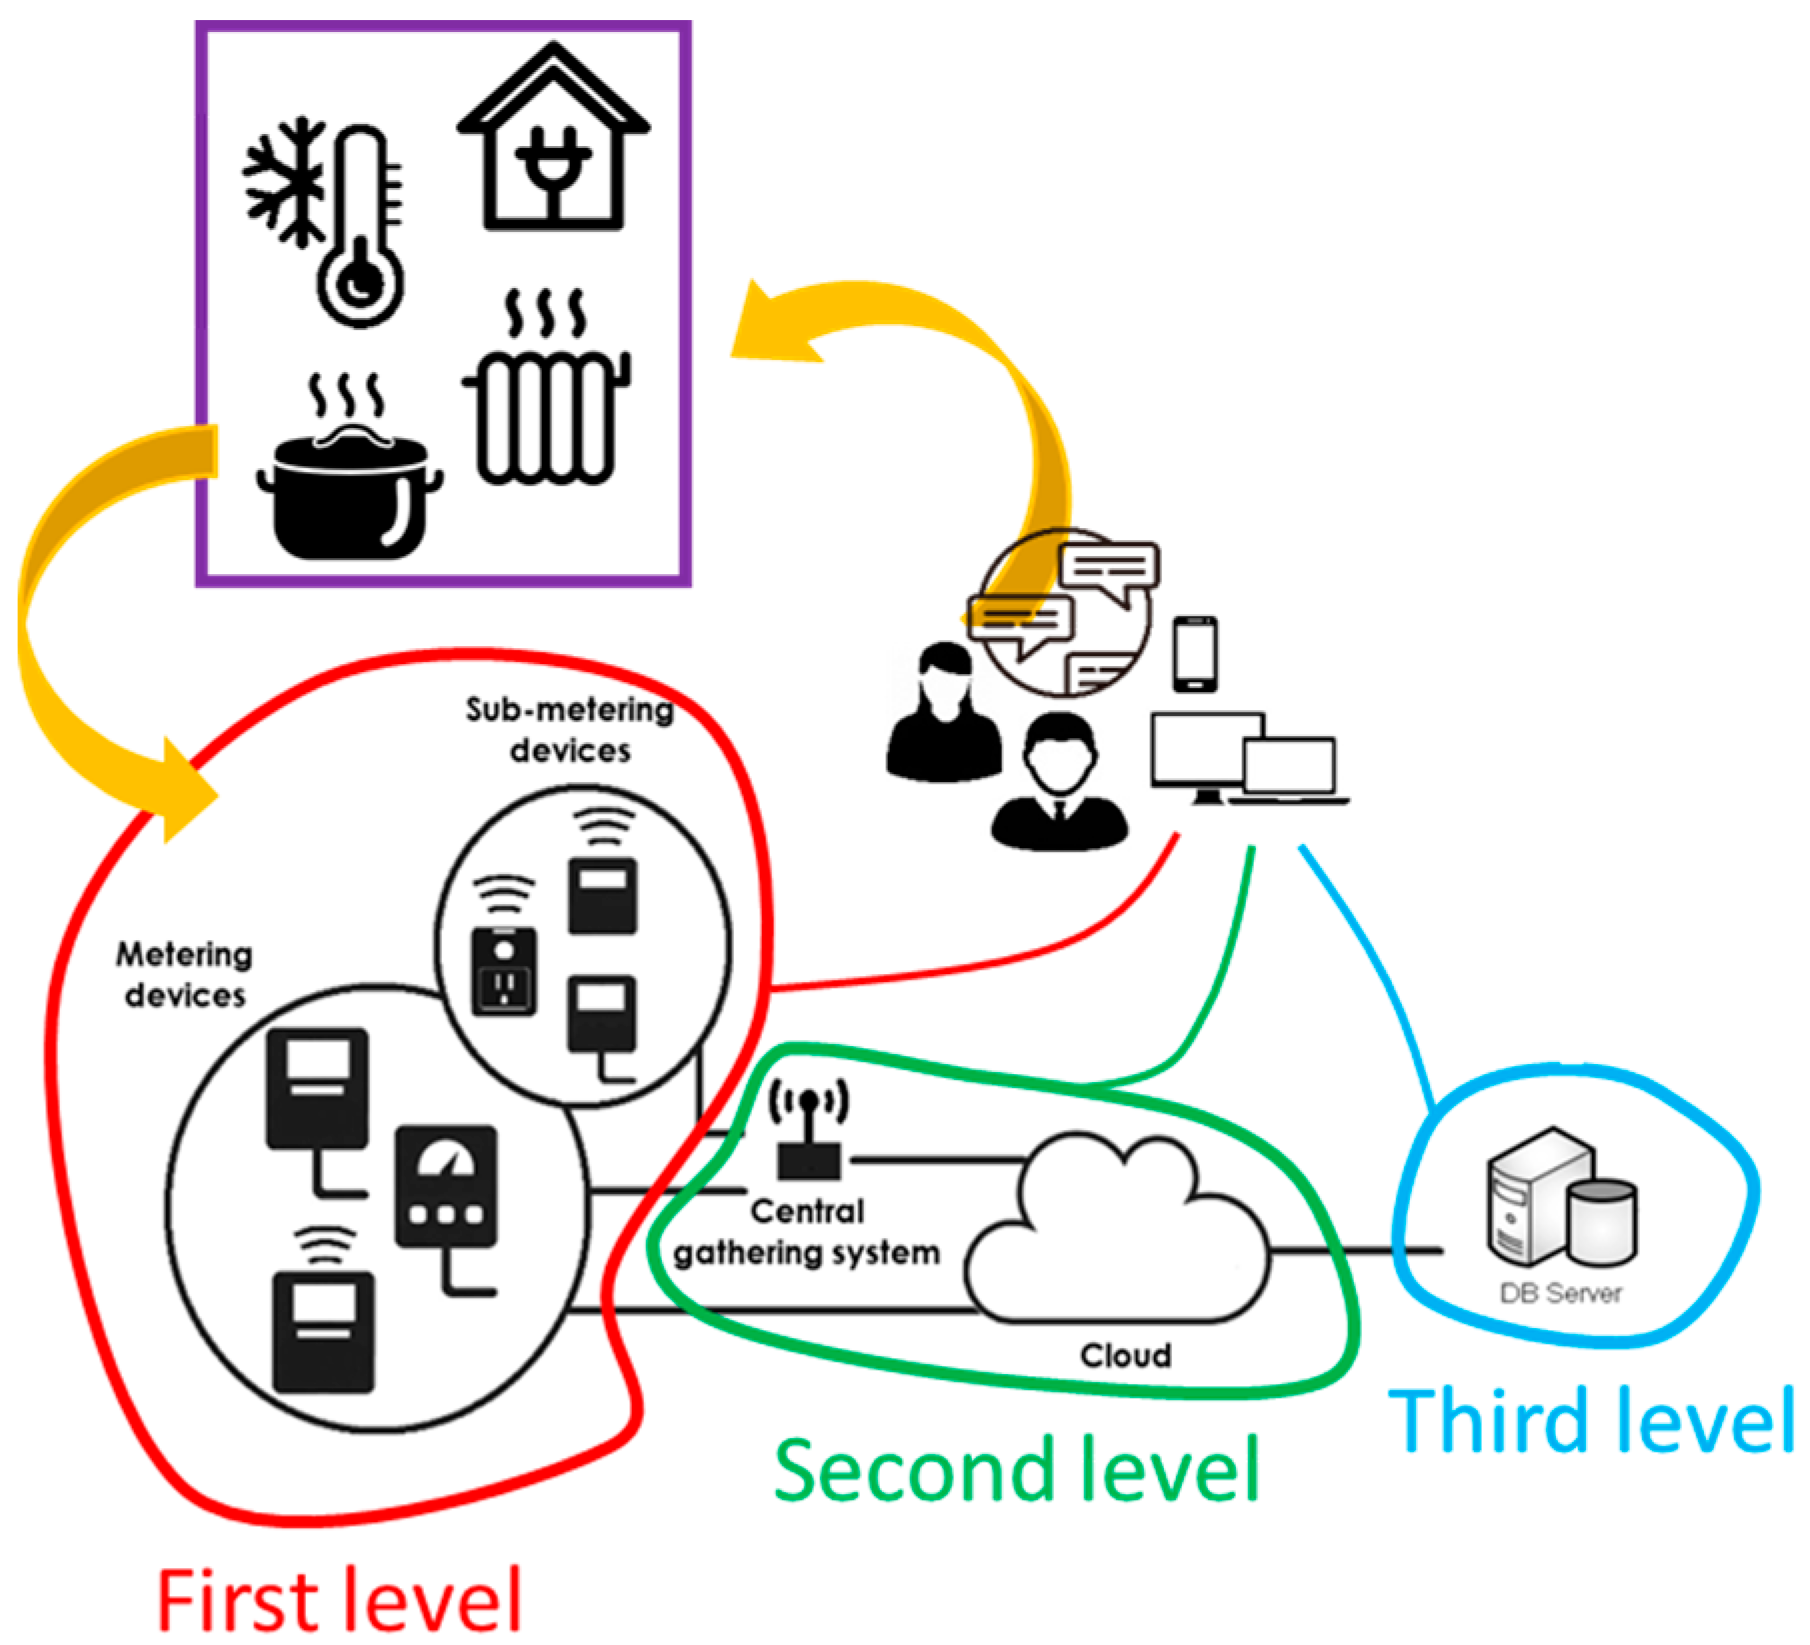
The integrated Internet of Things (IoT) tool developed by the authors is based on three levels. The first level is represented by metering and sub-metering systems for gathering energy consumption data of electrical, thermal, and natural gas devices (nodes) of the relative plants. The second level is the data concentration by wireless personal area networks (ZigBee protocol) and remote transmission data with the home router connected to the Internet. Smart meters may also directly communicate with the cloud. The third level is the web-based data management providing parallel solutions for data entry, storage, analysis, and processing. In particular, in this latter level, data for user feedback are processed by creating reports (e.g., indirect feedback), as well as real-time displaying via dashboard (e.g., direct feedback). Therefore, the IoT tool combines and stores information and data, as follows:
the measurement module, which collects data from different sources (electric, thermal, and gas energy consumption and production);
the configuration module, which collects data from the different sources (i.e., energy prices, weather data, and end-users’ behavior);
Figure 1 shows a simplified sketch of the developed IoT integrated tool.
In the following, for the sake of completeness, the metering and sub-metering systems generally employed in measuring energy consumptions within residential houses and buildings are further detailed.
Level 1: Smart Metering and Sub-Metering Systems
As well known, residential buildings are supplied by several energy carriers and their technical plants provide the energy necessary for the fundamental activities performed. For simplicity reasons, for classification of smart metering and sub-metering devices, the authors will refer to the “typical” (i.e., more widespread) configuration of technical plants supplying residential buildings in Italy [
21,
22]:
- (i)
heating system, consisting of a centralized or autonomous boiler supplied by natural gas for the production of hot water and of heating, through a hydronic system with radiators/fan coils emitters;
- (ii)
electrical system, for the electricity consumed inside the apartment by all the installed electrical appliances and devices and lighting systems;
- (iii)
natural gas system, supplying the main boiler and the cooking appliances.
Following the above-described classification, metering and sub-metering of the heating system allow the control and monitoring of energy consumption of heating and domestic hot water [
23,
24,
25,
26,
27,
28]. At the metering level, the smart direct thermal energy meter directly measures the consumptions of the boiler for heating and hot water production services at the building level. On the sub-metering level, the energy consumed by each apartment could be allocated through (smaller) thermal energy meters in the case of ring configuration of the plant. Otherwise, consumptions of single radiators, fan coils, or generic heating elements, when a vertical raising main configuration of the plant is present, are estimated through the so-called indirect accounting devices, such as two-sensors electronic heat cost allocators or insertion time counters. Additionally, the sub-metering of domestic hot water can be performed through a direct thermal energy meter or, alternatively, through a water meter suitable for hot water measurements.
Referring to the electrical system, different measuring devices are available at the metering level: smart electric energy meters, generally made up of a static type sensor with an associated processing system, are employed for fiscal purposes (i.e., metering and billing), but smart non-fiscal devices for monitoring current flows via the electric system phase are also available on the market. Electricity sub-metering multifunction devices also allow to monitor and control energy consumption of single appliances (e.g., refrigerator, dishwasher, oven, hairdryer) and they are often associated with the so-called smart plugs.
The natural gas system generally supplies natural gas for cooking purposes as well as to the main autonomous boiler for heating and, in some cases, the production of domestic hot water. Gas smart meters can be employed to measure the total gas volumes supplied to the house/building at the metering level. In this case, the meter is associated with temperature and pressure sensors, whose signals are processed by an electronic calculation module. On the market, "hybrid" smart gas meters equipped with electronic correction/transmission modules and static ultrasonic or thermal mass are also available. For sub-metering functions (e.g., cooking), small domestic gas meter can be used (e.g., class G2.5), but optimal operational conditions should be adequately considered, as the measured flow rates are often very low.
Table 1 shows the technical specifications of the metering and sub-metering systems used by the authors in the case studies.
In this research project, basic information about indoor air temperature measurements in one or more zones of the apartments was also given. The aim was to allow the end-user to know in which way his energy saving behaviors were affecting, positively or negatively, the indoor air temperature, which was chosen in the present experimental campaign as a simple parameter that the end-user could directly relate to his perceived thermal comfort. In this way, the user could assess if eventual changes in his behavior toward energy savings (i.e., the closure of one or more radiators, no or excessive ventilation [
29]) could be related to low indoor temperatures (e.g., below 18 °C), which represents an undesirable consequence to be avoided.
3. Methods
3.1. The Buildings Case-Studies
For the experimentation of feedback strategies on the consumption of thermal energy for heating, an experimental campaign is currently underway in two social housing buildings belonging to the Italian Territorial Agency for Social Housing (ATER), served by a centralized natural gas system and in a detached house all located in the district of Frosinone (Central Italy). The social housing buildings (building #1 and building #2), both built in the 1970s, have very low energy performance and would require relevant energy retrofit intervention, both to improve the insulation of the building envelope and to increase the efficiency of the heating plant. End-users are mostly low income and elderly, mainly living in single- or two-family units, with limited ability to interact with automation systems, and can be considered a representative sample of the typical Italian social housing user. Buildings #1 and #2 are almost identical in terms of constructive characteristics, inhabitants, floor areas, plan scheme, and heating system; the only exception is that one of the buildings consists of eight dwellings while the other has nine.
In each building, a thermal energy meter for the direct measurement of the thermal energy produced by the boiler (metering level) and two different indirect heat metering systems were installed (submetering level): (i) insertion time counters compensated with fluid temperature and thermostatic electronic valves controlled by programmable thermostat (building #1); (ii) two-sensor electronic heat cost allocators, mechanical thermostatic valves, and a programmable thermostat (building #2).
With regards to electrical energy consumption, an experimental campaign is currently underway in a detached house (building #3) located in the district of Frosinone (Central Italy) built in the first decade of the 2000s and inhabited by a family of four people. The house is a two-floor detached building, divided into two apartments, of which only one is actually inhabited by the family, but both are served by the main electrical energy meter with a maximum power installed of 4.5 kW. A current clamp meter was installed on the main power line of the sole inhabited apartment (metering level) in the fuse box of the house, whereas on the sub-metering level, two different devices were installed: (i) current clamp meter on the main light’s powerline in the fuse box of the house; (ii) smart plugs on the more energy consuming electrical appliances.
In
Figure 2 and
Figure 3, only two of the investigated buildings are depicted, as buildings #1 and #2 are almost identical.
Specific survey questionnaires were administrated to the inhabitants of the buildings, to assess user’s attitude to adopt energy saving strategies and to interact with monitoring and control systems. In the survey, the user could assign a vote to seven statements, attributing a grade from 1 (not at all in agreement) to 10 (fully agreed), based on their level of concordance with the statement. For each question, there was also the option “I don’t know”. Each user was also given the opportunity to express general considerations in a special note field. The questions given to families are listed below:
Overall, I feel satisfied with the installation of thermostatic valves and sub-metering devices in my apartment;
I do often adjust the temperature using the chrono thermostat;
During periods of absence from the apartment, I set the thermostat temperature to minimum to save energy;
I think the installation of thermostatic valves and sub-metering devices in my apartment is helping me save on my gas bill;
The temperature in my apartment is often too high and I am forced to open the windows;
The temperature in my apartment is often too low;
I use alternative systems to heat my apartment (for example, electric heaters and gas stoves).
A number of 18 family members (i.e., one for each of the families taking part to the experimental campaign) took part to the survey, namely, eight from building #1, nine from building #2, and one for building #3. In
Figure 4, information about the composition of the investigated sample of families is given, for a calculated average number of family members of 2.6 people per dwelling (close to the national average of 2.4 [
21,
22]). Questionnaires were provided at the end of the first heating season following the installation of the metering and temperature control devices. Authors required answers from the householders (i.e., the person or the people managing the house).
3.2. Designing Information Strategies
Effective strategies for improving end-users’ awareness in "smart homes" are influenced by numerous aspects, such as the following [
30]: (i) the quality of the perceived interaction (e.g., speed, brevity/easiness); (ii) information efficiency (e.g., accuracy and completeness); (iii) usability (e.g., ease of use, intuitiveness, user satisfaction); (iv) the aesthetics; (v) the usefulness (e.g., offered functions); and (vi) acceptability (e.g., low cost, number of potential users). The feedback of monitored data should reach end-users over time and the most adequate way to allow the full understanding of the phenomenon, before it is irreversible or no longer visible, linking it to specific retrofit actions [
31]. To identify the most effective feedback, the authors analyzed the features shown in
Table 2.
In the technical practice, the simplicity and/or cost of information system is sometimes favored, while in others, the completeness and/or the effectiveness of the information is favored. The different types of feedback can have very different costs and customer satisfaction levels, but a crucial issue should be the awareness and immediacy of information to lead users at performing higher energy savings. A unanimous judgment of end-users is the greater appreciation of a detailed, frequent, and actual feedback. Therefore, authors decided to differentiate between direct and indirect feedback: (i) by using frequent, synthetic, and immediate information in the case of direct feedback; (ii) by providing detailed and disaggregated information for each consumption area (i.e., bedrooms, living, bathroom, kitchen), for each energy carrier (i.e., thermal energy, electrical and natural gas), and for the device/system in the case of indirect feedback.
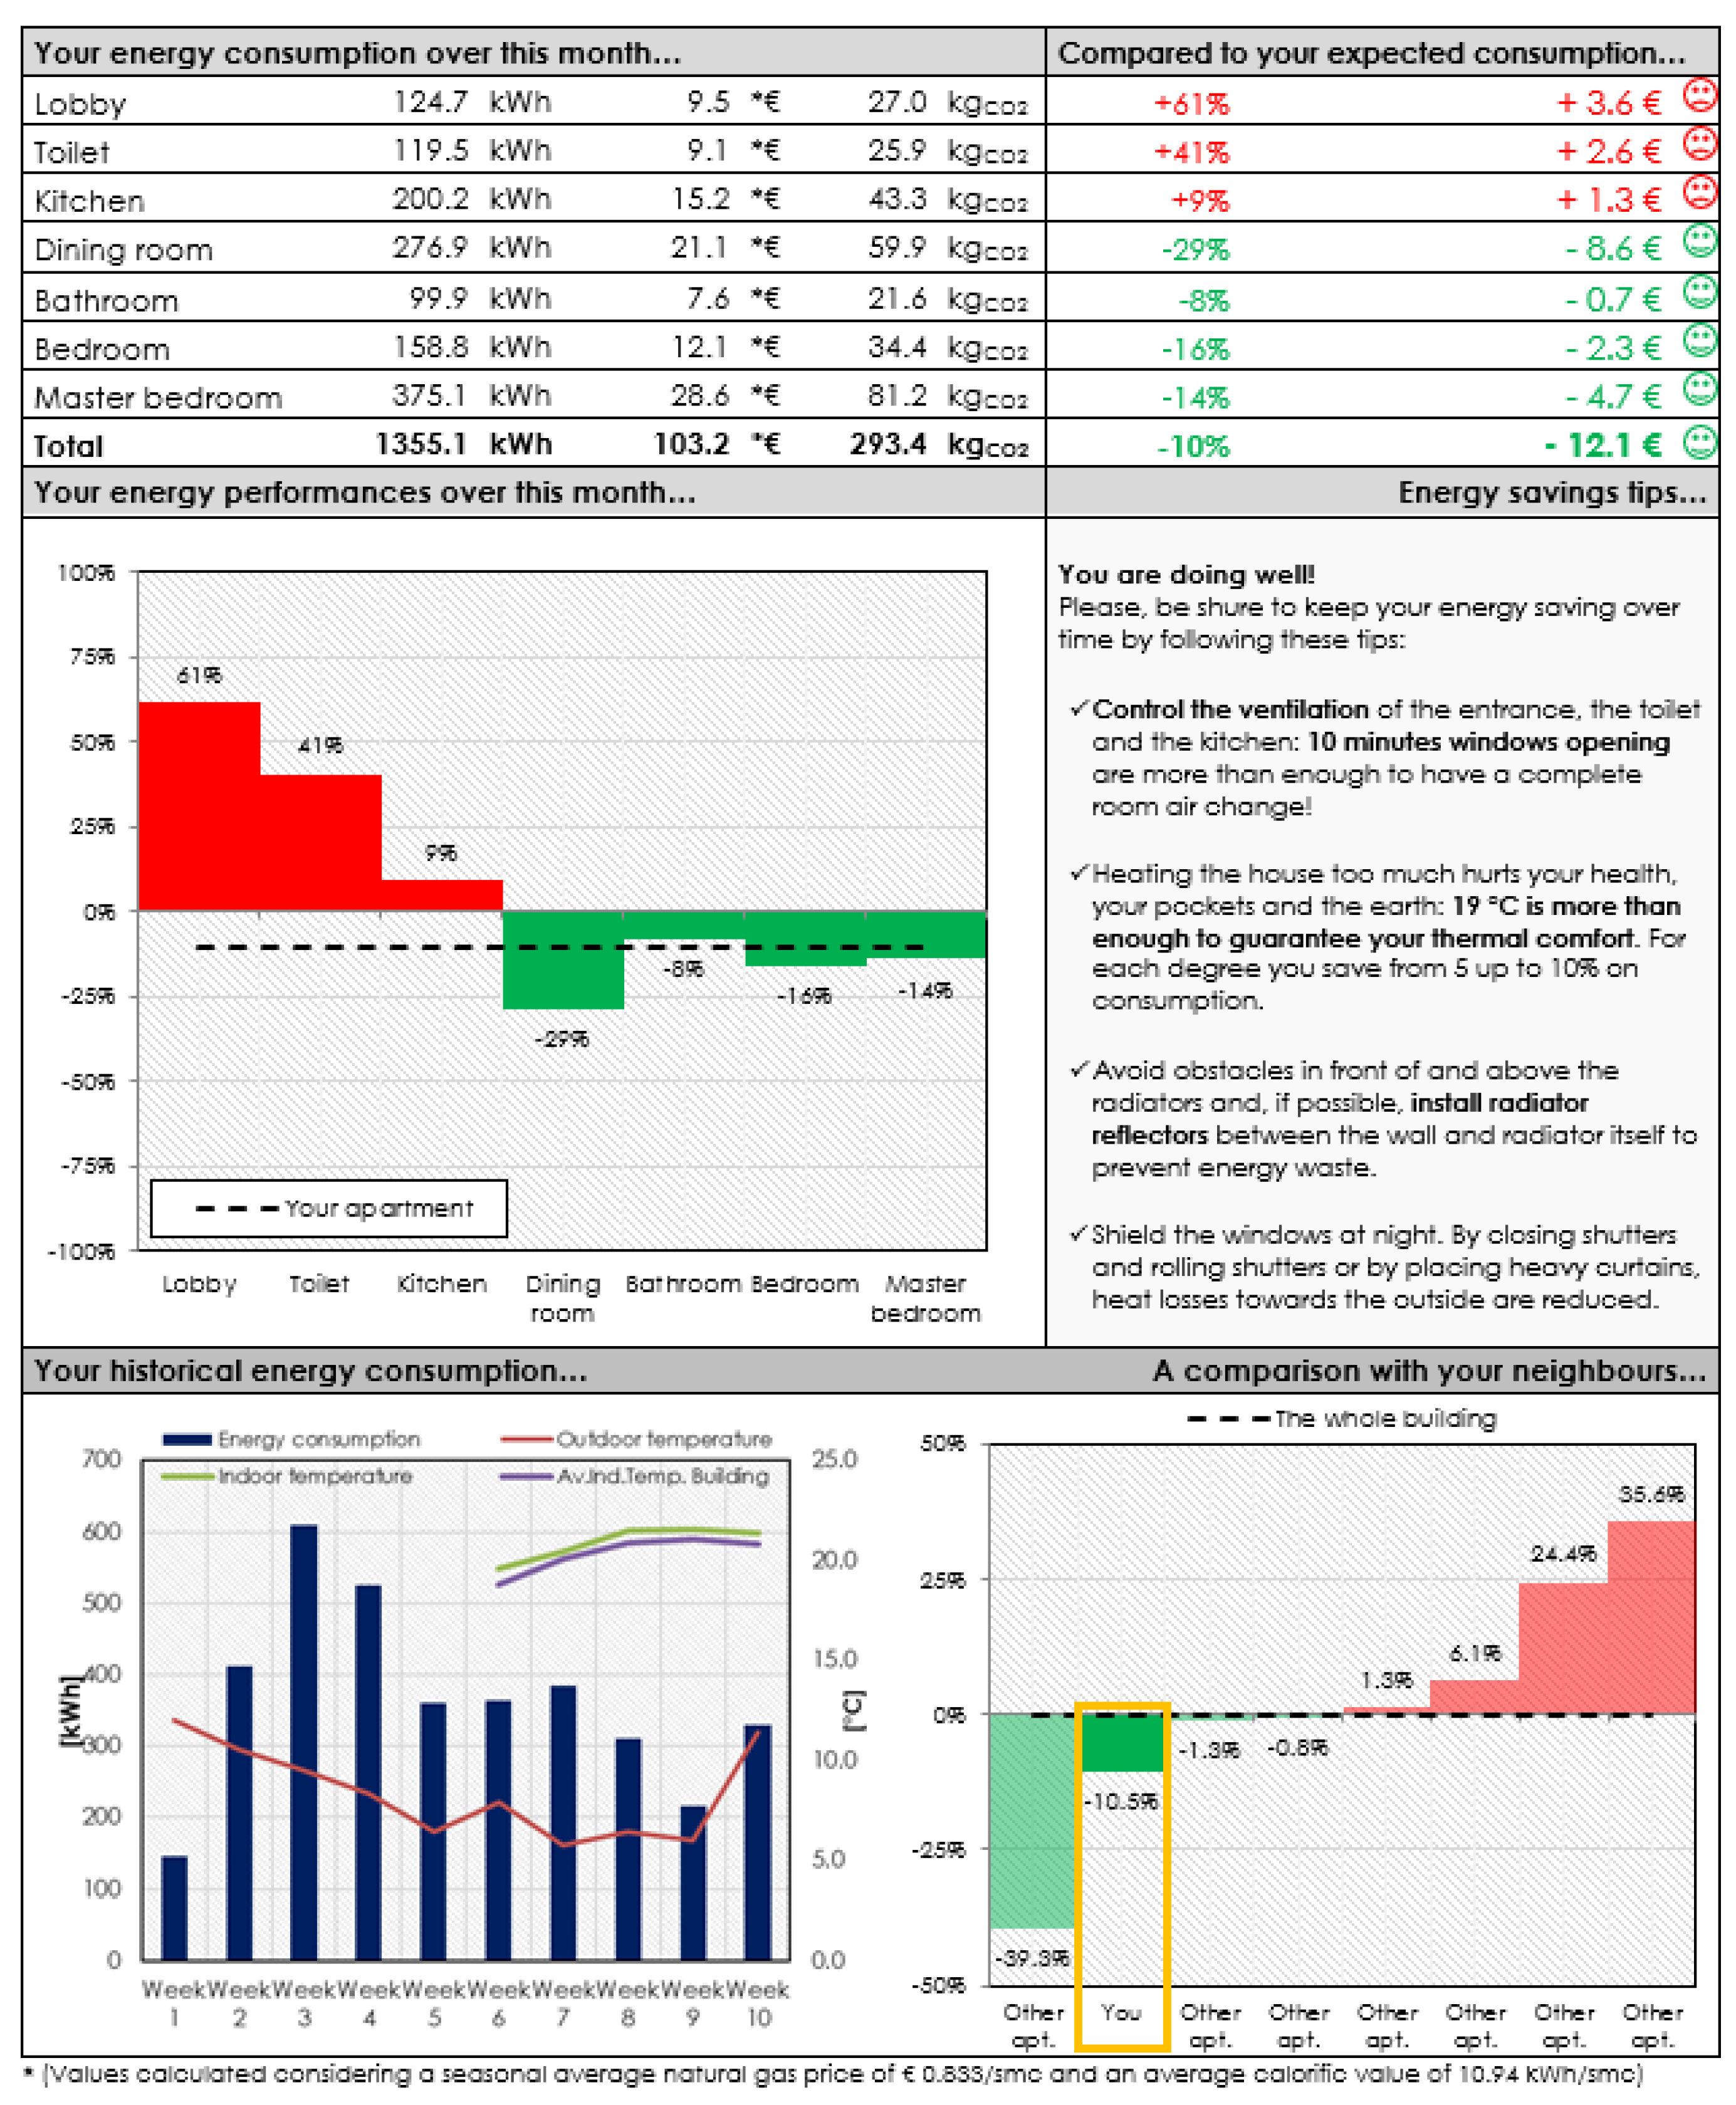
Other aspects positively evaluated in the technical literature are the diagnosis of faults and malfunctions, the comparison with historical consumption, simplicity, and effectiveness in understanding user information. Therefore, for indirect feedback and for each consumption area, the authors presented the following: (i) historical consumption benchmark, (ii) benchmark with average consumption of other users (building average), and (iii) theoretical expected consumption obtained on the basis of the specific characteristics of the user (e.g., characteristics of energy systems, type of user) and of climate data. To enhance the communication effectiveness, pie charts (for allocation) and bar charts (for comparisons with previous periods and with other users) were prepared.
Benchmarking Indices and Energy Saving Tips
Suitable tailored benchmarking indices were built by the authors as the ratio between the measured and the expected energy consumption of the room/appliance, as per Equation (1).
In the following, the benchmarks designed for the case studies (i.e., heating and electricity services) are presented and discussed separately, owing to the corresponding peculiarities.
In the heating service case studies (buildings #1 and #2), the performance benchmarks were calculated as the ratio between the energy consumption measured at actual conditions of use (i.e., operational rating) and the estimated primary energy consumption adjusted to the actual conditions of use and climate (i.e., tailored rating), for each room, apartment, and the whole building [
32].
A different approach was adopted for the electricity case study (building #3). In fact, it is well known that energy consumption of an appliance strongly depends on its use, which, in turn, relies on the number of family components, characteristics of the house (e.g., floor area and outdoor spaces), and on the end-user (e.g., income, work, age, presence of children and/or elderly people). These characteristics are then employed to build reference baseline values within certain descriptive distributions and adopted for benchmarking purposes. On the other hand, the benchmarking methodology proposed by the authors in this paper is based on a simplified hybrid approach. The expected electricity consumption is built with a “bottom-up” approach considering each electrical appliance installed in the house. Basic information is collected from the technical booklet of the appliances (i.e., energy consumption for cycle/energy labels/power) and then used to calculate the expected consumption through statistical data on the use of household appliances. In fact, for the purposes of the present research, it was necessary to use a simple representative indicator for the expected energy consumption of each electrical appliance. In this way, the methodology could be simply implemented in an IoT application for energy monitoring. To this aim, it was decided to consider the number of family components as the most representative parameter for the estimation of the expected energy consumption of electrical devices. This hypothesis, although introducing a certain level of simplification (e.g., for the calculation of consumption for lighting), is considered to be reliable for the calculation of the expected consumption of large electrical appliances, as the number of family members directly impacts their frequency of use. In this context, in order to determine the expected energy consumption of each electrical appliance, the authors made a preliminary analysis of statistical data about electrical energy use from the Italian National Institute of Statistics (ISTAT) and Italian National Agency for New Technologies, Energy, and Sustainable Economic Development (ENEA). In particular, regarding the Italian energy consumption, ISTAT provides statistical data about the following: (i) number of cycles per week for given electrical appliances for different numbers of family components; (ii) lights turn-on period; and (iii) expected expenditure for different numbers of family components.
In particular,
Figure 5 shows the data about dishwasher and washing machine usage per week and the trend of the expenditure for electrical energy of different family sizes.
Suitable usage coefficients were calculated by normalizing all the statistical data about energy use/expenditure with respect to reference number of family components (i.e., 2.4 for Italy [
21,
22]). This means that, for example, the expenditure coefficient for a family of four components was determined by dividing the expected statistical expenditure (estimated to be about 1908 €) for the expenditure expected for a family with 2.4 family components (i.e., about 1706 €). Usage coefficients were employed as a base to calculate, for each electrical appliance, the expected time of use (expressed in hours) in the reference period (year). The expected energy consumption is then built either per Equation (2) or per Equation (3), depending on the type of appliance and on the data available in the technical booklet.
where
is the number of weekly cycles of the given electrical appliance (calculated as a function of the usage coefficient [
21,
22]),
is the electrical energy consumption per cycle of the appliance declared by the manufacturer and retrievable in the technical booklet (expressed in kWh/cycle),
UC is the usage coefficient of the appliance,
is the expected weekly hours of use of the appliance, and
is the declared power of the appliance expressed in kW. Note that the use of Equation (2) was applied to all of the electrical appliances whose energy consumption per cycle was given in the technical booklet (e.g., dishwasher, washing machine, dryer), while Equation (3) was employed for all the other appliances. Number cycles/functioning hours per week were determined as the weighted average of the statistical data given in the work of [
21,
22] or, in the case in which data were not available, by making suitable assumptions.
In this context, the baseline values (i.e., expected consumption) employed to calculate the benchmarking indicators will be updated as soon as a change is made in electrical devices (i.e., replacement of an appliance with a new one, replacement of light bulbs), in the insulation of the building, or if the number of family components changes at some point.
For the present analysis, the tips presented in the indirect feedback were selected from a set of suggestions expressly provided by the ENEA as part of the dissemination actions about energy efficiency in residential buildings [
33]. The set of selected tips is general advice targeting the correct management of each heating, cooling, lighting, and electrical systems, and was given when the measured consumption of each room/appliance was found to be higher with respect to the expected one (i.e., calculated energy consumption).
Finally, two new direct and indirect feedback strategies were adopted by the authors based on the following aspects: (i) the results of the survey; (ii) the personal interaction between the authors and the participants of the experimental campaign, which occurred during the informative meetings; (iii) the characteristics of the installed energy systems and measuring devices; and (iv) the analysis of existing scientific literature regarding the best practices in feedback about energy consumption.
5. Conclusions
In this work, the authors presented the first results of a study aimed at designing a proper feedback strategy for IoT energy consumption monitoring systems, so as to increase user awareness on energy consumption. In this framework, two case studies were presented and discussed related to heating and electrical energy consumption monitoring in residential buildings and specific tailored benchmarks indices were developed to present energy consumption data at the sub-metering level. To this aim, frequent informative meetings were carried out with a total of 18 end-users in three different buildings.
The direct interaction between the authors and the end users over the campaign, together with the provision of simple questionnaires, showed that the huge amount of measured data and the complexity of the monitored systems make analysis and feedback particularly complex for non-skilled users. Compatibly with the scientific literature, most of the users were not able to understand the measuring units expressed in kWh (or similar), while they showed particular interest in the consumption data expressed in euro and in percentage.
The design and the content of the designed feedback strategy was greatly appreciated by the final users, whose attention on the desired information was captured through simple information (e.g., different colors and emoticons). Owing to the characteristics of the sample of users (mostly elderly people with limited ability to manage technical information), these last favored the simplicity and immediacy of information, which has been given in the following form:
- (i)
direct feedback, made up of a simple multi-scale energy dashboard giving information on both the total energy consumption of the house (metering level) and the share of consumption of each room/appliance of the house (sub-metering level);
- (ii)
indirect feedback, represented by an informative sheet in which information was gathered in a more detailed manner by also showing the user tailored benchmark indicators on both metering and sub-metering levels.
All the users showed particular appreciation for the benchmarking indicators developed at the sub-metering level (generally not available neither in the energy bills nor in the energy monitoring systems available on the market), as this information allowed them to precisely locate the main energy consuming rooms/appliances of the house and to take specific actions in order to reduce their consumption.
Personalized suggestions were also given to specific participants whose consumption was found to be much lower than that expected, in order to make them aware that incorrect energy-saving practices, such as the closure of most radiators, can dangerously penalize the indoor air temperature, thus also affecting the perceived thermal comfort, which was not the purpose of the present campaign.
The adopted IoT technologies demonstrated high potential in terms of energy savings, as effective and frequent feedback contributes significantly to motivating and supporting change in occupant behavior. The analysis of the data showed some incorrect behavior that users were not aware of, such as excessive ventilation of some rooms (e.g., entrance, bathrooms, and kitchens), incorrect management of the thermostatic valves, and incorrect management of some domestic appliances.
It is highlighted that the benchmarking methodology developed by the authors for the purpose of the present campaign could be very useful for researchers and software developers looking for targeted strategies for energy benchmarking. Referring to benchmarking for electricity consumption, in fact, the authors proposed a simplified, detailed approach to estimate the energy consumption of a given appliance, which could be simply implemented in an IoT application for energy monitoring. In fact, this methodology requires the knowledge of the family composition and basic information about the appliance, retrievable by the technical booklet, by specific databases, or directly by the smart device.
Further progress of the present research is represented by the development, currently ongoing, of specific diagnostic routines for natural gas, electricity and heating systems that, based on the load profiles measured by the system, will allow the detection of possible faults or incorrect management, and will automatically recommend the most suitable personalized suggestion.


 ,
, 


