Article

Efficiency and Eco-Costs of Air Purifiers in Terms of Improving Microbiological Indoor Air Quality in Dwellings—A Case Study

Department of Technologies and Installations for Waste Management, Faculty of Energy and Environmental Engineering, Silesian University of Technology, 18 Konarskiego St., Gliwice 44-100, Poland
*
Author to whom correspondence should be addressed.
Atmosphere 2019, 10(12), 742; https://doi.org/10.3390/atmos10120742
Submission received: 20 October 2019 / Revised: 21 November 2019 / Accepted: 23 November 2019 / Published: 26 November 2019
(This article belongs to the Section Air Quality)

Abstract

:
Air pollution, a by-product of economic growth, generates an enormous environmental cost in Poland. The issue of healthy living spaces and indoor air quality (IAQ) is a global concern because people spend approximately 90% of their time indoors. An increasingly popular method to improve IAQ is to use air purifiers (APs). Indoor air is often polluted by bioaerosols (e.g., viruses, bacteria, fungi), which are a major concern for public health. This work presents research on culturable bacterial aerosol (CBA) samples collected from dwellings with or without active APs during the 2019 summer season. The CBA samples were collected using a six-stage Andersen cascade impactor (ACI). The CBA concentrations were expressed as Colony Forming Units (CFU) per cubic metre of air. The average concentration of CBA in dwellings when the AP was active was 450–570 CFU/m3, whereas the average concentration when the AP was not active was 920–1000 CFU/m3. IAQ, when the APs were active, was on average almost 50% better than in cases where there were no procedures to decrease the concentration of air pollutants. Moreover, the obtained results of the particle size distribution (PSD) of CBA indicate that the use of APs reduced the proportion of the respirable fraction (the particles < 3.3 µm) by about 16%. Life cycle assessment (LCA) was used to assess the ecological cost of air purification. Our conceptual approach addresses the impact of indoor air pollution on human health and estimates the ecological cost of APs and air pollution prevention policies.

1. Introduction

The application of sustainability through the measurement and comparison of experimental results is an important challenge for environmental sciences today [1]. The past few years have witnessed an accumulation of new evidence on the health effects of air pollution, the economic cost of these effects, and the costs and benefits of policy initiatives designed to combat air pollution [2].
Indoor air quality (IAQ) is one of the main factors for healthy living and wellbeing because people spend over 90% of their time in enclosed spaces [3,4,5,6,7]. Polluted indoor air is a key environmental health problem because people inhale 15,000 L of air every 24 h [8,9,10,11,12,13]. Therefore, reducing exposure to indoor air pollutants presents a particular challenge, and designing appliances for rapid and efficient indoor air purification is very important. In Poland, many homes and dwellings are equipped with air purifiers (APs). Filtration, which can simultaneously remove various air pollutants, is widely used in APs to improve IAQ [14].
Biological aerosols or bioaerosols are an important type of air pollutant. They are produced as a result of natural processes and human activities [15]. Bioaerosols are always present in the air and contain contaminant particles including microorganisms such as bacteria, microscopic fungi, viruses, and pollen [15,16,17]. The main source of airborne bacteria in enclosed spaces is human and animal organisms [3,18,19,20,21]. Additionally, microbiological indoor air pollutants may develop in heating or ventilation systems [20,22,23,24].
Bioaerosols are crucial indicators of IAQ and are risk factors for adverse health outcomes such as infectious diseases, toxic effects, allergies, and even cancer [25,26,27,28]. Monitoring of microbial IAQ is therefore necessary [25,29,30]. For several years now, occupants of polluted cities have frequently used APs in an attempt to increase their wellbeing by decreasing their exposure to air pollutants [31]. APs are a commonly used household appliance that can improve IAQ, but this process is linked with the cost of electricity and, therefore, the environmental cost should also be considered. Many studies have assessed the life cycle environmental impact of different electrical appliances and electronic products [32,33,34,35,36,37], but there is still very little information about the life cycle environmental performance of air. This research could be used to develop appropriate control strategies to minimize the adverse effects on health of biological air pollutants in living spaces and to estimate the ecological costs incurred in connection with the use of APs.
The aims of this study are: (i) To evaluate the impact of APs on microbial IAQ, (ii) to find the concentration of culturable bacterial aerosol (CBA) and particle size distribution (PSD) of CBA in two dwellings located in Upper Silesia, Poland, and (iii) to find the ecological cost of air purification using the life cycle assessment (LCA) technique. These results can be used to risk manage activities related to environmental health and provide a reference for an enhanced understanding of IAQ in developing countries. The results of this study are particularly valuable as the standards for bioaerosol levels in indoor air are currently not formally regulated in Poland.

2. Materials and Methods

2.1. Sampling Sites

The study was carried out in two living rooms at two dwellings located in a busy city (18°54′ E 50°23′ N) in Upper Silesia, Poland. Both living rooms were equipped with the same type of AP. This device was turned on for 24 h, 4 days a week, and turned off 3 days a week. The research was conducted during the summer season of 2019 to check the efficiency of the AP devices. Samples were taken twice per week between 4 p.m. and 5 p.m. The first sample was taken 4 days after the APs were turned on, and the second sample 3 days after they were turned off. Three to four sets of measurements were taken in each living room with the APs turned on and turned off. The CBA samples were collected from the centre of each room at a height of about 1.5 m to simulate aspiration from the human breathing zone. The windows were closed during the experiments. In total, 480 Petri dishes (without blanks) with microbiological material were analysed during the research.
The study was conducted in two living rooms, each with a volume of approximately 64 m3. Each living room was equipped with an AP with a capacity of 310 m3/h. The analysed APs were equipped with a PET prefilter retaining larger air pollutants, a HEPA-11 filter with an area of 2.2 m2, and an adsorption filter with active carbon (absorbing area of 57,000 m2). The assessment of effectiveness of air purification was conducted in natural and real conditions of the occupants’ stay and during their routine activities. The basic environmental parameters and a short description of the analysed dwellings are presented in Table 1.
As can be seen from Table 1, the average relative humidity was less than 50%. Poor humidification tends to favour the proliferation of respirable CBA and reduces the protection of the respiratory system [38,39].

2.2. Sampling and Analysis Methods

Measurements of the CBA concentrations were conducted using a six-stage Andersen cascade impactor (ACI), which separates biological particles based on their aerodynamic diameter: >7.0 µm (stage 1), 4.7–7.0 µm (stage 2), 3.3–4.7 µm (stage 3), 2.1–3.3 µm (stage 4), 1.1–2.1 µm (stage 5), 0.65–1.1 µm (stage 6). The air flow through the ACI was 28.3 dm3/min, and the sampling time, calculated according to Nevalainen et al. [40], was 10 min. The ACI was disinfected using 70% ethanol-immersed cotton balls between each sampling. Tryptic soy agar (TSA) was used to culture bacteria, with cycloheximide added to inhibit fungal growth. The Petri dishes were incubated for 48 h at 36 ± 1 °C. The concentration of CBA present in the air was expressed as the number of Colony Forming Units in the volume of air (CFU/m3), using positive-hole corrections.
Quality control was conducted according to PN-EN 12322 [41] and ISO 11133 [42] standards, with the same operation details as in our previous studies [22,43].
The second part of the analysis was the LCA. This methodology is based on the ISO 14040:2006 standard [44]. Environmental analysis is a relatively new and dynamically developing area of study. It is very difficult to analyse all aspects that contribute to the negative impact on the environment. We need to model the exact spread of pollution and analyse the impact on human health and the environment. LCA analyses are by far the best evaluation tool we have.

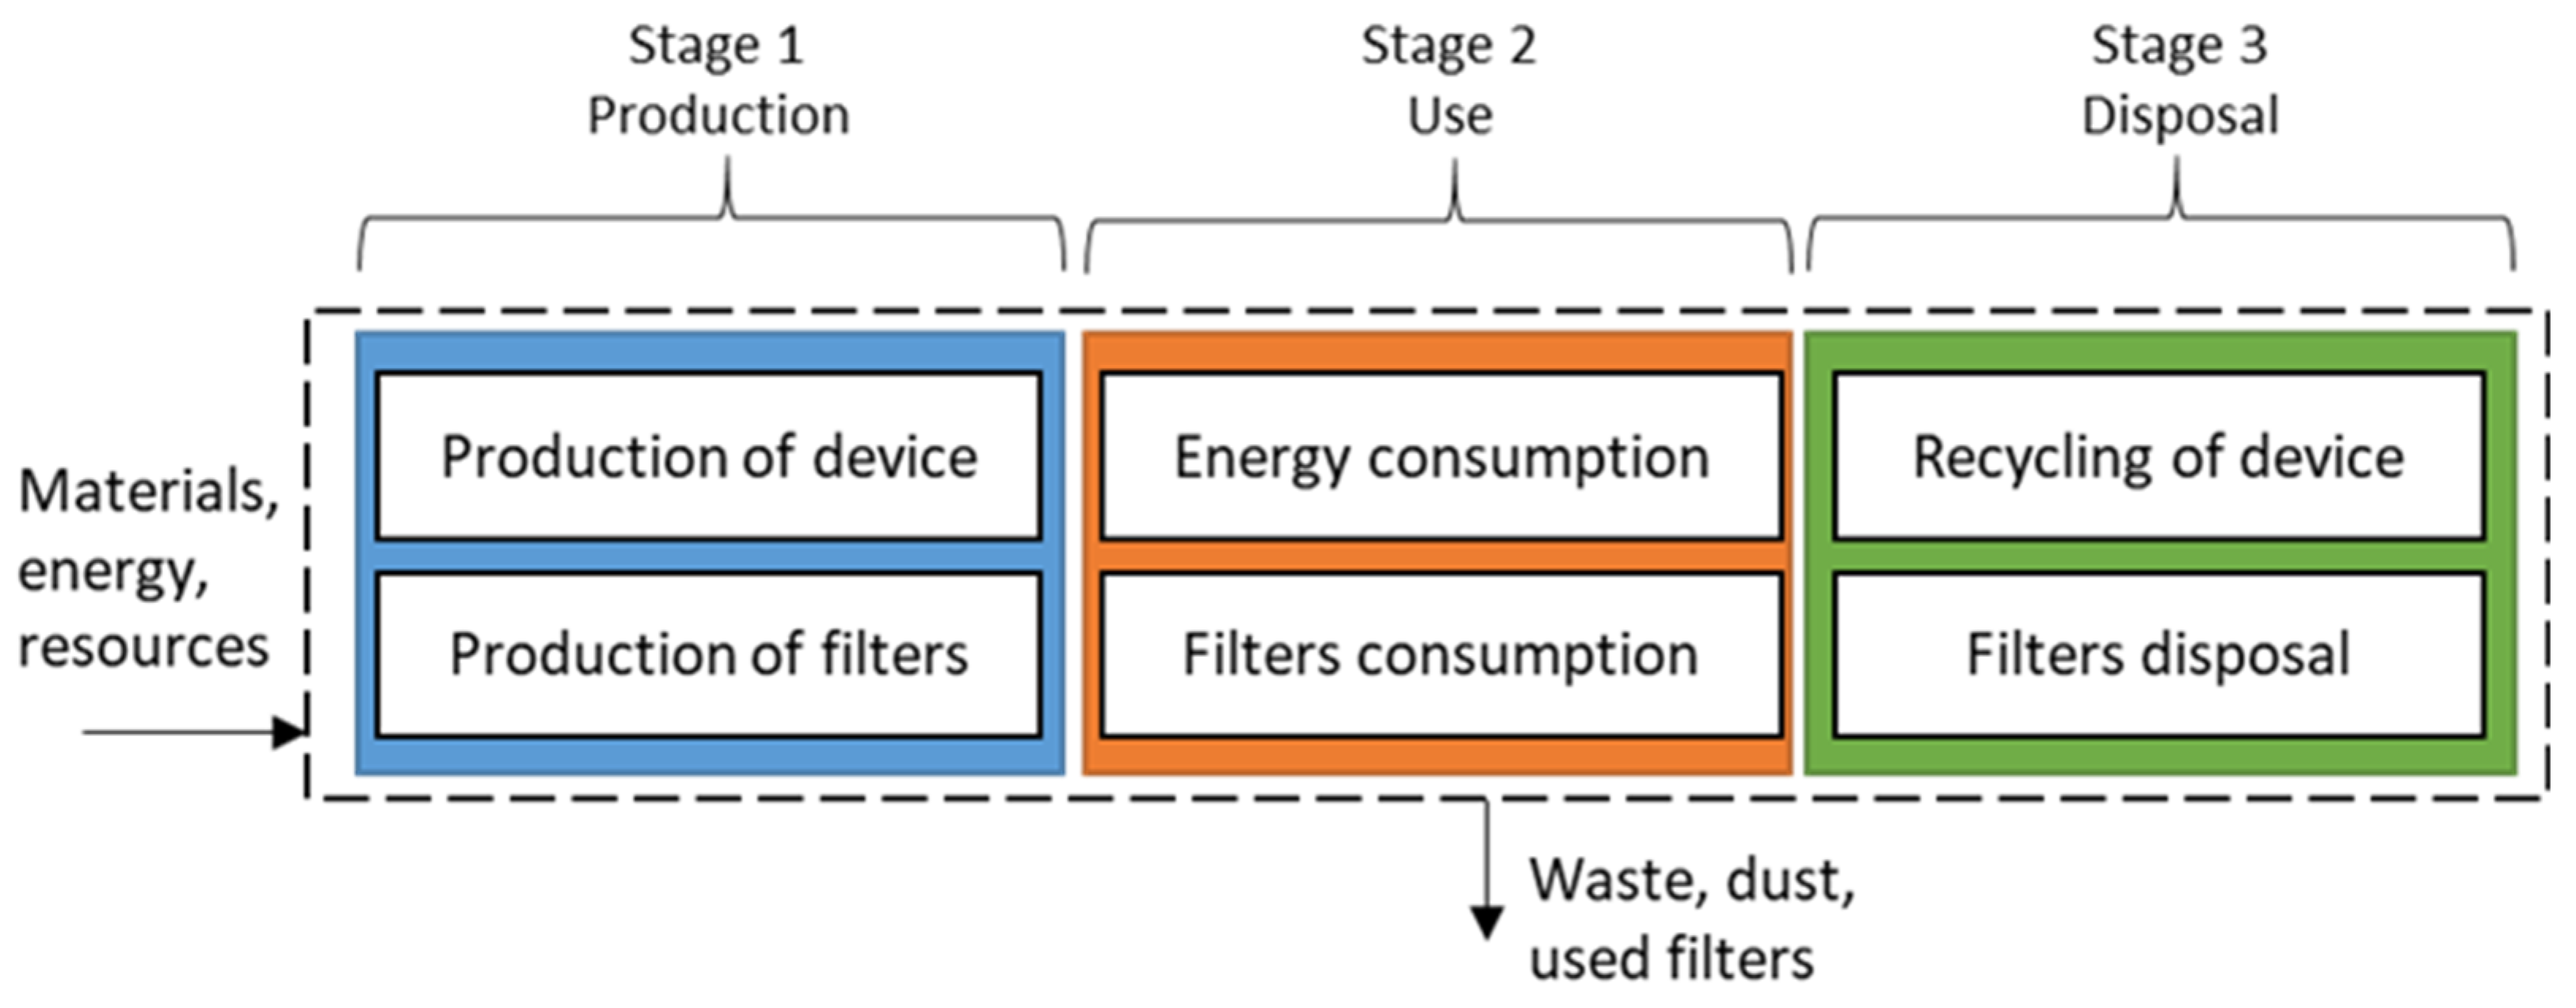
2.3. LCA Methodology

In environmental analysis, many different LCA methodologies are used. The ReCiPe was selected for the calculation in this article. The method has been given the name of ReCiPe as it provides a ‘recipe’ to calculate life cycle impact category indicators and represents the initials of the institutes that were the main contributors to this project: RIVM and Radboud University, CML, and PR Consultants [45]. This methodology aims to connect the endpoint and middle environmental analysis with the help of multiple impact categories that are divided into groups. The most important goal of ReCiPe is to convert a long list of LCI (life cycle inventory) results into a limited number of indicators. These indicators express a relative impact on the natural environment. The ReCiPe methodology defines two levels of indicators:
Eighteen midpoint indicators, the so-called midpoint;
Three final indicators, the so-called endpoint.
Each user can choose the level at which they want to have the result:
Eighteen detailed intermediary points that are relatively accurate, but difficult to interpret;
Three simple-to-understand, but more imprecise final categories:
  • human health;
  • ecosystem;
  • natural resources.
The user can choose between indicators and interpret them within a particular analysis. The advantage of this methodology is the possibility of weighting the final results and presenting one value for the whole analysis. Individual weights for given categories are implemented in the analysis software, e.g., SimaPro, on which this study is based. Weights can also be changed if there is a need to modify the significance of individual components of environmental impact categories. Weighting is the conversion of indicator values into numerical parameters by distributing a specific number of points to each category of damage. The unit of this weighting is Pt (point), which reflects the environmental impact exerted, on average, by one European over 1 year. It is calculated by dividing the total emission in Europe by the number of inhabitants. The results are also given as a percentage to visualize the impact of each of the products in the entire analysis. Each detailed impact category has its own unit.

3. Results and Discussion

3.1. The Concentration of CBA

The average concentrations of CBA collected are presented in Table 2. The highest value of CBA was found in D1 (918 CFU/m3) and D2 (1006 CFU/m3) when the AP was off. When the AP was active, the CBA value was halved, both in D1 (446 CFU/m3) and D2 (572 CFU/m3).
The meteorological parameters (average temperature and relative humidity) on the days with the AP on and on the days with the AP off do not differ significantly (Table 1). It seems that the most important source of CBA in the dwellings analysed is the presence of humans. Moreover, the higher CBA values in D2 may be associated with the presence of a pet and the floor being covered by a carpet.
In our study, average air purification efficiency is nearly 50%. These results are similar to another report on health and the efficient management of the CBA in indoor air using APs. The removal efficiency of bioaerosols in Seoul, Korea, was 41–68% for CBA [23]. Similar studies conducted in Poland indicate that the effectiveness of purifiers in kindergartens was 41% [46]. It seems that the use of an AP may be considered in cases where natural ventilation is used, but there are concerns related to indoor pollution from external sources, or if the ventilation system is not effective at removing particles.
CBA values obtained in our study when air purifiers were off are comparable to those measured in 70 residential homes in Upper Silesia, where the average CBA value was 1000 CFU/m3 [47], and in Iran, where the CBA value was 980 CFU/m3 [48]. The most important source of airborne bacteria in non-industrial indoor environments is the presence of humans [7,8]. The significantly lower concentration level of CBA was found in apartments in Korea, where the average concentration of CBA during the winter season was 280 CFU/m3 [49].
In Poland, the Expert Group for Biological Agents drafted proposals for threshold limit values in occupational and non-occupational environments. The wide range of propositions for residential buildings includes a standard limit of mesophilic bacteria at 5000 CFU/m3 [50]. In our study, the concentration levels of CBA were below the proposed standard.

3.2. The Particle Size Distribution (PSD) of CBA

Figure 1 presents the analysis of the number and aerodynamic diameter of CBA collected from different stages of the ACI in the analysed dwellings.
It can be seen that the PSD of CBA was characterized by a large share of the respirable fraction (particles < 3.3 µm). The shape of PSDs may indicate that the particles of CBA were comparatively fresh and mainly of human origin. These results indicate the potential health risk of exposure as particles of respirable size contribute to adverse symptoms in the respiratory system [51,52].
The results of the PSD of CBA indicate that the use of active APs reduced the proportion of the respirable fraction (particles less than 3.3 µm) of bacteria by about 16% in D1 and about 8% in D2.

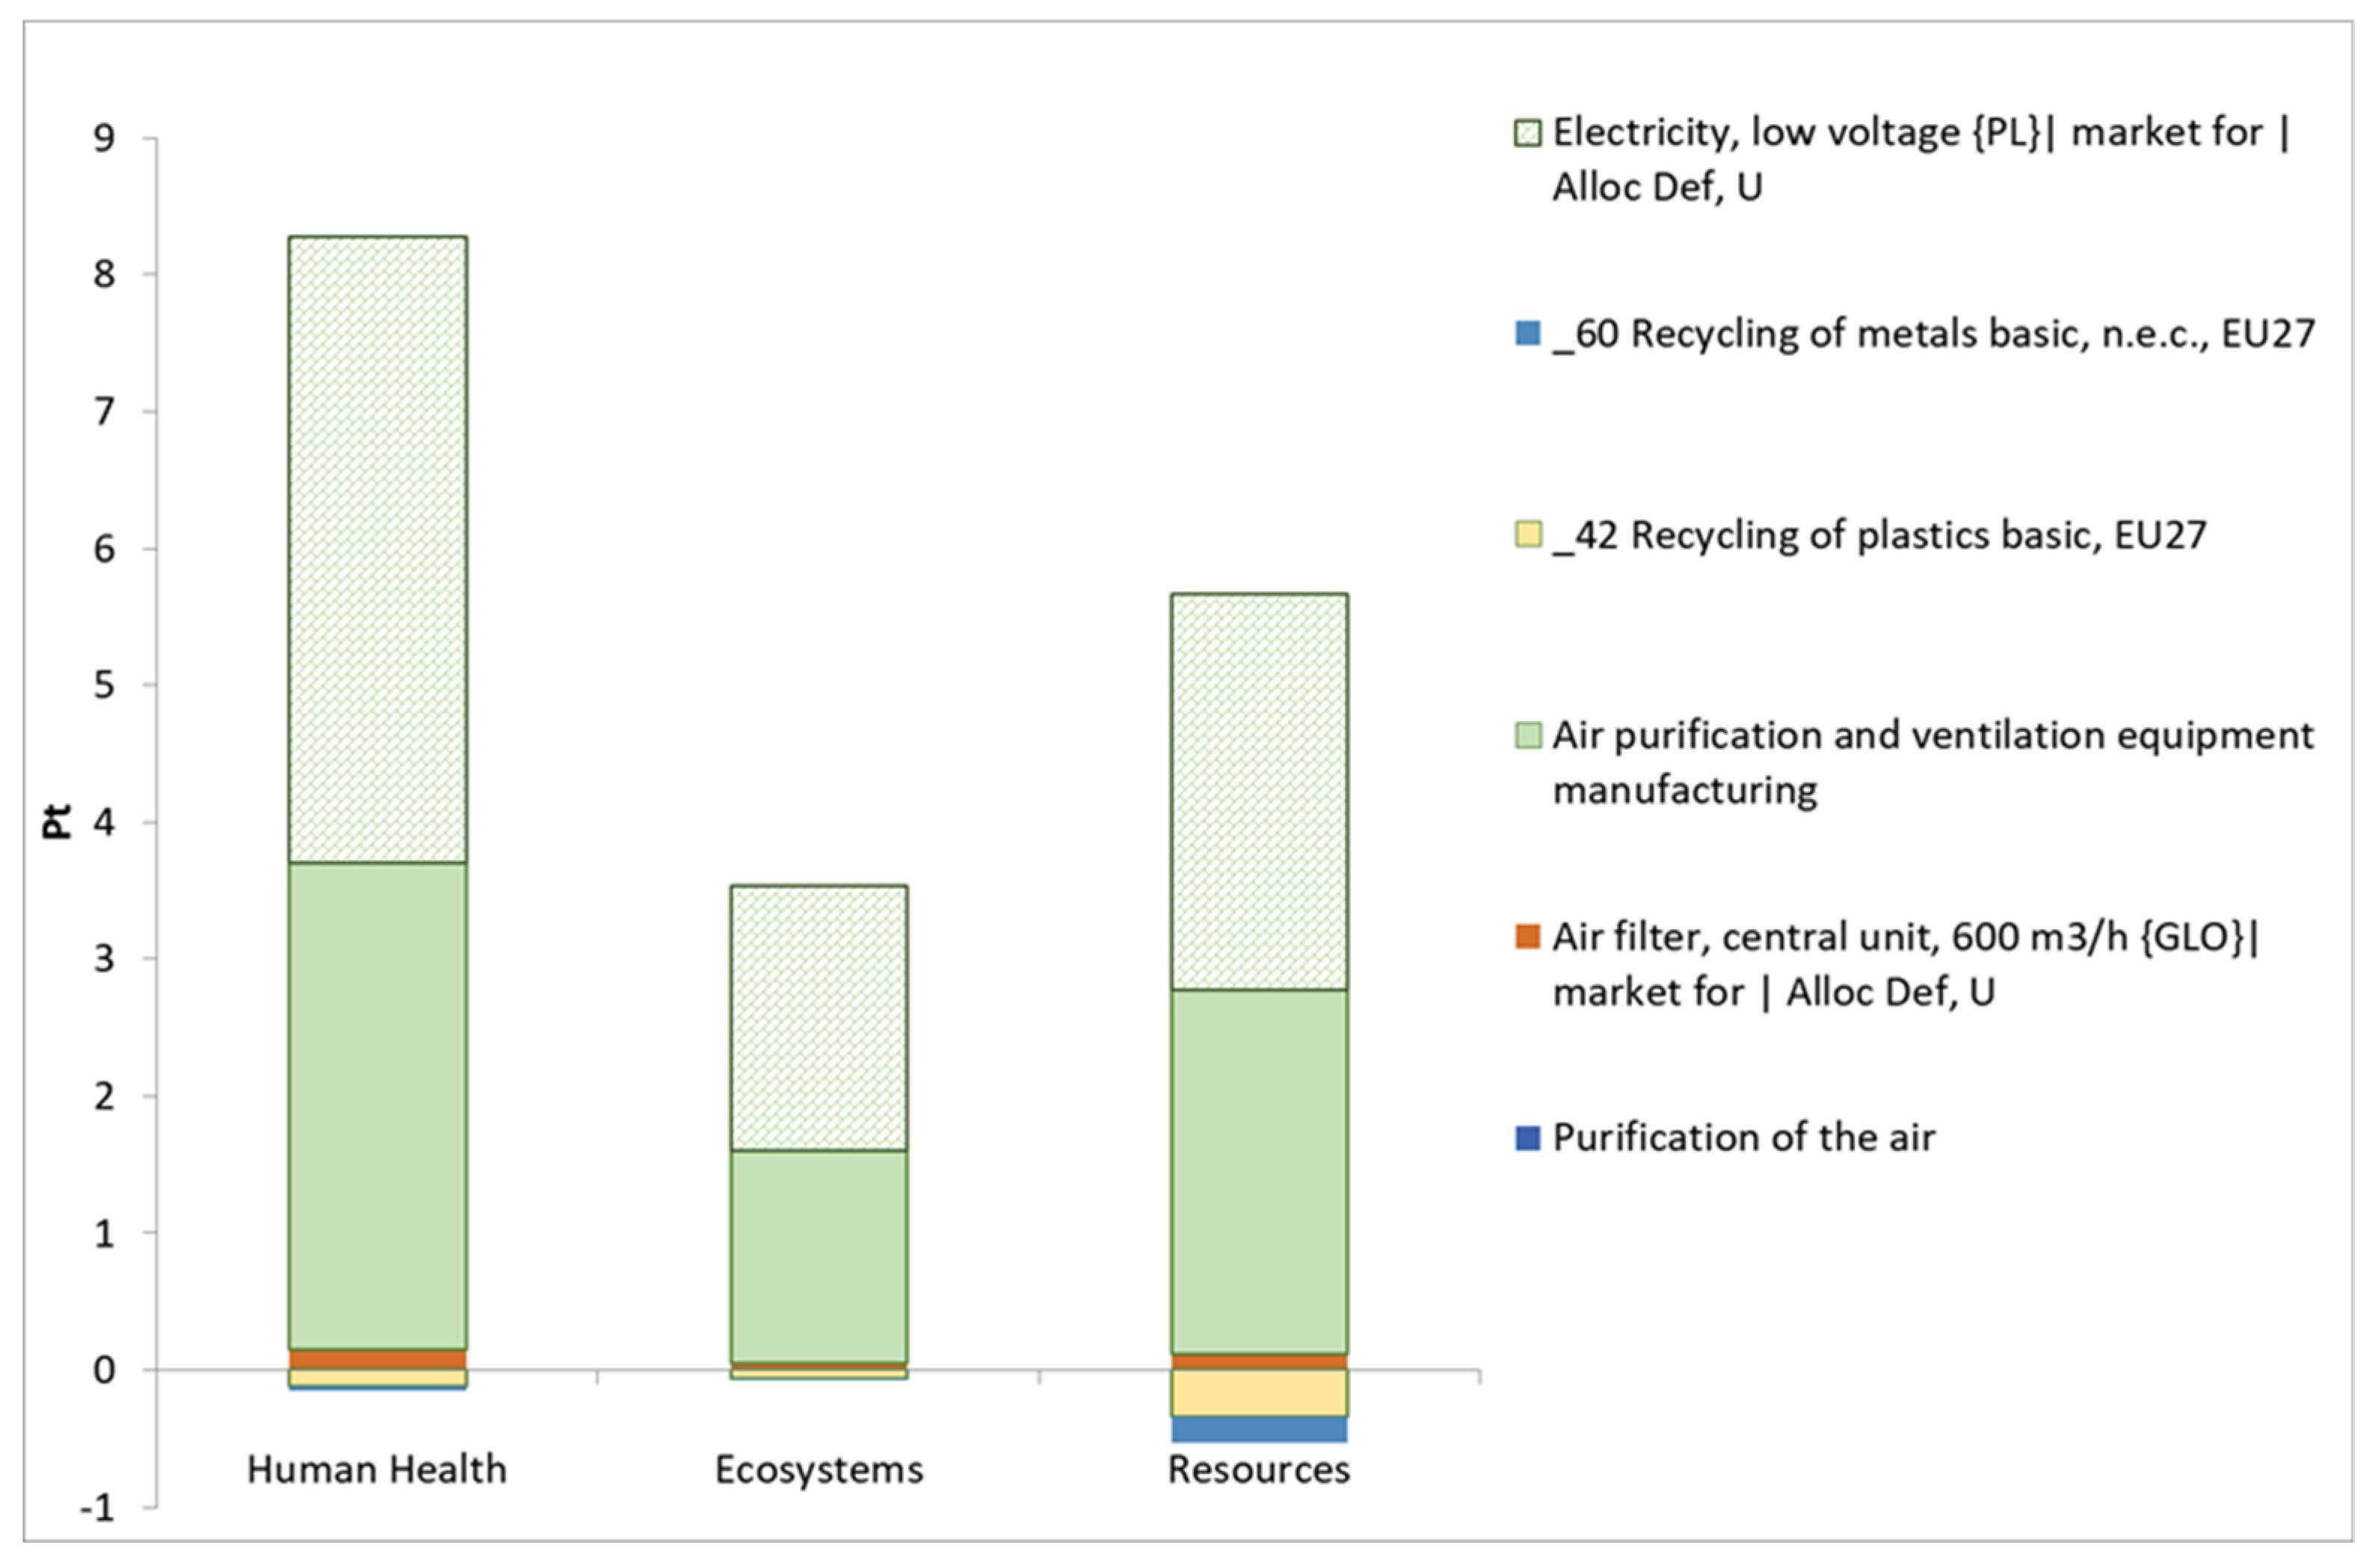
3.3. LCA—The Ecological Cost of Emission Reduction

In the case of indoor air, we have limited solutions for purification. The ecological cost of purification of indoor air was estimated using the LCA of the cleaner device. The efficiency of such cleaning devices is expected to be close to 99% for the main pollutions. In order to achieve this cleaning percentage and effectively asses the process, a life cycle assessment should be made. The ecological cost can be described using Equation (1):
E I I C T = E I I C p r o d + i = 1 n E I I C u s e + E I I C d i s p o s a l  
where E I I C T is the indicator of total environmental impact in a given impact category related to a functional unit;   E I I C p r o d is the environmental impact indicator associated with the production of treatment equipment in a given impact category on a functional unit;   E I I C u s e is the environmental impact indicator in a given category of impact on the functional unit, related to the use of the device; and E I I C d i s p o s a l is the environmental impact indicator in a given category of impact on the functional unit, related to the disposal of the device (sent to landfill, recycling, reuse, etc.).
Environmental impact assessment, e.g., with air purification limited only to the device production phase, can lead to false conclusions. All processes that make the air “clean” lead to greater energy and resource consumption and generate additional emissions. As a result, the final product ( E I I C p r o d ) is “cleaner”, but the environmental impact may increase. The effect of better air quality ( E I f ,   I C u s e ) could lead to processes that will actually reduce the final environmental effect. However, the importance of location should also be emphasized here. In this case, emissions are directly related to the people zone, so the ecological cost should be analysed with this in mind.
The analysis should include all materials and resources, as well as energy consumption involved in the entire process of cleaning the air.
Figure 2 presents LCA stages of purification of indoor air. In stage 1 (Production), all materials, resources, and energy consumption are included. In stage 2 (Use), phase electricity and filter consumption should be taken into account. In stage 3 (Disposal), all processes and recycling should be taken into account. But in the last stage, there are many possibilities. Different processes have a different impact on the environment. The LCA analysis in this research is focused on the three phases. At the end of the life of a device, it is essential to choose the recycling of two types of materials: Plastics and metals. The filter disposal is without any treatment. We do not know where our devices can be collected, but the impact is assumed to be insignificant.
The list of assumptions was made based on the Ecoinvent database and is presented in Table 3. The number of working hours was calculated as 52 weeks × 5 days × 11 h.
In Figure 3, the results are presented as environmental points. The Human Health category had the highest environmental indicator, and the Ecosystems category had the smallest. In each of the categories presented, electricity had the greatest impact on the result. This is because the source of Polish energy is mainly coal. The manufacture and distribution of the purification device also had a big impact on the results. These two factors make up the environmental impact. Filter consumption (one per year) had a negligible impact on the result. It is visible in the category Human Health and Resources, but it was below 0.2 Pt. The recycling process has the greatest impact on the Resources category, but with a negative effect, which therefore means a positive impact on the environment. The reason for this is that the primary raw materials for the production of a new device are being saved. In this analysis, only recycling of plastic and metal fractions were taken into account. The rest, based on mass composition, were assumed to have a negligible impact.
These results show that even the air purification process has an impact on the environment. It was found to be the largest in the Human Health category. However, this impact does not take into account the location of the issue. Indicators in the LCA are calculated globally. In this case, we must be aware that the analysis is about the air that people breathe directly. The purity of this air can have a huge impact on people’s health. The purification process has a negative impact on the environment, but in comparison with emissions from coal combustion in an old boiler, this is a negligible impact. However, it must be remembered that it always occurs.

4. Conclusions

The study of the quantity of culturable bacterial aerosol (CBA) and the ecological cost of emission reduction of microbial air pollutants was carried out in dwellings equipped with air purifiers (APs) in Upper Silesia, Poland.
Conducting comprehensive monitoring of indoor air microbiological pollutant concentrations is essential, not only for environmental management, but also for the assessment of the health impact of air pollution. The challenge is to decrease the indoor concentration of biological particles. The use of APs may improve the IAQ.
The average concentration of CBA in dwellings when the APs were active was 450–570 CFU/m3, whereas the average concentration of CBA in dwellings when the APs were off was 920–1000 CFU/m3. IAQ, when APs were enabled, was on average almost 50% better than in cases where there were no procedures to reduce air pollutants.
Measurement of particle size distribution (PSD) of CBA indicates a significant role of indoor emission sources in analysed dwellings. The use of active APs reduced the proportion of the respirable fraction (particles less than 3.3 µm) of bacteria by 16%.
If we take into account all calculations, we can see that air purification has a cost and an impact on the environment. Looking at electricity and some raw materials, we can assess the impact. This impact could be minimized by eco-design production.

Author Contributions

Conceptualization, E.B.; Data curation, E.B. and M.B.; Methodology, E.B., M.B., and K.P.; Supervision, K.P.; Writing—original draft, E.B. and M.B.; Writing—review and editing, E.B., M.B., and K.P.

Funding

Research funded by subsidies granted for the year 2019 for the Department of Technology and Installations for Waste Management, Silesian University of Technology.

Conflicts of Interest

The authors declare no conflict of interest.

References

  1. Petrillo, A.; De Felice, F.; Jannelli, E.; Autorino, C.; Minutillo, M.; Lavadera, A.L. Life cycle assessment (LCA) and life cycle cost (LCC) analysis model for a stand-alone hybrid renewable energy system. Renew. Energy 2016, 95, 337–355. [Google Scholar] [CrossRef]
  2. WHO Regional Office for Europe. OECD Economic Cost of the Health Impact of Air Pollution in Europe: Clean Air, Health and Wealth; European Environment and Health Processes; WHO Regional Office for Europe: Copenhagen, Denmark, 2015. [Google Scholar]
  3. Aydogdu, H.; Asan, A.; Tatman Otkun, M. Indoor and outdoor airborne bacteria in child day-care centers in Edirne City (Turkey), seasonal distribution and influence of meteorological factors. Environ. Monit. Assess. 2010, 164, 53–66. [Google Scholar] [CrossRef] [PubMed]
  4. Mainka, A.; Brągoszewska, E.; Kozielska, B.; Pastuszka, J.S.; Zajusz-Zubek, E. Indoor air quality in urban nursery schools in Gliwice, Poland: Analysis of the case study. Atmos. Pollut. Res. 2015, 6, 1098–1104. [Google Scholar] [CrossRef]
  5. Hospodsky, D.; Yamamoto, N.; Nazaroff, W.W.; Miller, D.; Gorthala, S.; Peccia, J. Characterizing airborne fungal and bacterial concentrations and emission rates in six occupied children’s classrooms. Indoor Air 2015, 25, 641–652. [Google Scholar] [CrossRef]
  6. Matlow, A.G.; Morris, S.K. Control of antibiotic-resistant bacteria in the office and clinic. Can. Med. Assoc. J. 2009, 180, 1021–1024. [Google Scholar] [CrossRef] [PubMed]
  7. Mummolo, S.; Marchetti, E.; Giuca, M.R.; Gallusi, G.; Tecco, S.; Gatto, R.; Marzo, G. In-office bacteria test for a microbial monitoring during the conventional and self-ligating orthodontic treatment. Head Face Med. 2013, 9, 7. [Google Scholar] [CrossRef]
  8. Reynolds, S.J.; Black, D.W.; Borin, S.S.; Breuer, G.; Burmeister, L.F.; Fuortes, L.J.; Smith, T.F.; Stein, M.A.; Subramanian, P.; Thorne, P.S.; et al. Indoor Environmental Quality in Six Commercial Office Buildings in the Midwest United States. Appl. Occup. Environ. Hyg. 2001, 16, 1065–1077. [Google Scholar] [CrossRef]
  9. Ashmore, M.; Dimitroulopoulou, C. Personal exposure of children to air pollution. Atmos. Environ. 2009, 43, 128–141. [Google Scholar] [CrossRef]
  10. Wichmann, J.; Lind, T.; Nilsson, M.-M.; Bellander, T. PM2.5, soot and NO2 indoor–outdoor relationships at homes, pre-schools and schools in Stockholm, Sweden. Atmos. Environ. 2010, 44, 4536–4544. [Google Scholar] [CrossRef]
  11. Wang, Y.-F.; Wang, C.-H.; Hsu, K.-L. Size and seasonal distributions of airborne bioaerosols in commuting trains. Atmos. Environ. 2010, 44, 4331–4338. [Google Scholar] [CrossRef]
  12. Nasir, Z.A.; Colbeck, I.; Sultan, S.; Ahmed, S.; Nasar, Z.A. Bioaerosols in residential micro-environments in low income countries: A case study from Pakistan. Environ. Pollut. 2012, 168, 15–22. [Google Scholar] [CrossRef] [PubMed]
  13. Wood, R.A.; Burchett, M.D.; Orwell, R.A.; Tarran, J.; Torpy, F. Plant/Soil Capacities to Remove Harmful Substances from Polluted Indoor Air. J. Horticul. Sci. Biotechnol. 2002, 71, 120–129. [Google Scholar] [CrossRef]
  14. Lee, B.U. Life Comes from the Air: A Short Review on Bioaerosol Control. Aerosol. Air Qual. Res. 2011, 11, 921–927. [Google Scholar] [CrossRef]
  15. Tolabi, Z.; Alimohammadi, M.; Hassanvand, M.S.; Nabizadeh, R.; Soleimani, H.; Zarei, A. The investigation of type and concentration of bio-aerosols in the air of surgical rooms: A case study in Shariati hospital, Karaj. MethodsX 2019, 6, 641–650. [Google Scholar] [CrossRef] [PubMed]
  16. Adhikari, A.; Reponen, T.; Grinshpun, S.A.; Martuzevicius, D.; Lemasters, G. Correlation of ambient inhalable bioaerosols with particulate matter and ozone: A two-year study. Environ. Pollut. 2006, 140, 16–28. [Google Scholar] [CrossRef]
  17. Brągoszewska, E.; Pastuszka, J.S. Influence of meteorological factors on the level and characteristics of culturable bacteria in the air in Gliwice, Upper Silesia (Poland). Aerobiology 2018, 34, 241–255. [Google Scholar] [CrossRef]
  18. Almeida, S.M.; Canha, N.; Silva, A.; Freitas, M.D.C.; Pegas, P.; Alves, C.; Evtyugina, M.; Pio, C.A. Children exposure to atmospheric particles in indoor of Lisbon primary schools. Atmos. Environ. 2011, 45, 7594–7599. [Google Scholar] [CrossRef]
  19. Brandl, H. Bioaerosols in Indoor Environment—A Review with Special Reference to Residential and Occupational Locations. Open Environ. Biol. Monit. J. 2011, 4, 83–96. [Google Scholar] [CrossRef]
  20. Brągoszewska, E.; Biedroń, I.; Kozielska, B.; Pastuszka, J.S. Microbiological indoor air quality in an office building in Gliwice, Poland: Analysis of the case study. Air Qual. Atmos. Health 2018, 11, 729–740. [Google Scholar] [CrossRef]
  21. Pastuszka, J.S.; Paw, U.K.T.; Lis, D.O.; Wlazło, A.; Ulfig, K. Bacterial and fungal aerosol in indoor environment in Upper Silesia, Poland. Atmos. Environ. 2000, 34, 3833–3842. [Google Scholar] [CrossRef]
  22. Brągoszewska, E.; Biedroń, I. Indoor Air Quality and Potential Health Risk Impacts of Exposure to Antibiotic Resistant Bacteria in an Office Rooms in Southern Poland. Int. J. Environ. Res. Public Health 2018, 15, 2604. [Google Scholar] [CrossRef] [PubMed]
  23. Oh, H.-J.; Nam, I.-S.; Yun, H.; Kim, J.; Yang, J.; Sohn, J.-R. Characterization of indoor air quality and efficiency of air purifier in childcare centers, Korea. Build. Environ. 2014, 82, 203–214. [Google Scholar] [CrossRef]
  24. Brągoszewska, E.; Biedroń, I.; Hryb, W. Air Quality and Potential Health Risk Impacts of Exposure to Bacterial Aerosol in a Waste Sorting Plant Located in the Mountain Region of Southern Poland, Around Which There Are Numerous Rural Areas. Atmosphere 2019, 10, 360. [Google Scholar] [CrossRef]
  25. Jiayu, C.; Qiaoqiao, R.; Feilong, C.; Chen, L.; Jiguo, W.; Zhendong, W.; Lingyun, C.; Liu, R.; Guoxia, Z. Microbiology Community Structure in Bioaerosols and the Respiratory Diseases. J. Environ. Sci. Public Heal. 2019, 3, 347–357. [Google Scholar] [CrossRef]
  26. Moore, M.N. Do airborne biogenic chemicals interact with the PI3K/Akt/mTOR cell signalling pathway to benefit human health and wellbeing in rural and coastal environments? Environ. Res. 2015, 140, 65–75. [Google Scholar] [CrossRef] [PubMed]
  27. Louis, G.B.; Damstra, T.; Díaz-Barriga, F.; Faustman, E.; Hass, U.; Kavlock, R.; Kimmel, C.; Kimmel, G.; Krishnan, K.; Luderer, U.; et al. Environmental Health Criteria 237: Principles for Evaluating Health Risks in Children Associated with Exposure to Chemicals; Environmental Health Criteria; WHO Press, World Health Organization: Geneva, Switzerland, 2006. [Google Scholar]
  28. Cincinelli, A.; Martellini, T. Indoor Air Quality and Health. Int. J. Environ. Res. Public Health 2017, 14, 1286. [Google Scholar] [CrossRef]
  29. Nevalainen, A.; Pastuszka, J.; Liebhaber, F.; Willeke, K. Performance of bioaerosol samplers: Collection characteristics and sampler design considerations. Atmos. Environ. Part A Gen. Top. 1992, 26, 531–540. [Google Scholar] [CrossRef]
  30. Douwes, J.; Thorne, P.; Pearce, N.; Heederik, D. Bioaerosol health effects and exposure assessment: Progress and prospects. Ann. Occup. Hyg. 2003, 47, 187–200. [Google Scholar]
  31. Barkjohn, K.K.; Bergin, M.H.; Norris, C.; Schauer, J.J.; Zhang, Y.; Black, M.; Hu, M.; Zhang, J. Using Low-cost sensors to Quantify the Effects of Air Filtration on Indoor and Personal Exposure Relevant PM2.5 Concentrations in Beijing, China. Aerosol. Air Qual. Res. 2019, in press. [Google Scholar] [CrossRef]
  32. Abreu, N.A.; Nagalingam, N.A.; Song, Y.; Roediger, F.C.; Pletcher, S.D.; Goldberg, A.N.; Lynch, S.V. Sinus microbiome diversity depletion and Corynebacterium tuberculostearicum enrichment mediates rhinosinusitis. Sci. Transl. Med. 2012, 4, 151ra124. [Google Scholar] [CrossRef]
  33. Gallego-Schmid, A.; Mendoza, J.M.F.; Jeswani, H.K.; Azapagic, A. Life cycle environmental impacts of vacuum cleaners and the effects of European regulation. Sci. Total Environ. 2016, 559, 192–203. [Google Scholar] [CrossRef] [PubMed]
  34. Monfared, B.; Furberg, R.; Palm, B. Magnetic vs. vapor-compression household refrigerators: A preliminary comparative life cycle assessment. Int. J. Refrig. 2014, 42, 69–76. [Google Scholar] [CrossRef] [Green Version]
  35. Ardente, F.; Mathieux, F. Environmental assessment of the durability of energy-using products: Method and application. J. Clean. Prod. 2014, 74, 62–73. [Google Scholar] [CrossRef]
  36. Teehan, P.; Kandlikar, M. Sources of Variation in Life Cycle Assessments of Desktop Computers. J. Ind. Ecol. 2012, 16, S182–S194. [Google Scholar] [CrossRef]
  37. Jeswani, H.K.; Azapagic, A. Is e-reading environmentally more sustainable than conventional reading? Clean Technol. Environ. Policy 2015, 17, 803–809. [Google Scholar] [CrossRef]
  38. Brągoszewska, E.; Mainka, A.; Pastuszka, J.S.; Lizończyk, K.; Desta, Y.G. Assessment of Bacterial Aerosol in a Preschool, Primary School and High School in Poland. Atmosphere 2018, 9, 87. [Google Scholar] [CrossRef] [Green Version]
  39. Sato, J.; Denda, M.; Chang, S.; Elias, P.M.; Feingold, K.R. Abrupt Decreases in Environmental Humidity Induce Abnormalities in Permeability Barrier Homeostasis. J. Investig. Dermatol. 2002, 119, 900–904. [Google Scholar] [CrossRef] [Green Version]
  40. Nevalainen, A.; Willeke, K.; Liebhaber, F.; Pastuszka, J.S.; Burge, H.; Henningson, E. Bioaerosol sampling. In Aerosol Measurement: Principles, Techniques and Applications; Willeke, K., Baron, P., Eds.; Van Nostrand Reinhold: New York, NY, USA, 1993; pp. 471–492. [Google Scholar]
  41. PN-EN 12322 In Vitro Diagnostic Medical Devices. Culture Media for Microbiology. Performance Criteria for Culture Media. 2005. Available online: https://ec.europa.eu/growth/single-market/european-standards/harmonised-standards/iv-diagnostic-medical-devices_en (accessed on 18 November 2019).
  42. ISO 11133 Microbiology of Food, Animal Feed and Water—Preparation, Production, Storage and Performance Testing of Culture Media. 2014. Available online: https://www.iso.org/standard/53610.html (accessed on 18 November 2019).
  43. Brągoszewska, E.; Mainka, A.; Pastuszka, J.S. Bacterial and Fungal Aerosols in Rural Nursery Schools in Southern Poland. Atmosphere 2016, 7, 142. [Google Scholar] [CrossRef] [Green Version]
  44. ISO 14040 Environmental management—Life Cycle Assessment—Principles and Framework; International Organization for Standardization (ISO): Geneva, Switzerland, 2006.
  45. Huijbregts, M.A.J.; Steinmann, Z.J.N.; Elshout, P.M.F.; Stam, G.; Verones, F.; Vieira, M.; Zijp, M.; Hollander, A.; van Zelm, R. ReCiPe2016: A harmonised life cycle impact assessment method at midpoint and endpoint level. Int. J. Life Cycle Assess. 2017, 22, 138–147. [Google Scholar] [CrossRef]
  46. Gayer, A.; Mucha, D.; Adamkiewicz, Ł.; Badyda, A. Children exposure to PM2.5 in kindergarten classrooms equipped with air purifiers—A pilot study. In MATEC Web of Conferences; EDP Sciences: Les Ulis, France, 2018; Volume 247, p. 00016. [Google Scholar]
  47. Pastuszka, J.S. Exposure of the General Population Living in Upper Silesia Industrial Zone to the Particulate, Fibrous and Biological (Bacteria and Fungi) Aerosols; Wroclaw Technical University: Wroclaw, Poland, 2001. (In Polish) [Google Scholar]
  48. Mirhoseini, S.H.; Nikaeen, M.; Satoh, K.; Makimura, K. Assessment of Airborne Particles in Indoor Environments: Applicability of Particle Counting for Prediction of Bioaerosol Concentrations. Aerosol. Air Qual. Res. 2016, 16, 1903–1910. [Google Scholar] [CrossRef]
  49. Lee, J.-H.; Jo, W.-K. Characteristics of indoor and outdoor bioaerosols at Korean high-rise apartment buildings. Environ. Res. 2006, 101, 11–17. [Google Scholar] [CrossRef] [PubMed]
  50. Górny, R.L. Biological aerosols – a role of hygienic standards in the protection of environment and health. Environ. Med. 2010, 13, 2009–2010. [Google Scholar]
  51. Lacey, J.; Dutkiewicz, J. Bioaerosols and occupational lung disease. J. Aerosol. Sci. 1994, 25, 1371–1404. [Google Scholar] [CrossRef]
  52. Owen, M.; Ensor, D.; Sparks, L. Airborne particle sizes and sources found in indoor air. Atmos. Environ. Part A Gen. Top. 1992, 26, 2149–2162. [Google Scholar] [CrossRef]
Figure 1. The particle size distribution (PSD) of CBA in dwelling 1 (D1) and dwelling 2 (D2) when the air purifier was active (APA) and when the air purifier was off (APO).
Atmosphere 10 00742 g001
Figure 2. Life cycle assessment (LCA) of purification indoor air.
Atmosphere 10 00742 g002
Figure 3. The results of LCA analysis of air purification during 1 year of work.
Atmosphere 10 00742 g003
Table 1. Environmental parameters and basic description of dwellings.
Dwelling 1 (D1)Dwelling 2 (D2)
Home locationclose to the city centreclose to the city centre
Building built in1990s1980s
EquipmentTable, chairs, sofaTable, chairs, sofa, 2 armchairs
Ventilation systemnaturalnatural
Volume, m36462
Number of occupants4 (2 adults and 2 children)4 (2 adults and 2 children)
Number of animals-1 dog
Floor covered withPVCPVC and carpet
Indoor temperature, °C (APA)19.6020.60
Indoor temperature, °C (APO)21.4520.55
Outdoor temperature, °C (APA)25.1525.60
Outdoor temperature, °C (APO)24.0023.50
Indoor relative humidity, % (APA)31.8036.75
Indoor relative humidity, % (APO)31.1032.00
Outdoor relative humidity, % (APA)42.0048.40
Outdoor relative humidity, % (APO)39.5047.85
APA—when the air purifier was active; APO—when the air purifier was off.
Table 2. Average concentration, CFU/m3, of culturable bacterial aerosol (CBA) colony-forming units per cubic meter of air inside two dwellings, dwelling 1 (D1) and dwelling 2 (D2), when the air purifier was active (APA) and when the air purifier was off (APO).
LocationAverage Concentration SDMinMax
D1 APO9182213111204
D2 APO10063115281511
D1 APA44681163526
D2 APA57298301748
SD: Standard deviation.
Table 3. The list of assumptions.
AssumptionUnitChosen Ecoinvent Database
Working hours3025h/year-
Electricity consumption85.5kWhElectricity, low voltage {PL}| market for | Alloc Def, U
Recycling plastic2kg_42 Recycling of plastics basic, EU27
Recycling metals0.5kg_60 Recycling of metals basic, n.e.c. EU27
Air filter1pieceAir filter, central unit, 600 m3/h {GLO}| market for | Alloc Def, U
Production of the device1pieceAir purification and ventilation equipment manufacturing

