Abstract
This paper presents a seasonal analysis of cloud-to-ground (CG) lightning flash activity in the Western Antarctica using a lightning detector sensor installed at the Carlini Base station. Data obtained from the detection system between February and December 2017 were analyzed. Three common locations and areas of composite active thunderstorms (labelled storm regions A, B, and C) were detected by the sensor within a 1000 km radius from the station. Storm region A was located to the northwest (N/W) of the station and covered the Amundsen/Bellingshausen Sea (ABS), whereas storm region C was located on the southeastern (S/E) side of the station over the Weddell Sea (WS), with distances ranging from 500 to 800 km and bearings of 270° to 360° and 90° to 180, respectively. Storm region B was located around 100 km from the station with the bearings of stroke taken from 0° to 360°. A total of 2,019,923 flashes were detected, of which 43.01% were positive CG and 56.99% were negative CG flashes. The analysis revealed that more than 96% of the CG flashes (both positive CG and negative CG) were produced during the summer and fall seasons as compared with less than 4% during the winter and spring seasons. Most detected lightning strokes (>85%) were located in the central area around the station produced by storm region B and less than 15% were produced by storm region A and storm region C, located in the ocean areas over the Amundsen/Bellingshausen Sea and the Weddell Sea.
1. Introduction
Lightning is electrical discharge that occurs during thunderstorms. It occurs in a cloud called intra-cloud (ICs) and between two clouds called cloud-to-cloud (CCs). The most common is cloud-to-ground (CGs) lightning with “lowered down” or “brought up” electrical charges from thundercloud or ground to the surface of the Earth or thundercloud. There are two types of downward CGs, namely, positive CG (+CG) when the initial process starts close to the positive charge center inside the cloud and develops in the downward direction towards the ground and negative CG (-CG) when the process starts close to the negative charge center inside the cloud [1,2]. A narrow bipolar pulse (NBE) is a unique type of IC that occurs within or near the convective core of a thunderstorm [3,4]. Typically, a thundercloud consists of two main charge centers, i.e., a positive center at the top with an altitude of close to 10 km in temperate summer storms and a negative charge center at the bottom at altitudes of between 6 and 8 km [5]. This type of charge structure is known as a dipole charge structure. In addition, there are small amounts of positive charge below the main negative charges at altitudes where the temperature is near or above freezing. Most thunderstorms have a dipole or tripole structure, also known as normal charge distribution.
Recent studies by Chan and Mohamed [6] examined the occurrence of tropical +CG lightning and its relationship with the monsoon season in Pekan, Malaysia. Their findings revealed that of the total lightning flashes, 21.91% were +CG and 78.09% were -CG flashes. Additionally, a higher number of lightning flashes occurred during the dry season, between May to September, as compared with the rainy season, between October to December, ins 2015, which implies that the rainy season does not affect the frequency of lightning. Herrera et al. [7] reported the analysis of 14 years of CG lightning activity in Columbia using a stroke grouping algorithm. They found 74% and 26% of the occurrences were negative and positive flashes, respectively. Both of these studies reported similar results, i.e., CG flashes formed more than 70% of the total number of flashes. Hazmi et al. [8] reported the characteristics of 77 electrical field changes of +CG flashes in Indonesia. They observed that the arithmetic mean (AM) and geometric mean (GM) values for zero to 100% and 10% to 90% rise time were 12.7 μs, 11.9 μs and 6.1 μs, 5.8 μs, respectively. Fan et al. [9] observed 202 lightning flashes, in China, and detected a peak lightning rate of 28 times/5 min, the average number of return strokes of -CG was 2.4, and found only one return stroke of +CG. Ahmad et al. [10] suggested that the occurrence of +CG flashes are latitude dependent. Thunderstorms tend to have higher cloud tops and elevated mixed-phase regions when the latitude decreases from northern regions to the tropics. Storms in tropical regions (typically tripole charge structures) produce a small number of +CG flashes as compared with storms in high latitude regions (some storms have an inverted charge structure).
In some cases, the charge structure of a thundercloud can show inverted polarity, in which the main negative charge is above the positive charge [11]. These storms tend to produce significant amounts of +CG lightning flashes and inverted polarity intracloud flashes; these are prevalent in areas such as the USA high plains region [12]. Other studies during warm-season storms in the Central Great Plains (CGP) and upper Midwest have also shown that most of the storms in these areas produce a prevalence of +CG rather than -CG flashes [12,13,14,15,16]. Orville and Huffines [17] reported that the annual average percentages of positive flashes in the CGP and upper Midwest regions were higher than 20%. Li et al. [18] observed the charge structure of isolated thunderstorms using a very high frequency three-dimensional lightning mapping system and Doppler radar on the Qinghai-Tibet Plateau. They found that the charge structures showed negative dipole polarity during both the initial development and the mature stages of the thunderstorms. Wiens et al. [19] examined the lightning and charge structure evolution of the 29 June 2000 tornadic supercell during the Severe Thunderstorm Electrification and Precipitation Study (STEPS). They found that 90% of the CG flashes were +CG flashes. The charge structure in the later (severe) phase was more complex but maintained what could be roughly described as an inverted tripole structure, dominated by a deep mid-level, 5 to 9 km mean sea level (MSL), region of positive charge. One of the aims of the STEPS project was to develop a good understanding of those storms that produce predominantly +CG lightning with inverted polarity as compared with ordinary thunderstorms [16].
Wayan Suparta [20] found a significant correlation between precipitable water vapor (PWV) and solar activity with correlation coefficients of 0.74, 0.77, 0.64, and 0.69 for four geomagnetic storms. Another study examined the ionospheric total electron (TEC) variation during the occurrence of lightning in the Antarctic Peninsula [21]. The results showed that the increment of TEC was 0.2 to 0.4 TECU and 0.4 to 1.0 TECU for lightning energy loss and more than 10 million rms during low and active storm activity. Moreover, they also studied the features of GPS PWV variation associated with lightning activity in the Peninsular Malaysia and also worked on the modeling to accurately estimate the PWV from the ground-based GPS receiver [22,23].
The weather and climate in the Antarctic region, tropics, and midlatitudes are mutually connected. The weather and climate in the Antarctica and the Southern Ocean are highly influenced by the topographic features of the Antarctica [24] and the sea ice extent in the seas that surround the continental landmass. The topography of the Antarctic is generally separated into eastern and western regions as shown in Figure 1. Most of the continental Antarctica, including the dry Antarctic plateau, is located in the eastern part, whereas only a small fraction of continental Antarctica belongs to the western part. On the one hand, the high elevation of the Antarctic plateau and the lower amounts of water vapor can result in fewer cloud occurrences in the eastern continental region as compared with the western one [25]. On the other hand, the location of the Antarctic Peninsula on the western region can experience warmer temperatures than the eastern region due to the surrounding seawater [26].
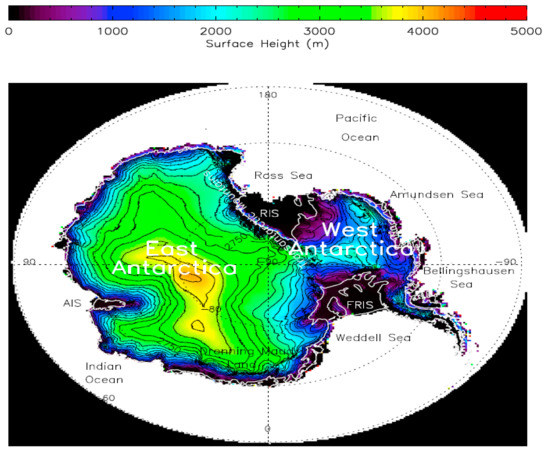
Figure 1.
The topography of the Antarctica covered the eastern, western and the surrounding seas [25].
Antarctic clouds are a significant part of the global climate dynamic [27,28,29,30], as well as a main source of charge electrification that produces lightning. The cloud occurrences in the Antarctica also play an important role in lightning activity of this region. According to Spinhirne et al. [31], they reported two types of clouds over the Antarctica, known as stratus clouds below 3 km and cirrus-form clouds above 3 km, with cloud top altitudes of around 12 km and thicknesses of usually around 1.3 km. The average cloud fraction varies from over 93% for ocean and coastal regions to a consistent average of 40% over the Eastern Antarctic plateau and 60% to 90% over Western Antarctica. These measurements were the first analysis using the space-based lidar measurements in the Antarctica.
Adhikari et al. [25] provided a high-quality dataset of cloud properties over the Antarctic region between June 2006 and May 2010. A combination of Cloud-Aerosol Lidar and Infrared Pathfinder Satellite Observation (CALIPSO) and CloudSat cloud masks were used to calculate the cloud thickness (CTH), cloud base height above mean sea level (MSL) (Hbase), cloud top height above mean sea level (MSL) (Htop), and mean maximum equivalent radar reflectivity factor (Zmax) for each cloud layer. In their studies, the clouds were classified into four classes, namely, high-level, middle-level, low-level, and deep cloud based on the Hbase and CTH. For the high-level cloud, the Hbase was more than or equal to 6 km; for the middle-level cloud Hbase ranged from 2 km to less than 6 km, and for low-level cloud the Hbase was less than 2 km. Additionally, the CTHs for all types of clouds were less than 6 km. However, the Hbase for deep cloud was less than 2 km and the CTH more than or equal to 6 km. Their findings reported stark differences in the vertical extent of clouds over the Eastern and Western Antarctica and between clouds over the land and ocean. The cloud occurrence recorded over the Western Antarctica, including the Antarctic Peninsula, was higher at all vertical levels (50% at 1 to 2 km and 30% up to 8 km) than over the Eastern Antarctica which had occurrence frequencies of 25% to 30% at 1 to 3 km and less than 10% above 5 km. In addition, clouds were observed at greater heights over the Western Antarctica as compared with the Eastern Antarctica. While the occurrence frequency and the vertical extent over the ocean were higher, between 10 to 11 km for all seasons, the vertical height over land was up to 8 km in all seasons, except in summer.
Most of the studies related to lightning have been carried out in East Asia, Europe, the United States, Japan, and South America. Very little research on lightning has been carried out in high latitude regions such as in the polar regions, however, studies on lightning occurrences in this region are scarce because of the lack of observational lightning data. Hence, accurate lightning data of high efficiency in the Antarctic region is necessary to better understand lightning activity over the Antarctic area. This paper reports an investigation of CG lightning flash occurrences using a lightening detector (LD) sensor installed at the Carlini Base on the western part of the Antarctica. Data obtained from the lightning system from February to December 2017 were analyzed. Three locations and areas of composite active thunderstorms were examined in the observations. The number of lightning flashes and the percentage of +CG and −CG flashes were analyzed during the four seasons in the Western Antarctica.
2. Data and Methodology
2.1. Instrumentation
In mid-January 2017, a Boltek Lightning Detector (LD-350) was installed on the roof of the Calbido Laboratory building at the Carlini Base (CARL: 62.23° S, 58.63° W) on the Antarctic Peninsula (Figure 2). The measurements were based on a single station to specifically study the lightning activity in this region. The LD is a long-range lightning detector based on magnetic direction finding (MDF). It measures the radiated impulse from the lightning discharge as far away as 480 km and up to 960 km if the sensor detects strong storms at a particular time. The complete LD system consists of a lightning sensor (ANT-2) and NexStorm (Version 1.9), the lightning detection software that displays the lightning data on a map on the computer screen. Advanced signal processing in the software improves distance accuracy, reducing the effects of stroke-to-stroke variations in stroke energy. The system is able to detect low frequency (LF) radio signals ranging from 30 to 300 kHz which are emitted by the electrical discharge during the lightning. The LD-350′s direction finding antenna was used to determine the direction of the lightning signal. The LD-350′s receiver captured the signal strength to calculate the distance of the lightning stroke. The detection efficiency of the LD system is hundreds of nanoseconds in locating the occurrence of lightning [32]. The additional details for the instrumentations are given in Yusop et al. [33].
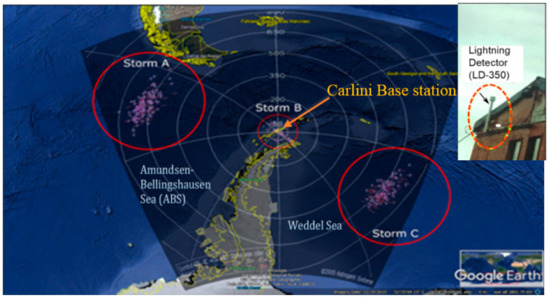
Figure 2.
Locations and areas of lightning strokes detected by the lightening detector (LD) system installed at the Carlini Base, Antarctic Peninsula (Figure © 2019 Google Earth).
2.2. Location of the Storm Detected by the LD Sensor
The LD sensor provided the location of the captured strokes every second. Figure 2 shows the three areas of lightning strokes identified as storm region A, storm region B, and storm region C which were captured by the LD system on 21 February 2017. These represent composite storms occurring over 24 h and are made up of several individual storms. The lightning sensor detected storm region B which occurred closest to the Carlini Base station, within a distance of less than 100 km, and the bearings of stroke were taken from 0° to 360°. Storm region A was located to the northwest (N/W) while storm region C was located to the southeast (S/E) with the distances ranging from 500 to 800 km and bearings ranging from 270° to 360° and 90° to 180°, respectively. The values for distance and bearings of stroke were strictly taken into consideration in the CG flash analysis.
2.3. Instrument Verification
The LD system was compared to a fast antenna (FA) system by using 100 samples (matched stroke). The FA is a well-known and accurate lightning measurement. Additional details for the instrumentations are given in [10,34,35]. A total of 100 samples were analyzed, detected by the LD system and selected as those that matched with strokes detected by the FA system at the exact time and quadrant. The comparison of return stroke (RS) shows that the LD system captured the RS with a maximum number of three, while the FA system captured a maximum number of nine in this analysis. Table 1 shows the RS detected by the LD system at 68348 s. Figure 3a illustrates the RS detected by fast (FA) and slow (SA) electric field with magnetic field records from north-south (BF-NS) and east-west (BF-EW) loop antenna systems and Figure 3b shows the expanded view of the fast field signal including each of the RS.

Table 1.
The return stroke (RS) captured by the LD system.
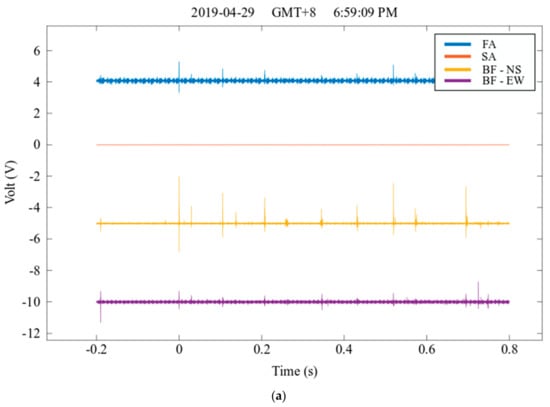
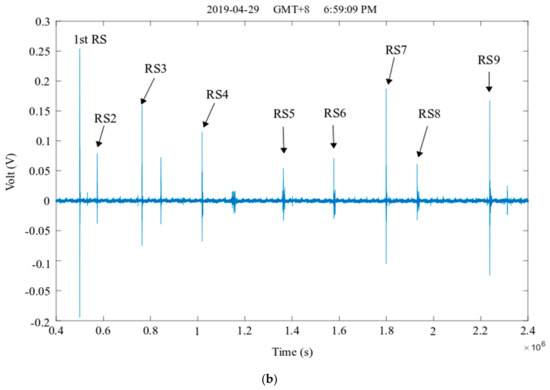
Figure 3.
The RS captured by the (a) fast antenna (FA) system and (b) the expanded view of the fast field signal.
The number of RS detected by the LD and FA systems are shown in Figure 4. The y-axis represents the number of RS detected by both systems and the x-axis represents the number of samples. As can be seen from Figure 4, the ratio of the minimum and maximum RS was in the range between one and three where the ratio is calculated based on the number of RS obtained by the FA divided by the number of RS obtained by the LD system. We also found that the detection efficiency of both systems for detecting the −CG and IC flash were 100% matched. No +CG flashes were detected throughout the analysis. On the basis of the information available in the literature (Section 1), the occurrence of positive ground flashes is relatively rare as compared with negative ground flashes in the tropical region [36,37].
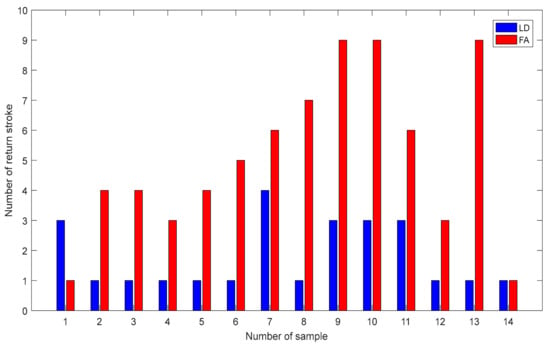
Figure 4.
Number of RS detected by the LD and FA systems.
2.4. Data Processing
Data collection from the LD system was used in the analysis of CG lightning flashes. The data were organized in the following sequence: time in seconds, bearing, distance, stroke type, and polarity of the stroke. Since the sensor was installed in mid-January 2017, only data recorded from February to December 2017 were taken for the purpose of analysis. All data were recorded at local Argentinian time (ART). For the seasonal analysis, the dataset was divided into four seasons following the Antarctic seasons, i.e., the austral summer, December to February (DJF); fall, March to May (MAM); winter, June to August (JJA); and spring, September to November (SON). The location and area of the storms obtained from the LD are shown in Figure 2 using Matlab code. Meanwhile, Google Earth software was used only to plot the exact location and area of the storm from the station obtained from LD, and whether the storm occurred over land or ocean. Then, the LD data was compared to the World-Wide Lightning Location Network (WWLLN) data where the WWLLN sensor was installed at the Rothera station. The WWLLN data used in this study that covered the period from 2013 to 2017 (http://wwlln.net) were extracted from the WWLLN database. The WWLLN consists of over 70 stations worldwide [38]. It monitors lightning strokes in real time using electromagnetic radiation in a very low frequency (VLF) range, (3 to 30 kHz). For the WWLLN data, the area of the stroke taken was confined by −50° S to −80 °S and −30 °W to −90 °W and covered all strokes displayed from the LD system, in 2017, as shown in the dark blue area in Figure 2. The following two characteristics were used to classify the types of lightning stroke using the LD data: stroke type and polarity of the stroke given in digital format 0 or 1 (CG or IC) and 0 or 1 (positive or negative), respectively. After the classification process, the data underwent the classification mechanism to determine one complete flash within 1 s. In this study, stroke refers to the individual lightning stroke captured during the lightning discharge, whereas flash is a complete process within 0.5 to 1 s which consists of several processes such as preliminary breakdown, step leader, return stroke, etc.
3. Results and Analysis
3.1. Observation and Occurrence of CG Lightning Flashes in the Western Antarctica
The CG lightning flashes were analyzed and classified based on the parameters discussed in Section 2, i.e., the flash type, polarity of stroke, bearings, and distance of stroke from the Carlini Base station during the summer campaign of 2017. As a result, a total of 2,019,923 flashes were detected in this study, consisting of 43.01% +CG and 56.99% −CG flashes. The results, presented in Table 2, show that the amount of +CG flashes found was very significant at 43% and the ratio of +CG to −CG flashes was relatively high as compared with previous studies on observation and occurrences of +CG flashes carried out in other geographical regions [6,7,10,36,37,39]. In general, around 90% of the total CG flashes found were −CG while the other 10% were +CG [1,5,40]. However, as discussed by Ahmad et al. [10], the occurrence of +CG flashes is latitude dependent. Storms in tropical regions produce a small number of +CG flashes as compared with storms in high latitude regions. In other words, +CG flashes are more prevalent at high latitudes, and thus it can be expected that +CG flashes are also prevalent on the Antarctic Peninsula.

Table 2.
The ratio of positive cloud-to-ground (+CG) and −CG flashes.
Table 3 summarizes the total number and percentage of CG lightning flashes for each month in 2017. In January, there were no lightning data because the LD was installed in mid-January and the detector was still in the testing stage at that time. Clearly, the most frequent occurrences of lightning flashes were recorded by the LD at the beginning of the year, from February to April 2017, in the range of 20–40%, respectively. In contrast, analysis showed lower occurrences of CG flashes, i.e., below 1%, were observed for the remaining months from May to December 2017.

Table 3.
The total number of CG lightning flashes for each month, in 2017.
Figure 5 presents the distribution of the number of CG lightning flashes from February to December 2017 for storm region A, storm region B, and storm region C. Referring to Section 2, the analysis was based on three locations and areas of the composite storms which were detected by the LD sensor. For storm region A and storm region C, the number of flashes increased at the beginning of fall from February to March with the ratio of 1.259 and 1.865, respectively. The values given on the lines between the symbols are the flash rate ratio. The flash rate ratio is calculated based on the value of the current month divided by the value of the previous month, for example, March flash rate divided by the February flash rate. However, the ratio for storm region B decreased slightly to about 0.770 before reaching 1.515, similar to storm region A in April. The graph also clearly shows that the number of flashes for all storms decreased drastically from April to May at the end of the fall season. Additionally, the number of flashes was significantly reduced for storm region B with the ratio reaching almost zero.
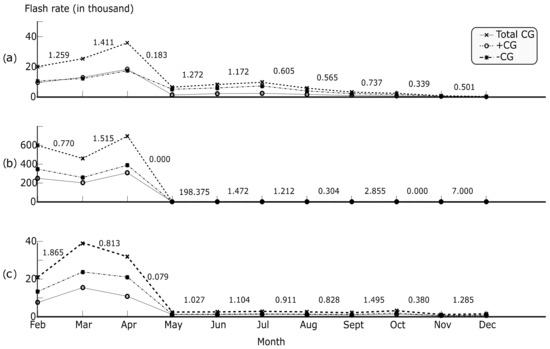
Figure 5.
Distribution of CG lightning flashes per month for (a) storm region A, (b) storm region B, and (c) storm region C, in 2017.
The pattern of the flash rate for all storms showed that there was more lightning activity at the end of summer in February until the end of fall in May as compared with the winter and spring seasons from June to November. Despite the graph showing quite similar patterns for all storms (storm regions A, B, and C), storm region B showed a large number of CG flashes (more than 600 thousand) as compared with storm region A and storm region C (which produced no more than 40 thousand CG flashes). This is because the LD sensor installed at the station was located closer to storm region B, which was within 100 km of the station and so detection efficiency was much higher for storm region B than storm region A and storm region C which were located between 500 and 800 km away from the LD sensor. Therefore, storm region B should reasonably produce more CG flashes as compared to the other two storms (storm regions A and C) because of its location closer to the installed sensor.
3.2. The Five-Year Temporal Distribution of Lightning Strokes
The distribution of lightning strokes was analyzed over a five year period between 2013 and 2017 based on lightning data recorded by the WWLLN system and one year recorded data from the LD system, as shown in Figure 6, in order to analyze the lightning stroke occurrences and the pattern of stroke distribution in the Western Antarctica region. Overall, a total of 1.12 × 10⁸ lightning stroke occurrences were recorded by the LD system as compared with only 17,648 lightning stroke occurrences recorded by the WWLLN system. The LD stroke count was found to be approximately six thousand times higher than the WWLLN system in 2017. As reported by Hutchins et al. (2012), Abarca et al. (2010), Rodger et al. (2009), and Rudlosky and Shea (2013), the WWLLN system is able to detect lightning locations accurately to within about 5 km with a timing accuracy of 15 μs and an estimated overall stroke detection efficiency of 11% [41,42,43,44]. The detailed explanations of the results are given in Yusop et al. [33].
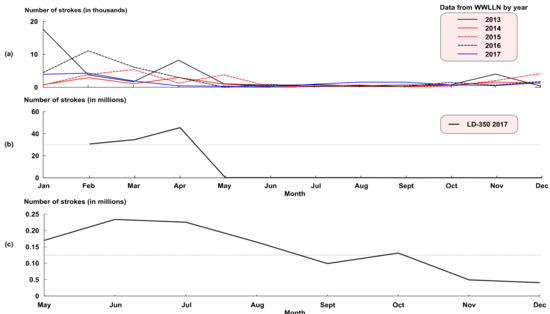
Figure 6.
Monthly distribution of number of strokes (a) WWLLN data from 2013 to 2017, (b) LD-350 data in the Antarctic Peninsula for 2017 starting from February 2017, and (c) the expanded view of (b) from May to December 2017. (Note, the dotted-solid line shows the mid-point value of the Y-axis).
Figure 6a shows that the pattern of strokes distribution within the five years is comparable to the LD data, with more numerous and more intense strokes produced during the summer and fall as compared with winter and spring seasons throughout the observation. In total, 91,501 and 32, 144 strokes were observed by the WWLLN system from January to May and Jun to December, respectively.
Figure 6b presents the distribution of the number of strokes using the LD data, except for January because the lightning sensor was installed mid-January 2017 and the data were still at the testing stage. We found that 40% of the total number of strokes were produced in April during mid-fall. Surprisingly the number of strokes dropped sharply from 45,511,286 to 169,951 strokes for the following month before it became more or less consistent until the end of December. Since the numbers of strokes are slightly lower by the end of fall (May) to the start of summer (December) 2017, the expansion of Figure 6b is shown in Figure 6c. From Figure 6c, a pattern of consistent stroke distribution can be seen between May and December 2017. From this figure, the total percentage of lightning strokes obtained is small, around 0.98% between May and December 2017. The relationship between Figure 6a,b can be described in terms of the pattern of lightning stroke occurrences in Western Antarctica and, interestingly, both detection systems present a similar global pattern of stroke distributions in that the number of strokes produced was greater during the summer and fall seasons in high latitude regions.
3.3. The Occurrences of CG Lightning Strokes in all Season in Antarctica
Figure 7 represents the occurrences of CG lightning strokes and the distances of the strokes from the LD system from 15:00 to 19:00 ART. Four-hour data from each season have been chosen for the analysis during the summer (25 February), fall (8 April), winter (10 July), and spring (12 October) seasons, in the Antarctica. The center of the map represents the location of the lightning sensor installed at the Carlini Base. Figure 7a,b shows a significantly large number of strokes during the summer and fall seasons as compared with the significantly smaller number of strokes during the winter and spring seasons, illustrated in Figure 7c,d. The locations and areas of lightning stroke occurrences were approximately similar between the summer/fall and the winter/spring seasons from composite storm regions A, B, and C, as illustrated in Figure 2. On the one hand, a significant number of strokes were detected during the summer and fall seasons within 200 km from the station at the Carline Base. On the other hand, significantly fewer lightning stroke occurrences were detected during the winter and spring seasons. All strokes detected during winter and spring were from composite storm region A and storm region C, and no strokes were detected within 200 km from the lightning sensor during those seasons.
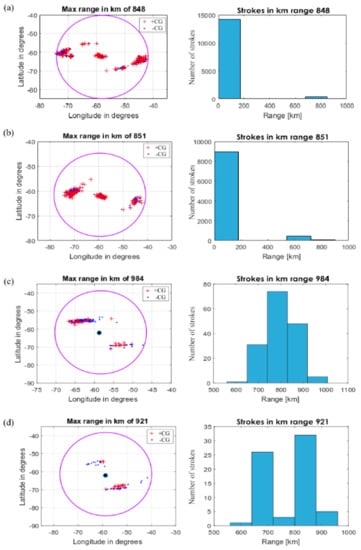
Figure 7.
CG lightning strokes for a chosen day (4 h duration) in all seasons in the Western Antarctic (a) summer (25 February 2017), (b) fall (8 April 2017), (c) winter (10 July 2017), and (d) spring (12 October 2017).
Table 4 indicates the number of +CG and -CG lightning flashes observed during the four seasons in Antarctica. During the summer and fall seasons, the total number of CG flashes was highest, with around 645,278 and 1,313,154 flashes as compared with the winter and spring seasons with around 43,609 and 17,882 flashes, respectively. The important observation found in this study is that most of the CG flashes containing both +CG and -CG were produced during summer and fall seasons while a significantly smaller number of flashes were produced during the winter and spring seasons. This shows a similar pattern with the occurrence results shown in Figure 7a–d. The percentage of CG flashes according to seasons in the Western Antarctica show that most of the flashes (65.01%) were produced between March and May in the fall season followed by the summer months of February and December at 31.95%. However, there is a possibility that the lower value in the summer season as compared with the fall season was due to the unavailability of LD data in January 2017. As expected, significantly lower percentages of flashes were observed in winter and spring, only 2.16% and 0.89% respectively.

Table 4.
The number of +CG and −CG flashes across four seasons.
4. Discussion
Our results show, for the first time, an analysis of lightning activity carried out at the Carlini Base station situated in the western part of the Antarctic, as shown in Figure 2. The Amundsen-Bellingshausen Sea (ABS) region in the west with a distance of around 1492 km to the station is one of the regions that has high cloud occurrence throughout the year due to cyclonic circulation [45]. Figure 8 summarizes four types of clouds in the Antarctica as mentioned in Section 1 reported by Adhikari et al. [25]. The maximum (mean) value for high-level, middle-level, low-level, and deep clouds were 10.3 (9.9), 6.6 (6.4), 2.6 (2.5), and 9.1 (8.6) km, respectively.
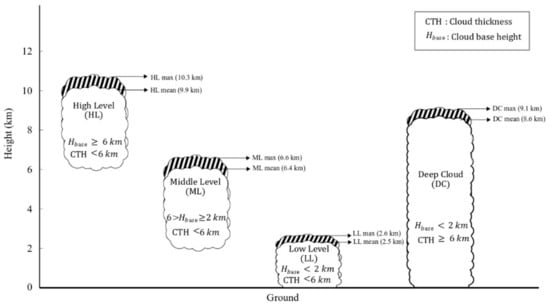
Figure 8.
Cloud classification according to the cloud base height (Hbase) and cloud thickness (CTH) in the Antarctica. (Figure created by author based on information available in the literature.)
Adhikari et al. [25] highlights that cloud occurrences during the four seasons over the Antarctica and the surrounding seas are different in terms of their inter-seasonal variation. Cloud occurrences were greater than 80% in the summer and fall seasons due a high number of cyclonic disturbances affecting the region which resulted in more cloudiness than in the winter and spring seasons. The largest total cloud occurrences were observed at 80% to 90% at the latitude from 60 to 65° S over the ABS sector of the Western Antarctica in all four seasons, whereas less than 20% to 30% occurred over the eastern portion of the Transantarctic Mountains close to 150° E (refer to Figure 4a). Their findings (refer to Figure 6b) also indicated that the western continental region adjacent to the ABS had more than 50% cloud occurrences that were low-level clouds, within 1 to 2 km of the ground, whereas 30% were high-level clouds and extended up to 8 km above the surface. As reported by Adhikari et al. [25], more than 25% of cloud occurrences were observed above heights of 8 km westward of the Antarctic Peninsula (over the ABS Sea) during all seasons except the summer over the land. The cloud occurrence over the ocean was also similar in that more than 25% extended up to 11 km in the winter and spring seasons, whereas in the summer and fall seasons the clouds were infrequently greater than 10 km above the surface.
Therefore, the reports of cloud occurrences with sufficient positive and negative charges inside the cloud resulted in the observations of intense lightning flash occurrences observed in this study. The cloud is the primary source of lightning. Lightning information is useful to explain the electrical activity in thunderstorms and is a sign regarding the orientation of centers of charge in the Antarctic cloud through observation, especially surrounding the Southern Ocean closest to the station of the Carlini Base. Interestingly, the results in Table 2 indicate that +CG were prevalent rather than typical −CG flashes; these storms carry larger percentages of positive charges to ground and the main positive charge region is located in the lower part and a negative charge at the upper part of the storm. The characteristics of the discharge are not similar to the charge distribution in the tropical zone. This type of charge structure is quite similar to that of the storms observed in the Central Plains [13,14,15,16]. It is inferred that the discharge originates from the middle negative charge area and propagates downward to the lower positive region which results in the figure seen in this analysis of greater than 40% +CG flashes.
Adhikari et al. [25] reported in their observations that the Western Antarctica is a region with a high occurrence of cloud; more than 80% during summer and less in winter due to the almost total coverage of the region by sea ice which inhibits transfer of heat, moisture, and momentum [46]. The cold surface temperature and the extent of sea ice greatly influence occurrence in summer and winter seasons in the Antarctica. This finding supports results found in this study in which more than 96% of the CG flashes were observed between February and April during the summer and fall seasons, while less than 4% were seen during the winter and spring seasons, as tabulated in Table 3 and Table 4. The results from this study using two systems are comparable in that higher distributions and number of strokes were recorded by both the LD system and the WWLLN system during the summer and fall seasons between January to April, as shown in Figure 7a,b. As expected, the result in Figure 6 also reveals that CG lightning flash observations were higher for storm regions A, B, and C during the summer and fall seasons between February and April 2017. In addition, the results shown in Figure 7a–d also strongly support the results found in this analysis which are that a higher number of CG lightning stroke occurrences were produced in the summer and fall as compared with the winter and spring seasons. This was expected due to the greater total cloud occurrence in the Antarctica during these seasons. It should be noted that the mean cloud top height and cloud thickness for high-level cloud could reach up to 9.9 km and 1.8 km during winter, and 9.4 km and 1.0 km during summer, respectively. For deep cloud, the mean cloud top height and cloud thickness observed were around 8.6 km and 7.0 km in winter and 8.3 km and 6.8 km in summer. It can be inferred that the cloud structures in the Antarctica during the winter and summer seasons were approximately similar to the cloud structure in Sweden during the summer with low cloud tops [10].
5. Conclusions
This paper has presented the results analyzed from a total of 2,019,923 CG flashes which were detected during 11 months of observation at the Carlini Base station in the Western Antarctica. The analysis that these flashes consisted of 43.01% +CG and 56.99% −CG flashes. Three locations and areas of active composite thunderstorms (storm region A, storm region B, and storm region C) were detected, where lightning strokes occurred more prevalently around the Antarctic Peninsula. Storm region B produced more CG flashes than storm region A and storm region C because storm region B was located closer to the station, i.e., within a radius of 100 km. The important finding to be highlighted from this study is that more than 96% of the CG flashes, including +CG and −CG flashes, were produced during the summer and fall seasons while less than 4% of CG flashes were produced during the winter and spring seasons because of the differences in cloud occurrence over the Antarctic continental (Western and Eastern part) and ocean areas.
Author Contributions
The study was completed with cooperation between all authors; N.Y. as first author collected the data, analyzed the data, and wrote the manuscript; expeditions to C.B. in Antarctica were conducted during the 2016 and 2017 summer campaign by W.S. in collaboration with A.M.G. from the Instituto Antartico Argentino (IAA); M.R.A. gave the idea and checked the validation of measurements analysis; M.A. and V.C. contributed with knowledgeable discussions and suggestions; M.R.M.E. and S.A.M. contributed to data interpretation and to the reviewing process; all authors agreed with the submission of the manuscript.
Funding
This research was funded by the Ministry of Science, Technology and Innovation Malaysia (MOSTI) through the Flagship Programme under the research grant ZF-2014-016 lead by Mardina Abdullah. Participation of Mona Riza Mohd Esa was funded by the UTM GUP Grants: 04G19 and 14J64. Participation of Mohd Riduan Ahmad was funded by the UTeM Short Term Grant (PJP/2018/FKEKK/ (3B)/S01615).
Acknowledgments
The authors wish to thank the Ministry of Science, Technology and Innovation Malaysia (MOSTI) funding through UKM (ZF-2014-016) to conduct this research at the Carlini Base station, Antarctica. The authors would also like to thank the World-Wide Lightning Location Network (WWLLN) (http://wwlln.net), a collaboration among over 50 universities and institutions, for providing the lightning location data used in this paper.
Conflicts of Interest
The authors declare no conflict of interest.
References
- Cooray, V. Mechanism of Lightning Flash. In An Introduction to Light; Springer: Dordrecht, The Netherland, 2015; pp. 91–116. [Google Scholar] [CrossRef]
- Rakov, V.A.; Uman, M.A. Lightning: Physics and Effects; Cambridge University Press: New York, NY, USA, 2003. [Google Scholar]
- Jacobson, A.R.; Heavner, M.J. Comparison of Narrow Bipolar Events with Ordinary Lightning as Proxies for Severe Convection. Mon. Weather Rev. 2005, 133, 1144–1154. [Google Scholar] [CrossRef]
- Suszcynsky, D.M.; Jacobson, A.R.; Linford, J.; Light, T.E.; Musfeldt, A. VHF Lightning Detection and Storm Tracking From GPS Orbit. In Proceedings of the American Meteorological Society Annual Meeting, Atlanta, GA, USA, 27 January–3 February 2006; p. 25. [Google Scholar]
- Dwyer, J.R.; Uman, M.A. The physics of lightning. Phys. Rep. 2014, 534, 147–241. [Google Scholar] [CrossRef]
- Chan, H.G.; Mohamed, A.I. Investigation on the occurrence of positive cloud to ground (+CG) lightning in UMP Pekan. J. Atmos. Sol. Terr. Phys. 2018, 179, 206–213. [Google Scholar] [CrossRef]
- Herrera, J.; Younes, C.; Porras, L. Cloud-to-ground lightning activity in Colombia: A 14-year study using lightning location system data. J. Atmos. Res. 2017. [Google Scholar] [CrossRef]
- Hazmi, A.; Emeraldi, P.; Hamid, M.I.; Takagi, N.; Wang, D. Characterization of positive cloud to ground flashes observed in Indonesia. Atmosphere 2017, 8, 4. [Google Scholar] [CrossRef]
- Fan, X.; Zhang, Y.; Zhang, G.; Zheng, D. Lightning characteristics and electric charge structure of a hail-producing thunderstorm on the Eastern Qinghai-Tibetan Plateau. Atmosphere 2018, 9, 295. [Google Scholar] [CrossRef]
- Ahmad, M.R.; Esa, M.R.M.; Cooray, V.; Baharudin, Z.A.; Hettiarachchi, P. Latitude dependence of narrow bipolar pulse emissions. J. Atmos. Sol. Terr. Phys. 2015, 128, 40–45. [Google Scholar] [CrossRef]
- Rust, W.D.; MacGorman, D.R.; Bruning, E.C.; Weiss, S.A.; Krehbiel, P.R.; Thomas, R.J.; Rison, W.; Hamlin, T.; Harlin, J. Inverted-polarity electrical structures in thunderstorms in the Severe Thunderstorm Electrification and Precipitation Study (STEPS). J. Atmos. Res. 2005, 76, 247–271. [Google Scholar] [CrossRef]
- Carey, L.D.; Rutledge, S.A.; Petersen, W.A. The relationship between severe storm reports and cloud-to-ground lightning polarity in the contiguous United States from 1989 to 1998. Mon. Weather Rev. 2003, 131, 1211–1228. [Google Scholar] [CrossRef]
- Seimon, A. Anomalous cloud-to-ground lightning in an F5-tornadoproducing supercell thunderstorm on 28 August 1990. Bull. Am. Meteorol. Soc. 1993, 74, 189–203. [Google Scholar] [CrossRef]
- MacGorman, D.R.; Burgess, D.W. Positive cloud-to-ground lightning in tornadic storms and hailstorms. Mon. Weather Rev. 1994, 126, 2217–2233. [Google Scholar] [CrossRef]
- Carey, L.D.; Rutledge, S.A. Electrical and multi parameter radar observations of a severe hailstorm. J. Geophys. Res. 1998, 103, 13979–14000. [Google Scholar] [CrossRef]
- Lang, T.J.; Miller, J.; Weisman, M.; Rutledge, S.A.; Barker, L.J., III; Bringi, V.N.; Chandrasekar, V.; Detwiler, A.; Doesken, N.; Helsdon, J.; et al. The Severe Thunderstorm Electrification and Precipitation Study (STEPS). Bull. Am. Meteorol. Soc. 2004, 85, 1107–1125. [Google Scholar] [CrossRef]
- Orville, R.E.; Huffines, G.R. Cloud-to-ground lightning in the United States: NLDN results in the first decade, 1989–98. Mon. Weather Rev. 2001, 129, 1179–1193. [Google Scholar] [CrossRef]
- Li, Y.J.; Zhang, G.S.; Wang, Y.H.; Wu, B.; Li, J. Observation and analysis of electrical structure change and diversity in thunderstorms on the Qinghai-Tibet Plateau. Atmos. Res. 2017, 194, 130–141. [Google Scholar] [CrossRef]
- Wiens, K.C.; Rutledge, S.A.; Tessendorf, S.A. The 29 June 2000 supercell observed during STEPS. Part II: Lightning and charge structure. J. Atmos. Sci. 2005, 62, 4151–4177. [Google Scholar] [CrossRef]
- Suparta, W.; Rashid, Z.A.A.; Ali, M.A.M.; Yatim, B.; Fraser, G.J. Observations of Antarctic precipitable water vapor and its response to the solar activity based on GPS sensing. J. Atmos. Sol. Terr. Phys. 2008, 70, 1419–1447. [Google Scholar] [CrossRef]
- Suparta, W.; Nor, W.; Wan, W.N.A. GPS total electron content variation during the occurrence of atmospheric lightning over Antarctica. Adv. Sci. Lett. 2017, 23, 1264–1267. [Google Scholar] [CrossRef]
- Suparta, W.; Adnan, J.; Ali, M.A.M. Dynamical features of GPS PWV variation associated with lightning activity. Int. J. Remote Sens. 2016, 37, 1376–1390. [Google Scholar] [CrossRef]
- Suparta, W.; Iskandar, A. Modeling of Weight Mean Temperature over the Western Pacific Region to Estimate GPS PWV. In Proceedings of the 2013 IEEE International Conference on Space Science and Communication (IconSpace), Melaka, Malaysia, 1–3 July 2013. [Google Scholar] [CrossRef]
- Walsh, K.J.E.; Simmonds, I.; Collier, M. Sigma-coordinate calculation of topographically forced baroclinicity around Antarctica. Dyn. Atmos. Ocean. 2000, 33, 1–29. [Google Scholar] [CrossRef]
- Adhikari, L.; Wang, Z.; Deng, M. Seasonal variations of Antarctic clouds observed by CloudSat and CALIPSO satellites. J. Geophys. Res. 2012, 117, D04202. [Google Scholar] [CrossRef]
- Suparta, W.; Zainudin, S.K. Precipitation Analysis using GPS Meteorology over Antarctic Peninsula. In Proceedings of the 2015 International Conference on Space Science and Communication (IconSpace), Langkawi, Malaysia, 10–12 August 2015. [Google Scholar] [CrossRef]
- Simmonds, I.; Jacka, T.H. Relationships between the interannual variability of Antarctic sea ice and the Southern Oscillation. J. Clim. 1995, 8, 637–647. [Google Scholar] [CrossRef]
- Turner, J. The El Nino–Southern Oscillation and Antarctica. Int. J. Climatol. 2004, 24, 1–31. [Google Scholar] [CrossRef]
- Fogt, R.L.; Bromwich, D.H. Decadal variability of the ENSO teleconnection to the high-latitude South Pacific governed by coupling with the southern annular mode. J. Clim. 2006, 19, 979–997. [Google Scholar] [CrossRef]
- Pezza, A.B.; Durrant, T.; Simmonds, I. Southern Hemisphere synoptic behavior in extreme phases of SAM, ENSO, sea ice extent, and southern Australia rainfall. J. Clim. 2008, 21, 5566–5584. [Google Scholar] [CrossRef]
- Spinhirne, J.D.; Palm, S.P.; Hart, W.D. Antarctica cloud cover for October 2003 from GLAS satellite lidar profiling. Geophys. Res. Lett. 2005, 32, L22S05. [Google Scholar] [CrossRef]
- Boltek Corporation. LD-350 Lightning Detector Installation/Operators Guide; Boltek Corporation: Welland, ON, Canada, 2011. [Google Scholar]
- Yusop, N.; Ahmad, M.R.; Abdullah, M.; Zainudin, S.K.; Nor, W.N.A.W.M.; Alhasaa, K.M.; Esa, M.R.M.; Sabri, M.H.M.; Suparta, W.; Gulisano, A.M.; et al. Cloud-to-ground lightning observations over the Western Antarctic region. Polar Sci. 2019, 20, 84–91. [Google Scholar] [CrossRef]
- Esa, M.R.M.; Ahmad, M.R.; Cooray, V. Wavelet analysis of the first electric field pulse of lightning flashes in Sweden. Atmos. Res. 2014, 138, 253–267. [Google Scholar] [CrossRef]
- Zhang, H.; Lu, G.; Qie, X.; Jiang, R.; Fan, Y.; Tian, Y.; Sun, Z. Locating narrow bipolar events with single-station measurement of low-frequency magnetic fields. J. Atmos. Sol. Terr. Phys. 2016, 143, 88–101. [Google Scholar] [CrossRef]
- Baharudin, Z.A.; Cooray, V.; Rahman, M.; Hettiarachchi, P.; Ahmad, N.A. On the characteristics of positive lightning ground flashes in Sweden. J. Atmos. Sol. Terr. Phys. 2016, 138, 106–111. [Google Scholar] [CrossRef]
- Johari, D.; Cooray, V.; Rahman, M.; Hettiarachchi, P.; Ismail, M.M. Features of the first and the subsequent return strokes in positive ground flashes based on electric field measurements. Elect. Power Syst. Res. 2017, 150, 55–62. [Google Scholar] [CrossRef]
- Hutchins, M.L.; Holzworth, R.H.; Virts, K.S.; Wallace, J.M.; Heckman, S. Radiated VLF energy differences of land and oceanic lightning. Geophys. Res. Lett. 2013, 40, 2390–2394. [Google Scholar] [CrossRef]
- Souza de, P.E.; Pinto, O., Jr.; Pinto, I.R.C.A.; Ferreira, N.J.; Santos dos, A.F. The intracloud/cloud-to-ground lightning ratio in Southeastern Brazil. Atmos. Res. 2009, 91, 491–499. [Google Scholar] [CrossRef]
- Rakov, V.A. A review of positive and bipolar lightning discharges. Bull. Am. Meteorol. Soc. 2003, 84, 767–776. [Google Scholar] [CrossRef]
- Hutchins, M.L.; Holzworth, R.H.; Rodger, C.J.; Brundell, J.B. Far field power of lightning strokes as measured by the World Wide Lightning Location Network. J. Atmos. Ocean. Technol. 2012, 29, 1102–1110. [Google Scholar] [CrossRef]
- Abarca, S.F.; Corbosiero, K.L.; Galarneau, T.J., Jr. An evaluation of the Worldwide Lightning Location Network (WWLLN) using the National Lightning Detection Network (NLDN) as ground truth. J. Geophys. Res. 2010, 115, D18206. [Google Scholar] [CrossRef]
- Rodger, C.J.; Brundell, J.B.; Holzworth, R.H.; Lay, E.H.; Crosby, N.B.; Huang, T.Y.; Rycroft, M.J. Growing detection efficiency of the world wide lightning location network. AIP Conf. Proc. 2009, 1118, 15–20. [Google Scholar]
- Rudlosky, S.D.; Shea, D.T. Evaluating WWLLN performance relative to TRMM/LIS. Geophys. Res. Lett. 2013, 40, 2344–2348. [Google Scholar] [CrossRef]
- Nicolas, J.P.; Bromwich, D.H. Climate of West Antarctica and influence of marine air intrusions. J. Clim. 2011, 24, 49–67. [Google Scholar] [CrossRef]
- Godfred-Spenning, C.R.; Simmonds, I. An analysis of Antarctic sea-ice and Extratropical cyclone associations. Int. J. Climatol. 1996, 16, 1315–1332. [Google Scholar] [CrossRef]
© 2019 by the authors. Licensee MDPI, Basel, Switzerland. This article is an open access article distributed under the terms and conditions of the Creative Commons Attribution (CC BY) license (http://creativecommons.org/licenses/by/4.0/).