1. Introduction
In recent years, there has been an increase in the concentration of ozone in Japan due to a decrease in NO titration and an increase in transboundary air pollution [
1,
2,
3]. With long-term ozone exposure effects on plants, changes in the carbon allocation, photosynthetic rate [
4], stomatal conductance [
5], yield of crops [
6], and biogenic volatile organic compound (BVOC) emission characteristics [
7] have been reported. The effects of ozone exposure on BVOC emissions have been previously evaluated, and the results of such experiments have not shown a consistent trend with large interspecies variations. In the future, if Japanese forests emit more BVOCs because of an increase in the tropospheric ozone concentration, this may accelerate the increase in ozone concentration as a positive feedback effect because BVOCs play a role as a precursor to ozone. Chatani et al. showed that using a gridded database to estimate BVOC emissions throughout Japan led to significant differences in the concentrations of ozone and secondary organic aerosols in air quality simulations [
8,
9]. Monoterpenes (C
10H
18) are BVOCs that are emitted from coniferous forests in Japan. They are considered to be important because it was estimated that they can produce more than 10 times the amount of ozone compared with isoprene (C
5H
8) [
10]. In the coniferous forests of Japan, Japanese cedar (Sugi,
Cryptomeria japonica) forests are the largest monoterpene emitter. The planted area accounts for 18% of the entire forest (78% of Japan), and it comprises 44% of all artificial forests in Japan.
C. japonica forests are widely planted in urban areas under NO
x-rich conditions. Thus, it is important to evaluate the effect of ozone exposure on the monoterpene emission rate of
C. japonica for human health in urban areas. Our previous report revealed that the monoterpene emission rate of a
C. japonica clone of Yakushima remarkably increased after ozone exposure in the summer [
11]. However, the influence of seasonal changes on interclone variation after ozone exposure has not been investigated. In this study, we hypothesized that there is a difference in the ozone exposure effect on monoterpene emissions between the summer and winter for the three clones of
C. japonica. Thus, we conducted ozone exposure experiments using the free-air ozone enrichment experimental facility in the winter and compared the results with those previously reported from the summer [
11].
2. Experiments
A long-term ozone exposure experiment was conducted at the free-air ozone enrichment experimental facility at the Forestry Research Institute, Tsukuba, Ibaraki Prefecture, Japan [
2]. In this experimental facility, 12 plots each surrounded by stainless-steel frames approximately 9 m
2 in area, 2.5 m in height, and 3 m in width were set up. Ambient ozone concentrations in the control group were continuously monitored using an ozone monitor (EG-3000F; EHARA, Japan), and the ozone concentration in the ozone exposure group was increased using an ozone generator (PZ-1C; KOFLOCK, Japan). The ambient ozone concentration increases during spring and daytime. To reflect the seasonal and daily variation in ozone concentration, the ozone exposure group (Plots A3, A4, B3, B4, C3, and C4;
n = 6) was kept at twice the ambient ozone concentration. This experimental condition was chosen because it exceeded the worst-case scenario for rising ozone concentration [
3]; thus, any effect observed under extreme conditions can be accommodated for. The remaining six plots were kept under ambient ozone concentration, representing the control group (Plots A1, A2, B1, B2, C1, and C2;
n = 6). The letters and numbers in the plot label (e.g., A1) indicate the names of the plots and the location in the facility area, respectively. This experimental facility was equipped with the function to control the CO
2 concentration; however, only the ozone concentration was controlled in this study.
C. japonica has three different genetic backgrounds. Local varieties have been empirically used; however, these differences in the genetic background are not considered in artificial afforestation because it is impossible to distinguish genetic backgrounds by visual observation. Tsumura et al. [
12] carried out a genetic structural analysis of 186 individuals from 14 natural forest populations nationwide, and they found that the populations of
C. japonica were classified as
C. japonica for the Sea of Japan side of the population (Ura-sugi), the Pacific side of the population (Omote-sugi), and the Yakushima Island population (Yaku-sugi). Based on this result, three mother trees representing three major gene pools of
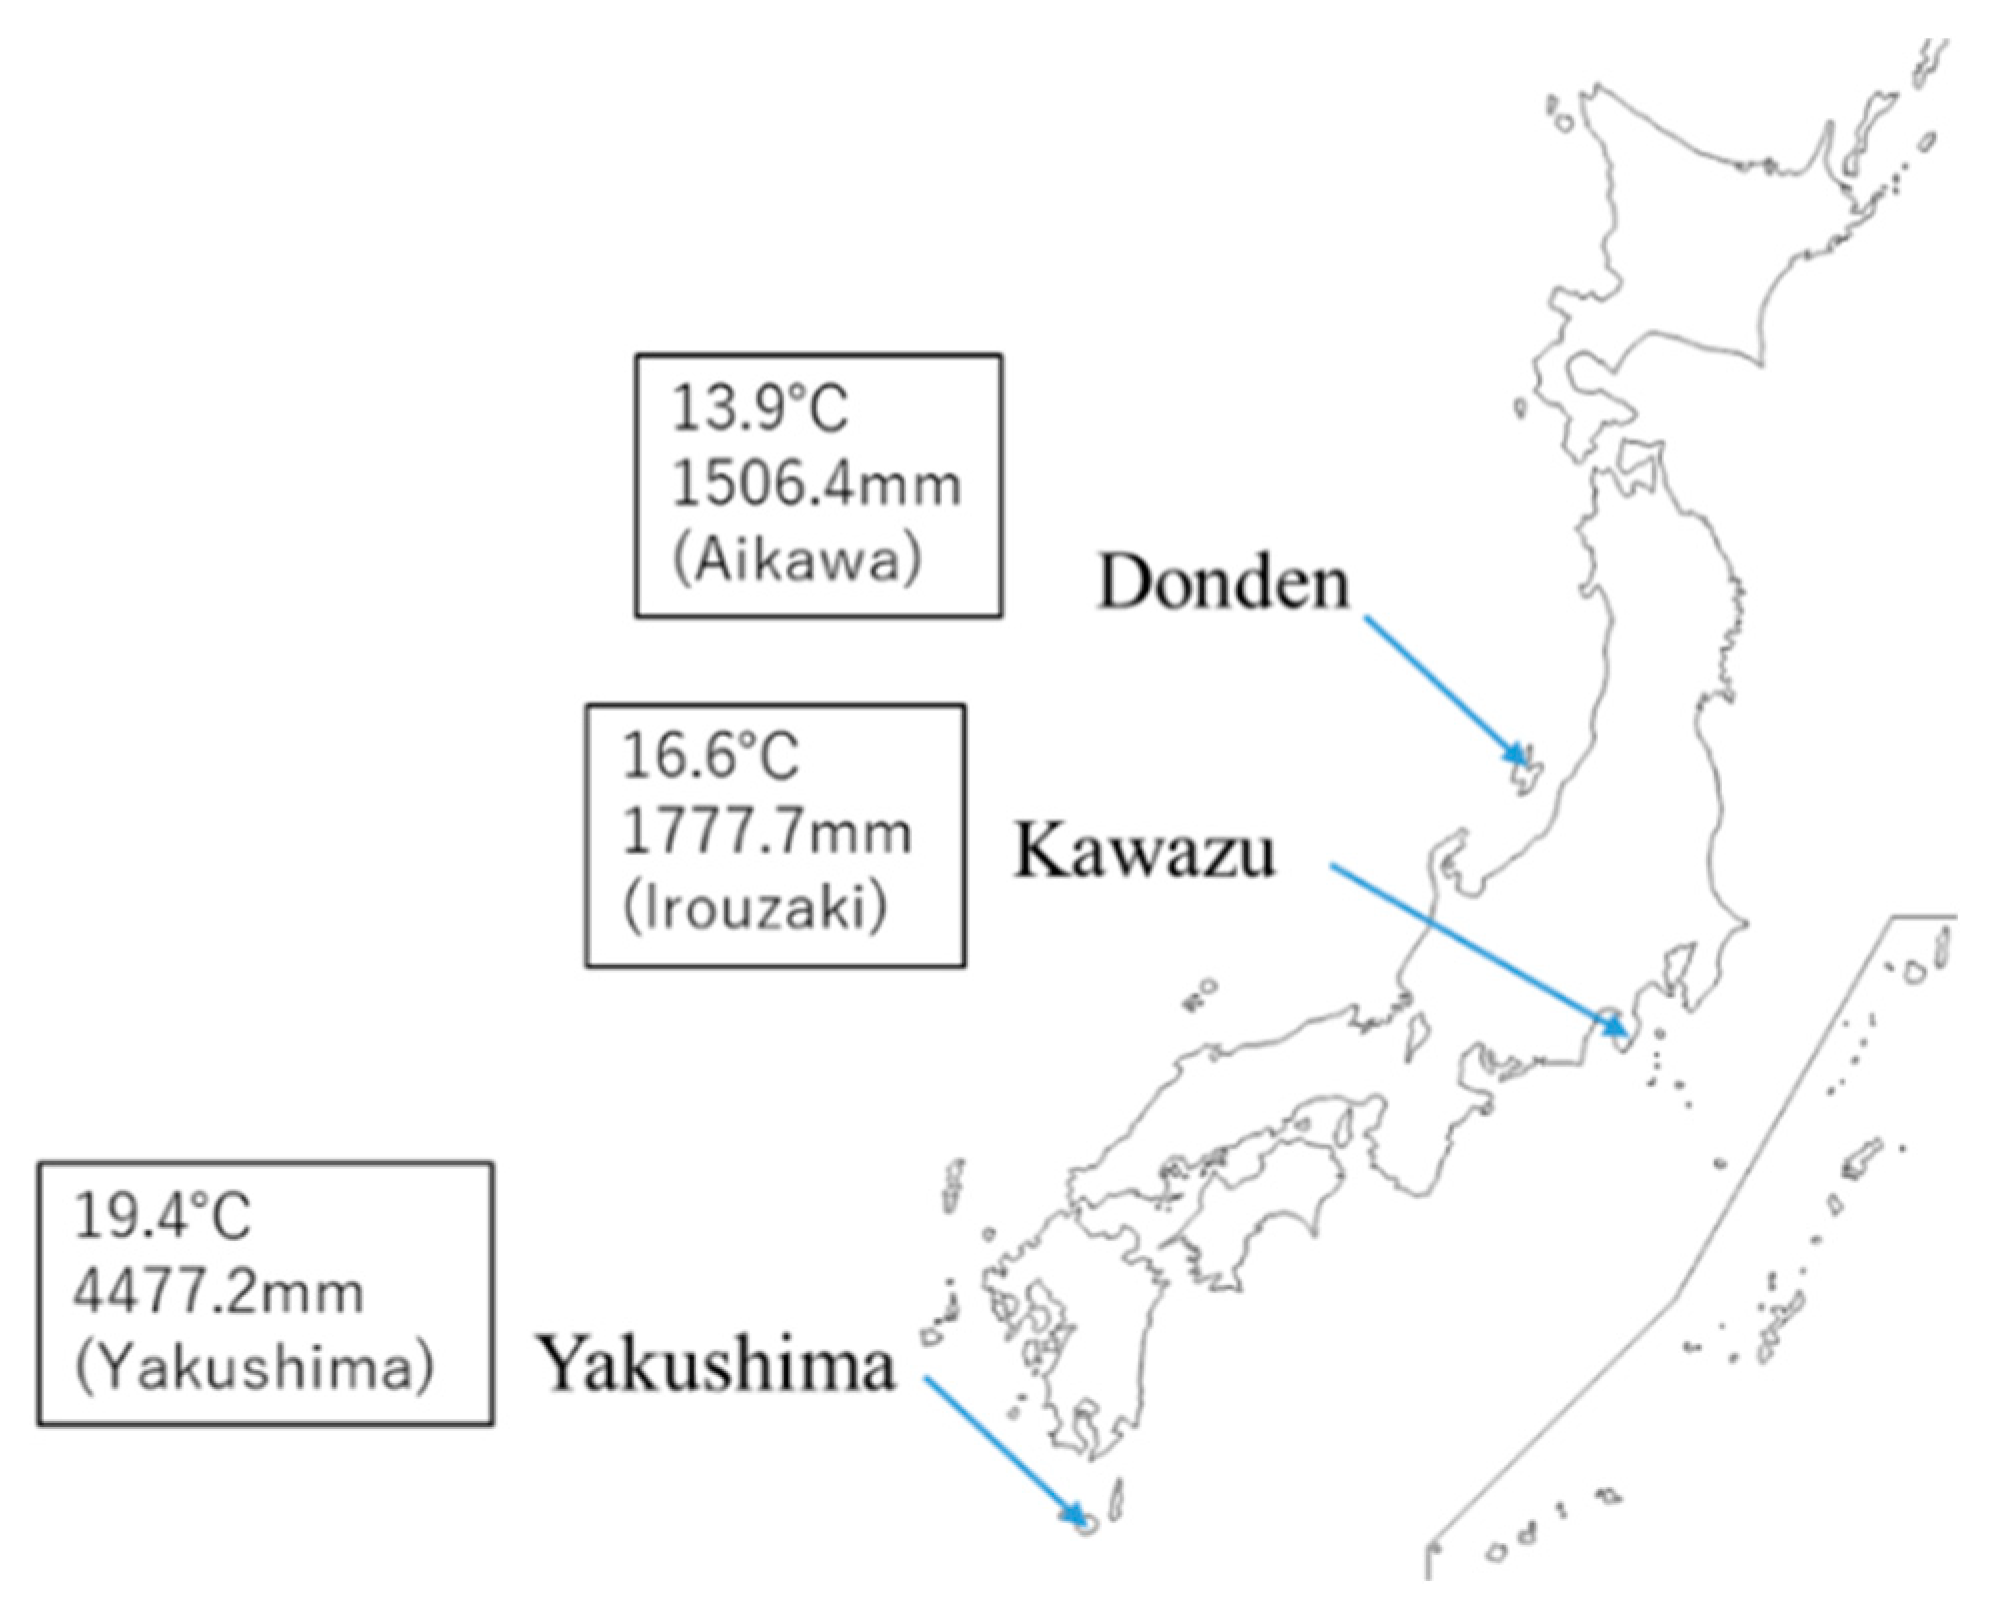
C. japonica from the Genetic Resources Collection of the Forestry and Forest Products Research Institute (FFPRI)—Donden-562 (from Sado Island, Ura-sugi), Kawazu-8 (from Izu Peninsula, Omote-sugi), and Yakushima-4 (from Yakushima Island, Yaku-sugi)—were selected for the evaluation of the interclone variation (
Figure 1). The number (e.g., 562) indicates the identification number of the mother tree in the FFPRI collection. In this paper, clones of the three mother trees are simply abbreviated as Donden, Kawazu, and Yakushima. In April 2015, cuttings were collected from the upper canopy of three mother trees, and they were grown for one year in the green house in FFPRI. The one-year-old clones of Donden, Kawazu, and Yakushima were planted in 12 plots in April 2016. The 12 plots were used for replication in either ozone exposure (
n = 6) or control groups (
n = 6).
The ozone exposure experiment was conducted from May 2016 to January 2018. Since the monoterpene emission rate of the current-year leaves was significantly higher compared to the one-year leaves and because current-year leaves were sensitive to ozone exposure [
11], current-year leaves (
n = 6, approximately 100 mm in length, 0.5–1.0 g dry weight) in the control and ozone exposure groups were sampled in August 2017 and January 2018 [
11].
In field measurement, current-year needle leaves were easily injured by the wind, and the injured leaves irregularly emitted high levels of monoterpene [
11]. To evaluate the sensitivity of the monoterpene emission to temperature increases, it was necessary to adjust the temperature over a wide range. Thus, we conducted laboratory experiments under controlled air temperature without wind using the incubator.
The needle leaves were cut at the experimental facility, quickly supplied with water, and carried to the laboratory within 10 min for measurement of the monoterpene emission rate using the branch enclosure method (
Figure 2) [
11,
13]. Briefly, a transparent perfluoroalkoxy alkane bag was used for the branch enclosure method (JPBP0610; TGK, Japan, L = 150 mm × W = 250 mm). Cleaned dry air (1 L min
−1) filtered by a tank packed with activated carbon and silica gel was supplied to the branch bag through a frame ring (ø 140 mm) made of a polytetrafluoroethylene (PTFE) tube (outer diameter: 6 mm, inner diameter: 4 mm) with holes (ø 1.5 mm) and PTFE connectors (30-6UT-C; Flowell, Japan). The flow rates were controlled using a pump with a mass flow sensor (inlet side: MP-Σ100H, 1.0 L min
−1, outlet side: MP-Σ30N, 0.2 L min
−1; Sibata, Japan) equipped with an AC adapter. The overflow rate of the branch bag was 0.8 L min
−1. The inside air temperatures of the branch bag were monitored using a thermistor (TR-52; T&D, Japan). In the laboratory, we cooled the needle samples in the dark in an incubator (PU-3KT; Espec, Japan) at 5 °C for 60 min to stabilize the monoterpene emission rate before measurement. Then, the air temperature in the incubator was increased in 5 ℃ increments between 5 and 30 °C. The monoterpenes in the sampling air of the outlet side of the bag (0.2 L min
−1) were collected into a sampling tube for 10 min. For the sampling tube, a stainless-steel tube with an outer diameter of 1/4 in. and a length of 90 mm was filled with Carbotrap B (100 mg) and Tenax TA (200 mg) which were divided into two layers. The sampling tubes were preconditioned at 280 °C for 20 min to remove BVOCs and had been stored before measurement at approximately 5 °C in the dark in a refrigerator.
For the analysis method, we followed the methods of a previous report [
11]. Seven compounds of monoterpene were quantified using a gas chromatograph coupled to a mass spectrometer (GC-MS:7890B (GC), 5977A (MSD), Agilent Technology Santa Clara, CA 95051 USA) with an DB-5MS capillary column (60 m × 0.25 mm, 1 μm, Agilent Technology, USA) equipped with a thermal desorption system (ATD:TD-100, MARKES International, Gwaun Elai Medi-Science Campus CF72 8XL UK).
The emission rate of monoterpenes stored in resin pathways in needles is known to increase with increasing temperature and can be expressed using the following equation [
15]:
where
and
(μg g
−1 h
−1) represent the monoterpene emission rate and the estimated basal emission rate, respectively, at standard temperature (30 ℃) and
and
(℃) represent the measured and standard temperatures, respectively.
(℃
−1) is an experimental coefficient that indicates the sensitivity of the monoterpene emission to temperature increases. The following equation was obtained by transforming Equation (1):
where
and
can be obtained from the slope and
-intercept of the regression line between
and
, respectively.
Statistical differences and their interactions were analyzed by analysis of variance (ANOVA) using the Origin Pro 8.1J (OriginLab, USA) program for Windows. Two-way ANOVA was used to investigate the statistical differences between seasons, clones, and their interactions. Bonferroni’s multiple range test was applied to identify the significant differences. The number of samples in each treatment was six (n = 6).
3. Results
To evaluate the effect of ozone exposure on the monoterpene emission in the winter, a summary was prepared, as shown in
Table 1. The same summary style for the summer is shown in a previous report [
11].
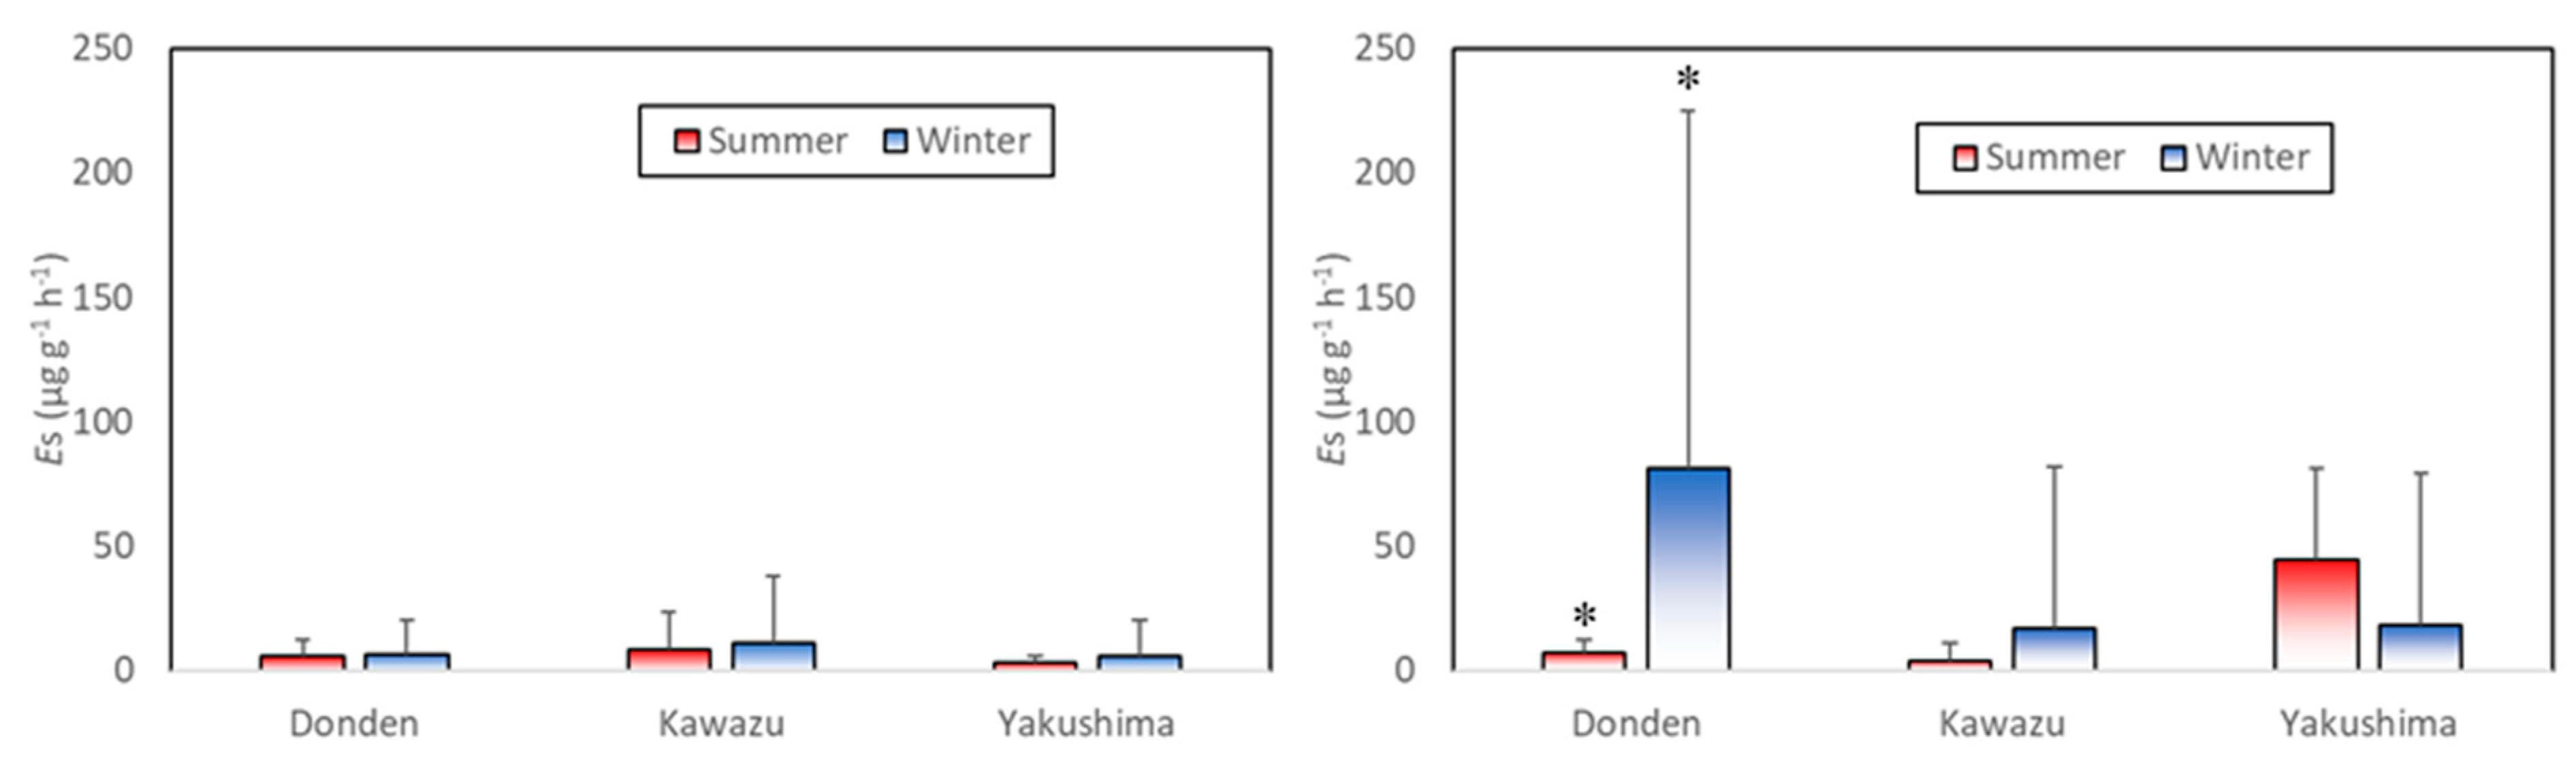
Figure 3 shows the mean basal emission rate (
) in the summer (August) and winter (January). In the control group, three clones had almost the same low level of
. The value of
of the control group in the winter decreased in the following order: Kawazu (11.25 ± 26.35) → Donden (6.48 ± 13.40) → Yakushima (5.60 ± 14.64) (all in μg g
−1 h
−1, mean ± standard deviation (SD),
).
By contrast, the ozone exposure group occasionally possessed a remarkably high . The value of in the ozone exposure group in the winter decreased in the following order: Donden (81.40 ± 143.56) → Kawazu (16.62 ± 64.97) → Yakushima (18.38 ± 60.87) (all in μg g−1 h−1, mean ± SD, ). of Donden in the ozone exposure group was significantly higher in the summer than in the winter ().
In the ozone exposure group, ANOVA showed a significant interaction between the season and clone (
).
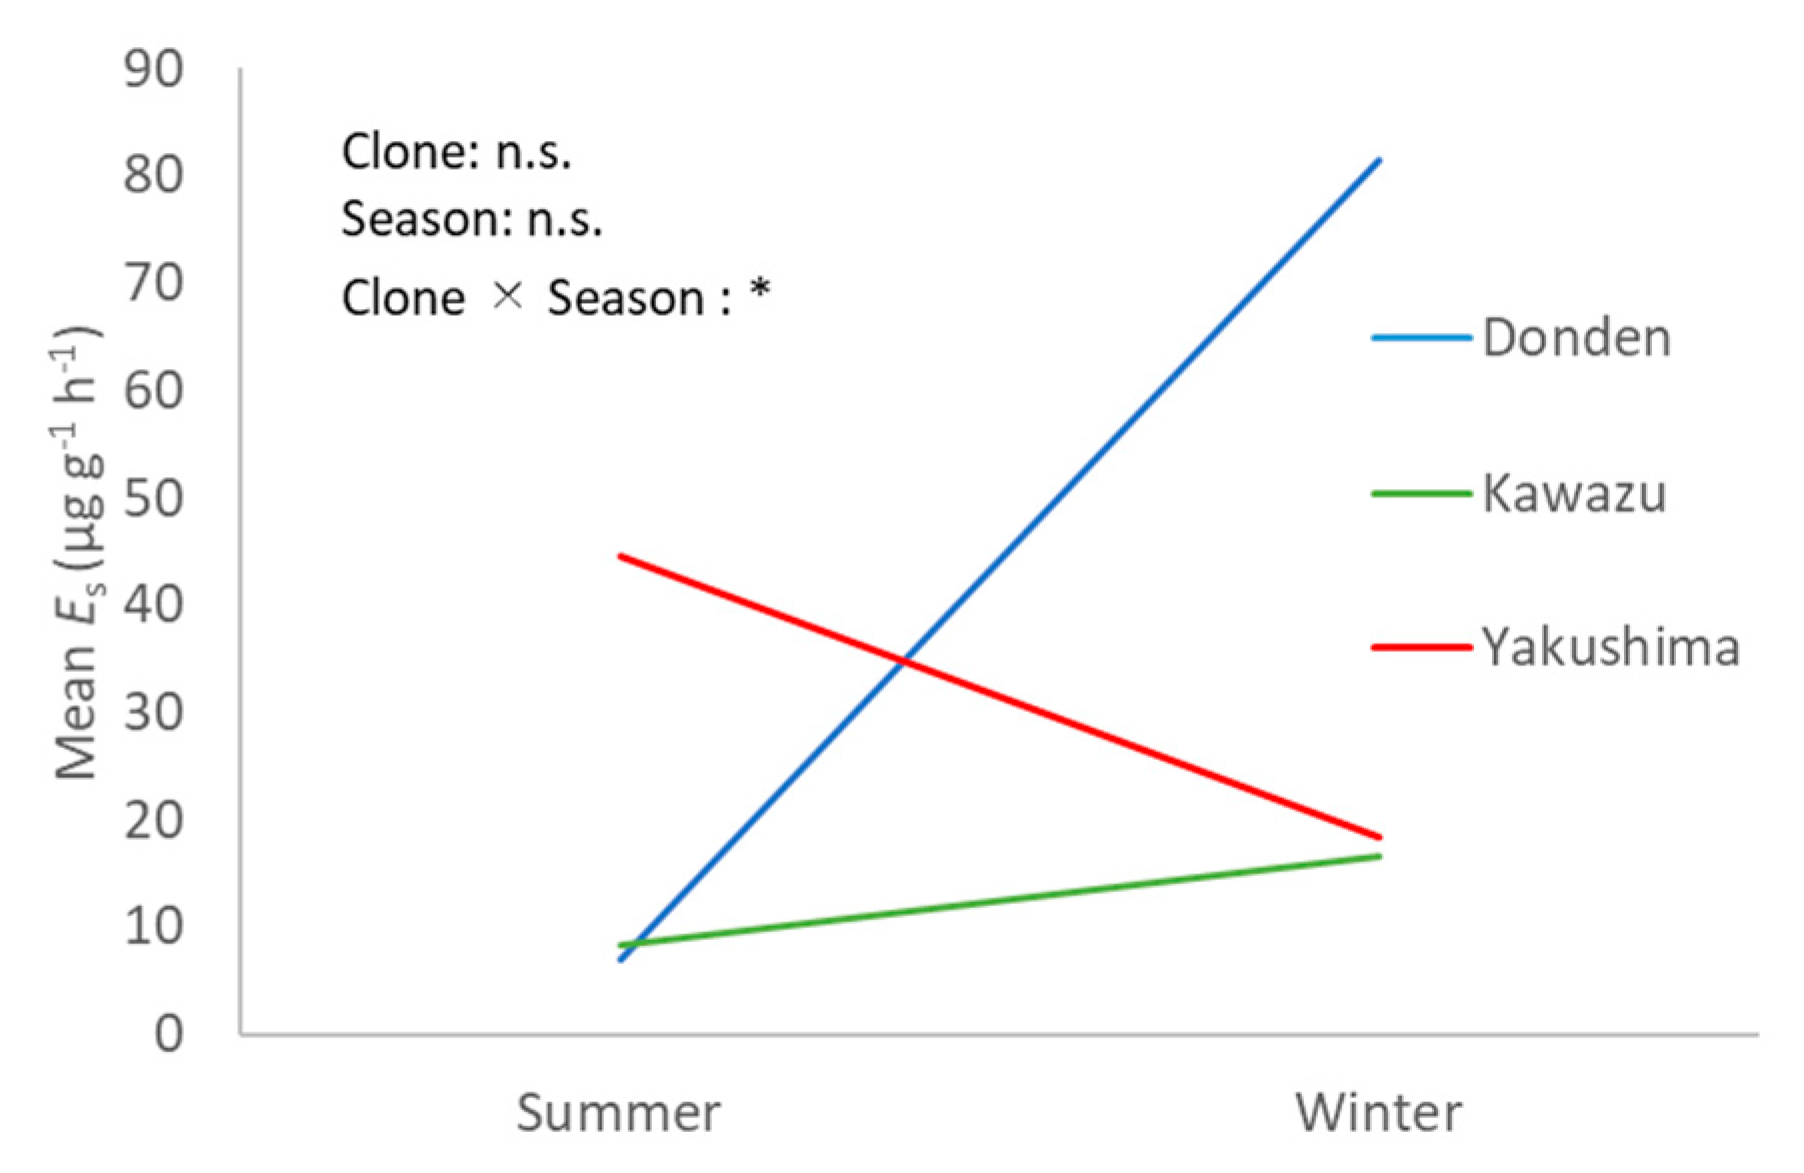
Figure 4 shows the interaction between seasons and clones in the ozone exposure group. The
values of Donden were remarkably higher in winter (
), but the trend was different in Yakushima and Kawazu for the ozone exposure group (not significant). The
values of Yakushima were high in the summer but those of Kawazu were almost identical between the summer and winter.
The seasonal variation in the ozone exposure effect for monoterpene emission may result in very large interclone variations. Moreover, the high SD suggested that the effect of ozone exposure on each individual current-year needle varies even with the same treatment.
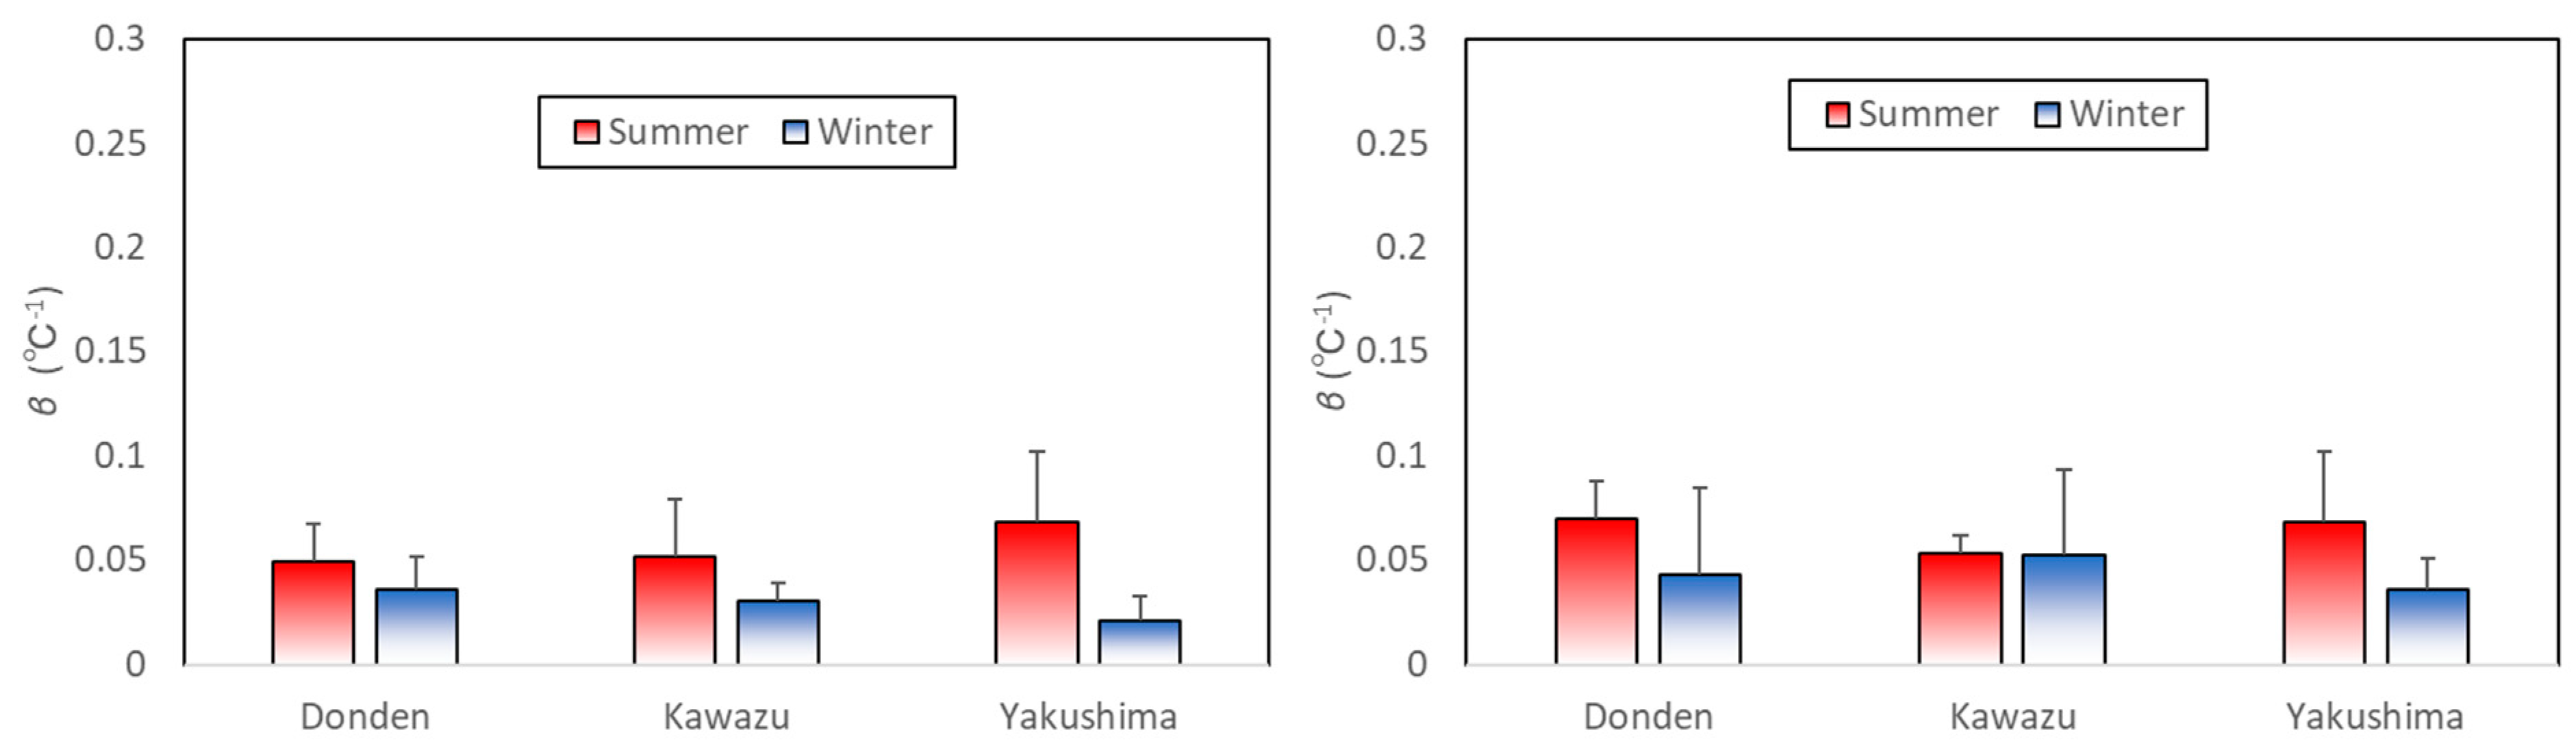
Figure 5 shows a comparison of the mean coefficient
-values for the ozone exposure group between the plots. Coefficient
is a parameter that reflects an increase in the rate of monoterpene emission owing to a temperature increase. The
-values for the control group in the winter for Donden, Kawazu, and Yakushima were 0.036 ± 0.016, 0.030 ± 0.008, and 0.021 ± 0.012 (℃
−1, mean ± SD), respectively. There was no statistically significant difference; however, these mean values were slightly higher than those in the summer [
11]. The
-values in the ozone exposure group in the winter for Donden, Kawazu, and Yakushima were 0.043 ± 0.042, 0.052 ± 0.041, and 0.106 ± 0.178 (℃
−1, mean ± SD), respectively. There was also no statistically significant difference; however, the mean
-value in the ozone exposure group was higher than that in the summer, except for Kawazu [
11].
The weighted average composition ratios for the monoterpenes in each clone in the six plots at 30 °C are shown in
Figure 6. It has been reported that the composition does not significantly change with ozone exposure in the summer, except for Kawazu [
11]. In the control group, seasonal variations in the composition of Kawazu was high. However, in the ozone exposure group, there was a little difference in composition between summer and winter. Potentially, the composition may have seasonal variations; however, the composition in the ozone exposure group may be kept constant, annually, via continuous ozone stress.
4. Discussion
The
C. japonica trees in the control group showed low levels of
. However,
tended to increase in Yakushima in the summer and in Donden in the winter after ozone exposure. In particular,
of Donden in the winter was significantly higher than that in the summer (
). It has been reported in several studies that gymnosperms increase
after ozone exposure; however, the ozone exposure effects were considerably different between tree species, although the mechanism is still poorly understood [
16,
17,
18]. We assumed that one of the reasons for the increase in
in
C.
japonica was physiological changes in the needle leaves after ozone exposure. Our previous study showed that the
C.
japonica needles became thicker and shorter and the stoma density increased after ozone exposure when we used the same free-air ozone enhancement experimental facility [
19]. These tree physiological changes in
C.
japonica needles may be factors that increase the size of the enclosed resin pool in the needles and the emission rate from the stoma. In addition, the timing of this change in shape may be different between clones related to each growing season. A detailed study is needed on the relationship between tree physiological changes and monoterpene emission rate after long-term ozone exposure.
However, there was no clear effect of ozone exposure on
in the winter. Ozone exposure may not significantly affect temperature sensitivity in the winter, although it increased after ozone exposure in the summer [
11]. This seasonal difference may be caused by the change in characteristic needle cuticular wax. It could accumulate in the colder environment of the winter to allow for good maintenance of an amorphous structure. The amorphous structure of the epicuticular wax, which supports the air tightness of the cuticle, could degrade upon ozone exposure [
20,
21]. Comparative observations using scanning electron microscopy would be effective between seasons.
To our best knowledge, there have been no studies evaluating seasonal and interclone differences in
of
C. japonica after ozone exposure based on genetic structure analysis. However, it is well known that
C. japonica has characteristics in which the peak growth of needles is very different between parts of a tree and those in local varieties used for planting [
22]. The composition of monoterpenes, which could potentially change with the season, was maintained in the ozone-exposed group in the winter and summer. The reason may be that monoterpenes were produced longer in the ozone exposure group than during the potential growth period of the control group, providing resistance to ozone exposure stress. The delay in the growth period could also be a factor that affects
. It has been reported that the mean
of
C.
japonica of current-year needles is more than 18 times higher than that of one-year needles [
11]. Thus, younger needles just after extension have very high
values, which may be the cause of the large SD.
We hence hypothesize that Donden is more sensitive to ozone exposure stress in the winter and Yakushima is more sensitive in the summer, and this is related to the younger needles that have very high
due to the delay of growth owing to ozone exposure stress. Of note, the native area of Donden experiences snowfall with wind in the winter and that of Yakushima is a subtropical island with heavy rain in the summer. According to the Japan Meteorological Agency (JMA) [
14], the maximum daily snow depth in January on Sado Island where the mother tree of Donden was sampled is 30 cm, whereas the annual mean precipitation on Yakushima Island where the mother tree of Yakushima was sampled has been 4477 mm from 1981 to 2010. Under stressful growth conditions, Donden and Yakushima may increase
in the winter and summer to quickly recover by changing the growth period. The effect on the physiological changes after ozone exposure may also be strongly correlated with the change in the growth period of each clone. An investigation of the ozone exposure effect on the growth period for each clone and an evaluation of the
values of needles just after development are needed.
Conversely, Kawazu showed a slight change in between the summer and winter (
Figure 4), but the change in composition was larger than that of the others (
Figure 6). Kawazu was characterized by a decrease in the production of sabinene and
d-limonene from the summer to winter. In winter, the Izu Peninsula, which is the native area of Kawazu, is characterized by little rain. The average monthly precipitation for December from 1981 to 2010 was 59.2 mm [
14]. The seasonal variation of Kawazu may be related to the adaptation to drought stress of the native area during winter. In the case of Aleppo pine (
Pinus halepensis), it is reported that leaf concentration of monoterpene decreased by drought during winter [
23]. Should the production of monoterpene under the drought stress in winter cause considerable damage to
C.
japonica, Kawazu may have the characteristics to quickly stop the production of the main components, i.e., sabinene and
d-limonene, in the early stage of winter to prepare for a drought.
Under stress conditions, a variety of reactive oxygen species (ROS) are produced in plant cells. The ROS concentration is regulated by scavenging excess ROS to prevent cytotoxic effect [
24]. Terpenoids, including monoterpenes, act as scavengers for ROS. When the leaves are under stress, ROS reacts with terpenoids containing double bonds which can cause oxidation. The reaction also forms oxidized terpenoids and has been demonstrated to stimulate the expression of defense genes [
25]. For
C.
japonica, accumulating monoterpenes as ROS scavengers in response to stress is considered necessary for survival.
In Japan, the distribution of seedlings of C. japonica for afforestation is strictly defined by the government based on the law. This is because the use of local seedlings has been empirically known to reduce the mortality rate of seedlings after plantation. For example, C. japonica on the Sea of Japan side (Ura-sugi) is known to exhibit relatively strong bacterial resistance even under snow cover, whereas that on the Pacific side (Omote-sugi) is known to show relatively high resistance to drought stress, and that in Yakushima Island (Yaku-sugi) is known to have a very long life span of >2000 years under high temperatures and highly humid climatic conditions. Donden (Ura-sugi), Kawazu (Omote-sugi), and Yakushima (Yaku-sugi) might each have different monoterpene emission characteristics to resist stresses. It remains unclear why local seedlings of C. japonica were suitable for afforestation, but the difference in the emission characteristics of monoterpenes under a stress environment may be one reason.

 ,
, 


