Abstract
We measured volatile organic compounds (VOCs) during the heating, non-heating, and sandstorm periods in the air of the Dushanzi district in NW China and investigated their concentrations, chemical reactivity, and sources. The observed concentrations of total VOCs (TVOCs) were 22.35 ± 17.60, 33.20 ± 34.15, and 17.05 ± 13.61 ppbv in non-heating, heating, and sandstorm periods, respectively. C2-C5 alkanes, C2-C3 alkenes, benzene, and toluene were the most abundant species, contributing more than 60% of the TVOCs. Among these VOCs, alkenes such as propene had the highest chemical reactivity, accounting for more than 60% of total hydroxyl radical loss rate (LOH) and ozone formation potential (OFP). Chemical reactivity was the highest in the heating period. The average reaction rate constant (KOH-avg) and average maximum incremental reactivity coefficient (MIR-avg) of the total observed VOCs were (8.72 ± 1.42) × 10−12 cm3/mol∙s and 2.42 ± 0.16 mol/mol, respectively. The results of the source apportionment via the Positive Matrix Factorization (PMF) model showed that coal combustion (43.08%) and industrial processes (38.86%) were the major sources of VOCs in the air of the Dushanzi district. The contribution of coal combustion to VOCs was the highest in the heating period, while that of industrial solvents and oil volatilization was the lowest.
1. Introduction
Volatile organic compounds (VOCs) are important substances in the atmosphere because they can produce ozone and other oxidants via photochemistry and consequently lead to the increase of atmospheric oxidative capacity and the deterioration of air quality [1,2,3,4]. Toxic VOCs (e.g., benzene, toluene, ethylbenzene, and 1,3-butadiene) can stimulate the human respiratory system, damage the nervous system, and increase the risk of cancer [5,6,7,8].
VOCs from petrochemical industries account for 14.5% of the total VOCs emissions in China [9]. Generally, VOCs in petrochemical industrial areas mainly come from refining, storage tanks, other processes of leakage, and volatilization. Previous studies have reported the characteristics and chemical reactivity of VOCs in the air of petrochemical industrial parks where aromatics, alkanes, alkenes, and halohydrocarbons were detected [10,11,12,13]. Han et al. (2018) [14] found that reducing the emissions of aromatic hydrocarbons and isoprene could effectively reduce the formation of haze in a petrochemical industrial region in the Yangtze River Delta, China. Moghadam et al. (2013) [15] reported that the concentrations of VOCs in the Mahshahr petrochemical area were higher in summer than in winter, with a significant impact of wind speed on the VOCs’ distribution. Tiwari et al. (2010) [16] studied the VOCs in the petrochemical area of Yokohama, Japan, and found that aromatics were the largest group among which toluene was the highest in concentrations and m/p-xylene was the largest in the ozone formation potential (OFP) values. Mao et al. (2018) [17] measured the VOCs in a petrochemical industry park in Northwest China and found that alkanes were the largest group and some alkanes also exhibited the highest OFP values.
The Dushanzi district, covering an area of 448 km2, is located in Xinjiang province, China, at north latitude 44°07′–44°23′, east longitude 84°43′–85°06′. Dushanzi district has a temperate continental climate with less rain and stronger northwest winds during sandstorm (0.96 m/s) and non-heating (0.73 m/s) periods, but with weaker wind during the heating period (0.39 m/s). The temperature was the highest in the non-heating period and the lowest in the heating period. By contrast, relative humidity was the highest during the heating period and lowest during the sandstorm and non-heating periods [18]. The large day-night temperature difference and long sunshine duration provide favorable meteorological conditions for the transformation of VOCs [19]. Dushanzi is one of the most important petrochemical industrial bases in Northwest China. VOC leakage from industrial production has had an adverse impact on the air quality of Dushanzi. According to data provided by the Dushanzi environmental monitoring station (838600), 41% of the days had maximum 8-h average of O3 (MDA8) near the surface exceeding the national standard (0.10 mg/m3) in 2013. Our previous study illustrated the chemical characteristics and oxidative damage of polycyclic aromatic hydrocarbons (PAHs, semi-VOCs) in the ambient air of the Dushanzi residential area [20]. However, at present, no data for VOCs are available in this petrochemical industrial region. Hence, it is essential to investigate the concentrations, chemical reactivity and sources of VOCs in the Dushanzi district.
In this study, we investigated VOCs’ characteristics during the non-heating, heating, and sandstorm periods in the Dushanzi district. We further estimated the chemical reactivity of VOCs by calculating the OFP values and OH∙ loss rate (LOH) and attributed the sources of VOCs via the Positive Matrix Factorization (PMF) model.
2. Experiment and Methods
2.1. Sample Collection
The sampling site was on the rooftop of a residential building in Dushanzi district, Xinjiang (north latitude 44°19’43″, east longitude 84°53’0″). The building is about 25 m above the ground and is taller than its surroundings. The petrochemical industrial area is to the northwest of the sampling site, and Quitun city is to the north (Figure 1). The sampling site is surrounded by residential buildings, commercial streets, and major roads. Therefore, the sampling site is representative of a mixed-use functional area in the Dushanzi district integrating residential, traffic, and industrial impacts. The campaign was conducted during the non-heating (14 to 19 September 2015, n = 21), heating (10 to 16 December 2015, n = 21), and sandstorm (19 to 24 April 2016, n = 19) periods, respectively. One-hour VOC sampling (based on US EPA TO-14) was conducted using 2-L stainless-steel canisters three times a day (9:30–10:30, 14:30–15:30, and 22:30–23:30). The interior surfaces of the canisters were passivated. Each canister was cleaned five times using a high-purity nitrogen gas and evacuated. After that, one of ten canisters was selected and filled with nitrogen for 24 h, and then analyzed to ensure that the target compounds were not detected. During sampling, a filter was added at the front end of the pipeline to prevent particles from entering into canisters. To avoid contamination, the pressure in each canister was about 30 psi with an oil-free pump at the completion of each sampling. After the sampling, the samples were stored at room temperature and sent to the lab for analysis after a month.
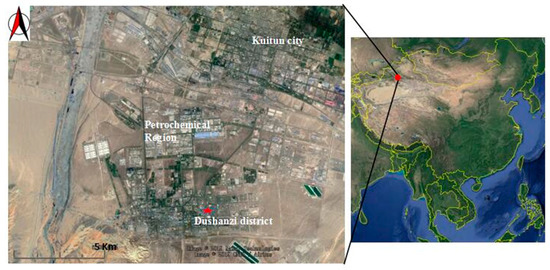
Figure 1.
Location of the sampling site and residential area in the Dushanzi district.
2.2. Chemical Analysis
The VOC samples were analyzed with a Model 7100 preconcentrator (Entech Instrument Inc, USA) coupled with a gas chromatography-mass selective detector/flame ionization detector/electron capture detector (GC-MSD/FID/ECD, 6890/Agilent 5973N and 6890/Agilent 5975). In total, 350 mL of air in each canister was extracted through a three-stage cryogenic trapping system. In the first stage, the VOCs were absorbed on the glass beads at −160 °C and desorbed at 10 °C to enrich the VOC species. In the second stage, the VOCs were trapped at −40 °C and desorbed at 180 °C to remove CO2 and water. Finally, the VOCs were concentrated in a transfer line at −170 °C and heated rapidly to 180 °C for injection into the GC-MSD/FID/ECD system by helium. The VOCs were first separated by a capillary column (HP-1, 60 m × 0.32 mm × 1.0 µm, Agilent Technologies, USA) with helium and then split into two paths: one leading to a PLOT-Q column (30 m × 0.32 mm × 2.0 µm, Agilent Technologies, USA) followed by a FID for the detection of C2-C3 hydrocarbons; and the other was to an MSD for the detection of C4-C11 hydrocarbons. The GC temperature was programmed to −50 °C initially, held for 3 min, increased to 10 °C at 15 °C min−1 and then to 120 °C at 5 °C min−1. Finally, it was increased to 250 °C at 10 °C min−1 and held for 10 min. The MSD was operated in the selected ion monitoring (SIM) mode. Detailed information about the analytical processes is given elsewhere [21]. Quantification was performed by an external calibration method [22]. The target compounds were identified based on their retention time and mass spectrum.
2.3. Quality Assurance and Quality Control
Every day, high-purity nitrogen gas was used as a blank sample to ensure that the target VOCs were not detected. A mixed standard (100 mL) with a concentration of −1 ppbv was also tested every day to check the changes in the instrument responses. If the difference in the responses between the two days exceeded 20%, another calibration curve was generated.
2.4. Data Analysis
2.4.1. Estimation of the Initial Concentration of VOCs
VOCs are a group of reactive substances whose life-time in the air depends highly on chemical reactivity. The concentrations of the hydroxyl radical ([OH]) range from a few hours (e.g., isoprene and α-pinene) to several days (e.g., benzene, propane, and toluene) [23]. A previous study by Gouw et al. (2005) [24] demonstrated that the initial concentrations of VOCs in the air could be estimated based on the losses of VOCs in the air with the hydroxyl radical. Since ethylbenzene (E) and m/p-xylene (X) have the same emission sources [25], we selected E and X to calculate the initial concentrations of each VOC as described in Equations (1) and (2) [26]:
where [VOCi]t and [VOCi]0 are the observed and initial concentrations of each VOC, respectively. Ki is the reaction rate constant of VOCi with the hydroxyl radical [23]. [OH] is the concentration of the hydroxyl radical. Importantly, results do not depend on the assumed [OH] mixing ratio. Δt is the reaction time, and KE and KX are the reaction rate constants of ethylbenzene and m/p-xylene with the hydroxyl radical, respectively. According to previous studies, the [E]/[X] ratios in the petrochemical industry (i.e., solvent use and coal combustion ([E]/[X]t = t0)) were reported to be in the ranges of 0.5–0.7, 0.4–0.5, and 0.3–0.4, respectively [27,28]. We selected an [E]/[X]t = t0 value of 0.5 to calculate Δt and the initial concentration of each VOC with the assumption that the VOCs were well mixed in the air.
2.4.2. Analysis of Ozone Formation Potential
In this study, we estimated the ozone formation potential of each measured VOC and thereby identified the key species in O3 formation. The OFP was calculated as the concentration of each VOC and the maximum incremental reactivity (MIR) coefficient according to Equation (3) [23,29]:
where OFPi is the ozone formation potential of species i, MIRi stands for maximum incremental reactivity coefficient of VOCi.
2.4.3. OH Loss Rate
VOC oxidation with hydroxyl radicals is one of the most important reactions in the air. The chemical reactivity of VOC species can be evaluated by calculating the hydroxyl radical loss rate (LOH) according to Equation (4) [4,19]:
where LiOH is the hydroxyl radical loss rate of [VOCi], [VOCi] is the atmospheric concentration of compound i (molecules/cm3), and KiOH is the reaction rate constant of species i (cm3/molecule∙s), which was reported by [23].
2.4.4. Source Analysis with Positive Matrix Factorization
The Positive Matrix Factorization (PMF) model was used to investigate the sources of VOCs. Detailed information about PMF has been described in the literature [30,31]. PMF 5.0 was used to attribute the sources of VOCs in the air of the Dushanzi district. If the concentrations of VOC species were higher than the method detection limits (MDLs), the uncertainties were calculated via the following equation: uij = [(error coefficient × concentration)2 + MDL2]1/2. Otherwise, the calculation of the uncertainties was uij = MDL × 5/6. Due to the strong reactivity and short life-time of biogenic terpenoids (e.g., isoprene and monoterpenes), we only apportioned anthropogenic VOCs in this study [32,33].
3. Results and Discussion
3.1. Characteristics of VOCs
In this study, a total of 57 VOCs were measured including 25 alkanes, 17 alkenes, 14 aromatics, and 1 alkyne. The observed and initial concentrations of the VOCs are shown in Figure 2. The observed concentrations of the total VOCs (TVOCs) were 22.35 ± 17.60, 33.20 ± 34.15, and 17.05 ± 13.61 ppbv in non-heating, heating, and sandstorm periods, respectively. The initial concentrations of the TVOCs were 31.94 ± 12.20, 34.51 ± 22.60, and 21.48 ± 10.66 ppbv in the non-heating, heating, and sandstorm periods, respectively, which are higher than the observed concentrations by ~18%. Both observed and initial levels of TVOCs were the highest in the heating period. This situation was mainly due to meteorological factors, especially wind speed. The average wind speeds were 2.5, 1.4, and 3.7 m/s, respectively, during the non-heating, heating, and sandstorm periods. High wind speed during the non-heating and sandstorm periods lowered the concentrations of pollutants, while low wind speed during the heating period led to pollutant accumulation [21]. The concentrations of aromatics were the highest in the non-heating period and the lowest in the heating period, likely due to high humidity and low temperatures in the heating period, facilitating the chemical transformation of aromatics from a gas phase to a particle phase [34], and the low temperature was not conducive to volatile aromatics. Low concentrations of aromatics in the sandstorm period were caused by the low temperatures and high wind speeds, which were beneficial to the diffusion of aromatics.
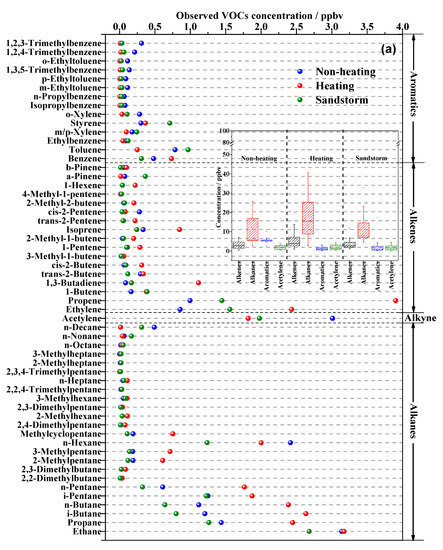
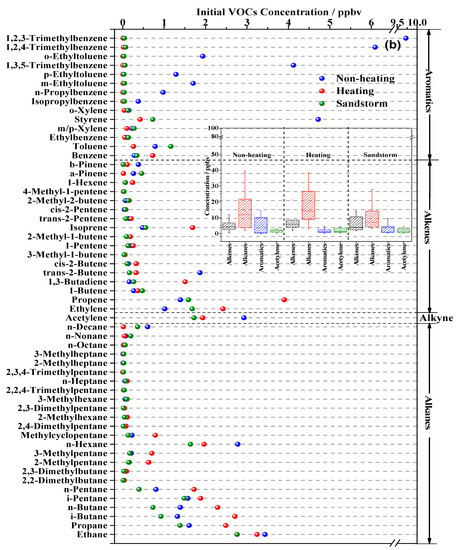
Figure 2.
The (a) observed concentrations and (b) initial concentrations of 57 volatile organic compounds (VOCs) during the non-heating, heating, and sandstorm periods. The inset illustrations represent the observed and initial concentrations of alkenes, alkanes, aromatics, and alkynes during the three sampling periods.
Alkanes were the major species, with a mean concentration of 14.01 ± 14.33 ppbv, followed by alkenes (4.31 ± 4.38 ppbv) and aromatics (2.04 ± 3.32 ppbv). The VOC compositions were similar to those previously reported in petrochemical industrial areas [35,36]. C2-C5 alkanes, C2-C3 alkenes, benzene, and toluene were the most abundant species, accounting for more than 60% of the TVOCs. Acetylene (2.19 ± 2.70 ppbv) contributed 10% of the TVOCs. For the initial VOCs, the fractions of alkenes and aromatics in the initial TVOCs were higher than those in the observed TVOCs, largely due to the high chemical reactivity of alkenes and aromatics.
We compared our measurements with those in other cities of China (Table 1). Dushanzi had lower levels of TVOCs than Nanjing, Guangzhou, Taiyuan, and Jinan, but higher levels than Beijing and Shuozhou. For the major components, alkanes in Dushanzi were lower than those in Nanjing and Guangzhou, and higher than those in Beijing, Taiyuan, Shuozhou, and Jinan. The levels of aromatics in Dushanzi were the lowest among these cities in China.

Table 1.
Observed VOC concentrations compared among major cities in China.
3.2. Chemical Reactivity of VOCs
LOH and OFP were the key parameters describing the chemical reactivity of VOCs. The chemical reactivity of VOCs might be underestimated in this study because the KOH and MIR of some species were not available. Figure 3 shows the LOH and OFP values for each VOC group during the three sampling periods. The chemical reactivity of the initial VOCs was ~20% higher than that of the observed VOCs. Alkenes had the highest chemical reactivity, with contributions of 65% to the total chemical reactivity, followed by alkanes (17%), aromatics (15%), and alkynes (1%). These results are similar to those reported for other cities in China [41,42,43,44], and indicate the priority of alkenes in VOC control. It can be seen that the total LOH and OFP of both the observed and initial VOCs during the heating period were much higher than those in the non-heating and sandstorm periods.
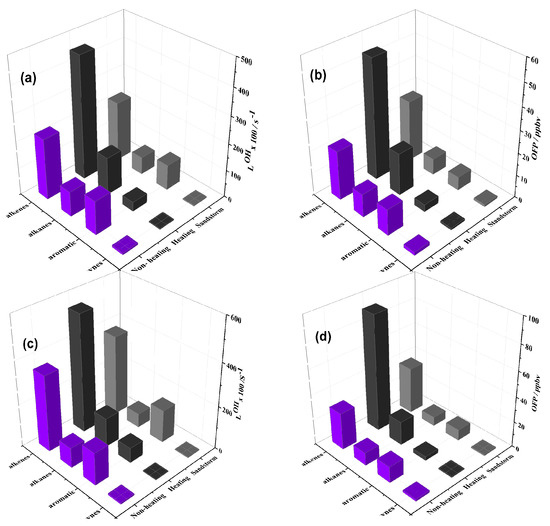
Figure 3.
The observed and (a,b) initial (c,d) average OH∙ loss rate (LOH) and ozone formation potential (OFP) of each group of VOCs of for the non-heating, heating, and sandstorm periods.
Further examination suggested that the C2-C5 alkenes, toluene, and C8 aromatics were the largest contributors to the total LOH, accounting for 70% and 50% of the observed and initial VOCs’ LOH, respectively. For the OFP, C2-C5 alkenes contributed ~60% to the observed VOC OFP, followed by toluene, m/p-xylene, styrene, and o-xylene (7%). Although the LOH and OFP values of the alkanes were relatively low, their contributions to chemical reactivity could not be ignored due to their high concentrations.
The concentrations of O3 were 67.71, 30.04, and 66.79 µg/m3 during the non-heating, heating, and sandstorm periods, respectively, and the consumed VOCs were 9.59, 1.31, and 4.48 ppbv. Thus, the more VOCs that were consumed, the more O3 was generated. C2-C5 alkenes and C7-C9 aromatics were the most important contributors (~60%) to the consumed VOCs. The contributions of α-pinene and β-pinene were also high during the non-heating period.
The top ten species with the highest LOH and OFP values in the atmosphere of Dushanzi (in Table 2) accounted for 62.33%, 70.03%, and 68.68% for total LOH and 64.07%, 78.65%, 74.87% for total OFP during the non-heating, heating, and sandstorm periods, respectively. Propene was the dominant contributor to HO∙ loss and ozone formation, accounting for 12.51%, 26.59%, 18.08% and 18.09%, 31.93%, and 24.00% of the total LOH and OFP during the three sampling periods, respectively. Other large contributors included isoprene, n-hexane, ethylene, and trans-2-butene.

Table 2.
Top ten species with the highest LOH and OFP values in the atmosphere of the Dushanzi district.
3.3. Average Reactivity
Figure 4 shows the significant correlations between the levels of VOCs and the values of LOH and OFP (R2 > 0.7, p < 0.05 for all). Based on the positive linear correlations, we estimated the average reaction rate constant (kOH-avg) of the total VOCs. The kOH-avg in the air of Dushanzi was (8.72 ± 1.42) × 10−12 cm3/molecules∙s for the observed VOCs and (11.62 ± 3.25) × 10−12 cm3/molecules∙s for the initial VOCs, which was close to the kOH vale of ethylene (8.52 × 10⁻¹² cm3/molecules∙s) but much lower than that of propylene (26.3 × 10⁻¹² cm3/molecules∙s) [23]. This suggests that the chemical reactivity of VOCs in the air of Dushanzi was relatively low. Additionally, the average maximum incremental reactivity coefficient (MIR-avg) of the observed and initial VOCs was 2.42 ± 0.16 mol/mol and 2.96 ± 0.29 mol/mol, respectively. This also indicates the relatively low chemical reactivity of the VOCs in the air of Dushanzi.
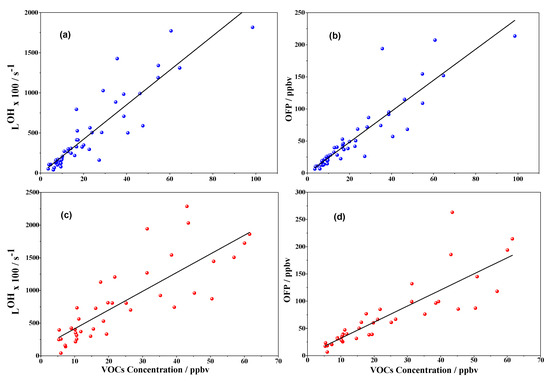
Figure 4.
The relationship between the total LOH/OFP and TVOCs of the (a,b) observed and (c,d) initial VOCs for the sampling periods.
3.4. Source Apportionment by PMF
The PMF model was used to attribute the VOC sources in the air of Dushanzi. Five sources were identified in Dushanzi, including oil volatilization, vehicle exhaust, industrial processes, coal combustion, and industrial solvents (Figure 5).
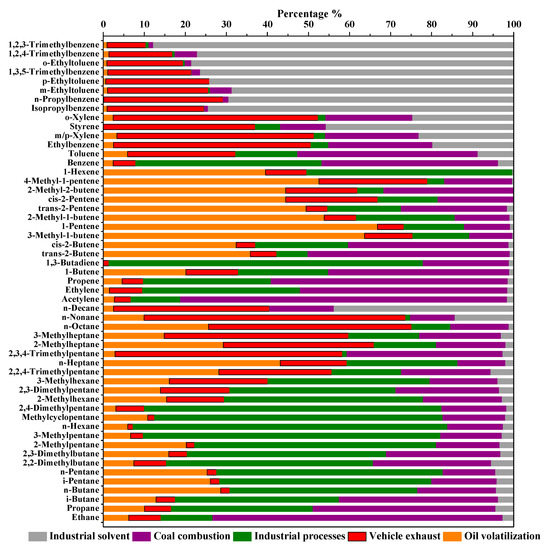
Figure 5.
Source profiles resolved from Positive Matrix Factorization (PMF) during sampling periods in Dushanzi.
Source 1 was characterized by high loads of alkanes (>C5) and alkenes (C4–C6) that were mainly from refueling emission [45]. Previous studies also reported that 1-pentene, i-pentane, and C5–C6 alkanes re-enriched during oil evaporation [21,46]. Hence, source 1 was related to oil volatilization.
Source 2 was characterized by a high percentage of some heavier alkanes (e.g., n-heptane, 2,3,4-trimethylpentane, 2-methylheptane, and 3-methylheptane) which were abundant in diesel exhaust, especially in vehicle-used diesel [46]. N-octane, n-decane, and n-nonane were typical markers of diesel vehicle exhaust [47,48]. Aromatics such as toluene, ethylbenzene, o-xylene, and m/p-xylene in urban areas have been related to motor vehicles [21]. Thus, source 2 was related to vehicle exhaust.
Source 3 was dominated by C3-C6 alkanes (e.g., propane, n-butane, 2,3-dimethylbutane, n-pentane, 2-methylpentane, and n-hexane), benzene, and C2-C4 alkenes (ethylene, propene, and 1,3-butadiene). Industrial process losses can release alkanes and alkenes. For example, n-hexane and ethylene are widely used in the manufacturing industries. Benzene is the basic product in the chemical industries and is also a basic raw material in petrochemical industries [47]. The annual production of i-pentane, n-pentane, and cyclopentane in the Dushanzi district were estimated to be 70,000 tons. Thus, source 3 was related to industrial processes.
Source 4 was characterized by high fractions of ethane, propane, i-butane, acetylene, ethylene, 1-butene, trans-2-butene, and benzene. Acetylene is a typical product of incomplete combustion [49]. Some studies have noted that 1-butene is an indicator for coal-fired power plants [50,51,52]. C2 species such as ethylene, ethane, and acetylene are abundant in the exhaust of coal combustion [53]. As a typical tracer for coal combustion, sulfur dioxide has the same trend as ethane and acetylene (Figure S1). Thus, source 4 was assigned to coal combustion.
Source 5 was dominated by aromatics (ethylbenzene, m-ethyltoluene, p-ethyltoluene, m/p-xylene, styrene, 1,3,5-trimethylbenzene, 1,2,3-trimethylbenzene, and others). Toluene, ethylbenzene, xylene, and 1,3,5-trimethylbenzene are used as organic solvents in various industries and can be regarded as indicator species for industrial solvent volatilization [54]. Therefore, source 5 was identified as industrial solvents.
Figure 6 shows the source apportionment of the VOCs via the PMF model. Coal combustion was the most important contributor (43.08%), and industrial processes (including industrial solvent volatilization and industrial process leakages) accounted for 38.86%. Coal combustion is the main source of energy in the Dushanzi district, so it accounts for the largest proportion. Since Dushanzi has a small population and urban size, the contributions of oil volatilization and vehicle exhaust are relatively small. We then analyzed the VOC sources during the non-heating, heating, and sandstorm periods, respectively (Figure S2). We found that the contribution of coal combustion to VOCs during the heating period was much higher than that of during the other sampling periods (Figure 7). This was mainly due to the increase in coal combustion during the winter. At the same time, industrial solvents and oil contributed less to VOCs because of the lower temperatures during the heating period. The contribution of the sources of VOCs during the non-heating period were similar those in the sandstorm period, because the decrease of coal combustion during the non-heating and sandstorm periods and the higher temperatures and wind speeds lead to a significant increase in the volatilization of industrial solvents and oils.
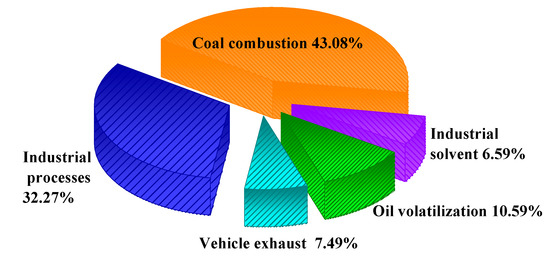
Figure 6.
Source contributions to atmospheric VOCs during sampling periods in Dushanzi.
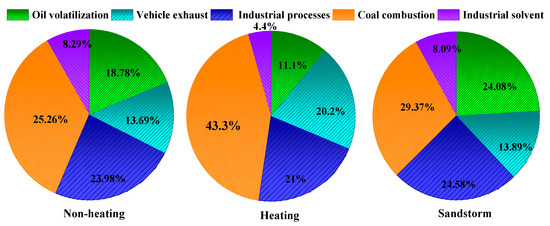
Figure 7.
Contributions of the five sources to VOCs in Dushanzi during three sampling periods.
Supplementary Materials
The following are available online at https://www.mdpi.com/2073-4433/10/11/641/s1, Figure S1: Relationship between ethane or acetylene and SO2 for sampling period; Figure S2: apportionment of VOCs in the non-heating (a), heating (b) and sandstorm (c) sampling periods.
Author Contributions
The study was completed with cooperation between all authors. D.T., X.W., X.D., G.W., Y.Z. have conceived and designed the experiments; X.W. provided the laboratory apparatus and accommodation; D.T., X.D., A.A. have provided valuable comments and suggestions for the modification of the manuscript. G.W., X.Z. have performed graphic processing and data analysis; G.W., X.Z. wrote the paper and X.D. contributed grammar correcting of all text.
Funding
This research was funded by the National Natural Science Foundation of China (Grant No. 41967050), National Key Research and Development Program (2018YFC0213902), and State Key Laboratory of Organic Geochemistry, GIGCAS (SKLOG-201915).
Conflicts of Interest
The authors declare no conflict of interest.
References
- Guo, H.; Ling, Z.H.; Cheng, H.R.; Guo, H.; Ling, Z.H.; Cheng, H.R.; Simpson, I.J.; Lyu, X.P.; Wang, X.M. Tropospheric volatile organic compounds in China. Sci. Total Environ. 2017, 574, 1021–1043. [Google Scholar] [CrossRef]
- Kumar, A.; Alaimo, C.P.; Horowitz, R.; Mitloehner, F.M.; Kleeman, M.J.; Green, P.G. Volatile organic compound emissions from green waste composting: Characterization and ozone formation. Atmos. Environ. 2010, 45, 1841–1848. [Google Scholar] [CrossRef]
- Tsai, J.H.; Hsu, Y.C.; Yang, J.Y. The relationship between volatile organic profiles and emission sources in ozone episode region—A case study in Southern Taiwan. Sci. Total Environ. 2004, 328, 131–142. [Google Scholar] [CrossRef]
- Atkinson, R. Atmospheric chemistry of VOCs and NOx [Review]. Atmos. Environ. 2000, 34, 2063–2101. [Google Scholar] [CrossRef]
- Whittemore, A.S.; Korn, E.L. Asthma and air pollution in the Los Angeles area. Am. J. Public Health 1980, 70, 687–696. [Google Scholar] [CrossRef] [PubMed]
- Ware, J.H.; Spengler, J.D.; Neas, L.M.; Samet, J.M.; Wagner, G.R.; Coultas, D. Respiratory and Irritant Health Effects of Ambient Volatile Organic Compounds: The Kanawha County Health Study. Am. J. Epidemiol. 1993, 137, 1287–1301. [Google Scholar] [CrossRef] [PubMed]
- Phillips, M.; Gleeson, K.; Hughes, J.M.; Greenberg, J.; Cataneo, R.N.; Baker, L. Volatile organic compounds in breath as markers of lung cancer: A cross-sectional study. Lancet 1999, 353, 1930–1933. [Google Scholar] [CrossRef]
- Thepanondh, S.; Varoonphan, J.; Sarutichart, P.; Makkasap, T. Airborne Volatile Organic Compounds and Their Potential Health Impact on the Vicinity of Petrochemical Industrial Complex. Water Air Soil Pollut. 2011, 214, 83–92. [Google Scholar] [CrossRef]
- Chen, Y.; Mou, G.; Jiang, X. On VOCs Control and Countermeasures to the Petrochemical Industry. Manag. Obs. 2015, 4, 67–68. (In Chinese) [Google Scholar]
- Gao, S.; Gao, S.; Gao, Z.J.; Hu, X.C.; Guang, L.X. Development of Source Profiles and Source Tracing of Volatile Organic Compounds in Petrochemical Industry Park. Chem. World 2016, 57, 798–805. (In Chinese) [Google Scholar]
- Mo, Z.; Shao, M.; Lu, S.; Qu, H.; Zhou, M.; Sun, J. Process-specific emission characteristics of volatile organic compounds (VOCs) from petrochemical facilities in the Yangtze River Delta, China. Sci. Total Environ. 2015, 533, 422–431. [Google Scholar] [CrossRef] [PubMed]
- Cetin, E.; Odabasi, M.; Seyfioglu, R. Ambient volatile organic compound (VOC) concentrations around a petrochemical complex and a petroleum refinery. Sci. Total Environ. 2003, 312, 103–112. [Google Scholar] [CrossRef]
- Dong, H.; Zhu, L.; Bian, W.; Jingyun, G.; Kui, C. Pollution characteristics of volatile organic compounds in the summer of Binhai New Aera, Tianjin. Environ. Pollut. Control 2016, 38, 77–81. (In Chinese) [Google Scholar]
- Han, D.; Gao, S.; Fu, Q.; Cheng, J.; Chen, X.; Xu, H. Do volatile organic compounds (VOCs) emitted from petrochemical industries affect regional PM 2.5? Atmos. Res. 2018, 209, 123–130. [Google Scholar] [CrossRef]
- Moghadam, R.M.; Bahrami, A.; Ghorbani, F. Investigation of qualitative and quantitative of volatile organic compounds of ambient air in the mahshahr petrochemical complex in 2009. J. Res. Health Sci. 2013, 13, 69–74. [Google Scholar]
- Tiwari, V.; Hanai, Y.; Masunaga, S. Ambient levels of volatile organic compounds in the vicinity of petrochemical industrial area of Yokohama, Japan. Air Qual. Atmos. Health 2010, 3, 65–75. [Google Scholar] [CrossRef] [PubMed]
- Mao, Y.; Gang, L.I.; Tian-Peng, H.U.; Zheng, H.; An, Y.W.; Min, Y. Characteristics of VOCs Pollution in the Winter Atmosphere of a Typical Petrochemical Industry Park. Environ. Sci. 2018, 39, 525. [Google Scholar] [CrossRef]
- Yusan, T.; Abulizi, A.; Maihemuti, M.; Tursun, Y. Temporal distribution and source apportionment of PM2.5 chemical composition in Xinjiang, NW-China. Atmos. Res. 2019, 218, 257–268. [Google Scholar] [CrossRef]
- Nakashima, Y.; Kamei, N.; Kobayashi, S.; Kajii, Y. Total OH reactivity and VOC analyses for gasoline vehicular exhaust with a chassis dynamometer. Atmos. Environ. 2010, 44, 468–475. [Google Scholar] [CrossRef]
- Turap, Y.; Talifu, D.; Wang, X.; Tuergong, A.; Suwubinuer, R.; Hao, S. Concentration characteristics, source apportionment, and oxidative damage of PM2.5-bound PAHs in petrochemical region in Xinjiang, NW China. Environ. Sci. Pollut. Res. Int. 2018, 25, 22629–22640. [Google Scholar] [CrossRef]
- Yan, Y.; Peng, L.; Li, R.; Li, Y.; Li, L.; Bai, H. Concentration, ozone formation potential and source analysis of volatile organic compounds (VOCs) in a thermal power station centralized area: A study in Shuozhou, China. Environ. Pollut. 2017, 223, 295–304. [Google Scholar] [CrossRef]
- Wang, H.L.; Chen, C.H.; Wang, Q.; Huang, C.; Su, L.Y.; Huang, H.Y. Chemical loss of volatile organic compounds and its impact on the source analysis through a two-year continuous measurement. Atmos. Environ. 2013, 80, 488–498. [Google Scholar] [CrossRef]
- Atkinson, R.; Arey, J. Atmospheric degradation of volatile organic compounds. Chem. Rev. 2003, 103, 4605. [Google Scholar] [CrossRef] [PubMed]
- Gouw, J.A.D.; Middlebrook, A.M.; Warneke, C.; Goldan, P.D.; Kuster, W.C.; Roberts, J.M. Budget of organic carbon in a polluted atmosphere: Results from the New England Air Quality Study in 2002. J. Geophys. Res. 2005, 110, D16305. [Google Scholar] [CrossRef]
- Nelson, P.F.; Quigley, S.M. The m, p-xylenes: Ethylbenzene ratio. A technique to estimating hydrocarbon age in ambient atmospheres. Atmos. Environ. 1983, 17, 659–662. [Google Scholar] [CrossRef]
- Mckeen, S.A.; Liu, S.C. Hydrocarbon ratios and photochemical history of air masses. Geophys. Res. Lett. 2013, 20, 2363–2366. [Google Scholar] [CrossRef]
- Liu, Y.; Shao, M.; Fu, L.; Lu, S.; Zeng, L.; Tang, D. Source profiles of volatile organic compounds (VOCs) measured in China: Part, I. Atmos. Environ. 2008, 42, 6247–6260. [Google Scholar] [CrossRef]
- Wang, H.; Qiao, Y.; Chen, C.; Lu, J.; Dai, H.X.; Qiao, L.P.; Wu, J.P. Source profiles and chemical reactivity of volatile organic compounds from solvent use in Shanghai, China. Aerosol. Air Qual. Res. 2014, 14, 301–310. [Google Scholar] [CrossRef]
- Carter, W.P.L. Development of the SAPRC-07 chemical mechanism. Atmos. Environ. 2010, 44, 5324–5335. [Google Scholar] [CrossRef]
- Paatero, P.; Tapper, U. Positive matrix factorization: A non-negative factor model with optimal utilization of error estimates of data values. Environmetrics. 1994, 5, 111–126. [Google Scholar] [CrossRef]
- Norris, G.R.; Duvall, S.; Brown, A.N.D.; Bai, S. EPA Positive Matrix Factorization (PMF) 5.0 Fundamentals and User Guide; EPA/600/R-14/108 (NTIS PB2015-105147); U.S. Environmental Protection Agency: Washington, DC, USA, 2014. [Google Scholar]
- Brown, S.G.; Frankel, A.; Hafner, H.R. Source apportionment of VOCs in the Los Angeles area using positive matrix factorization. Atmos. Environ. 2007, 41, 227–237. [Google Scholar] [CrossRef]
- Atkinson, R. Gas-phase degradation of organic compounds in the troposphere. Pure Appl. Chem. 1998, 70, 1327–1334. [Google Scholar] [CrossRef]
- Goss, K.U. Effects of temperature and relative-humidity on the sorption of organic vapors on quartz sand. Environ. Sci. Technol. 1992, 26, 868. [Google Scholar] [CrossRef]
- Ras, M.R.; Marcé, R.M.; Borrull, F. Characterization of ozone precursor volatile organic compounds in urban atmospheres and around the petrochemical industry in the Tarragona region. Sci. Total Environ. 2009, 407, 4312–4319. [Google Scholar] [CrossRef]
- Gao, J.; Zhang, C.L.; Wang, B.G.; Zhi, J.Z.; Dao, C.G. Emission characteristics of volatile organic compounds emitted from an ethylene process unit in petrochemical industry based on blow-through method. China Environ. Sci. 2016, 36, 694–701. (In Chinese) [Google Scholar]
- Li, J.; Wu, R.; Li, Y.; Hao, Y.; Xie, S.; Zeng, L. Effects of rigorous emission controls on reducing ambient volatile organic compounds in Beijing, China. Sci. Total Environ. 2016, 557–558, 531–541. [Google Scholar] [CrossRef]
- Xia, L.; Cai, C.; Zhu, B. Source apportionment of VOCs in a suburb of Nanjing, China, in autumn and winter. J. Atmos. Chem. 2014, 71, 175–193. [Google Scholar] [CrossRef]
- Li, L.J. A Preliminary Study on Characteristics and Source of Volatile Organic Compounds in the Urban Area of Shuozhou; Taiyuan University of Technology: Shanxi, China, 2015. (In Chinese) [Google Scholar]
- Liu, Z.; Li, N.; Wang, N. Characterization and source identification of ambient VOCs in Jinan, China. Air Qual. Atmos. Health 2015, 9, 285–291. [Google Scholar] [CrossRef]
- Mei, W.; Li-Li, G.; Yu-Long, Y.; Qiu-Sheng, H.E.; Wang, X.M. Exposure Characteristics of Atmospheric Toxic Volatile Organic Compounds to Populations in Public Places in Taiyuan, China. Res. Environ. Sci. 2014, 27, 1236–1242. [Google Scholar] [CrossRef]
- Wang, Q.; Chen, C.H.; Wang, H.L.; Zhou, M.; Chen, M.H. Forming potential of secondary organic aerosols and sources apportionment of VOCs in autumn of Shanghai, China. Environ. Sci. 2013, 34, 424–433. (In Chinese) [Google Scholar]
- Lyu, X.P.; Chen, N.; Guo, H.; Zhang, W.H.; Liu, M. Ambient volatile organic compounds and their effect on ozone production in Wuhan, central China. Sci. Total Environ. 2016, 541, 200–209. [Google Scholar] [CrossRef] [PubMed]
- Gao, Z.; Gao, S.; Cui, H.; Fu, Q.; Jin, D.; Liang, G.; Fang, F. Characteristics and chemical reactivity of VOCs during a typical photochemical episode in summer at a chemical industrial area. Acta Sci. Circumstantiae 2017, 37, 1251–1259. (In Chinese) [Google Scholar]
- He, Q.; Yan, Y.; Li, H.; Zhang, Y.; Chen, L.; Wang, Y. Characteristics and reactivity of volatile organic compounds from non-coal emission sources in China. Atmos. Environ. 2015, 115, 153–162. [Google Scholar] [CrossRef]
- Zhang, Y.; Wang, X.; Zhang, Z.; Lü, S.; Huang, Z.; Li, L. Sources of C₂-C₄ alkenes, the most important ozone nonmethane hydrocarbon precursors in the Pearl River Delta region. Sci. Total Environ. 2015, 502, 236–245. [Google Scholar] [CrossRef] [PubMed]
- Yuan, Z.; Lau, A.K.H.; Shao, M.; Louie, P.K.K.; Liu, S.C.; Zhu, T. Source analysis of volatile organic compounds by positive matrix factorization in urban and rural environments in Beijing. J. Geophys. Res. Atmos. 2009, 114, 4723–4734. [Google Scholar] [CrossRef]
- Song, Y.; Dai, W.; Shao, M.; Liu, Y.; Lu, S.; Kuster, W. Comparison of receptor models for source apportionment of volatile organic compounds in Beijing, China. Environ. Pollut. 2008, 156, 174. [Google Scholar] [CrossRef]
- Barletta, B.; Meinardi, S.; Sherwood Rowland, F.; Chan, C.Y.; Wang, X.; Zou, S. Volatile organic compounds in 43 Chinese cities. Atmos. Environ. 2005, 39, 5979–5990. [Google Scholar] [CrossRef]
- Santos, C.Y.M.D. Atmospheric distribution of organic compounds from urban areas near a coal-fired power station. Atmos. Environ. 2004, 38, 1247–1257. [Google Scholar] [CrossRef]
- Fernández-Martínez, G.; López-Vilariño, J.M.; López-Mahía, P.; Muniategui-Lorenzo, S.; Prada-Rodríguez, D.; Fernández-Fernández, E. Determination of Volatile Organic Compounds in Emissions by Coal-Fired Power Stations from Spain. Environ. Technol. 2001, 22, 567–575. [Google Scholar] [CrossRef]
- Fernández-MartíNez, G.; López-MahíA, P.; Muniategui-Lorenzo, S.; Prada-Rodrıguez, D.; Fernandez-Fernandez, E. Distribution of volatile organic compounds during the combustion process in coal-fired power stations. Atmos. Environ. 2001, 35, 5823–5831. [Google Scholar] [CrossRef]
- Liu, P.W.; Yao, Y.C.; Tsai, J.H.; Hsu, Y.C.; Chang, L.P.; Chang, K.H. Source impacts by volatile organic compounds in an industrial city of southern Taiwan. Sci. Total Environ. 2008, 398, 154–163. [Google Scholar] [CrossRef] [PubMed]
- Borbon, A.; Locoge, N.; Veillerot, M.; Galloo, J.C.; Guillermo, R. Characterisation of NMHCs in a French urban atmosphere: Overview of the main sources. Sci. Total Environ. 2002, 292, 177–191. [Google Scholar] [CrossRef]
© 2019 by the authors. Licensee MDPI, Basel, Switzerland. This article is an open access article distributed under the terms and conditions of the Creative Commons Attribution (CC BY) license (http://creativecommons.org/licenses/by/4.0/).