Article

Evaluation of the Field Performance and Economic Feasibility of Mechanized Onion Production in the Republic of Korea

1
Department of Bio-Industrial Machinery Engineering, College of Agriculture and Life Sciences, Kyungpook National University, Daegu 41566, Republic of Korea
2
Department of Smart Bio-Industrial Mechanical Engineering, College of Agriculture and Life Sciences, Kyungpook National University, Daegu 41566, Republic of Korea
3
Upland Field Machinery Research Center, Kyungpook National University, Daegu 41566, Republic of Korea
*
Author to whom correspondence should be addressed.
Agronomy 2025, 15(7), 1721; https://doi.org/10.3390/agronomy15071721
Submission received: 26 May 2025 / Revised: 3 July 2025 / Accepted: 13 July 2025 / Published: 17 July 2025

Abstract

Onion cultivation in the Republic of Korea is increasingly threatened by labor shortages and an aging rural population, underscoring the growing importance of mechanization. This study evaluated the combined and individual performances and economic feasibility of mechanized transplanting, stem cutting, harvesting, and collecting operations using work efficiency; the missing plant, stem cutting, damage, and dropout rates; and foreign matter content as indicators. Mechanized operations achieved up to 358-fold higher work efficiencies than manual labor operations. However, in terms of marketability, performance was inferior due to missing plants, improperly cut stems, damaged bulbs, dropped onions, and foreign matter contamination. The economic analysis indicated that the use of individual machines is advantageous for farms larger than 10.2 ha for transplanting, 1.14 ha for stem cutting, 0 ha for harvesting (i.e., profitable regardless of farm size), and 6.95 ha for collecting. For fully mechanized operations, using machines for all four processes, the break-even area was found to be 3.63 ha, with a payback period of 2.1 years. These findings are expected to serve as a foundational reference for onion growers considering the adoption of mechanization.

1. Introduction

Korean agriculture is facing a serious crisis due to continued declines in the population of the agricultural workforce, along with the rapid aging of the rural workforce [1]. These structural issues have led to severe labor shortages in rural areas, posing a significant threat to national food security. The population of individuals involved in agriculture was approximately 4.03 million in 2000, declining by 48.2% to about 2.089 million in 2023. During the same period, the aging index of the rural population (i.e., the number of elderly people aged 65 and over per 100 youths aged 14 and under) surged from 190.9 to 1739.5. As of 2023, farmers aged 65 and older numbered 1.099 million, accounting for 52.0% of the total agricultural population, further demonstrating the severity of aging in the agricultural sector [2]. This shift in the labor force structure threatens the sustainability of agriculture and underscores the urgent need for mechanization and technological innovation [3]. Mechanization in the production of key crops is expected to play a critical role in enhancing Korea’s global agricultural competitiveness and ensuring national food security.
Onions are a high-value crop and the most widely cultivated seasoning vegetable in Korea [4]. Seasoning vegetable category crops include chili peppers, green onions, ginger, and garlic. In 2023, the total production volume of seasoning vegetables in Korea was 2.17 million tons, according to national agricultural statistics, with onion production at 1.17 million tons (54%), significantly exceeding those of chili pepper (21%), garlic (15%), green onion (9%), and ginger (1%) [5]. Despite its high cultivation share, the rate of mechanization in onion farming remains at 70.6%, which is lower than the average for upland crops (73.7%) and substantially lower than that for paddy crops (99.8%), and mechanization rates for the labor-intensive transplanting and harvesting stages are only 24.8% and 36.2%, respectively, indicating an urgent need for mechanization in these processes [6,7]. However, mechanization in Korean upland crop production remains largely focused on improving the performance of individual implements, with limited integration or validation of full-process mechanization systems. To strengthen the competitiveness of Korea’s upland crop industry, it is essential to analyze the performance of existing agricultural machinery and establish a systematic mechanization strategy.
Although several machines applicable to onion farming have been developed, such as seeders, transplanters, harvesters, and collectors, most previous studies have focused on the design and operational performance of individual machines. Additionally, performance evaluations have typically been conducted in isolation, targeting only a specific stage of the cultivation process. For example, Hong et al. [8] analyzed the cutting efficiency of a tractor-mounted onion stem cutter under varying engine speeds, while Do et al. [9] examined the power requirements of a self-propelled garlic collector at different travel speeds. Kumawat and Raheman [10] evaluated the performance of a hand tractor-powered onion digger-cum-conveyor by analyzing draft force requirements at varying rake angles and digging depths. Choi et al. [11] developed a gathering-type garlic harvester and evaluated its performance based on damage, harvest, and loss rates. Similarly, Lee et al. [12] assessed onion harvesting operations, limited to stem cutting, harvesting, and collecting operations, using indicators such as the stem-cutting, damage, and loss rates and harvesting efficiency.
While a few studies have incorporated economic evaluations, they have also typically focused on individual machines rather than the entire cultivation process. For instance, Kim et al. [13] evaluated a self-propelled potato harvester using indicators like field capacity, damage rate, loss rate, and foreign material content, comparing its economic feasibility with that of a conventional tractor-mounted harvester. Similarly, to evaluate its economic feasibility, Kim et al. [14] compared the total hourly cost, field capacity, and cost per 1000 m2 of a tractor-mounted multi-working machine with those of individual machines performing tillage, land leveling, sowing, and covering operations, and Koo and Kim [15] analyzed the field capacity and operating cost of an integrated tractor implement for flat ridge preparation, finding that it offered higher efficiency and lower cost per unit area than using individual machines. Though valuable, such analyses remain limited in scope, addressing only a single stage of operation and lacking a holistic view that addresses real-world applicability across multiple processes.
To address these limitations, the present study adopts an integrated approach by evaluating the combined performance of mechanized transplanting and harvesting operations, addressing the major parts of the onion farming process. Furthermore, it conducts an economic analysis that simultaneously considers both operations, offering a more comprehensive and field-relevant perspective.
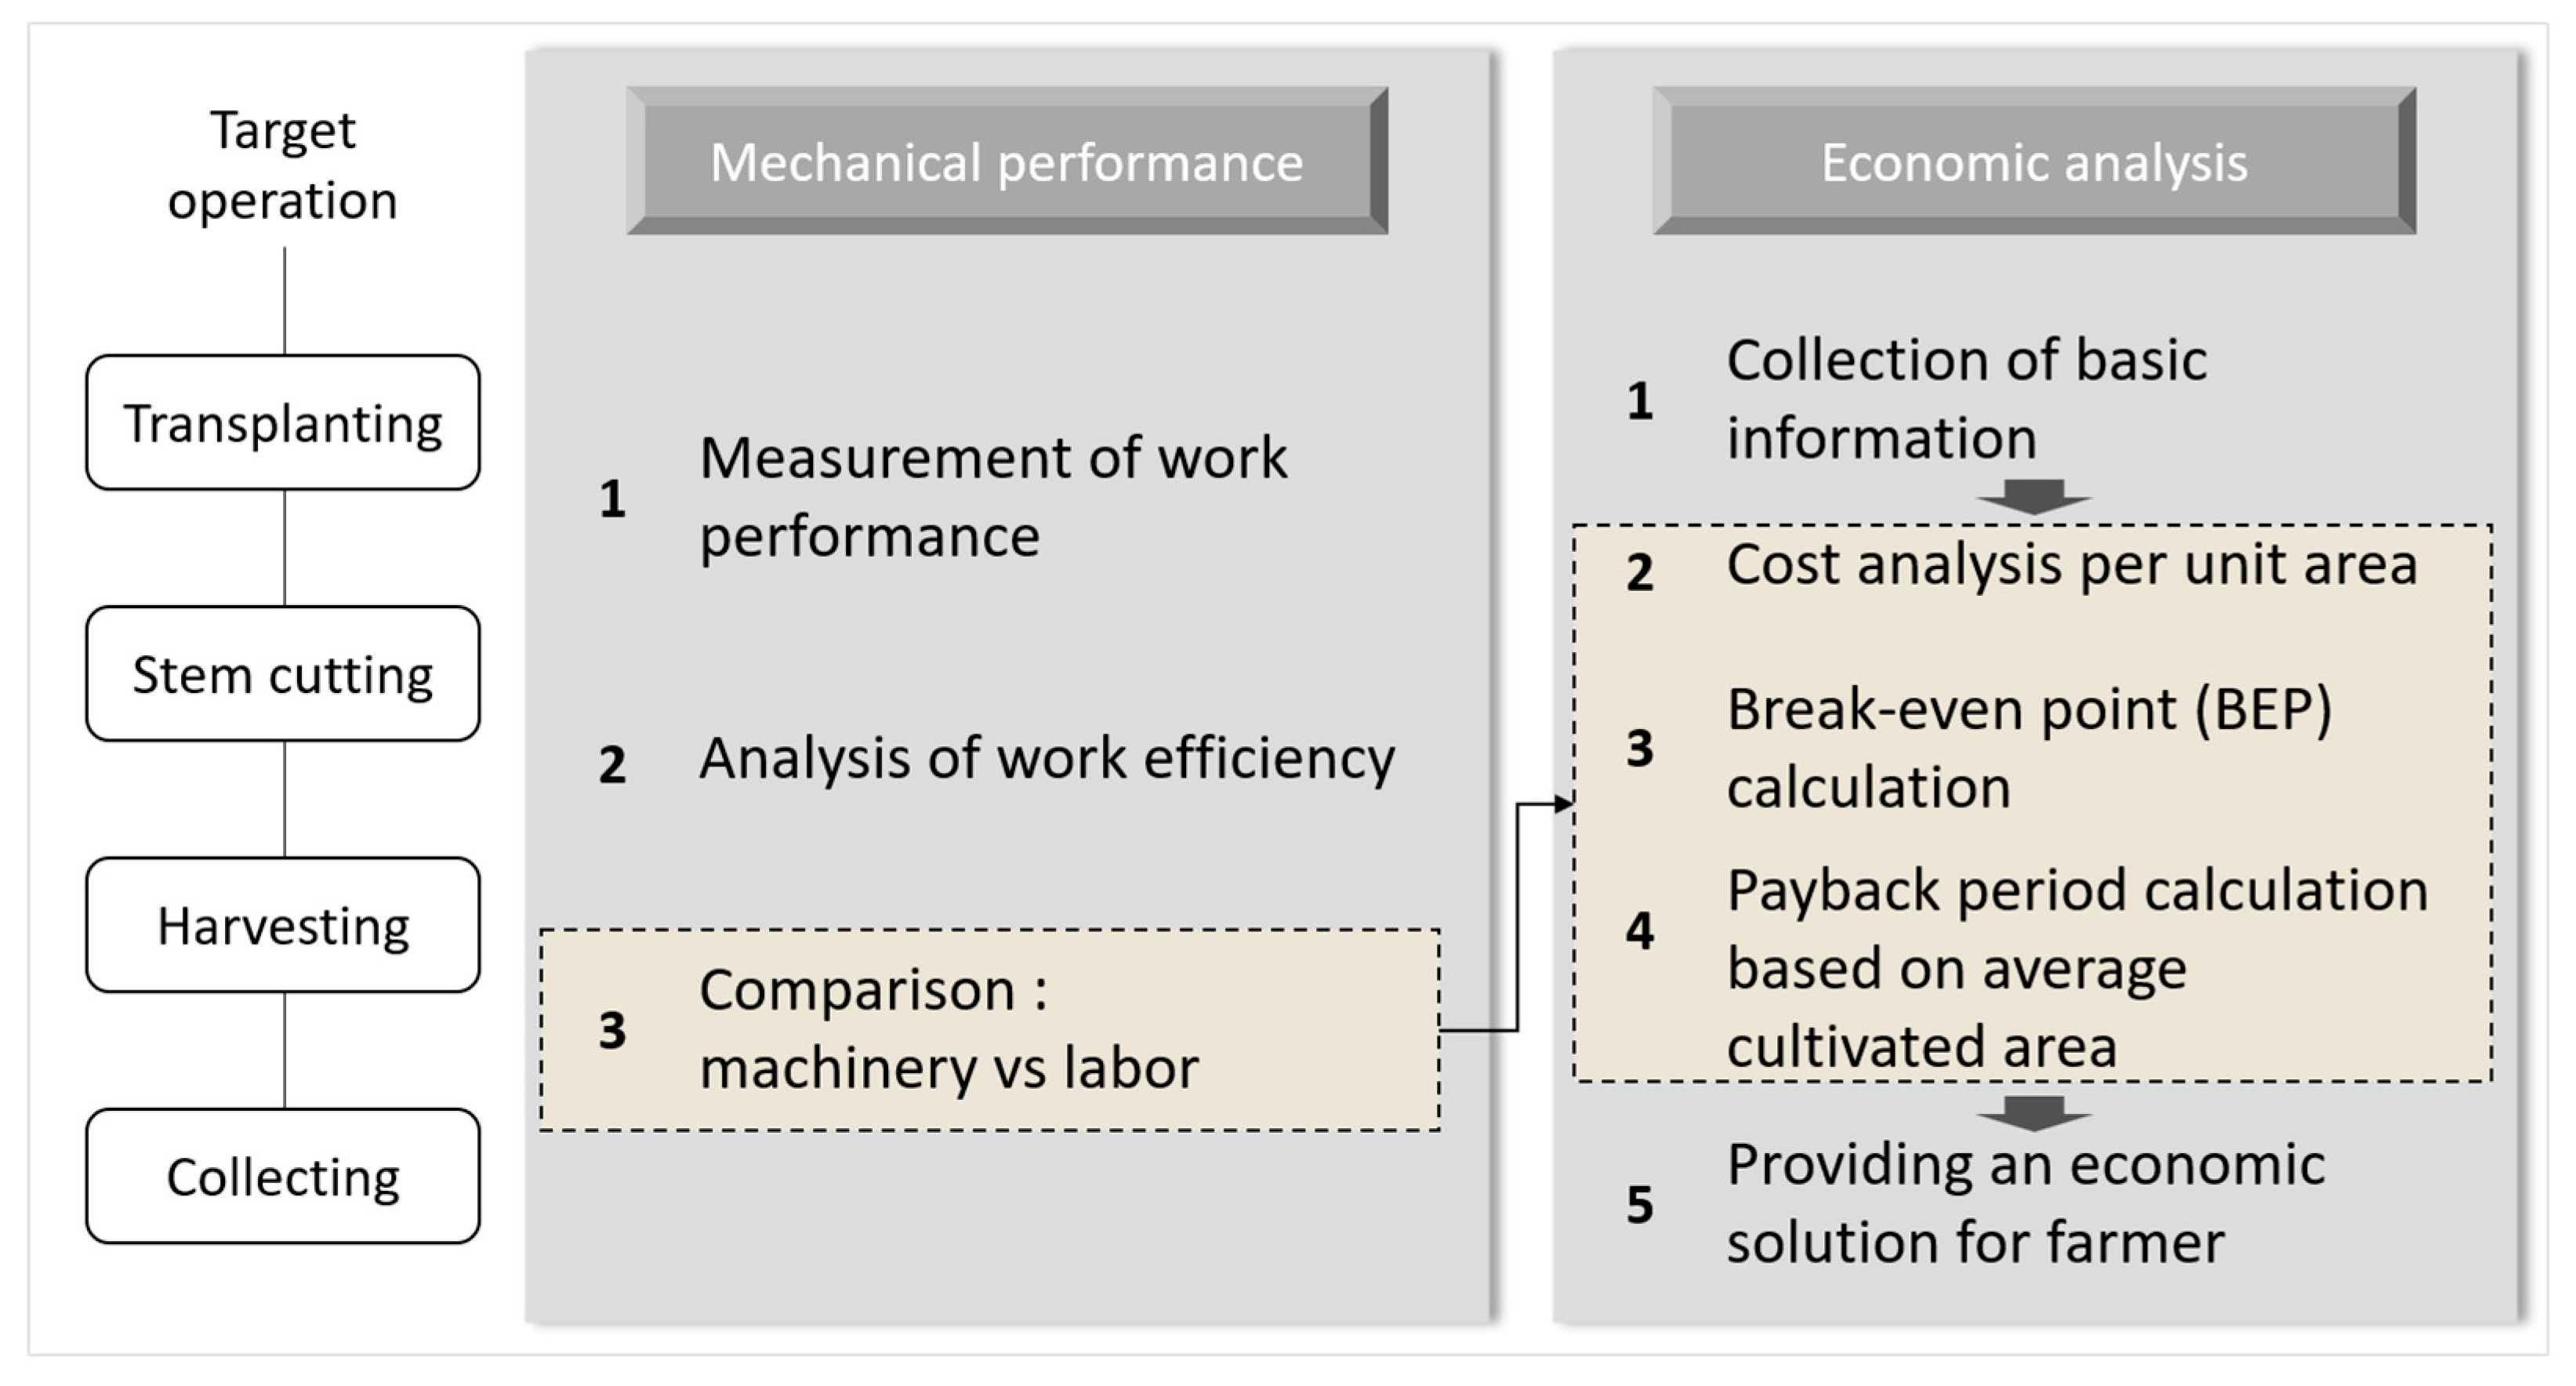
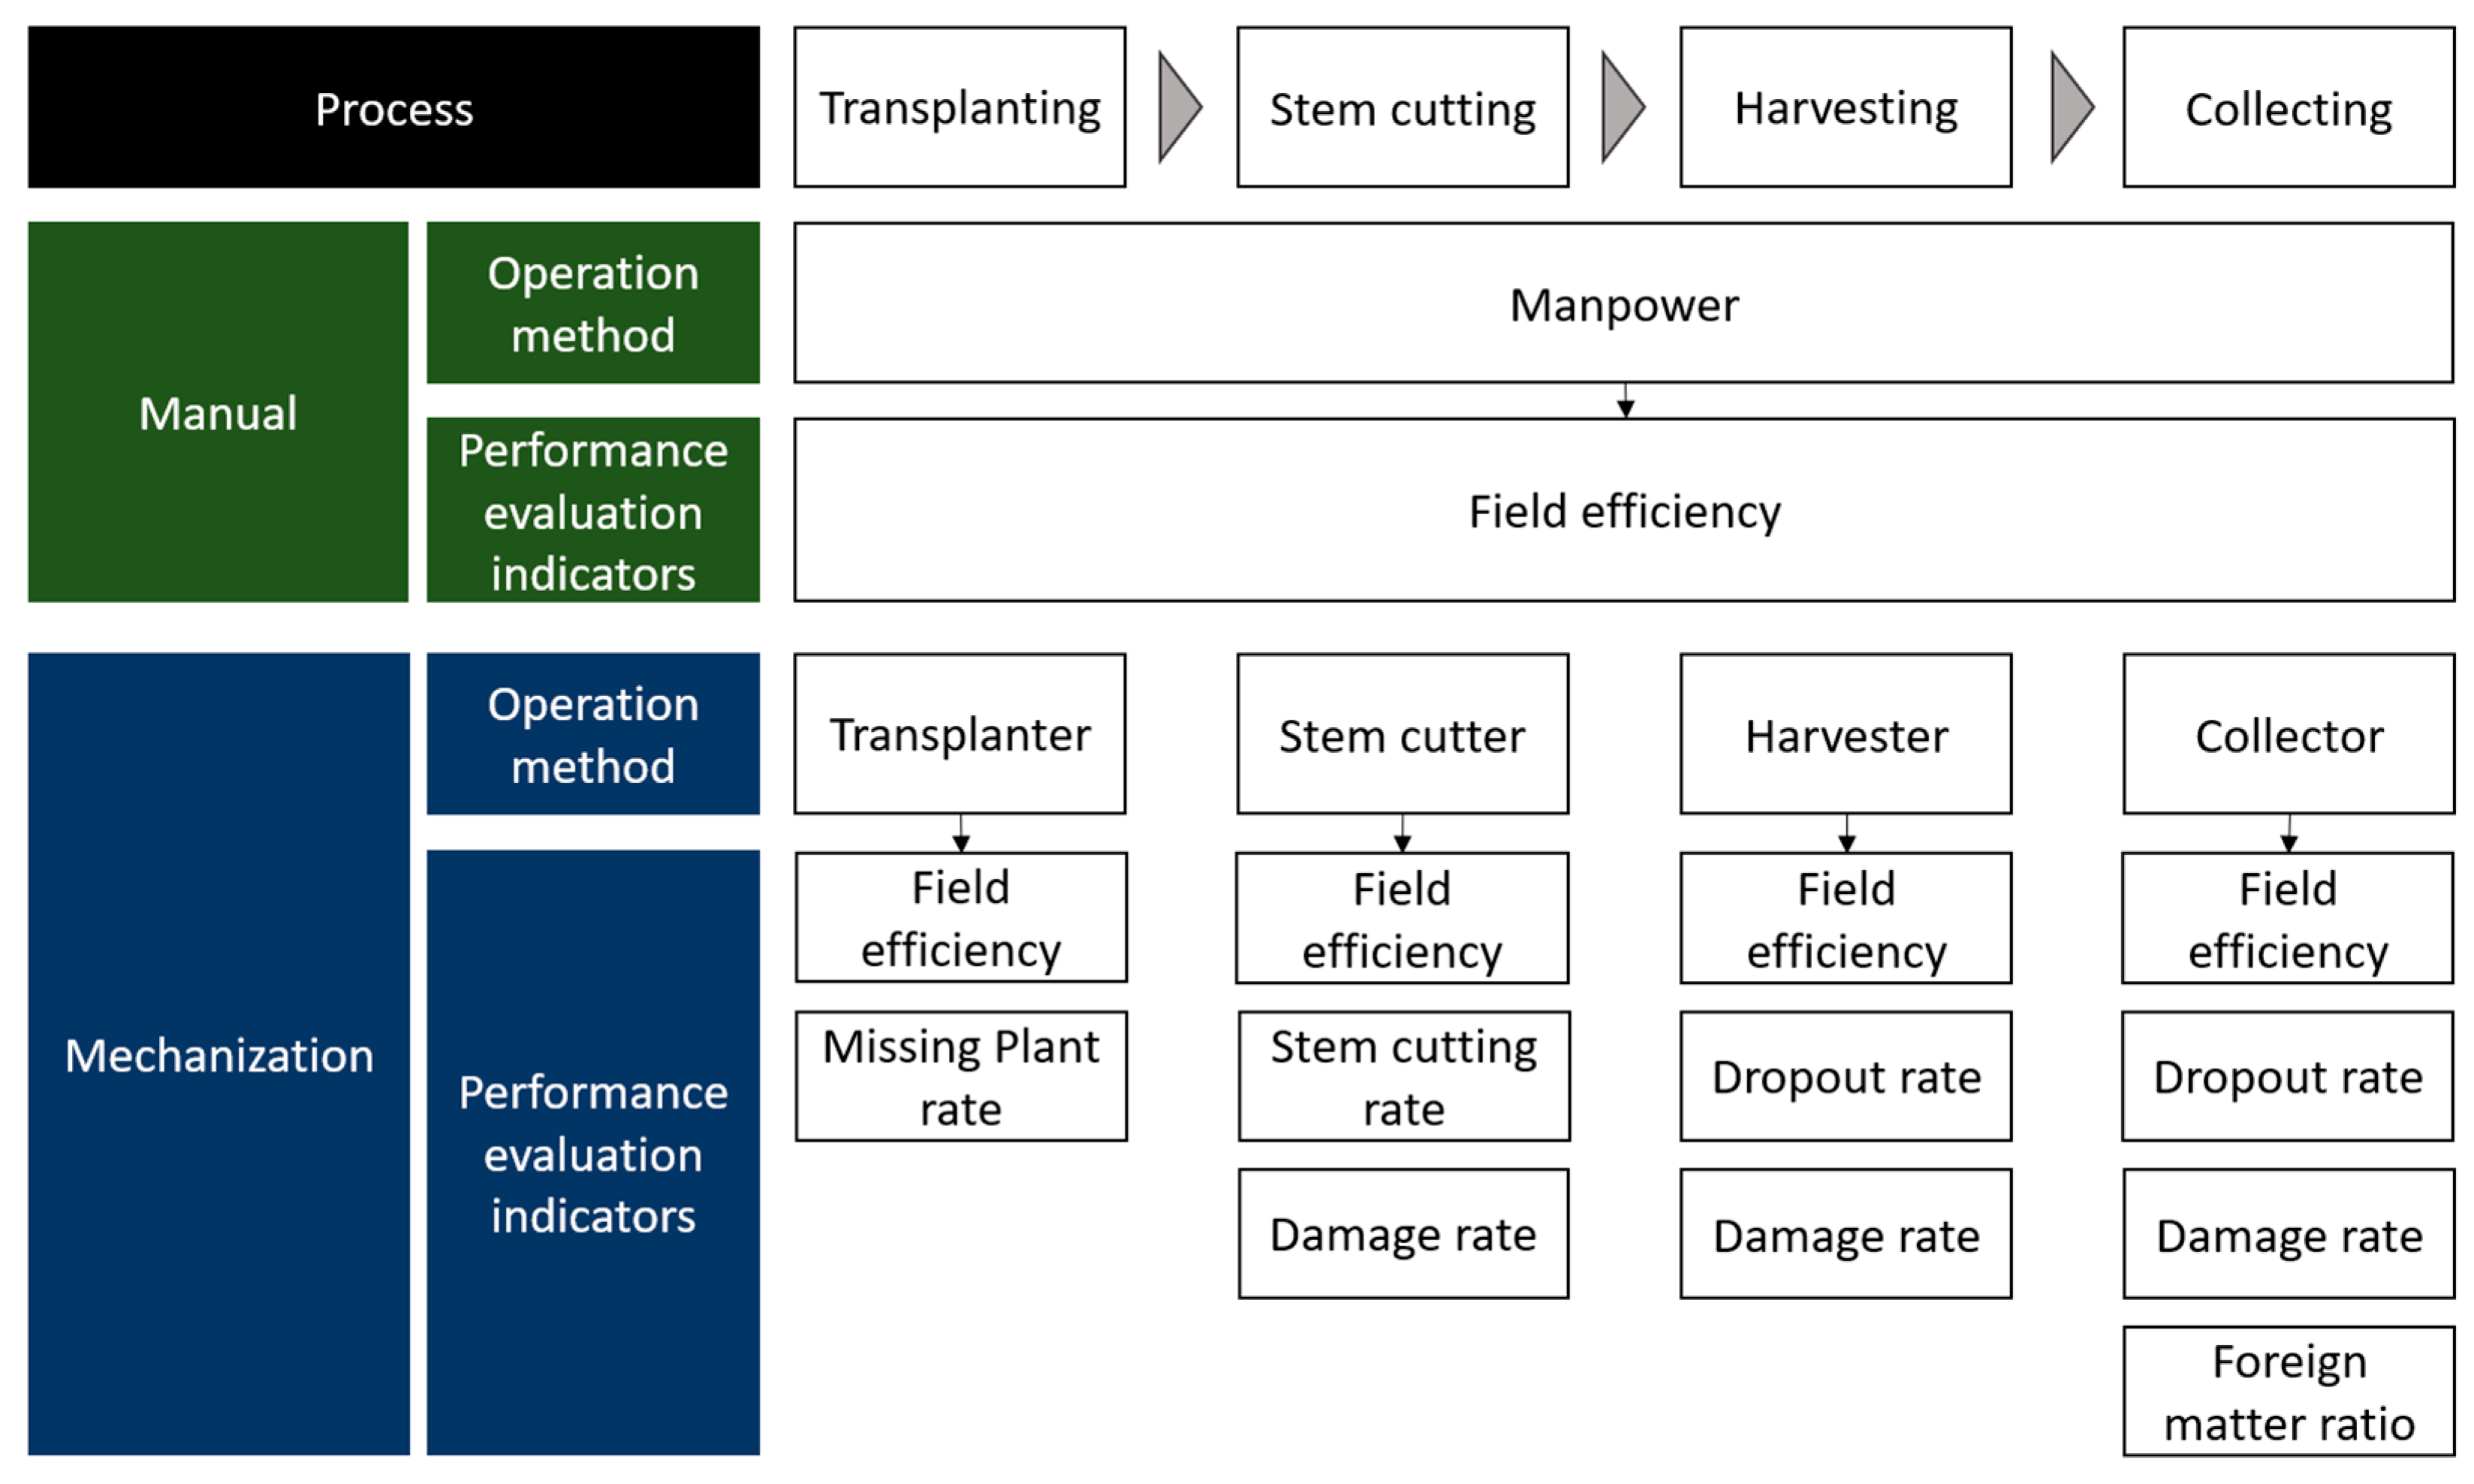
This study aims to quantitatively evaluate the performance of mechanized operations for traditionally labor-intensive processes in onion cultivation—transplanting, stem cutting, harvesting, and collecting—and compare them with manual operations. Specifically, actual field trials were conducted to obtain operational speed and performance indicators for each stage when using machinery, while manual operation data were compiled from prior studies. Furthermore, the economic feasibility of adopting mechanization was analyzed by calculating the minimum cultivation area required to economically justify it under different operational conditions, such as adopting mechanization for transplanting only, harvesting only, or the full cultivation process. Unlike previous studies focusing on paddy crops or individual machines for upland crops, this study is significant in that it provides the first integrated performance evaluation and economic analysis of the entire onion cultivation process. By presenting the minimum economically viable cultivation area for mechanization under different operational conditions, this study provides practical, objective decision-making criteria for farmers considering mechanization.

2. Materials and Methods

2.1. Experimental Design

To evaluate the performance and economic feasibility of agricultural machinery, this study followed a structured procedure, illustrated in Figure 1, consisting of a mechanical performance analysis and an economic analysis.
The mechanical performance analysis was conducted in three steps:
  • Work performance was measured for each target operation—transplanting, stem cutting, harvesting, and collecting—by evaluating key indicators, such as the missing plant, stem cutting, damage, drop-out rates, and the foreign matter ratio.
  • The work efficiency (e.g., field capacity) of each mechanized operation was analyzed during the performance evaluation to quantify operational productivity.
  • An analysis comparing the work efficiencies of machinery and manual labor was performed. This analysis served as a critical input for the subsequent economic analysis.
The economic analysis was conducted in four steps:
  • Basic information necessary for the economic evaluation, including machine prices, service life, annual operating hours, and fuel consumption for each implementation, was collected.
  • Using the collected data and the work efficiency results from the performance analysis, the cost per unit area (e.g., KRW/10 a) was calculated and compared to that of manual operations.
  • Based on the unit cost comparison, the break-even point (BEP) was calculated to determine the minimum cultivated area at which mechanized operations become more economically advantageous than manual labor.
  • The payback period was estimated by applying the BEP to the average cultivated area per farm, which was derived from a prior study conducted by the authors. That previous study involved a field survey of major onion-producing regions in the Republic of Korea, where actual cultivation areas were collected from farms practicing mechanized onion farming. The result was used to reflect typical field conditions in the economic analysis.

2.2. Experimental Field Conditions

2.2.1. Site Information

The field experiments were conducted in Changnyeong-gun, Gyeongsangnam-do, one of the Republic of Korea’s major onion-producing regions. The experimental field, located within this region (35°33′44.54″ N, 128°29′8.69″ E), measured approximately 88 m in length and 30 m in width, with a total area of 2610 m2.

2.2.2. Experimental Schedule

The experiments were planned in accordance with the onion growth stages and prevailing field weather conditions in Korea. Accordingly, the transplanting trial was conducted on 3 November 2023, and the stem-cutting, harvesting, and collecting operations were carried out over three days on 1, 3, and 5 June 2024.

2.2.3. Ridge Design and Planting Configuration

The ridges in the experimental field were constructed with a top width of 100 cm, a bottom width of 150 cm, a furrow width of 20 cm, and a ridge height of 15 cm. For transplanting, both the inter- and intra-row spacings were set to 14 cm, and eight rows were planted on each ridge. Figure 2 illustrates the ridge structure and transplanting layout. The ridge and cultivation layout parameters were determined based on a previous study investigating onion cultivation practices in Korea [16], as well as a field survey conducted by the authors with local farmers at the experimental site.

2.2.4. Soil Physical Properties

The physical properties of the soil were assessed by measuring soil moisture content, soil strength, and soil texture. Soil moisture content was measured using a soil moisture sensor (Field-Scout TDR-350, Spectrum Technologies Inc., Aurora, IL, USA), and soil strength was measured using a soil compaction sensor (Field-Scout SC900, Spectrum Technologies Inc.), both at a total of 100 locations within the field. Soil texture was analyzed based on soil samples collected from the field and evaluated according to the United States Department of Agriculture (USDA) soil textural classification system based on the soil texture triangle. Given the time difference between transplanting and harvesting operations (stem cutting, harvesting, and collecting), soil measurements were conducted in two separate sessions: immediately before using the transplanter and immediately before using the harvester. During the transplanting stage, the average soil moisture content and cone index over the 0–15 cm soil depth were 24.3% and 813.9 kPa, respectively, and the soil was classified as a clay loam. During the harvesting stage, the corresponding values were 25.1% and 914.4 kPa, and the soil was again classified as a clay loam.

2.3. Agricultural Machinery

2.3.1. Transplanting Operation

  • Transplanter
The transplanter (JOPR-4/8, JUKAM M&C, Goheung, Republic of Korea) was used for the transplanting operation. The detailed specifications of the transplanter are summarized in Table 1.

2.3.2. Harvesting Operation

The harvesting operation was divided into three stages: stem cutting, harvesting, and collecting, with a specific tractor-drawn agricultural implement used for each.
  • Agricultural tractor
The tractor (TM55, TYM Co., Seoul, Republic of Korea) was used for the evaluation of the tractor-mounted implements. Table 2 details the tractor’s specifications.
  • Stem cutter
A tractor-mounted stem cutter (SH-1500MD, Shinheung Industrial Co., Ltd., Hwaseong, Republic of Korea) was used for the stem cutting operation.
  • Harvester
A multipurpose vibrating harvester (HD-D1800G, Hyundai Agricultural Machinery, Iksan, Republic of Korea) was used for the harvesting operation.
  • Collector
A self-propelled onion collector (HD-OC800, Hyundai Agricultural Machinery) was used for the collecting operation.
The detailed specifications of each implement used in the harvesting operation are summarized in Table 3.

2.4. Performance Evaluation

2.4.1. Performance Evaluation Indicators

The indicators used to evaluate the performance of both conventional and mechanized operations in the onion cultivation process are presented in Figure 3. For conventional operations using manual labor, field efficiency was used as the primary performance indicator for each task. For mechanized operations, performance evaluations were based on different quantitative indicators depending on the implement used. Specifically, field efficiency was measured for all mechanized operations, while additional task-specific indicators included the missing plant rate for the transplanter, the stem cutting and damage rates for the stem cutter, the dropout and damage rates for the harvester, and the dropout and damage rates and the foreign matter ratio for the collector.

2.4.2. Measurement of Performance Evaluation Indicators

  • Field efficiency
Field efficiencies for manual operations were calculated based on the average task time per 10 a (1000 m2), a measure commonly used in previous studies [17,18,19]. Using the ridge dimensions and layout of the experimental field, the number of ridges per 10 a was determined, which allowed the calculation of the time required to complete one ridge. This value was then scaled to a 1 ha basis to derive labor-based field efficiencies (ha/h). The referenced studies were all based on six-row transplanting systems, while the mechanized experiments in this study were conducted using eight-row equipment. Therefore, to ensure the consistency of comparisons between manual and mechanized operations, a correction factor of 8/6 was applied to the manual task time.
The calculated field efficiencies for manual operations were 0.00148 ha/h for transplanting, 0.00357 ha/h for stem cutting, 0.00152 ha/h for harvesting, and 0.00244 ha/h for collecting. These values correspond to a maximum completed area per hour of only 35.7 m2, indicating very limited productivity. This is likely due to the repetitive nature of the tasks and the physically demanding postures required, which result in accumulated fatigue during extended work periods and, consequently, low field efficiencies.
Machine-based field efficiencies were calculated based on the actual time required to complete one ridge, as measured during field experiments. Time spent on additional tasks—such as correcting missing plants, collecting fallen onions, and removing foreign matter—was excluded from these measurements. Like the manual operations, the total working time per hectare was estimated from the ridge-based time, and this was used to derive each machine’s field efficiency (ha/h).
  • Transplanter-specific indicator
The missing plant rate represents the proportion of planting positions where seedlings were not actually planted and was calculated based on field measurements. The total number of planting positions was derived through calculation using the ridge length and the cultivation pattern. The number of missing plants was manually counted by the experimenter, and the missing plant rate was then calculated using Equation (1):
R m % = N m N t o t a l × 100
where R m is the missing plants rate (%), N m is the number of missing plants, and N t o t a l is the total number of plants.
  • Harvest machine-specific indicators
The stem cutting rate refers to the proportion of stems that were properly cut within the target length of 7 cm following the stem cutting operation, calculated using the total number of planting positions and the number of uncut stems. The number of uncut stems was determined by the experimenter through direct measurement using a ruler. The stem cutting rate was then calculated using Equation (2):
R c % = N t o t a l N u c N t o t a l × 100
where R c is the stem cutting rate (%), N u c is the number of uncut stems, and N t o t a l is the total number of plants.
The onion damage rate refers to the proportion of onions that exhibited physical damage, such as tearing or cracking, after each operation: stem cutting, harvesting, and collecting. It was measured for each ridge on which the respective operation was performed. Onions were considered damaged if the inner layers were exposed due to physical impact. After each operation, the experimenter visually identified the damaged onions. The final damage rate was calculated using Equation (3).
R d % = N d N t o t a l × 100
where R d is the crop damage rate (%), N d is the number of damaged onions, and N t o t a l is the total number of harvested onions.
The onion dropout rate refers to the proportion of onions that fell into furrows during the harvesting and collecting processes. It was calculated based on the total number of planting positions and the number of dropped onions, which was visually measured in the field and recorded by the experimenter. The final dropout rate was then calculated using Equation (4):
R d o % = N d o N t o t a l × 100
where R d o is the drop-out rate (%), N d o is the number of drop-out onions, and N t o t a l is the total number of plants.
The foreign matter ratio refers to the proportion of non-onion materials, such as soil, stones, stems, and leaves, contained in the harvested product during the collecting process. It was calculated based on the total weight of the collected material and the net weight of the onions after foreign matter was removed. The total weight of the collected material was measured immediately after the collecting operation, and the net weight (onions only) was obtained after manually separating the onions from the harvested non-onion material. The final foreign matter ratio was calculated using Equation (5):
R f m % = W t o t a l W n W t o t a l × 100
where R f m is the foreign matter rate (%), W t o t a l is the total weight of the harvested material (kg), and W n is the weight of the harvested onions after cleaning (kg).

2.4.3. Field Efficiency Ratio for Comparing Manual and Mechanized Operations

To compare the manual and mechanized methods’ operational productivity, the field efficiency ratio (FER) was calculated for each task. The FER represents how many times more area a machine can cover per hour compared to manual labor, and is defined as the ratio of machine-based field efficiency to manual field efficiency:
F E R = F i e l d   e f f i c e i n c y M a c h i n e F i e l d   e f f i c e i n c y m a n u a l
A higher FER indicates a greater relative advantage in mechanized performance. This metric enables a direct comparison of time-based productivity and is useful for evaluating the labor-saving potential of mechanization.

2.5. Economic Analysis

This study conducted not only a technical performance evaluation and quantitative comparison of mechanized and manual labor but also an economic analysis to comprehensively assess the field applicability of mechanization in actual farming operations. The economic analysis quantitatively assessed the cost-saving potential and operational efficiency of mechanized work, thereby evaluating the practical feasibility of mechanization. Cost-saving effects were examined by comparing the BEPs of adopting mechanization based on total costs, including variable costs (e.g., labor costs) for manual operations and both fixed (e.g., machinery purchase, depreciation, and interest) and variable costs (e.g., labor and fuel) for mechanized operations. In this analysis, crop marketability and quality factors were also recognized as variables that may influence economic feasibility. However, this study focused on fixed and variable costs, which have a more direct and dominant impact on economic outcomes. Accordingly, quality-related factors were excluded from the evaluation criteria to enable a quantitative comparison centered on cost structure. The break-even analysis took two additional practical criteria into account: cultivation area and time (years). Operational efficiency was analyzed based on the FER. The economic analysis was conducted under the assumption that the tractor was rented and the implements were purchased.

2.5.1. Fixed Cost per Hour

Fixed cost per hour refers to the annualized fixed costs incurred when owning agricultural machinery, including tractor rental fees, machine purchase costs, service life, salvage value, annual depreciation, annual repair costs, interest, and annual usage time. For tractor rental costs, the rate for a 50-horsepower tractor provided by the Agricultural Machinery Rental Center in Hapcheon-gun of the Republic of Korea was applied. Machine purchase costs were based on the prices provided by the manufacturers. As no specific service life was available for the implements used, the values were referenced from the Rural Development Administration [20]: 5 years for the transplanter (based on the service life of power rice transplanters), and 9 years for the stem cutter, harvester, and collector (based on the service lives of brush cutters and combine harvesters). Annual usage time was calculated by dividing the average onion cultivation area per farm in Changnyeong-gun, Hapcheon-gun, and Hamyang-eup regions of the Republic of Korea by the corresponding machine’s field capacity.
The salvage value was set at 5% of the purchase price, as defined in Equation (7). Annual repair costs were estimated at 6% of the purchase price (Equation (8)). Annual interest was calculated using the straight-line method by applying 5% to the average of the purchase price and salvage value (Equation (9)), and annual depreciation was calculated using the straight-line method by dividing the net price (the purchase price minus the salvage value) by the service life (Equation (10)) [21]. Finally, the fixed cost per hour was obtained by dividing the total annual fixed cost, which incorporated depreciation, repair costs, and interest, by the annual usage time (Equation (11)).
S a l v a g e   v a l u e   ( K R W ) = P u r c h a s e   c o s t × 0.05
A n n u a l   r e p a i r   c o s t K R W / y r = P u r c h a s e   c o s t × 0.06
A n n u a l   i n t e r e s t K R W / y r = P u r c h a s e   c o s t + S a l v a g e   v a l u e 2 × 0.05
A n n u a l   d e p r e c i a t i o n   c o s t K R W / y r = P u r c h a s e   c o s t S a l v a g e   v a l u e S u r v i c e   l i f e
H o u r l y   f i x e d   c o s t K R W / h = T o t a l   a n n u a l   f i x e d   c o s t A n n u a l   w o r k i n g   t i m e
* Total annual fixed cost = Annual depreciation cost + Annual repair cost + Annual interest.
Table 4 summarizes the input values used in the fixed cost analysis.

2.5.2. Variable Cost per Hour

The variable cost per hour refers to costs that fluctuate depending on whether the agricultural operation is performed manually or using machinery. For manual operations, the variable costs include only labor wages, while for mechanized operations, they include both labor and fuel costs.
Labor costs were based on male wage rates, as in Korea, agricultural tasks are predominantly performed by men. The labor rates applicable during the first quarter of 2025, when this study was conducted, were obtained from the Korean Statistical Information Service [22]. The average daily working time was assumed to be 8 h [19], and the final hourly labor cost was calculated using Equation (12):
H o u r l y   l a b o r   c o s t K R W / h = D a i l y   m a l e   l a b o r   w a g e D a i l y   w o r k i n g   t i m e
Fuel costs represent the expenses incurred from operating the tractor and/or implements and were calculated based on hourly fuel consumption rates and the unit price of tax-exempt diesel. Hourly fuel consumption was determined based on the comprehensive test reports provided by the manufacturers using the formula presented in [23] (Equation (13)):
Q = 0.2477 × P + 9.1883
where Q is the hourly fuel consumption (L/h), and P is the average required power (kW). Fuel prices were based on the average tax-exempt fuel prices for the first quarter of 2025 published by the Korea National Oil Corporation. Specifically, a unit price of 1059 KRW/L (gasoline) was applied for transplanting and collecting operations, and 1142 KRW/L (diesel) for stem cutting and harvesting operations.
The final variable cost per hour was calculated as the sum of the hourly labor and fuel costs, as defined in Equation (14):
H o u r l y   v a r i a b l e   c o s t K R W / h = H o u r l y   f u e l   c o s t + H o u r l y   l a b o r   c o s t
The input values used in the variable cost analysis are presented in Table 5.

2.5.3. Total Cost per Hour

The total cost per hour refers to the overall expense incurred to perform a specific operation per unit time. It was calculated as the sum of the fixed cost per hour and the variable cost per hour (Equation (15)):
H o u r l y   t o t a l   c o s t K R W / h = H o u r l y   f i x e d   c o s t + H o u r l y   v a r i a b l e   c o s t

2.5.4. Break-Even Area and Payback Period

The break-even point was defined as the minimum cultivated area at which mechanized operations become more economically advantageous than manual labor. It was determined by calculating and comparing the unit cost per hectare based on the previously estimated total hourly cost for both labor and mechanized operations. Subsequently, the payback period was estimated by applying the break-even area to a farm with an average onion cultivation area of 1.76 ha, to determine how many years it would take to reach the break-even area. The average cultivated area used in this calculation was derived from a prior study conducted by the authors, which involved a field survey in major onion-producing regions in the Republic of Korea.

3. Results

3.1. Performance of Mechanized Operations

3.1.1. Transplanter

As shown in Table 6, the missing plant rate of the transplanter was 14.6%, and the field efficiency was measured at 0.053 ha/h. Although this missing plant rate exceeds the 4–13.7% range reported in previous studies [24], it encompasses losses due to both seed germination failure in the plug tray and mechanical factors. In this experiment, the missing rate attributable to seed germination failure was 5.4%, while mechanical-related losses accounted for 6.1%, indicating that, when only mechanical factors are considered, the rate falls within the range reported in earlier work. The field efficiency was approximately 20% higher than that of manual transplanting, suggesting its potential suitability for large-scale farming operations.

3.1.2. Stem Cutter

As shown in Table 7, the stem cutter achieved a stem cutting rate of 82.0% and an onion damage rate of 0.56%. The stem cutting rate showed a substantial improvement compared to the 53.1–64.1% reported in previous studies, and the damage rate was also considered highly favorable [8]. This increase in damage is attributed to the lowered height of the cutting blade, which, while enhancing cutting efficiency, resulted in excessive penetration into the onion epidermis.

3.1.3. Harvester

As presented in Table 8, the harvester exhibited an onion damage rate of 9.5% and a dropout rate of 16.0%, with a field efficiency of 0.542 ha/h. The observed damage rate exceeded the 5–8% reported in previous studies [25] conducted at a forward speed of 0.5 m/s, while the dropout rate was substantially higher than the 0.13–1.11% range documented for operations at 0.16–0.3 m/s. This increase in damaged and dropped bulbs is attributed to a bottleneck effect at the digging and separation unit caused by the higher operating speed relative to prior work [26].

3.1.4. Collector

As shown in Table 9, the collector exhibited an onion damage rate of 0.28%, a dropout rate of 18.0%, a foreign matter ratio of 1.0%, and a field efficiency of 0.075 ha/h. Both the damage and dropout rates exceeded those reported for a garlic collector in previous research (damage rate 6.7–7.8%, average dropout rate 8.5%) [25]. The foreign matter ratio remained below 2%, indicating an acceptable level of contamination relative to prior work.

3.2. Comparative Field Efficiencies of Manual and Mechanized Operations

Figure 4 compares the field efficiencies of manual and mechanized operations for each task. In all cases, mechanized operations demonstrated significantly higher field efficiencies than manual labor. The field efficiencies of manual and mechanized operations were 0.00148 ha/h and 0.053 ha/h, respectively, for transplanting; 0.00357 ha/h and 0.307 ha/h, respectively, for stem cutting; 0.00152 ha/h and 0.543 ha/h, respectively, for harvesting; and 0.00244 ha/h and 0.075 ha/h, respectively, for collecting. The FERs—which express the relative efficiency of mechanization as the ratio of mechanized field efficiency to manual field efficiency—were 35.8 for transplanting, 86.1 for stem cutting, 358.3 for harvesting, and 30.7 for collecting. Among all tasks, harvesting showed the greatest disparity, with mechanized field efficiency being more than 358.3 times higher than that of manual labor. This substantial difference is attributed to the physical demands of harvesting, which involves penetrating the soil and uprooting the onions. Manual harvesting requires repetitive, strenuous motions and awkward postures, resulting in extremely low efficiency. In contrast, mechanized harvesting allows for continuous operation at a consistent speed and depth, leading to a substantial improvement in productivity.

3.3. Economic Performance of Mechanization

Table 10 details the fixed, variable, and total costs per hour for both manual and mechanized transplanting, stem cutting, harvesting, and collecting operations. In manual operations, no fixed costs were incurred, and the variable cost was uniformly 19,042 KRW/h for all tasks. In contrast, mechanized operations involved both fixed and variable costs, which varied depending on the type of implement used. The fixed costs per hour were 403,841 KRW for the transplanter, 159,456 KRW for the stem cutter, 393,537 KRW for the harvester, and 293,684 KRW for the collector. The corresponding variable costs were 23,974 KRW/h, 39,954 KRW/h, 39,954 KRW/h, and 22,958 KRW/h, respectively. Combining variable and fixed costs, the total costs per hour were calculated as 427,815 KRW for the transplanter, 199,410 KRW for the stem cutter, 433,491 KRW for the harvester, and 316,643 KRW for the collector, with the harvester showing the highest total hourly cost. Despite the relatively low purchase price of the harvester among the four implements, its higher total hourly cost is attributed to its shorter annual usage time, which increases the hourly fixed cost when annualized.
Figure 4. Manual and mechanized field efficiencies and the field efficiency ratio (FER) for each onion cultivation operation.
Agronomy 15 01721 g004
Figure 5 compares the cost per unit area of manual and mechanized transplanting, stem cutting, harvesting, and collecting operations. The graphs also indicate the cultivation area at which mechanization becomes more cost-effective than manual labor and the number of years required to reach the BEP based on the average cultivated area (1.76 ha). For the transplanter, the break-even area was calculated as 10.2 ha, and it is expected that the BEP would be reached after approximately 5.8 years of operation on a farm with the average cultivated area for onions. For the stem cutter, the break-even area was significantly lower, at 1.14 ha, corresponding to an approximate 0.65 years required to reach the BEP. When using the harvester, mechanized operation was found to be economically advantageous from the outset. For the collector, the break-even area was 6.95 ha, with the BEP expected to be reached after approximately 3.9 years of operation on the average cultivated area for onions.
The lowest break-even area was observed for the harvester (0 ha), indicating immediate cost-effectiveness upon adoption. In contrast, the transplanter and collector required relatively larger areas, 10.2 ha and 6.95 ha, respectively, to achieve economic viability, suggesting that mid- to large-scale farming operations are necessary for cost-effectiveness. Similarly, while the stem cutter and harvester demonstrated economic advantages within one year, the transplanter and collector required longer periods, 5.8 and 3.9 years, respectively, indicating that long-term use is necessary to justify their adoption. These results suggest that both the scale of cultivated area and the duration of machinery use are critical factors in determining the economic feasibility of mechanization.
Figure 6 compares the cost per unit area between manual and mechanized operations when the entire onion cultivation process is fully mechanized. When all processes were mechanized, the break-even area was calculated to be 3.63 ha, and the BEP was expected to be reached after approximately 2.1 years based on the average cultivated area. This suggests that, although full-process mechanization may lead to a slight increase in fixed costs compared to individual operations, the overall improvement in operational efficiency and the reduction in labor inputs outweigh the additional costs. Consequently, economic feasibility can be achieved in a relatively short period.

4. Discussion

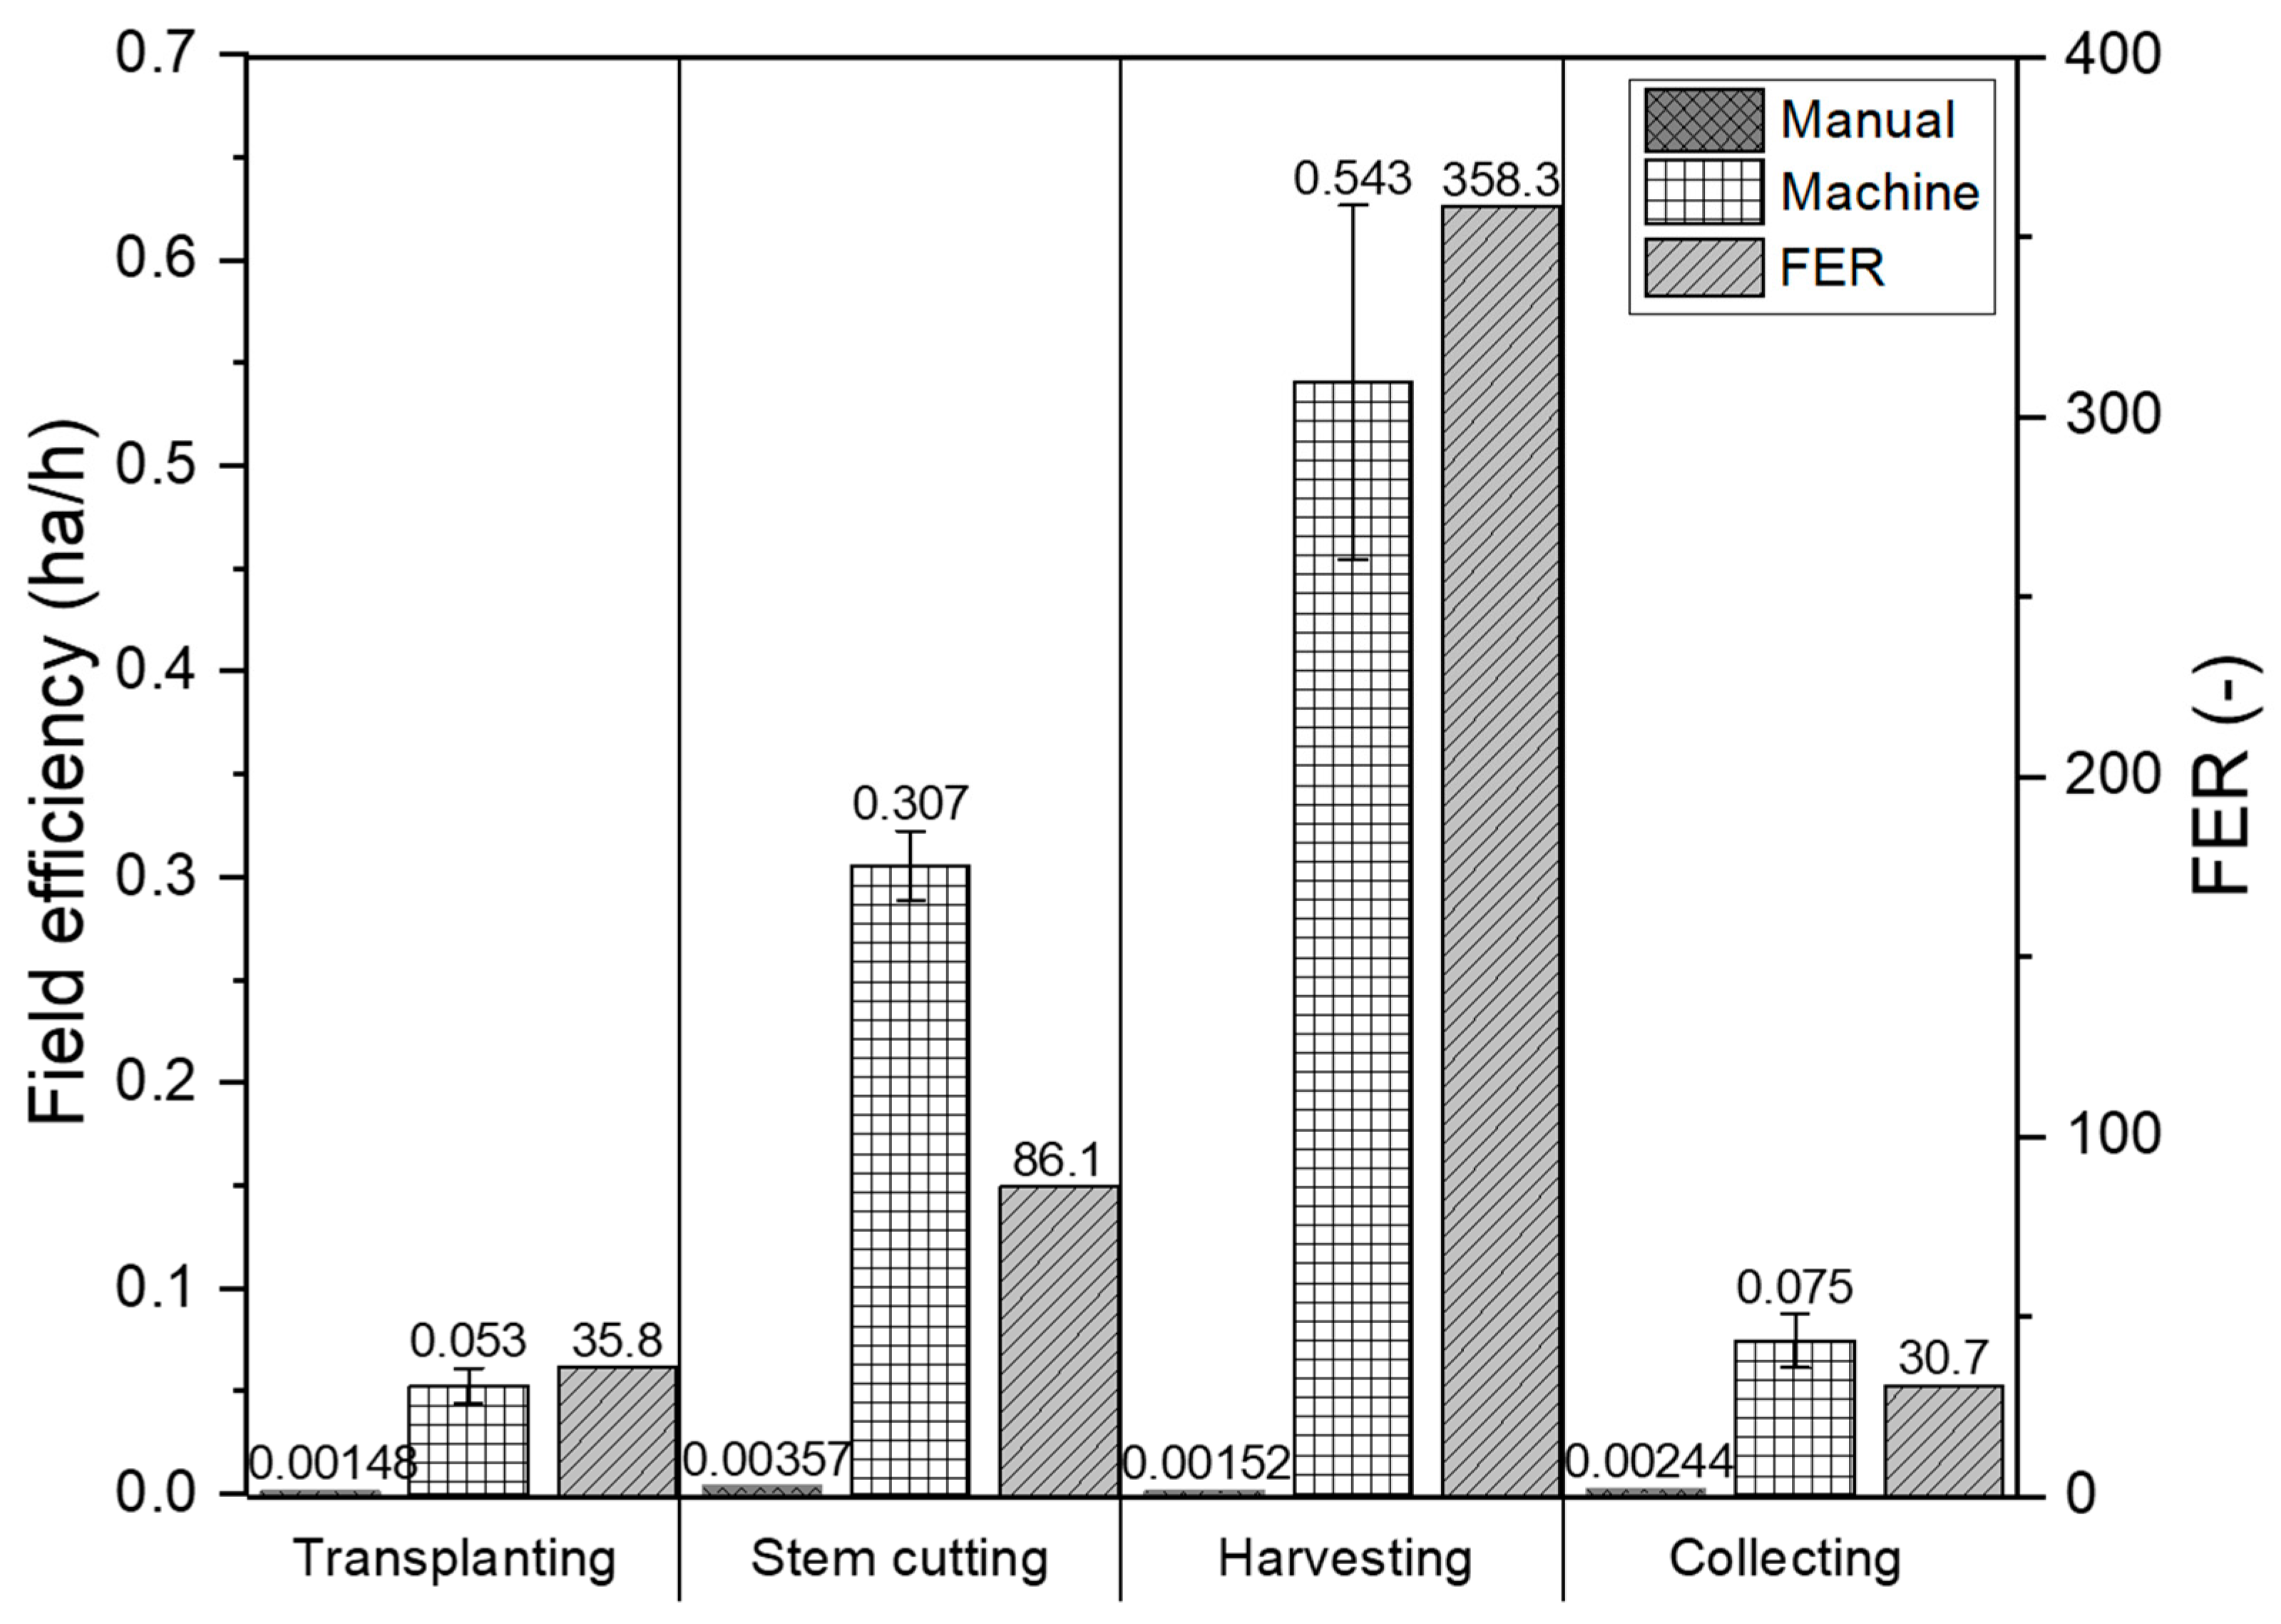
This study evaluated the performance of mechanized operations across four major stages of onion cultivation—transplanting, stem cutting, harvesting, and collecting—comparing them to manual operations, and assessed the field applicability of mechanization using an economic analysis. The results showed that mechanized operations exhibited 35.8 to 358.3 times higher work efficiencies than manual labor across all stages. The greatest difference was observed in harvesting, where manual work involves workers bending over and pulling crops directly from the soil by hand, requiring high physical labor intensity and frequent work delays. In contrast, mechanized harvesting maintained a consistent travel speed and digging depth, enabling continuous digging and conveyance with significantly reduced operation time. When all processes are mechanized, the integration of digging, collecting, and conveyance during the harvesting stage is expected to minimize idle time between tasks, enhance overall work efficiency beyond what is enumerated in this study. However, performance evaluations revealed several quality-related issues, including missing plants during transplanting; incomplete stem cutting; crop damage during stem cutting; and crop damage, dropout, and foreign matter mixing during harvesting and collecting.
Detailed performance evaluation revealed that the missing plant rate in the transplanting stage was 14.6%, which exceeds the 4–13.7% range reported in previous studies [24]. This elevated rate appears to result not only from mechanical factors such as soil conditions and equipment malfunctions, but also from plug-tray issues, including non-germinated seedlings. When considering only mechanically induced losses, the rate falls within the previously reported range. In the stem cutting stage, the cutting rate reached 82.0%, representing a marked improvement over the 53.1–64.1% reported in earlier work [8]. The damage rate remained very low at 0.56%. This increase is attributed to lowering the blade height and increasing rotational speed to enhance cutting efficiency, which in turn caused excessive penetration into the onion epidermis. During the harvesting stage, the damage rate rose to 9.5%, exceeding the 5–8% observed at a forward speed of 0.5 m/s in prior research [25]. The dropout rate was 16.0%, substantially higher than the 0.13–1.11% reported for operations at 0.16–0.3 m/s. These increases are likely due to a bottleneck effect in the digging and separation unit caused by the higher operating speed. In the collecting stage, the damage rate was 0.28%, substantially lower than the 6.7–7.8% reported for a garlic collector in previous work [25]. The dropout rate reached 18.0%, exceeding the previously reported average of 8.5%, which is likely attributable to the collector’s narrower working width, reducing its ability to capture onions at the ridge edges. Conversely, the foreign matter ratio was just 1.0%, below the approximately 2% documented in prior studies, a performance attributable to the structural design of the chain-type conveyor system and the roughly 3 m-long conveying and discharge units that effectively removed soil clumps and plant residues during transport. The results revealed suboptimal performance in several key indicators, including the missing plant rate of the transplanter, the damage rates of the stem cutter and harvester, and the dropout rates of both the harvester and collector. Based on the issues identified in this study, future improvements in the structural design of these machines are warranted. These findings indicate that mechanized operations may lead to a deterioration in crop quality when compared to manual labor operations, suggesting that the feasibility of mechanization cannot be determined based solely on work efficiency. While improvements in work rates may potentially reduce labor costs, it is difficult to quantitatively assess income loss due to reduced crop quality. Therefore, to provide a clear basis for decision-making regarding the adoption of mechanization, it is necessary to present quantitative indicators that are immediately interpretable by farmers, such as the break-even cultivation area and payback period, through economic analyses based on work efficiency.
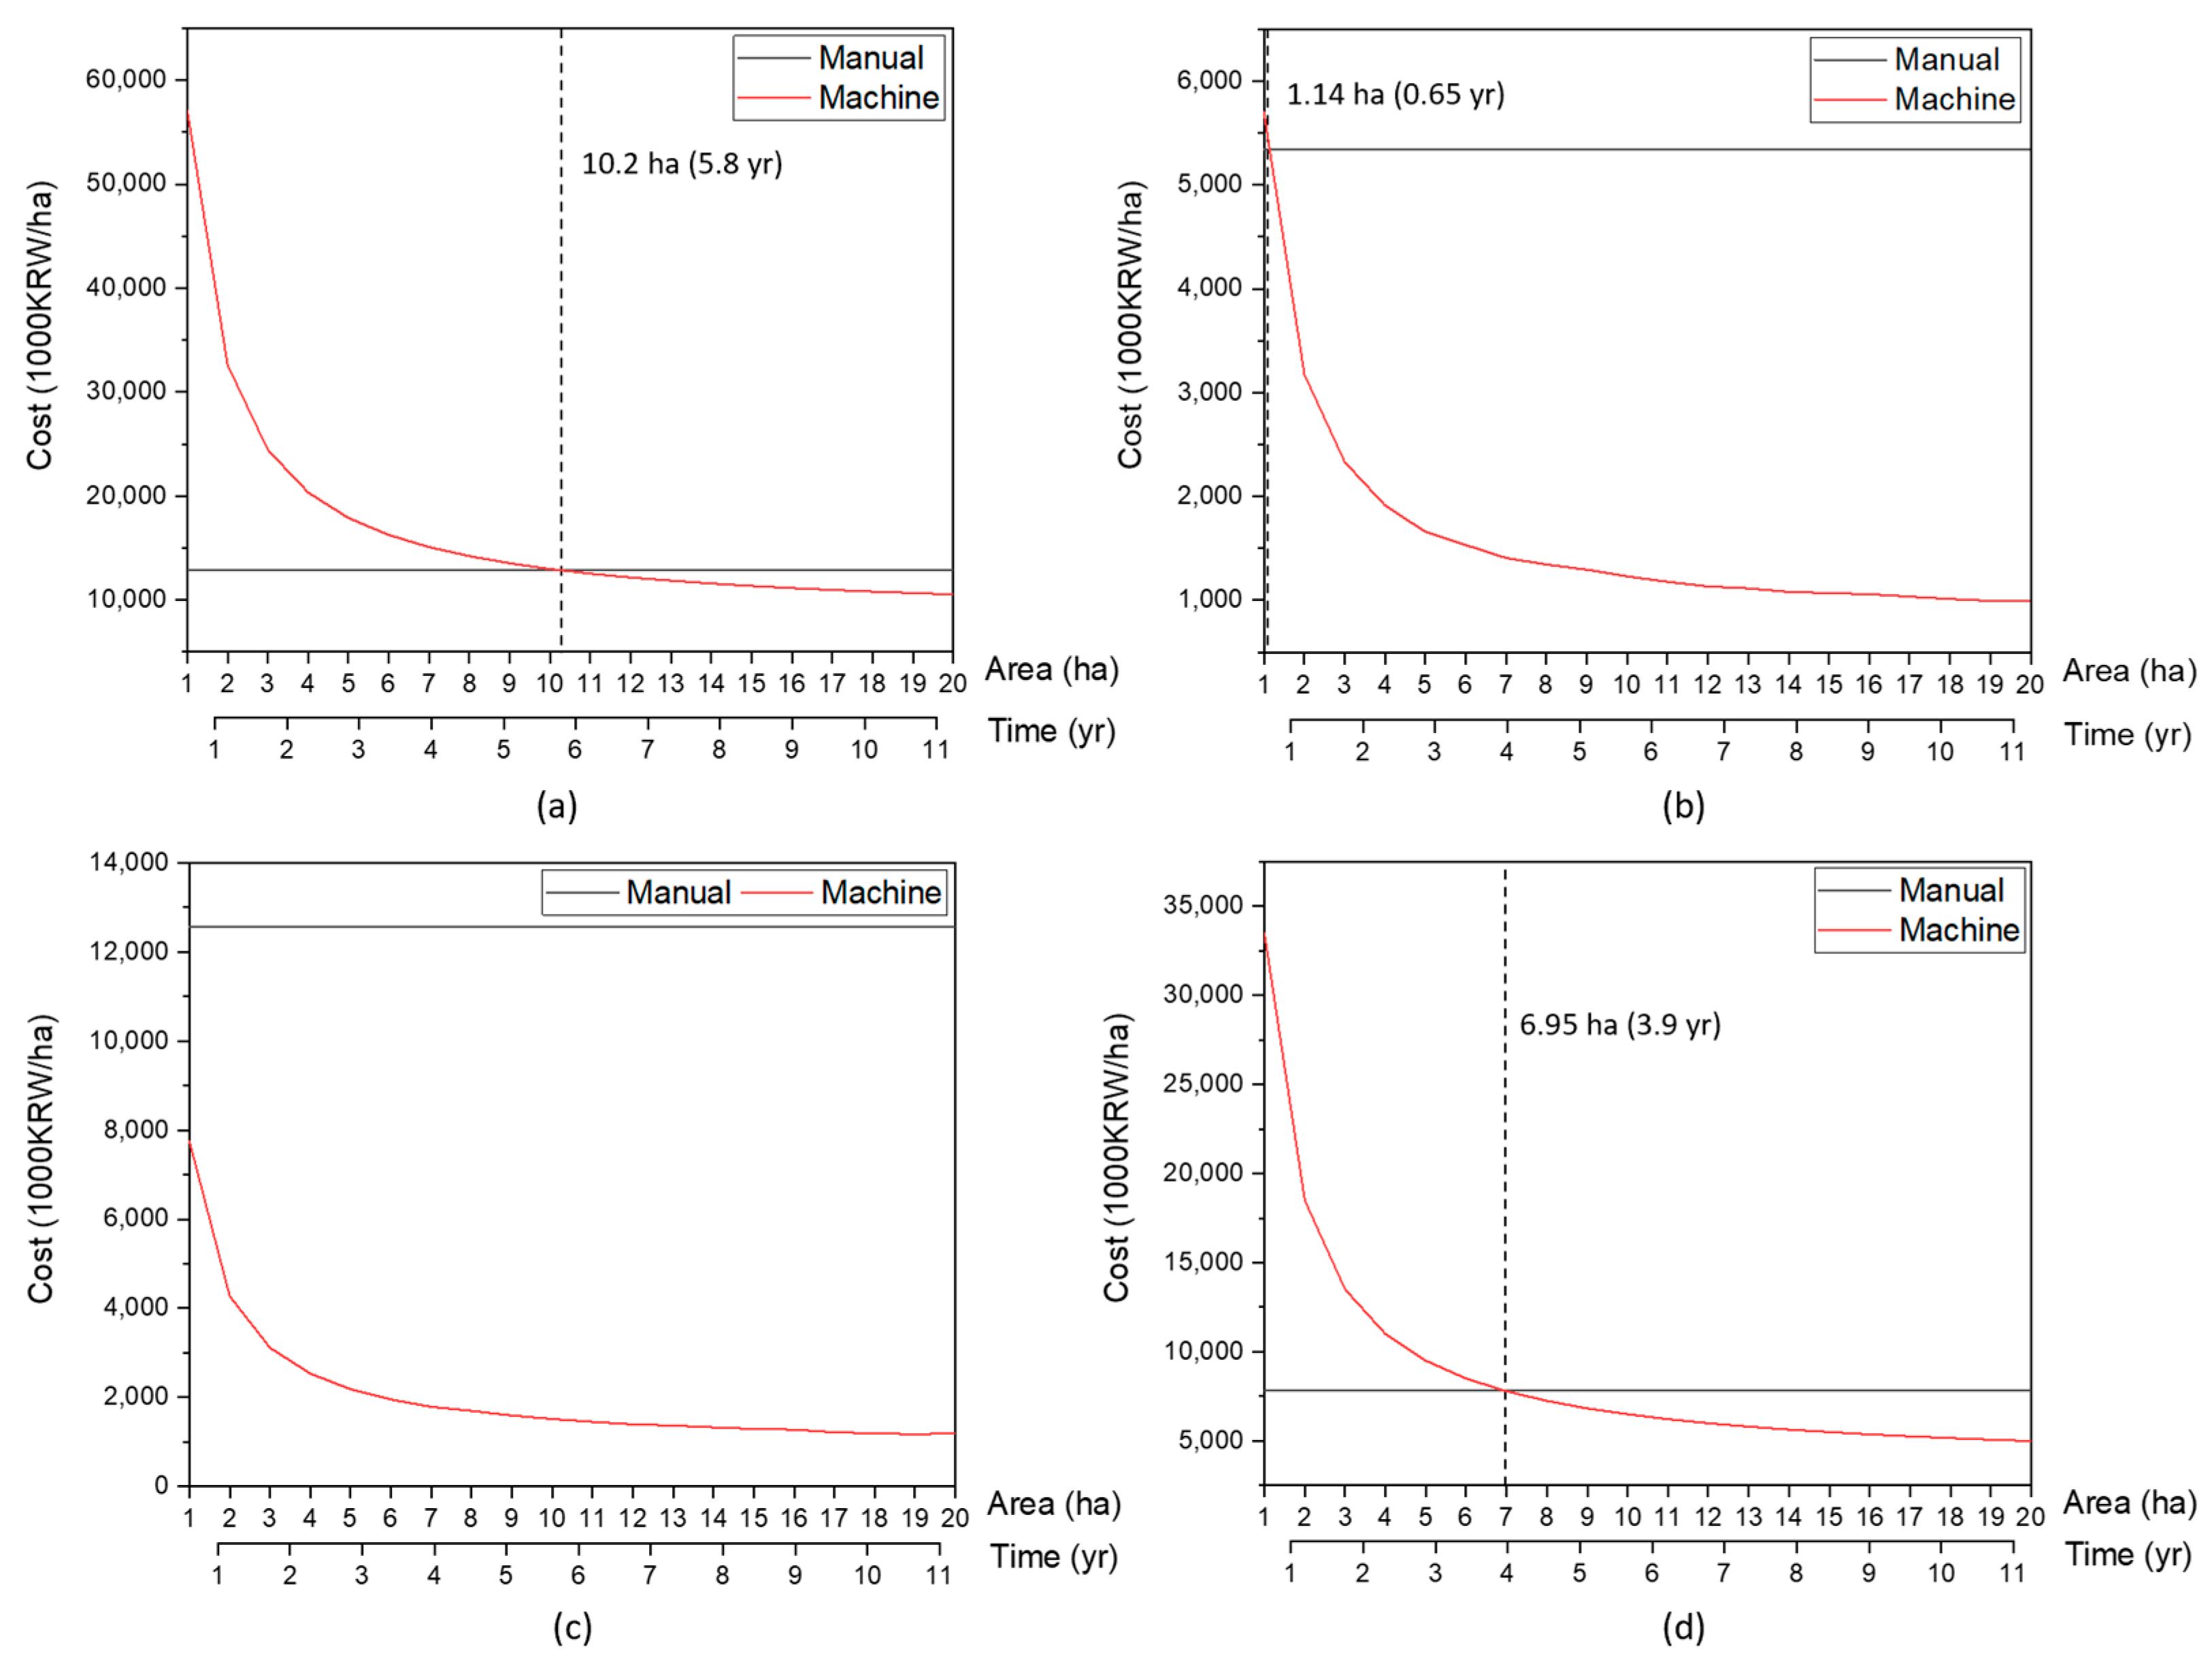
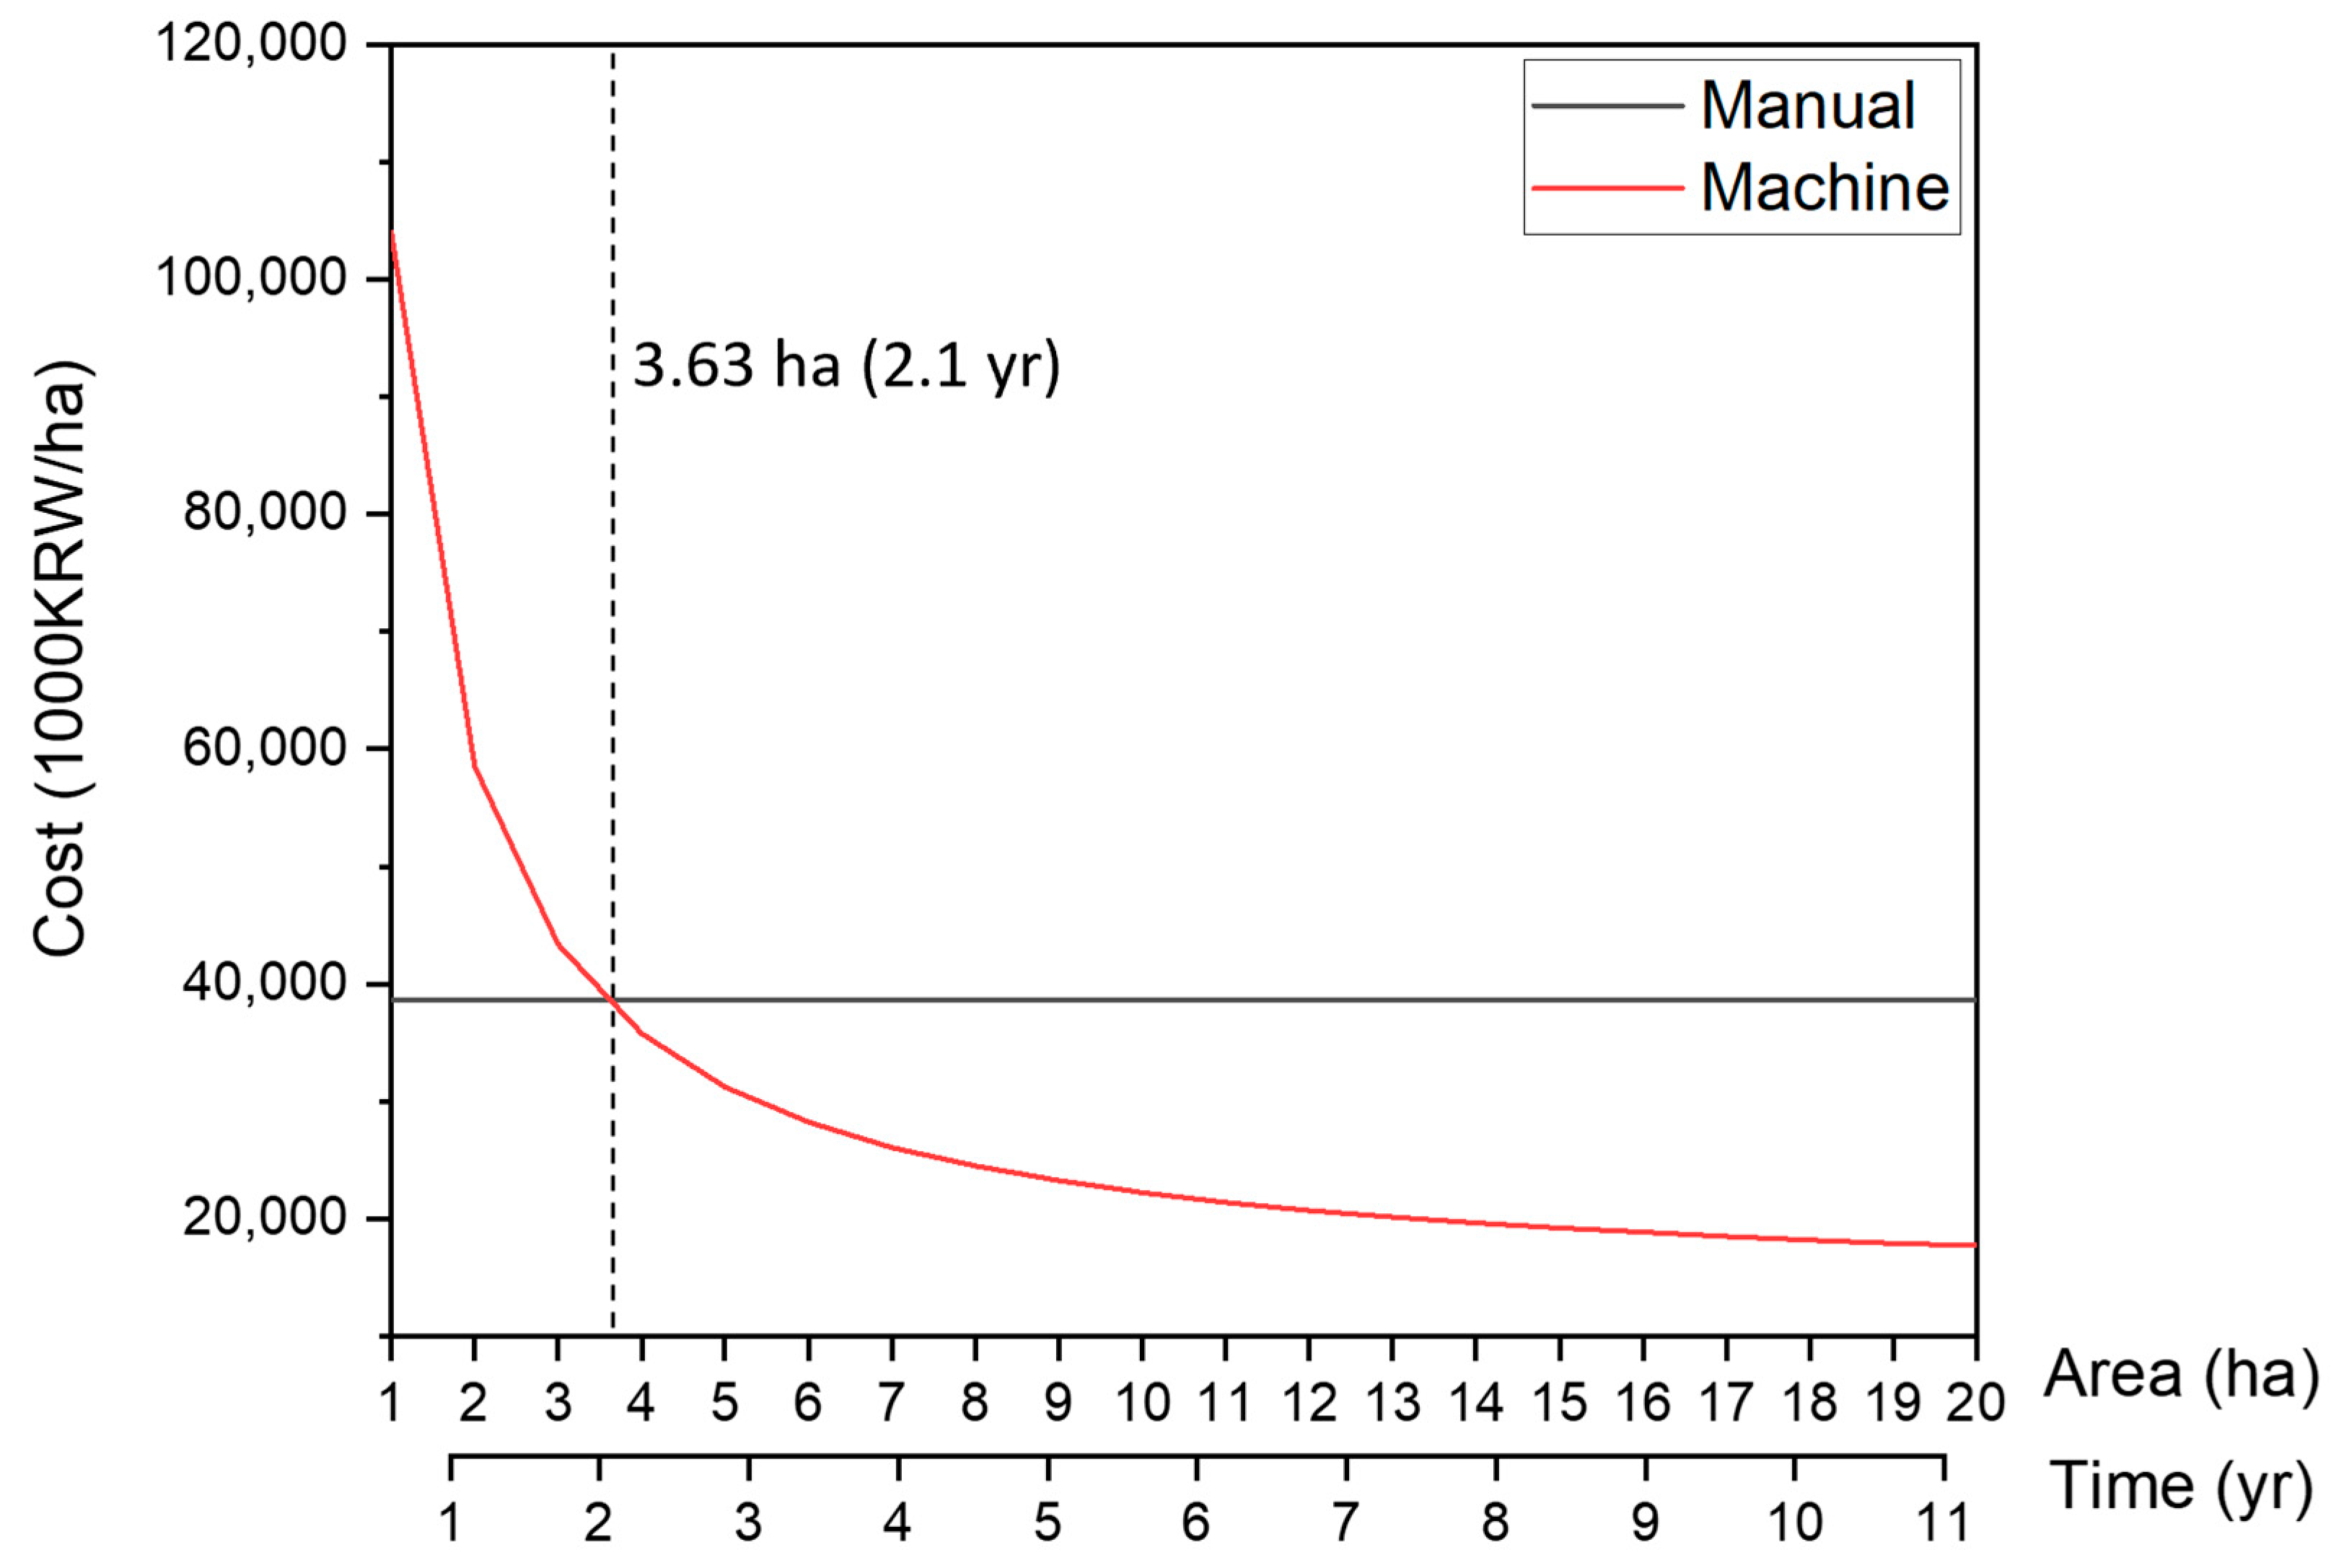
Our economic analysis showed that, although mechanized operations incur higher initial investment costs than manual labor due to equipment purchases, the operating cost per unit area decreases as the cultivated area increases. The stem cutter and harvester were found to be economically feasible even for small-scale farms of less than 1 ha due to their high work efficiencies and relatively low equipment costs. In contrast, the transplanter and collector had higher equipment costs and performance limitations in terms of quality and were determined to be cost-effective only when used on farms with at least 7 ha of cultivated area or after at least four years of continued use. For the full adoption of mechanization, i.e., when all four processes are mechanized, farms with a cultivated area of at least 3.63 ha were found to be suitable.
This study was designed to evaluate the field applicability of mechanized operations and to provide farmers with decision-making criteria by assessing machine performance and conducting economic analyses. Recognizing the impracticality of covering every possible scenario, we applied an idealized operational framework assuming minimal human intervention and carried out experiments in representative Korean onion-growing regions, which may limit the generalizability of our findings. In particular, with respect to machinery acquisition strategies, purchasing equipment incurs high initial costs but provides immediate and exclusive access, whereas renting involves lower upfront expenses but may lead to equipment shortages during peak seasons. Therefore, more detailed economic evaluations of these ownership strategies are warranted. In future research, field trials will be broadened to include a wider range of regions and implement configurations, and through this expansion, we will secure more extensive experimental data before applying each machine in an integrated operation that reflects a continuous workflow. Additionally, performance evaluation and economic analysis will incorporate practical operational scenarios, including various machinery ownership strategies and supplementary manual tasks such as removing foreign matter or hand-collecting dropped onions after mechanized operations. This expansion of research scope is expected to enhance the representativeness of the results and contribute to a more in-depth exploration of the applicability of mechanization in upland crop production.

5. Conclusions

This study conducted performance evaluations, including field efficiency and FER evaluation, and economic analyses for four key stages of mechanized onion cultivation: transplanting, stem cutting, harvesting, and collecting.
In the performance evaluation, the transplanter showed a missing plant rate of 14.6%, a field efficiency of 0.053 ha/h, and an FER of 35.8, indicating approximately 35.8 times higher efficiency than manual labor. The stem cutter achieved a cutting rate of 82.0%, a damage rate of 0.56%, a field efficiency of 0.307 ha/h, and an FER of 86.1. The harvester recorded a damage rate of 9.5%, a dropout rate of 16.0%, a field efficiency of 0.543 ha/h, and a FER of 358.3. The collector showed a damage rate of 0.28%, a dropout rate of 18.0%, a foreign matter ratio of 1.0%, a field efficiency of 0.075 ha/h, and a FER of 30.7. When all operations were mechanized, the overall field efficiency was 0.168 ha/h, and the average FER was 122.4, suggesting that mechanized operations were at least 35.8 to 358.3 times more efficient than manual labor, with a 122.4-fold improvement in the fully mechanized scenario.
The economic analysis indicated that the break-even cultivation area for the transplanter was 10.2 ha with a payback period of 5.8 years, while the stem cutter required 1.14 ha with a payback period of 0.65 years. For the harvester, the break-even area was calculated as 0 ha, implying immediate cost recovery within the year of adoption. The collector had a break-even area of 6.95 ha and a payback period of 3.9 years. When all four operations were mechanized, the total break-even area was estimated at 3.63 ha with a payback period of 2.1 years. These findings provide valuable decision-making criteria for farmers considering mechanization. For example, in the case of full mechanization, farms with cultivation areas smaller than the national average of 1.76 ha would require a longer operational period to achieve cost recovery, whereas farms with relatively short cultivation durations would need to secure an area larger than the break-even threshold of 3.63 ha to justify adoption.
These findings provide practical benchmarks for farmers in decision-making and offer a basis for policy support and future research. By presenting integrated performance and economic analyses, this study lays the groundwork for promoting mechanization not only in onion farming but also across a wide range of upland crops.

Author Contributions

Conceptualization, W.-S.K.; methodology, W.-S.K.; validation, J.-S.H.; formal analysis, J.-S.H. and W.-S.K.; investigation, W.-S.K. and J.-S.H.; resources, J.-S.H. and W.-S.K.; data curation, J.-S.H.; writing—original draft preparation, J.-S.H.; writing—review and editing, J.-S.H. and W.-S.K.; visualization, J.-S.H.; supervision, W.-S.K.; project administration, W.-S.K.; funding acquisition, W.-S.K. All authors have read and agreed to the published version of the manuscript.

Funding

This work was supported by the Korea Institute of Planning and Evaluation for Technology in Food, Agriculture and Forestry (IPET) through the Machinery Mechanization Technology Development Program for Field Farming, funded by the Ministry of Agriculture, Food and Rural Affairs (MAFRA) (RS-2023-00230838).

Data Availability Statement

The data presented in this study are available within the article.

Conflicts of Interest

The authors declare no conflicts of interest.

References

  1. Jo, S.H.; Lee, C.Y.; Jeong, H.J.; Kang, S.W.; Lee, D.H. Estimation of Two-Dimensional Position of Soybean Crop for Developing Weeding Robot. J. Drive Control 2023, 20, 15–23. [Google Scholar]
  2. Statistics Korea. Population by Age of Farm Population (2000–2023). Available online: https://kosis.kr/statHtml/statHtml.do?orgId=101&tblId=DT_1EA1040 (accessed on 11 May 2025).
  3. Kim, J.-H.; Cho, Y.-H.; Kim, K.-M.; Lee, C.-Y.; Lee, W.S.; Nam, J.-S. Sweet Potato Farming in the USA and South Korea: A Comparative Study of Cultivation Pattern and Mechanization Status. J. Biosyst. Eng. 2025, 50, 210–224. [Google Scholar] [CrossRef]
  4. Koo, Y.M. PTO Torque and Draft Analyses of an Integrated Tractor-Mounted Implement for Round Ridge Preparation. J. Biosyst. Eng. 2022, 47, 330–343. [Google Scholar] [CrossRef]
  5. Statistics Korea. Farm Households and Farm Population (2000–2023). Available online: https://kosis.kr/statHtml/statHtml.do?orgId=101&tblId=DT_1ET0291 (accessed on 11 May 2025).
  6. Kim, J.H.; Lee, C.Y.; Cho, Y.H.; Yu, Z.; Kim, K.M.; Yang, Y.J.; Nam, J.S. Potato Farming in the United States and South Korea: Status Comparison of Cultivation Patterns and Agricultural Machinery Use. J. Biosyst. Eng. 2024, 49, 252–269. [Google Scholar] [CrossRef]
  7. Rural Development Administration (RDA). Statistics on Agricultural Machinery Possession (2023). Available online: https://kosis.kr/statHtml/statHtml.do?orgId=143&tblId=DT_143004N_026 (accessed on 11 May 2025).
  8. Hong, S.J.; Paek, Y.; Kang, D.H.; Kim, H.C.; Lee, S.H.; Moon, S.P.; Min, B.H.; Nam, Y.J.; Kwon, S.G.; Kim, D.E. A study on the onion stem cutting prototype attached to a tractor. J. Korea Acad.-Ind. Coop. Soc. 2023, 24, 247–255. [Google Scholar] [CrossRef]
  9. Do, Y.W.; Moon, S.P.; Nam, Y.J.; Kwon, S.G.; Kim, W.S. Analysis of power requirements for self-propelled garlic collector by travel speed under actual operation condition. J. Drive Control 2024, 21, 135–144. [Google Scholar]
  10. Kumawat, L.; Raheman, H. Development of Draft Force Estimation Model for Hand Tractor Powered Digger-cum-Conveyor by Rake Angle and Digging Depth. J. Biosyst. Eng. 2023, 48, 152–164. [Google Scholar] [CrossRef]
  11. Choi, I.S.; Kang, N.R.; Choi, K.S.; Woo, J.K.; Kim, Y.H.; Yu, S.H.; Choi, Y.; Kim, Y.K. Design Manufacture and Performance Evaluation of Gathering Type Garlic Harvesting Machine. J. Drive Control 2023, 20, 64–70. [Google Scholar]
  12. Lee, S.H.; Kim, W.K.; Eo, J.W.; Lee, S.B.; Choi, D.G.; Park, S.H.; Kang, Y.K.; Cheon, C.U. Field Test of Harvesting Mechanization Technology of Onion at Shinan Area. J. Drive Control 2024, 21, 20–27. [Google Scholar]
  13. Kim, W.K.; Lee, S.H.; Choi, D.G.; Park, S.H.; Kang, Y.K.; Moon, S.P.; Cheon, C.U.; Kim, Y.J.; Jang, S.H. Development and Performance Analysis of Self-Propelled Crawler and Gathering Type Potato Harvester. J. Drive Control 2024, 21, 23–29. [Google Scholar]
  14. Kim, S.; Jang, M.; Nam, J. Economical Analysis Comparing the Working Cost and Field Capacity of a Tractor-Mounted Multi-Working Machine and Individual Machines. J. Agric. Life Environ. Sci. 2022, 34, 152–159. [Google Scholar] [CrossRef]
  15. Koo, Y.M.; Kim, B.M. Field Capacity and Cost Analyses of an Integrated Tractor Implement for Flat Ridge Preparation. J. Agric. Life Sci. 2018, 52, 137–149. [Google Scholar] [CrossRef]
  16. Hwang, J.S.; Kang, Y.S.; Kim, W.S. A Study on Cultivation Models and Mechanization Rates for onion Cultivation Standardization: Focusing on the Gyeonsangnam-do. Korean J. Agric. Sci. 2024, 51, 787–800. [Google Scholar] [CrossRef]
  17. Rural Development Administration (RDA). Technical Development for Improving Bulb Productivity in Mechanical Transplanting of Onion: Final Report for General Project (Project No. PJ011788); RDA: Jeonju, Republic of Korea, 2018.
  18. Lee, S.Y.; Han, C.W.; Park, H.J.; Kweon, G.Y. A fundamental study for pre-harvest treatment system with an onion stem cutter and a plastic mulch wrapper. J. Agric. Life Sci. 2018, 52, 151–162. [Google Scholar] [CrossRef]
  19. Rural Development Administration (RDA). Development of Mechanization Technology System for Whole Process in Onion and Garlic Production: Final Report for General Project (Project No. PJ012598); RDA: Jeonju, Republic of Korea, 2021.
  20. Rural Development Administration (RDA). 2022 Standard Data Book for Economic Analysis of Agricultural Science and Technology; RDA: Jeonju, Republic of Korea, 2022.
  21. Koo, Y.M. Field capacity and cost analyses of an integrated tractor implement for round ridge preparation. J. Agric. Life Sci. 2021, 55, 115–124. [Google Scholar] [CrossRef]
  22. Statistics Korea. Agricultural Purchase Price Index. Available online: https://kosis.kr/statHtml/statHtml.do?orgId=101&tblId=DT_1J62&conn_path=I3 (accessed on 11 May 2025).
  23. Kim, S.C.; Kim, K.U.; Kim, D.C. Modeling of Fuel Consumption Rate for Agricultural Tractors. J. Biosyst. Eng. 2010, 35, 1–9. [Google Scholar] [CrossRef]
  24. Kang, T.G.; Kim, S.W.; Kim, Y.K.; Lee, S.H.; Jun, H.J.; Choi, I.S.; Yang, E.Y.; Jang, K.S.; Kim, H.G. Analysis of Pick-up Mechanism for Automatic Transplanter (I). J. Agric. Life Sci. 2017, 51, 187–192. [Google Scholar] [CrossRef]
  25. Kwon, Y.K.; Lee, Y.J. Effects of impact by mechanical harvesting on storability of onions (Allium cepa L.). Korean J. Food Preserv. 2023, 30, 811–821. [Google Scholar] [CrossRef]
  26. Hwang, J.S.; Kang, Y.S.; Lee, K.Y.; Kim, W.S. Analysis of the performance of onion harvesters in the onion cultivation environment of Gyeongsangnam-do. J. Agric. Mach. Eng. 2024, 4, 1–8. [Google Scholar] [CrossRef]
Figure 1. Overall experimental procedure for the performance and economic evaluations of mechanization in onion farming operations.
Agronomy 15 01721 g001
Figure 2. Ridge design and planting configuration used in the experiment.
Agronomy 15 01721 g002
Figure 3. Performance evaluation indicators used for manual and mechanized onion cultivation operations in this study.
Agronomy 15 01721 g003
Figure 5. Cost per unit area for operating the (a) transplanter, (b) stem cutter, (c) harvester, and (d) collector individually.
Agronomy 15 01721 g005
Figure 6. Cost per unit area for the fully mechanized cultivation operation, including mechanized transplanting, stem cutting, harvesting, and collection processes.
Agronomy 15 01721 g006
Table 1. Specifications of the transplanter.
ItemsSpecifications
ModelJOPR-4/8
TypeSelf-propelled
ManufacturerJUKAM M&C
NationRepublic of Korea
Dimensions (L × W × H; mm)3230 × 1980 × 2330
Empty weight (kg)728
Working width (mm)1300
Table 2. Specifications of the agricultural tractor used in the experiment.
ItemsSpecifications
ModelTM55
ManufacturerTYM
NationRepublic of Korea
Engine power (kW/rpm)38/2600
Size (L × W × H; mm)3350 × 1720 × 2530
Wheelbase (mm)1960
Empty weight (kg)2160
Table 3. Specifications of the agricultural machinery used in the harvesting operation.
ItemsSpecifications
Stem CutterHarvesterCollector
ModelSH-1500MDHD-D1600GHD-OC800
TypeTractor-mountedTractor-mountedSelf-propelled
ManufacturerShinheung Industrial Co., Ltd.Hyundai Agricultural MachineryHyundai Agricultural Machinery
NationRepublic of Korea
Size (L × W × H; mm)1450 × 1800 × 11501125 × 2040 × 10403300 × 1700 × 2230
Weight (kg)3953391030
Working width (mm)15001600800
Table 4. Input parameters for calculating the hourly fixed cost for each agricultural machine.
ParameterTransplanterStem CutterHarvesterCollector
Tractor rental cost (KRW/day)-250,000250,000-
Purchase price (KRW)49,000,0004,800,0006,700,00030,000,000
Service life (yr)5999
Salvage value (KRW)2,450,000240,000335,0001,500,000
Annual depreciation cost (KRW/yr)9,310,000506,667707,2223,166,667
Annual repair cost (KRW/yr)2,940,000288,000402,0001,800,000
Annual interest (KRW/yr)1,286,250126,000175,875787,500
Annual working time (h/yr)33.55.83.319.6
Table 5. Input parameters for calculating the hourly variable costs for each operation.
ParameterTransplantingStem CuttingHarvestingCollecting
ManualMachineManualMachineManualMachineManualMachine
Hourly fuel consumption (L/h)-4.71-18.6-18.6-3.74
Fuel cost (KRW/L)-1059-1142-1142-1059
Daily labor cost (KRW/day)152,335
Daily working time (h)8
Hourly fuel cost (KRW/h)-4932-20,912-20,912-3917
Hourly labor cost (KRW/h)19,042
Table 6. Results of the performance evaluation by each indicator for the transplanter.
IndicatorsItemsResults
Missing plant rateTotal number of plants4971
Number of missing plants728
Missing plant rate (%)14.6
Field efficiencyWorking time (h/ridge)0.2833
Field efficiency (ha/h)0.053
Table 7. Results of the performance evaluation by each indicator for the stem cutter.
IndicatorsItemsResults
Stem cutting rateTotal number of plants720
Number of uncut stems130
Stem cutting rate (%)82
Onion damage rateTotal number of plants720
Number of damaged onions4
Onion damage rate (%)0.56
Field efficiencyWorking time (h/ridge)0.0488
Field efficiency (ha/h)0.307
Table 8. Results of the performance evaluation by each indicator for the harvester.
IndicatorsItemsResults
Onion damage rateTotal number of plants2514
Number of damaged onions239
Onion damage rate (%)9.5
Onion dropout rateTotal number of plants50
Number of dropped-out onions8
Onion dropout rate (%)16.0
Field efficiencyWorking time (h/ridge)0.0138
Field efficiency (ha/h)0.542
Table 9. Results of the performance evaluation by each indicator for the collector.
IndicatorsItemsResults
Onion damage rateTotal number of plants2514
Number of damaged onions7
Onion damage rate (%)0.28
Onion dropout rateTotal number of plants50
Number of dropped-out onions9
Onion dropout rate (%)18.0
Foreign matter ratioTotal weight (kg)22.255
Clean onion weight (kg)22.04
Foreign matter ratio (%)1.0
Field efficiencyWorking time (h/ridge)0.0207
Field efficiency (ha/h)0.075
Table 10. Fixed, variable, and total costs (in KRW) per hour for manual and mechanized operations.
OperationMethodFixed CostVariable CostTotal Cost
TransplantingManual-19,04219,042
Mechanized403,84123,974427,815
Stem cuttingManual-19,04219,042
Mechanized159,45639,954199,410
HarvestingManual-19,04219,042
Mechanized393,53739,954433,491
CollectingManual-19,04219,042
Mechanized293,68422,958316,643
Disclaimer/Publisher’s Note: The statements, opinions and data contained in all publications are solely those of the individual author(s) and contributor(s) and not of MDPI and/or the editor(s). MDPI and/or the editor(s) disclaim responsibility for any injury to people or property resulting from any ideas, methods, instructions or products referred to in the content.

