Article

Ecofriendly Application of Synthetic Zinc Oxide Nanoparticles as Stress Regulator Bio-Fertilizer for Zea mays


1
Department of Agricultural Biochemistry, Faculty of Agriculture, Cairo University, Giza 12613, Egypt
2
Institute of Agronomy, Georgikon Campus, Hungarian University of Agriculture and Life Sciences, 8360 Keszthely, Hungary
3
Jiangsu Key Laboratory of Crop Cultivation and Physiology, Agricultural College, Yangzhou University, Yangzhou 225009, China
*
Author to whom correspondence should be addressed.
Agronomy 2025, 15(12), 2875; https://doi.org/10.3390/agronomy15122875
Submission received: 3 November 2025 / Revised: 2 December 2025 / Accepted: 11 December 2025 / Published: 14 December 2025

Abstract

Agricultural production is consistently threatened by stressors such as salinity. Few studies have reported on the released antioxidative enzymes and the salinity-responsive genes identified using RNA sequencing and de novo assembly in maize. To further understand the harmony between stressing the maize with a NaCl solution as a compensatory water-irrigation method and spraying regulatory zinc oxide nanoparticles (ZnO/NPs), the salinity-responsive genes were analyzed using RNA sequencing and bioinformatics tools, and the antioxidant enzymatic activities were determined. Differential expression analysis was used to uncover genes that were up-/down-regulated during the experiment. The regulatory pathways and functions of differentially expressed genes (DEGs) were estimated. Glutathione reductase/-s-transferase (GR/GST), peroxidase (POX), superoxide dismutase (SOD), and catalase (CAT) enzymes were determined spectrophotometrically. Mitigating salinity stress with 150 mM NaCl led to significant oxidative stress, markedly elevating enzyme activities: POX and GST by 275% and 254%, GR by 166%, CAT by 91%, and SOD by 56%. Treatment with ZnO/NPs alleviated this stress, decreasing enzyme activity by 61% for GST, 55% for POX, 38% for CAT, 28% for SOD, and 25% for GR. The results of RNA-seq revealed candidate genes related to changes in stressed/non-stressed maize plants, regardless of whether they were sprayed with the nanoparticles or not. This study’s results offer novel insights into the genetic traits of maize subjected to salinity stress and ZnO/nanoparticle application, thereby advancing the comprehension of how ZnO/nanoparticles might alleviate the detrimental impacts of salinity on plants whose properties were enhanced to be used in the eco-friendly synthesis of nanoparticles that were used as a bio-fertilizer in priming plants.

1. Introduction

Maize (Zea mays) is a globally significant crop and currently ranks as the most predominant cereal by production volume [1], poised to emerge as the most extensively grown and traded commodity [2]. Maize is a multifunctional, versatile crop, as various foodstuffs, animal feeds, biofuels, and other industrial products are derived from it, making it the most widely grown cereal crop in the world [1].
Abiotic stress such as salinity cuts crop yields 50–70% [3]. Researchers seek ecological system stability for agricultural flexibility and resilience under challenging conditions [4,5]. Bad farming, climate change, and human activity worsen these difficulties [6]. Immobility makes plants sensitive to environmental dangers [7]. Especially in arid and semi-arid climates, salt stress is a significant factor that hinders plant growth and productivity [8]. Researchers have found that high soil salinity disrupts the ion balance of plants, inhibits their ability to absorb water, and causes oxidative damage [9,10,11]. It was found that salt stress damaged agricultural soils, indirectly injuring humans and animals [12]. To counteract the negative impacts of salt stress on crop yields, there is an urgent need for sustainable agricultural approaches. This response addresses the growing global population and increasing demand for food [13,14].
The use of nanomaterials to enhance plant stress tolerance has emerged as a promising, long-term, cost-effective, and environmentally friendly solution to improving agricultural efficiency in recent years [15]. This method has the potential to be environmentally benign. The ability of plants to tolerate salt is enhanced by nanomaterials, which reduce osmotic and ionic stress, protect photosynthesis, and facilitate the detoxification of reactive oxygen species (ROS) [16,17].
ZnO/NPs are one example of a material that can help maize plants seedlings flourish despite salt stress [18,19]. Several studies have shown that seed priming [20,21,22] and foliar application [23,24] using ZnO/NPs can significantly enhance the germination rate of some plants when they are subjected to salt stress. Zinc nanoparticles may alter antioxidant enzymes [25]. ZnO–nutrient nanoparticles improve plant shape, biological processes, and biochemical activities, enhancing reproduction and agricultural yields, especially under drought and salinity [26]. Its biological properties and chlorophyll, carotenoids, carbohydrates, and protein levels improved significantly. Nutrition’s effect on wheat was supported by protecting against oxidation enzymes such POX, SOD, CAT, and total flavonoid content [27]. Due to the environmental friendliness of ZnO/NPs, their production has received attention.
The next-generation sequencing (NGS) technology, which provides a wealth of high-resolution genotypic data, has made it possible to sequence the entire genome at a cost that is more affordable and in a substantially shorter amount of time [28]. In addition to model organisms such as Arabidopsis thaliana, which is known for having a relatively short genome, the development of next-generation sequencing (NGS) technology has made it easier to identify nucleotide sequences in plants [29]. The Zea mays reference genome [30], the establishment of a comprehensive multi-parent population strategy such as nested association mapping (NAM) [30,31], genome-wide association studies (GWAS), RNA sequencing, and bioinformatics approaches have enhanced knowledge of genetic diversity and stress response pathways.
This work provides empirical evidence that plant defense mechanisms can be chemically triggered by substances such as ZnO/NPs. This activation could allow plants to successfully combat abiotic stressors, such as salt, therefore alleviating physiological damage from severe environmental circumstances. RNA-seq analysis was employed to delineate transcriptome alterations in maize plants subjected to NaCl stress. This study examines the differential expression of metabolic genes and assesses the effectiveness of ZnO-NPs in regulating gene expression, antioxidant enzyme activity, and phenolic content to mitigate salt stress.
This study is considered supplementary to prior research on field-grown maize [32], as the corn husk was harvested at the end of the experiment and used to synthesize ZnO/NPs, which were then applied as a bio-based fertilizer to prime wheat plants [33]. Consequently, the study aimed to investigate the characteristics of the maize plants whose husks were earlier used in the formation of greenly synthesized nanoparticles.

2. Materials and Methods

2.1. Design and Executing the Experiment

The treatments that were analysed/combined in the current article were as follows: M1: control treatment, irrigation only with tap water, M2: irrigation with saline solution (150 mM sodium chloride solution), M3: irrigation with 150 mM sodium chloride solution + 2 g L−1 ZnO/NPs, and M4: irrigation with tap water + 2 g L−1 ZnO/NPs. On 29 July 2023, intact, healthy leaves were collected for enzymatic analysis and preserved at −80 °C until required. Four 0.1 g biological replicates were obtained for transcriptome analysis, immersed in 1 mL of RNALater solution, and preserved at −20 °C until processing. All samples were obtained from healthy, mature young leaves and preserved in 1 mL of RNALater at −22 °C until sequencing. Maize was harvested on 22 September 2023. Following the harvest of the plants, the corn husks were desiccated and utilized to synthesize environmentally friendly ZnO/NPs, which were employed to prime wheat seeds to enhance their ability to face drought stress [33].

2.2. Synthesis and Characteristics of ZnO/NPs

In accordance with the methodologies employed in our previous research, the chemical synthesis and characterization of ZnO nanoparticles were conducted [32]. We synthesized ZnO/NPs by combining NaOH and Zn(NO3)2·6H2O in water and allowing the mixture to precipitate. Ultrasonic vibrations were used to dissolve white crystals in distilled water, producing varying quantities of ZnO/NPs suitable for foliar application.

2.3. Measuring the Total Flavonoids (TFs) and Total Phenolics (TPs)

The aluminum chloride colorimetric method was utilized in order to determine the flavonoid amounts that were present in maize aqueous extracts [34]. While the Folin–Ciocalteu reagent method was utilized in order to accomplish the quantification of the phenolic content [34].

2.4. Phenolic Profile; High-Performance Liquid Chromatography (HPLC) Analysis

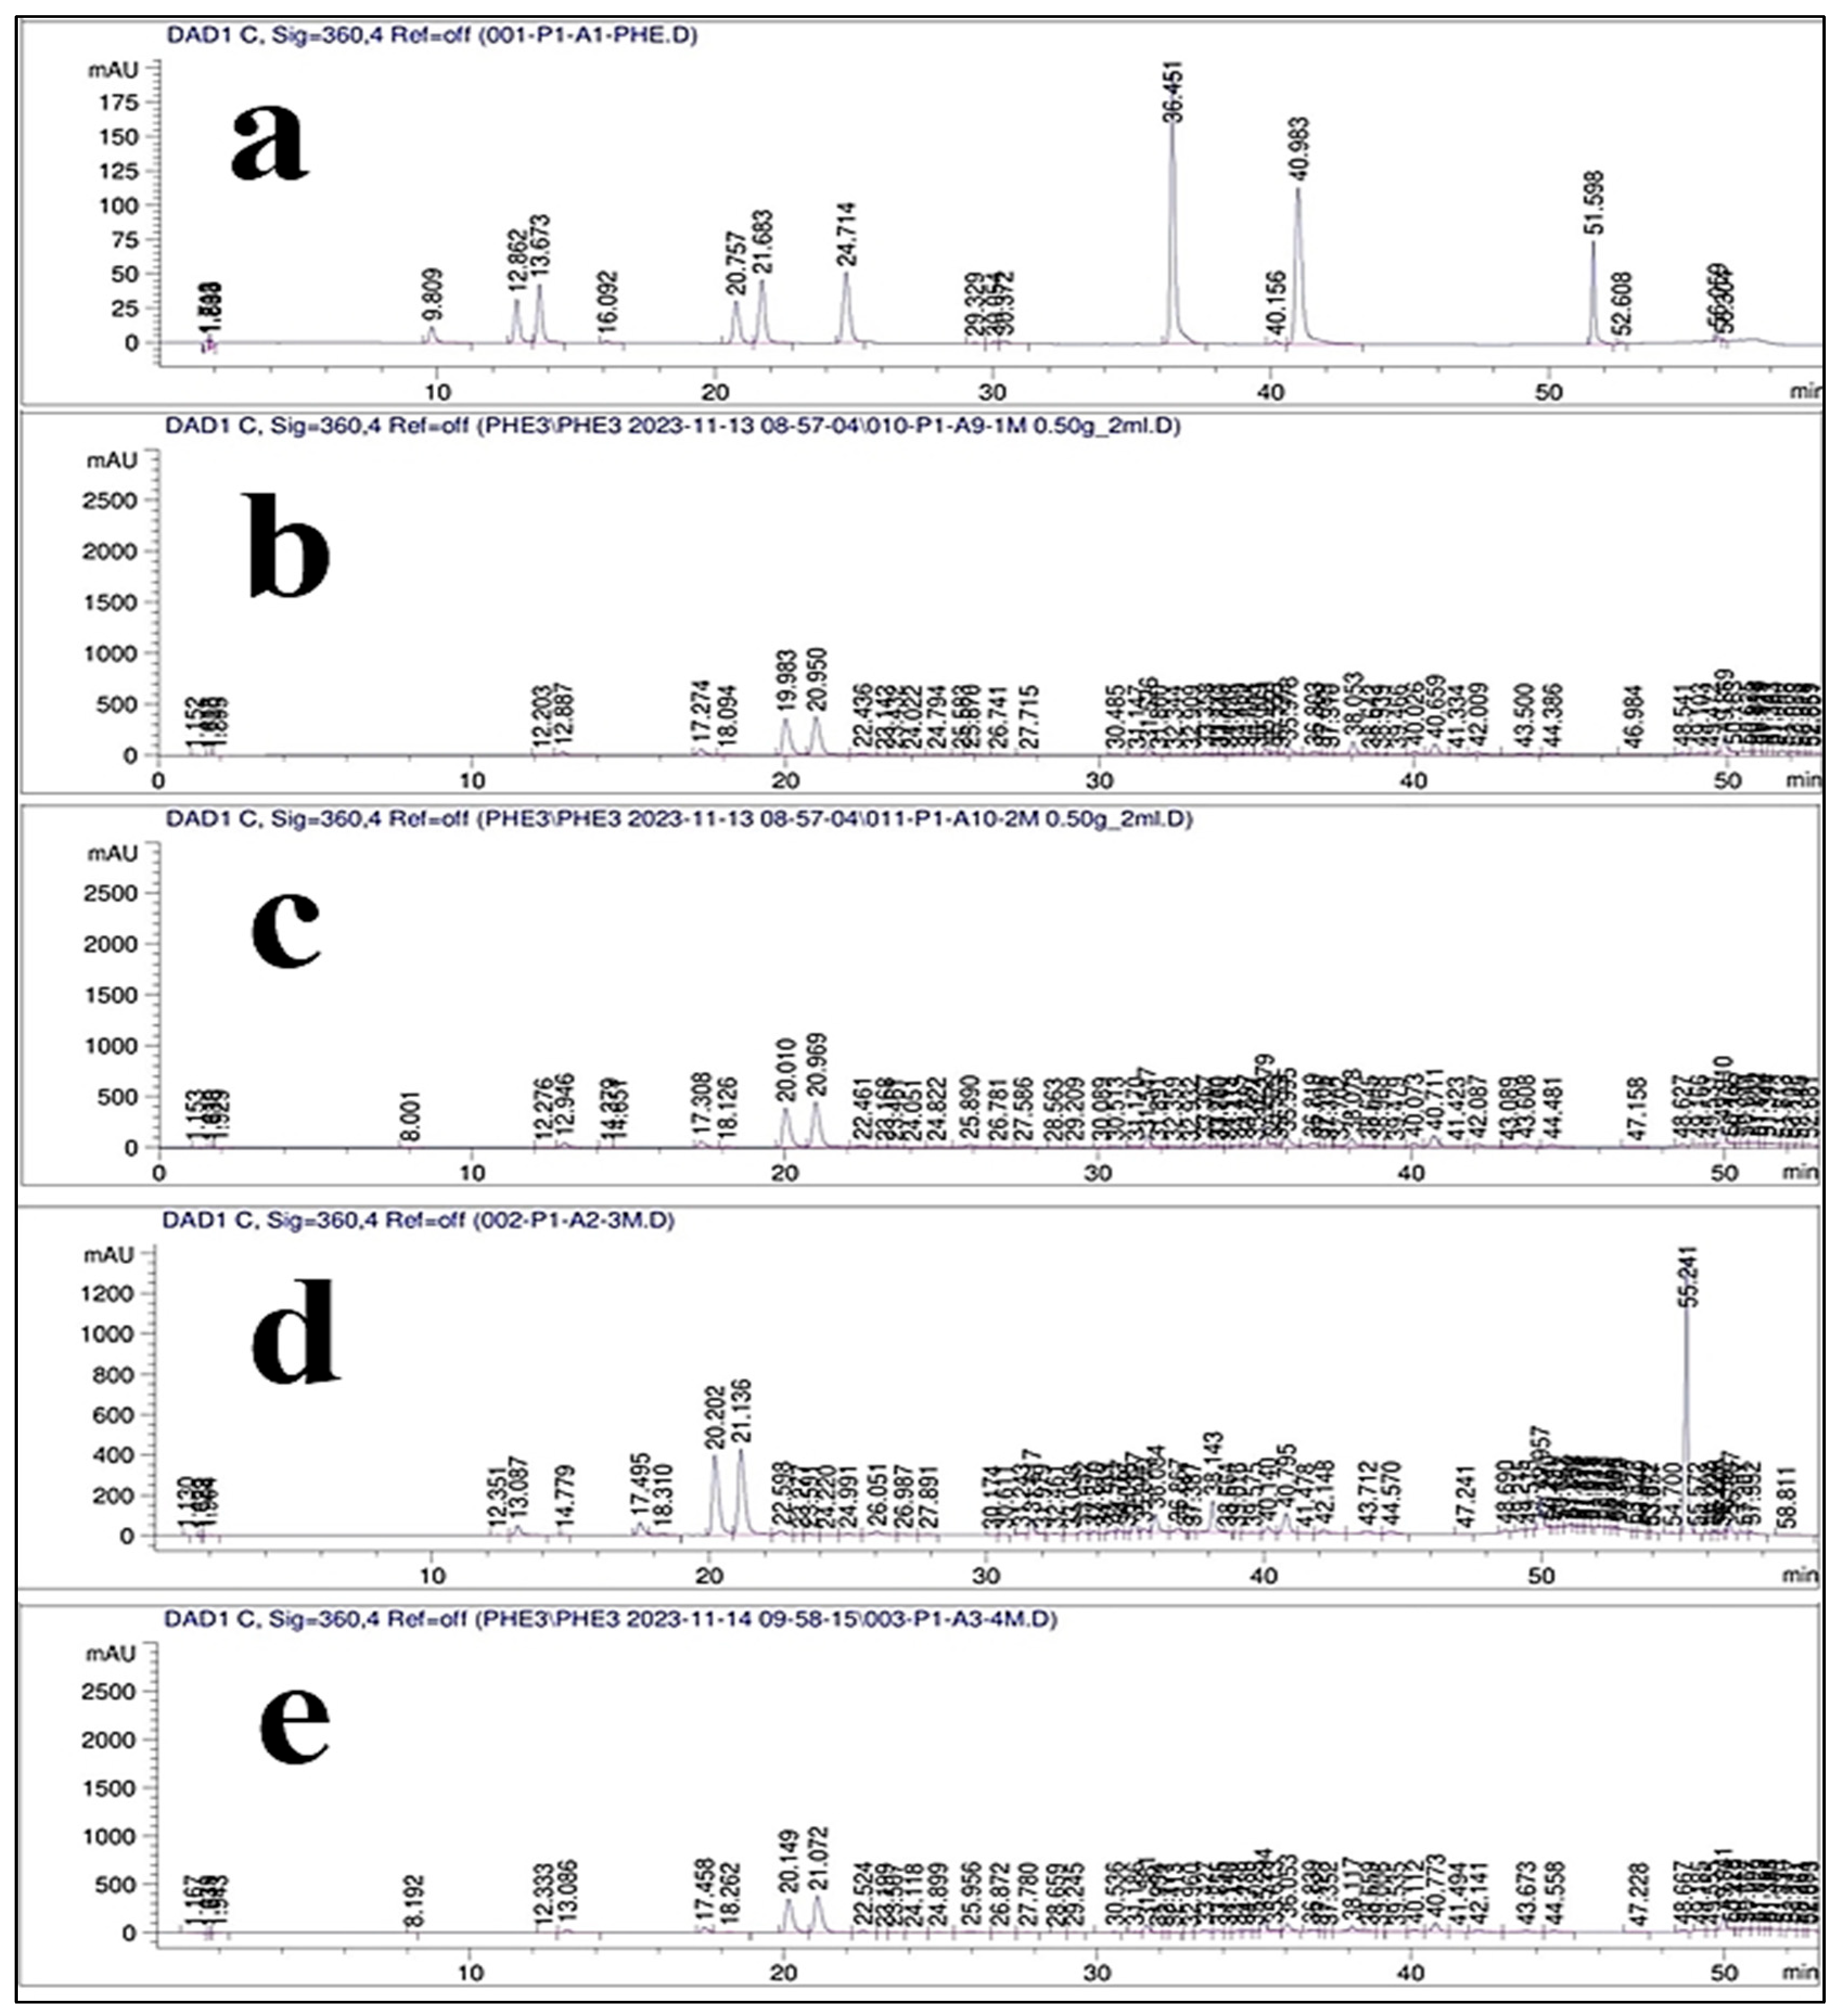
Powdered samples underwent alkaline hydrolysis by being suspended in 20 mL of 2 M NaOH within nitrogen-purged, sealed conical flasks. After 4 h of agitation at ambient temperature, the mixture was acidified to pH 2 with 6 M HCl and subjected to centrifugation at 5000 rpm for 10 min. The supernatant was collected and underwent liquid–liquid extraction with 50 mL of a 1:1 v/v mixture of ethyl ether and ethyl acetate, performed twice. The organic layer was gathered, desiccated at 45 °C, and reconstituted in 2 mL of methanol. Chromatographic separation was conducted using an Agilent Technologies 100 series (Santa Clara, CA, USA) equipment with an autosampler and a diode-array detector (DAD). The stationary phase consisted of an Eclipse XDB-C18 column (150 × 4.6 mm; 5 µm) safeguarded by a Phenomenex C18 guard column. The mobile phase comprised acetonitrile (Solvent A) and 2% aqueous acetic acid (Solvent B), administered at a flow rate of 0.8 mL/min. The elution gradient was configured as follows: 100–85% B (0–30 min), 85–50% B (30–50 min), 50–0% B (50–55 min), and 0–100% B (55–60 min). Samples were filtered through a 0.45 µm Acrodisc syringe filter prior to the 50 µL injection. Detection was concurrently monitored at 280 nm (benzoic acids), 320 nm (cinnamic acids), and 360 nm (flavonoids) [35,36]. Compounds were identified by comparing retention durations and UV spectra with authentic standards (Figure A1).

2.5. Preparation of the Enzymatic Extraction Buffer and Determining the Enzymatic Activities of Peroxidase, Glutathione Reductase/-s-Transferase, Superoxide Dismutase, and Catalase

Table 1 demonstrates the protocols of preparing the enzymes and estimating their activities.

2.6. Studying Gene Expression Across the Transcriptome

Utilizing NEXTFLEX® Poly(A) Beads 2.0, messenger RNA was extracted from leaf tissue samples with a RIN of 7 or higher. The NEXTFLEX® Rapid Directional RNA-Sequence Kit 2.0 facilitated strand-specific RNA library creation for sequencing on Illumina® systems, specifically the NovaSeq 6000, which generated paired-end reads averaging between 10 and 12 million per sample. Quality parameters were assessed using FastQC software (version 0.12.0), followed by secondary filtration with Trimmomatic to refine the data. A de novo transcript was constructed from high-quality reads employing the Trinity tool in OmicsBox Biobam software (version 3.4). The study produced a de novo transcriptome without reference genome knowledge, measuring transcript expression levels to identify differentially expressed genes (DEGs) across different treatments, including salinity stress and ZnO/NPs. Gene enrichment analyses were conducted to explore up- and down-regulation of genes through pairwise comparisons of treatment datasets [43,44,45,46,47,48]. The paired analysis involved four comparisons. These comparisons are summarized as M1 × M2, M1 × M3, M1 × M4, and M2 × M3.

2.7. Statistical Analysis

This experimental investigation repeated all treatments four times and reported averages with standard errors. The statistical analysis used JASP 0.19.3.0. After Shapiro–Wilk and Levene tests, the data satisfied normal distribution and homogeneity criteria, hence the study used a one-way ANOVA to compare groups. The significance level for Tukey’s range test was 5%.

3. Results

3.1. The Synthesis of ZnO/NPs and Their Experimental Characteristics

Previous research conducted by our team provided a comprehensive account of the chemical synthesis and characterization of ZnO/NPs [32]. ZnO/NPs had a UV-Vis spectrophotometer absorption peak at 403 nm. The transmission electron microscopy (TEM) picture shows that most ZnO nanoparticles are hexagonal, indicating high quality. Scanning electron microscopy (SEM) showed ZnO/NPs were uniformly shaped. Energy-dispersive X-ray spectroscopy (EDAX) showed that ZnO/NPs had uniform zinc (Zn) and oxygen (O) distributions and residual NaNO3. After two hours of synthesis at 200 degrees Celsius, ZnO nanoparticles had a monomodal size distribution with a half-width of 41.166 nanometers. The reported Zeta potential was −21.4 mV.

3.2. Phenolic Profile

The phenolic compounds generated from the maize stress treatments (M2 and M3) exhibited higher concentrations, totaling 1030.12 and 1099.81 µg/g, respectively, as indicated in Table 1. The amounts of the compounds from the treatments not exposed to stress (M1 and M4) were determined to be 917.37 and 966.99 µg/g, respectively. Table 2 shows the presence of 17 phenolic compounds, but gentisic acid, apigenin-7-glucoside, and kaempferol were not detected.
The results are presented in Table 3, which shows that there was a correlation between the increase in salt concentrations in maize leaves and the corresponding increase in TPs and TFs. The treatments had a considerable impact on the amount of TPs and TFs. It was found that the second stressed treatment (M2) had the highest concentrations in comparison to the other stressful treatment (M3) and the treatment that was sprayed with 2 g L−1 ZnO/NPs (M4). In order to bring the secretion of the TPs and TFs into alignment with the non-stressed treatments (M1 and M4), the latter were controlled. With concentrations of 28.42 ± 0.47 µg GAE/g DW for total phenolics (TPs) and 19.919 ± 0.06 µg QE/g DW for TFs, respectively, the second treatment (stressed) (M2) displayed the highest values of estimated TPs and TFs in comparison to the other treatments, which included both stressed and non-stressed treatments (M1, M3, and M4).

3.3. Determination of the Antioxidant Enzyme Activities

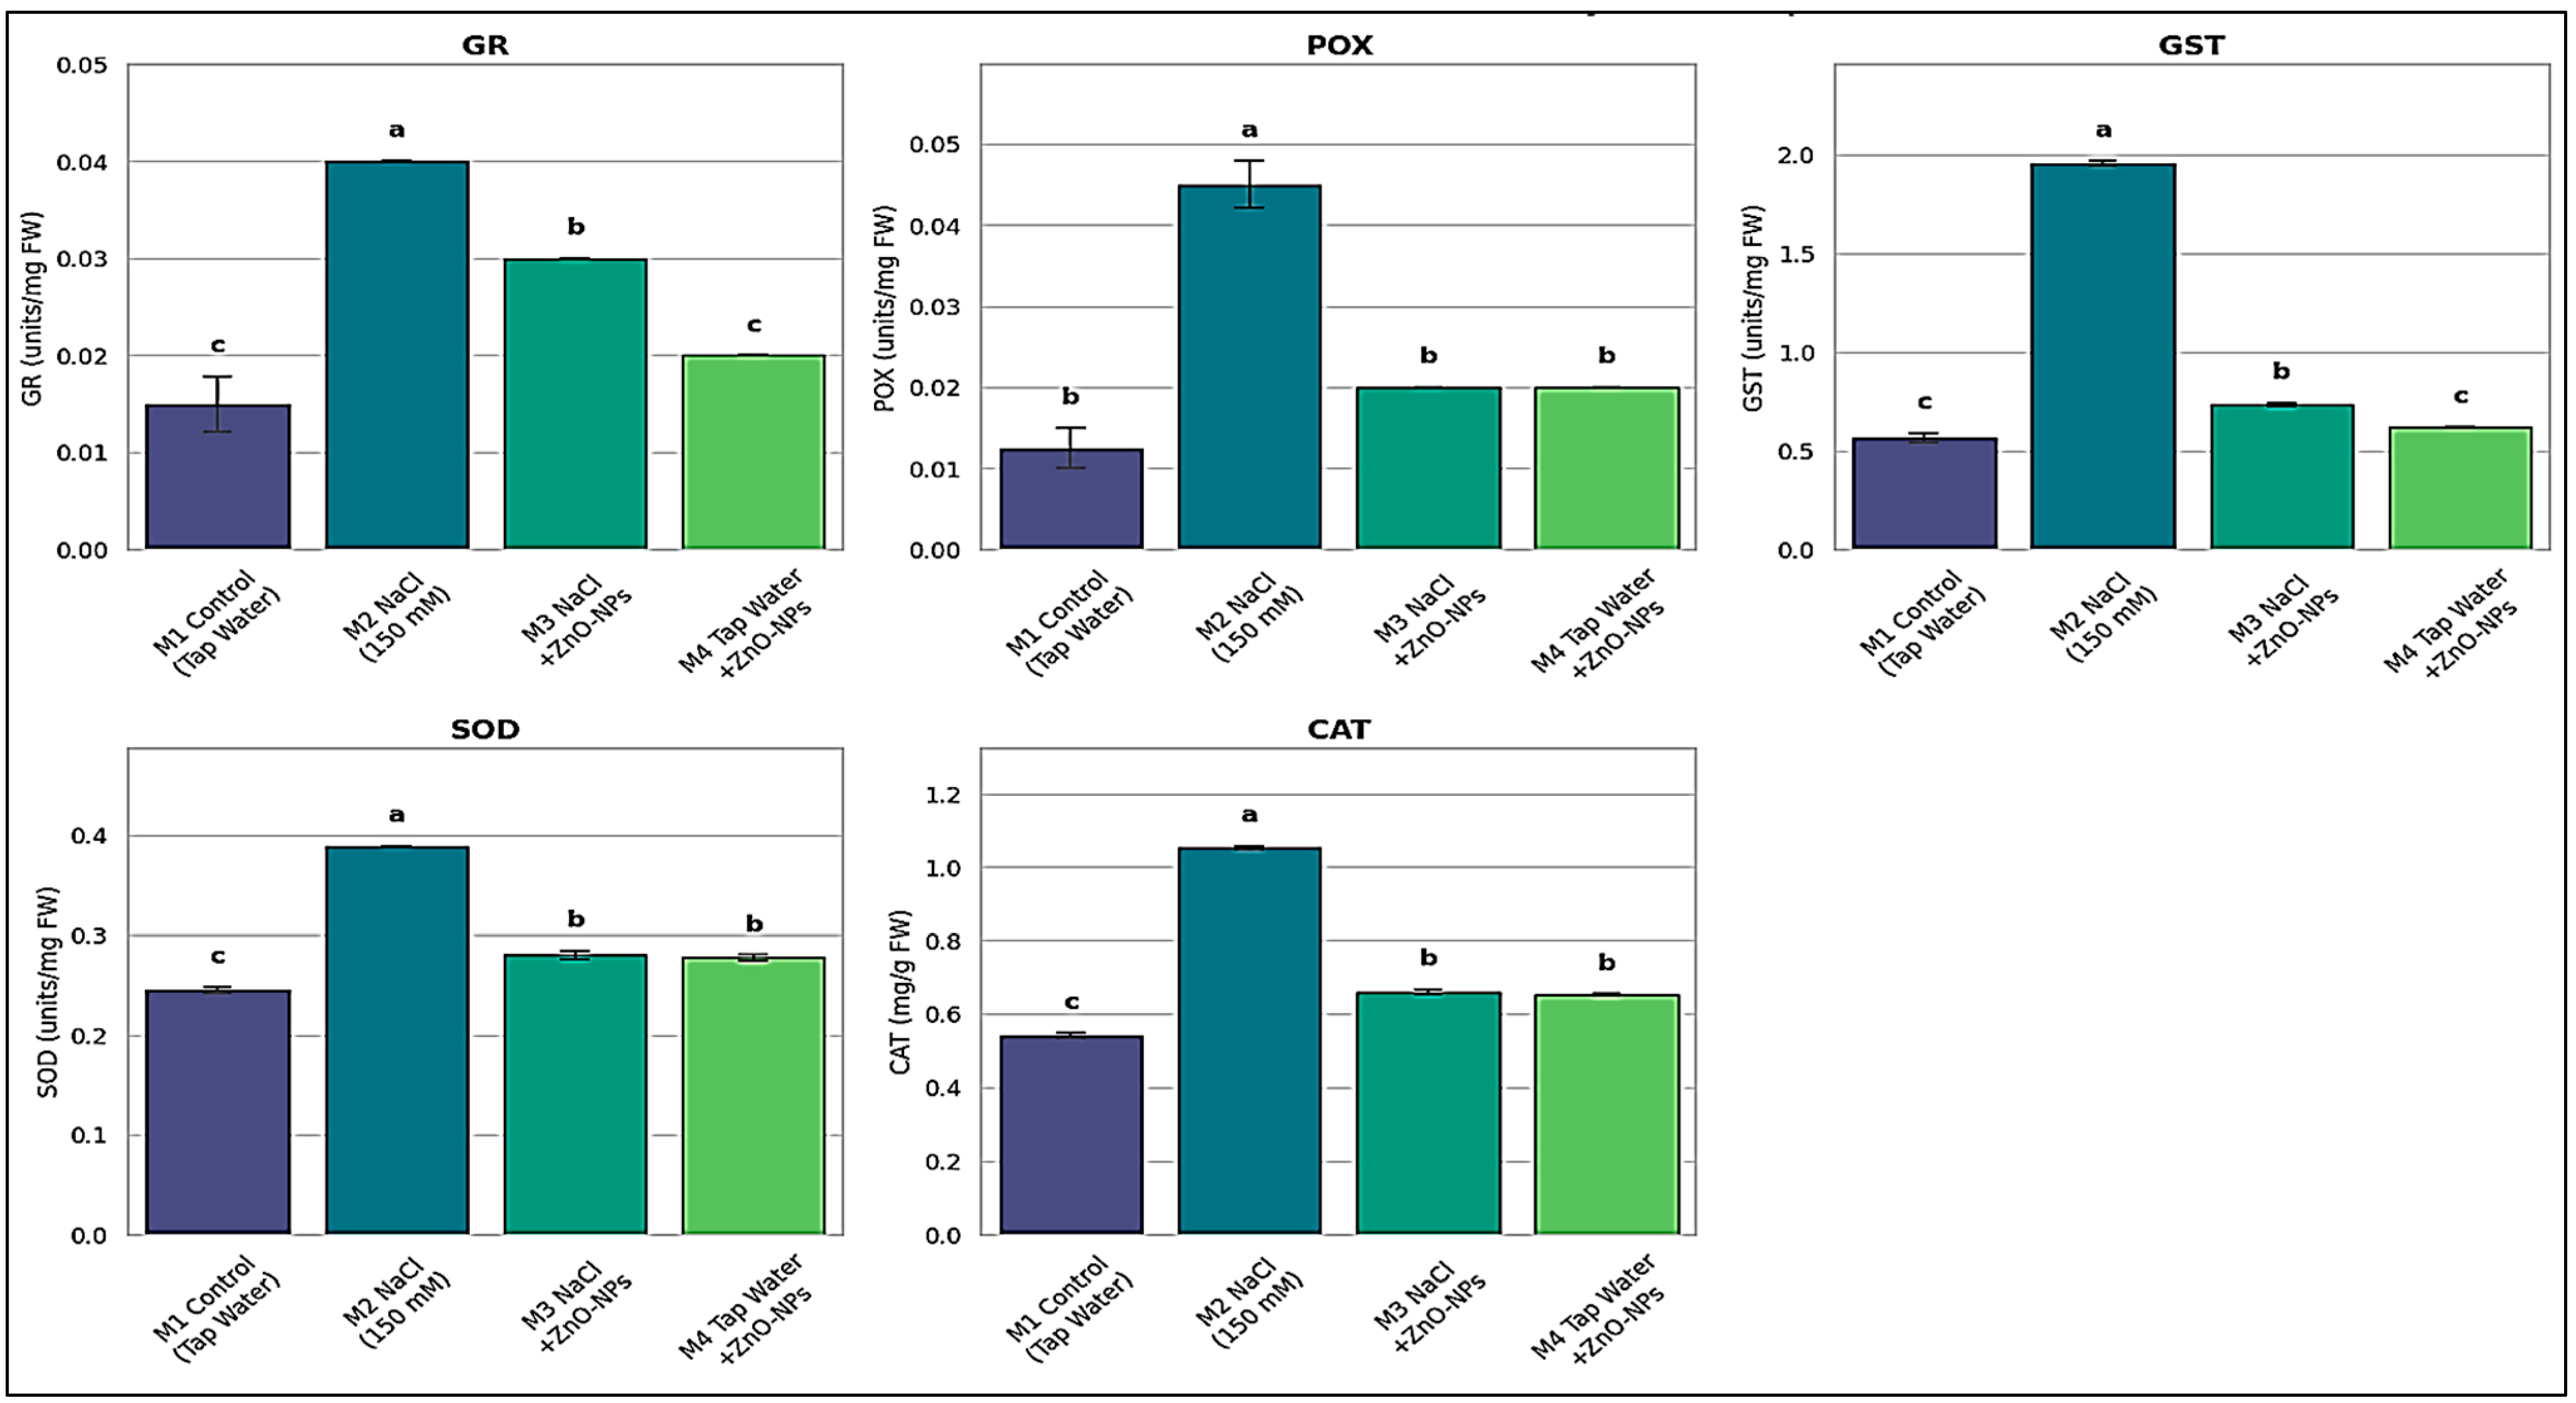
Figure 1 illustrates the enzymes extracted from maize leaves. They were GR, POX, GST, SOD, and CAT. The second stressed group, which was not sprayed with ZnO/NPs (M2), exhibited the highest production of antioxidant enzymes. A trend observed across all released enzymes. The plants subjected to 150 mM NaCl stress and treated with 2 g L−1 ZnO/NPs (M3) exhibited elevated levels of all estimated enzymes compared to the control plants that were not stressed (M1) and those that were not stressed but received ZnO/NPs treatment (M4). The control plants produced the lowest quantity of enzymes relative to the other treatments. These plants were not subjected to sodium chloride stress and were not administered ZnO/NPs (M1). The plants subjected to 2 g L−1 of ZnO/NPs produced equivalent amounts of SOD and CAT enzymes, irrespective of the stress induced by NaCl.
Strategies for managing salinity stress exposure to 150 mM NaCl (M2) resulted in severe oxidative stress, causing a pronounced overexpression of all assessed enzymes relative to the control (M1). POX and GST experienced the most significant increases, rising by around 275% and 254%, respectively. GR and CAT experienced substantial gains of 166% and 91%, respectively. SOD, conversely, experienced a modest yet notable increase of 56%. This considerable rise indicates that the plant’s defense mechanisms are actively combating ROS induced by salt.
Administrating ZnO/NPs to salt-stressed plants (M3) substantially alleviated stress, resulting in markedly reduced enzyme activity compared to the salt treatment (M2). The most prominent impact of the restoration was observed in GST and POX, which experienced a decline in activity of 61% and 55%, respectively. CAT and SOD activities decreased by 38% and 28%, respectively, whereas GR activity declined by 25%.

3.4. Analysis of All RNA Transcripts (Transcriptome)

Following de novo assembly, 22,108 contigs were generated from 201 bp maize raw reads (Table S1-1). The number of assembled bases ranged from 6,174,394 to 7,623,144. To demonstrate assembly continuity, we measured the N50 length, and it was 357 bp with an average length 344.8 bp. The N50 number indicates the utilization of single-end sequencing data; yet the discovered transcripts were adequate to map the essential metabolic genes associated with salt stress. Transcriptome Shotgun Assembly (TSA) retains transcript sequences generated by computational methods utilizing primary data sources, such as raw sequencing data from next-generation sequencing archives (SRAs). We compiled overlapping transcriptome data into contigs (Table S1-1) utilizing a computer. Contig expression levels must be assessed due to differential expression analysis.
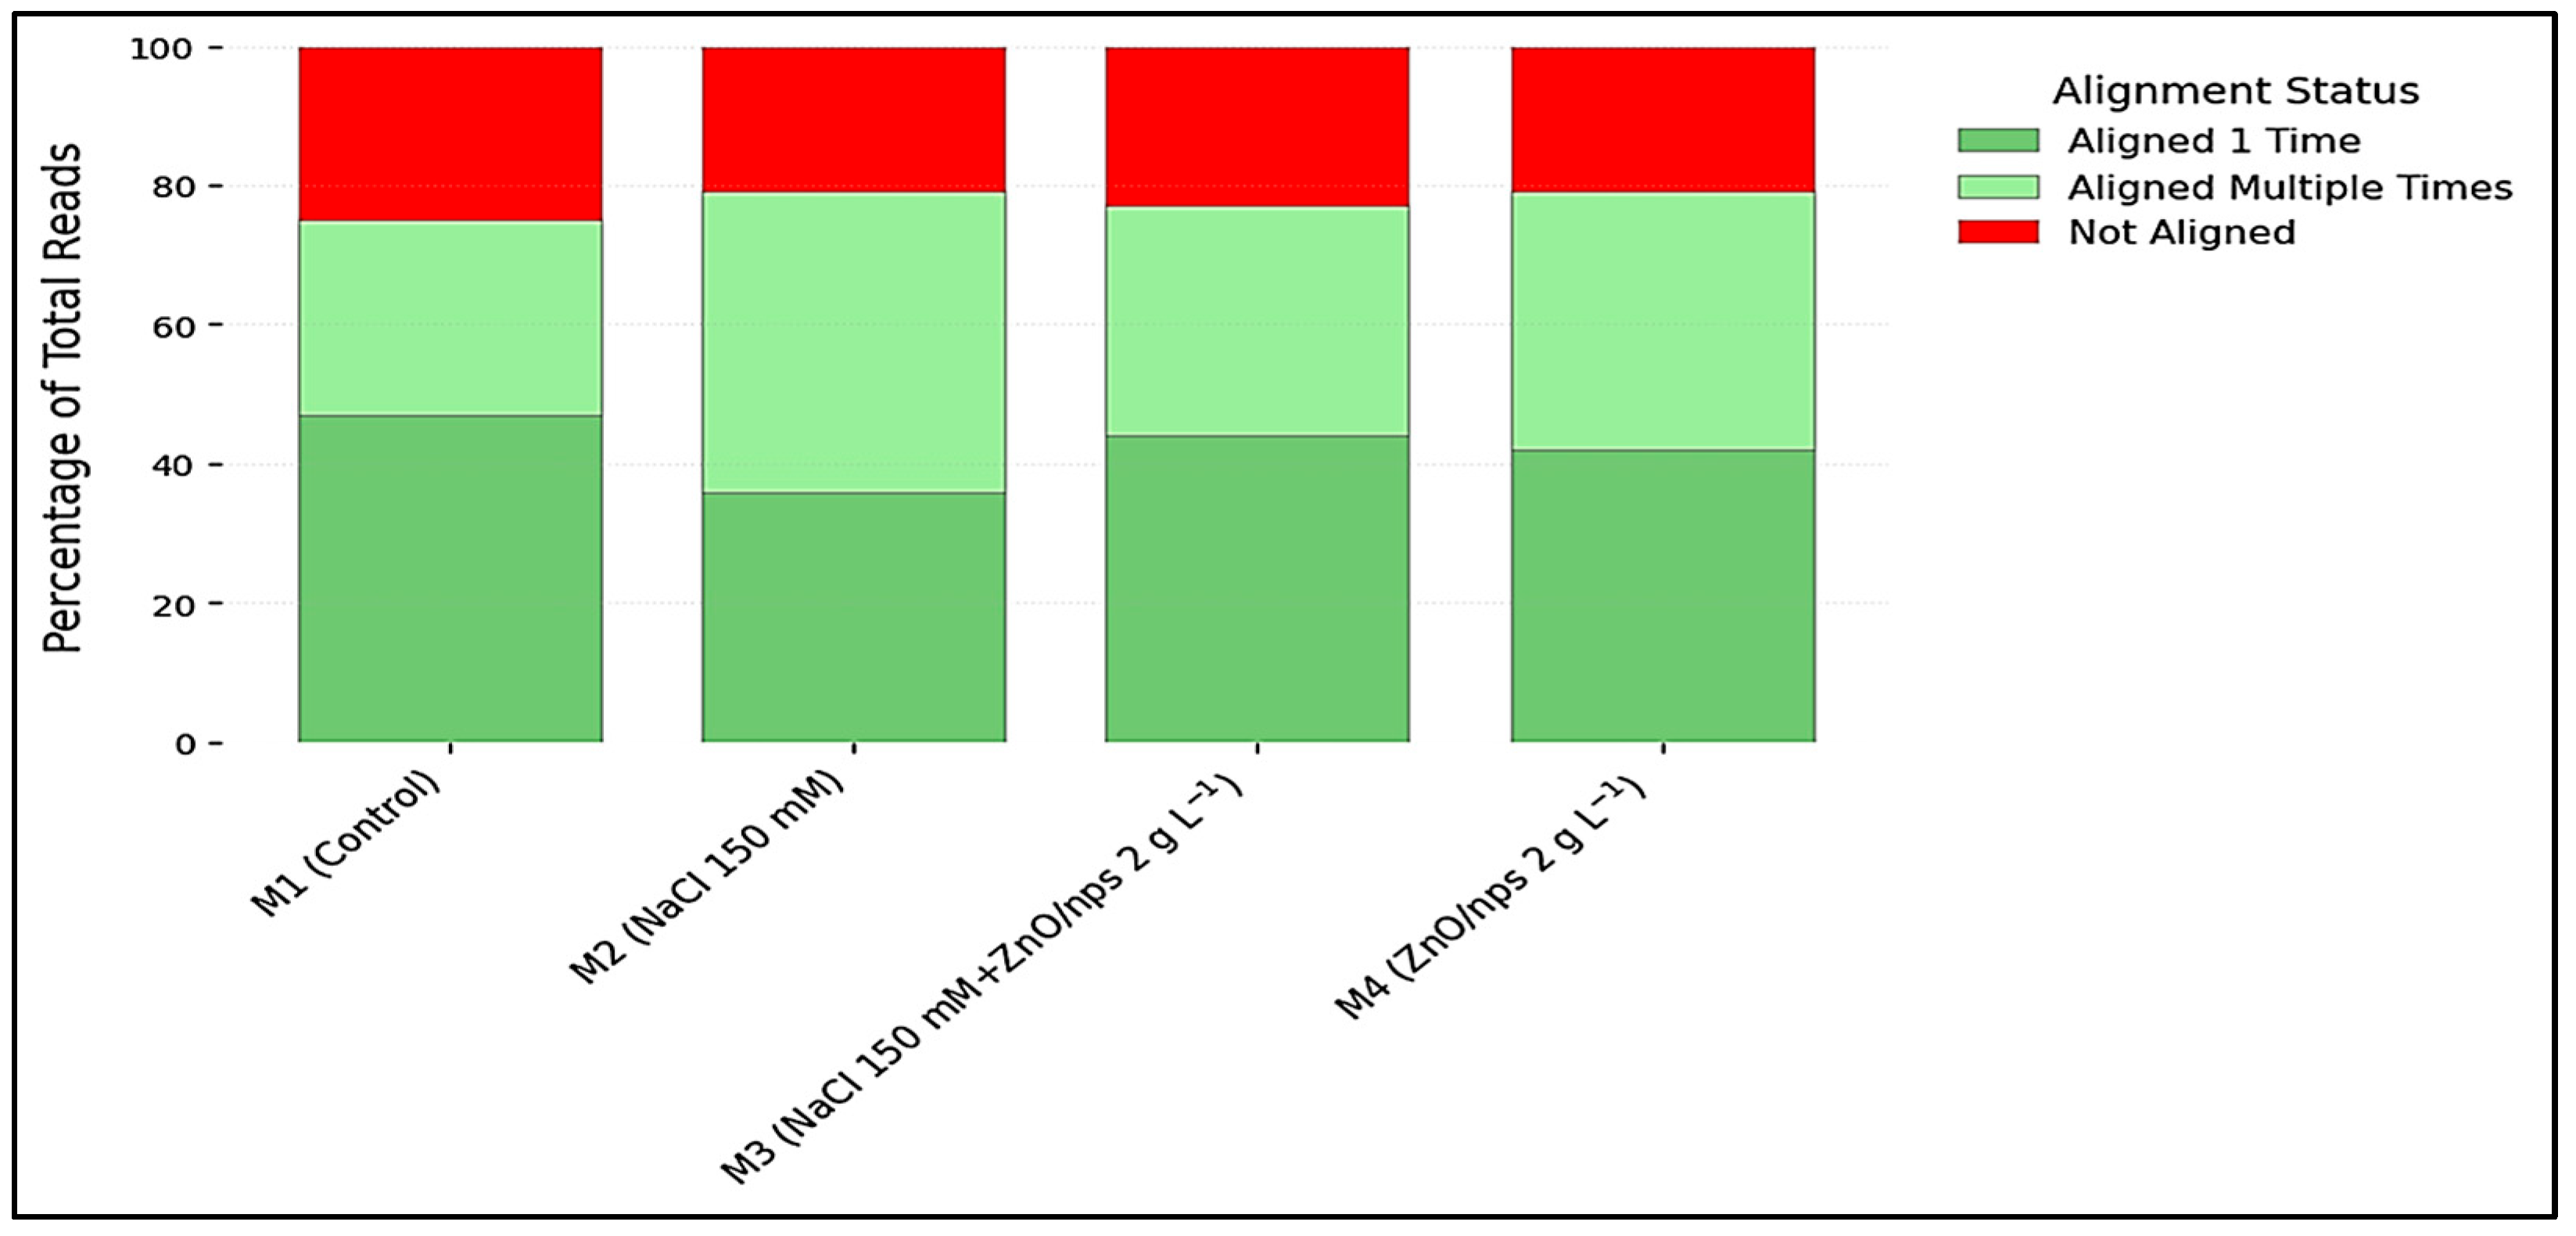
The number of reads that were aligned in more than one way is shown in Figure 2. It was obtained from a total of four libraries that were processed. In the control (M1) set, it was 3,425,366; in the salinity-stressed treatment (M2) set, it was 4,473,091; in the salinity-stressed and sprayed with ZnO/NPs 2 g L−1 treatment (M3) set, it was 3,687,807; and in the sprayed with ZnO/NPs 2 g L−1 treatment (M4) set, it was 4,553,038.
The treatments impacted the sequences, resulting in the generation of 18,893 supertranscript contigs, as detailed in Table S1-2. The comparison of the control and salinity-stressed plant datasets revealed 8518 differentially expressed (DE) sequences, comprising 347 up-regulated and 8171 down-regulated sequences (Table S2-1). The threshold for differential expression was set at a “Probability > 0.9”. It was the statistical cutoff.
Upon comparison of the datasets from control plants and stressed plants sprayed with ZnO/NPs, we identified 3507 differentially expressed (DE) sequences, comprising 632 up-regulated and 2875 down-regulated sequences (Table S2-2). The examination of the data from control and ZnO/NPs-sprayed plants at 2 g L−1 yielded 4438 differentially expressed (DE) sequences, comprising 509 up-regulated and 3929 down-regulated sequences (Table S2-3). Upon comparison of the datasets for plants subjected to salt stress and those experiencing salinity stress with 2 g L−1 ZnO/NPs, we identified 3301 differentially expressed (DE) sequences, comprising 2642 up-regulated and 389 down-regulated sequences (Table S2-4).
Pathway analysis utilizing the Plant Reactome (PR) and Kyoto Encyclopedia of Genes and Genomes (KEGG/PR) of these sequences was prioritized to elucidate the mitigation mechanism, demonstrating significant enrichment in antioxidant defense pathways as outlined in Tables S3-1, S3-2, S3-3 and S3-4. The pairwise comparison of control (M1) and salt-stressed (M2) plants demonstrated a substantial reduction in gene expression attributable to salinity, with 8171 sequences significantly downregulated, linked to 270 KEGG and 626 PR pathways. In contrast, merely 347 sequences were elevated, associated with 55 KEGG pathways. The functional investigation of these elevated genes concentrated on identifying immediate stress-response pathways, particularly to isolate early indicators of antioxidant defense activation during extensive metabolic suppression. The utilization of ZnO nanoparticles prompted significant transcriptome alterations.
In the comparison of control and salt-stressed ZnO/NPs-sprayed plants (M1 vs. M3), 632 sequences were upregulated, corresponding to 109 KEGG pathways, whereas the comparison of control and ZnO/NPs-sprayed plants (M1 vs. M4) yielded 509 upregulated sequences. Importantly, these profiles indicate that ZnO nanoparticles regulate the expression of genes associated with metabolic stability, even in saline environments.
The contrast between salt-stressed (M2) and salt-stressed ZnO/nanoparticle-sprayed plants (M3) underscored the restorative efficacy of the nanoparticles. This comparison produced 2642 upregulated sequences, significantly contrasting with the extensive downregulation noted under salt stress alone. A pairwise differential analysis of the top 50 contigs was conducted, involving blasting (version 3.4), mapping, and annotating these contigs. The analysis identified the top 50 upregulated and downregulated sequences, with metabolic pathways examined utilizing the KEGG database, as detailed in Table 4 (Tables S4-1, S4-2, S4-3 and S4-4).
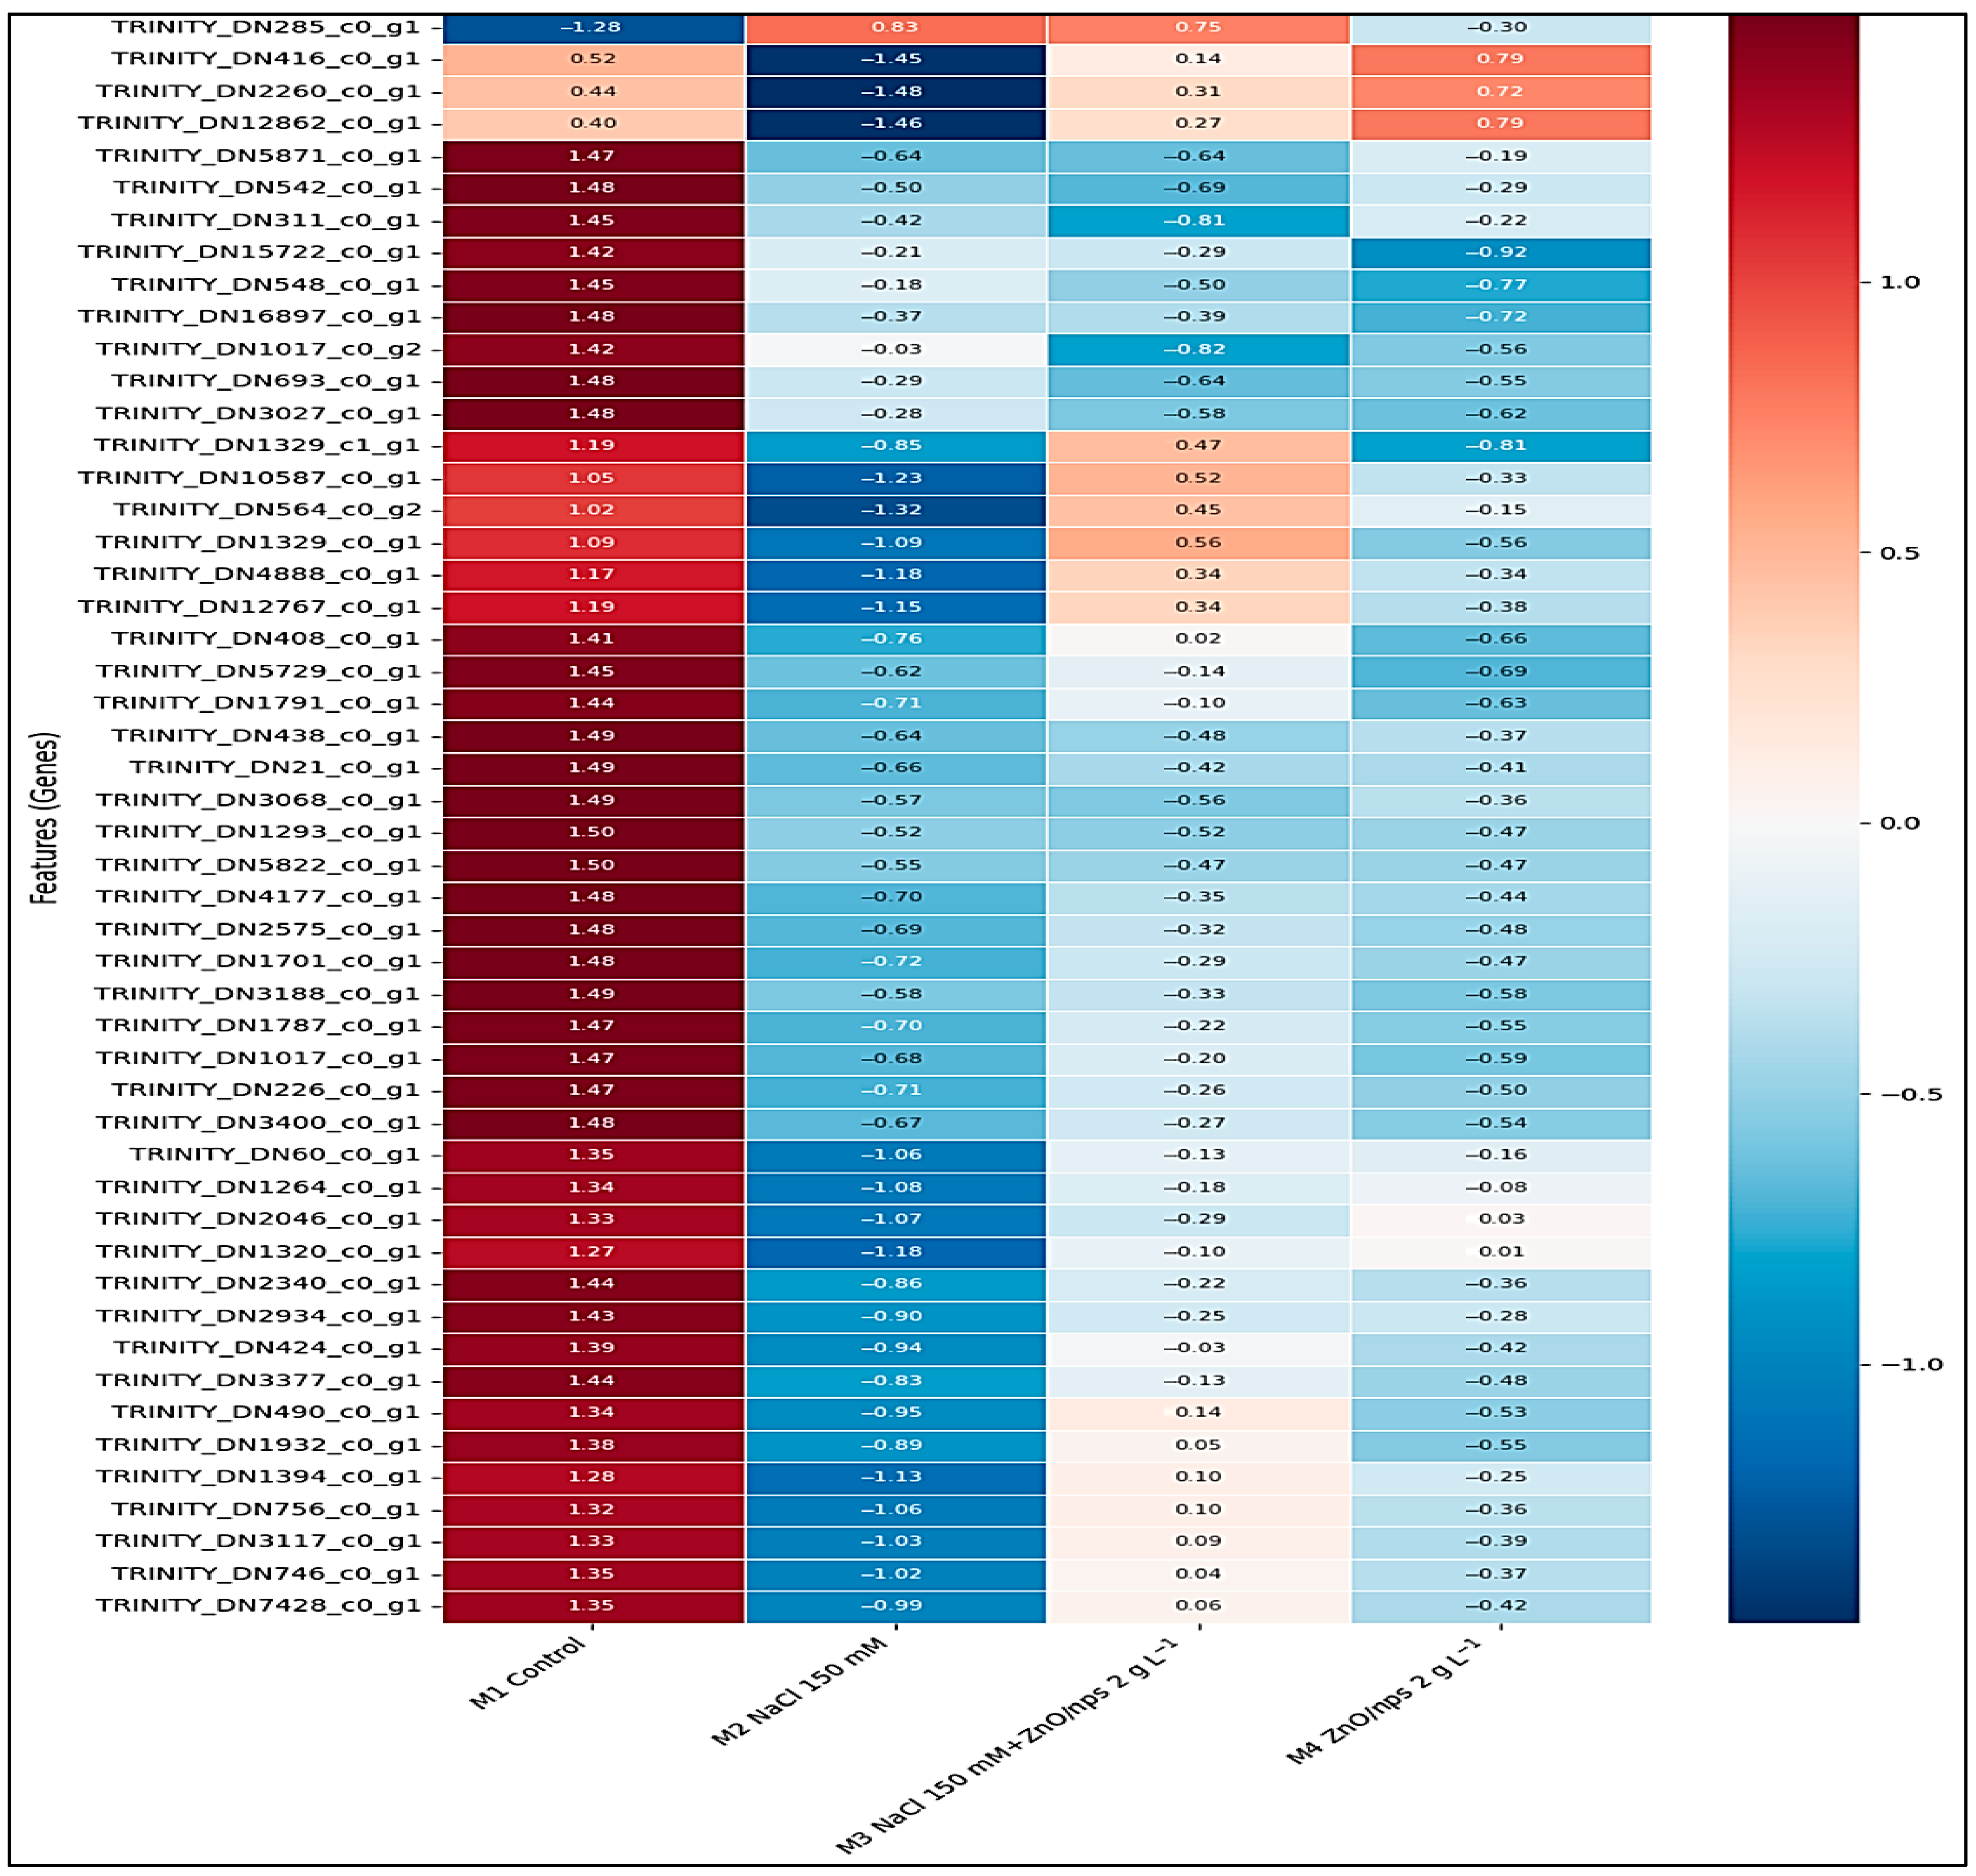
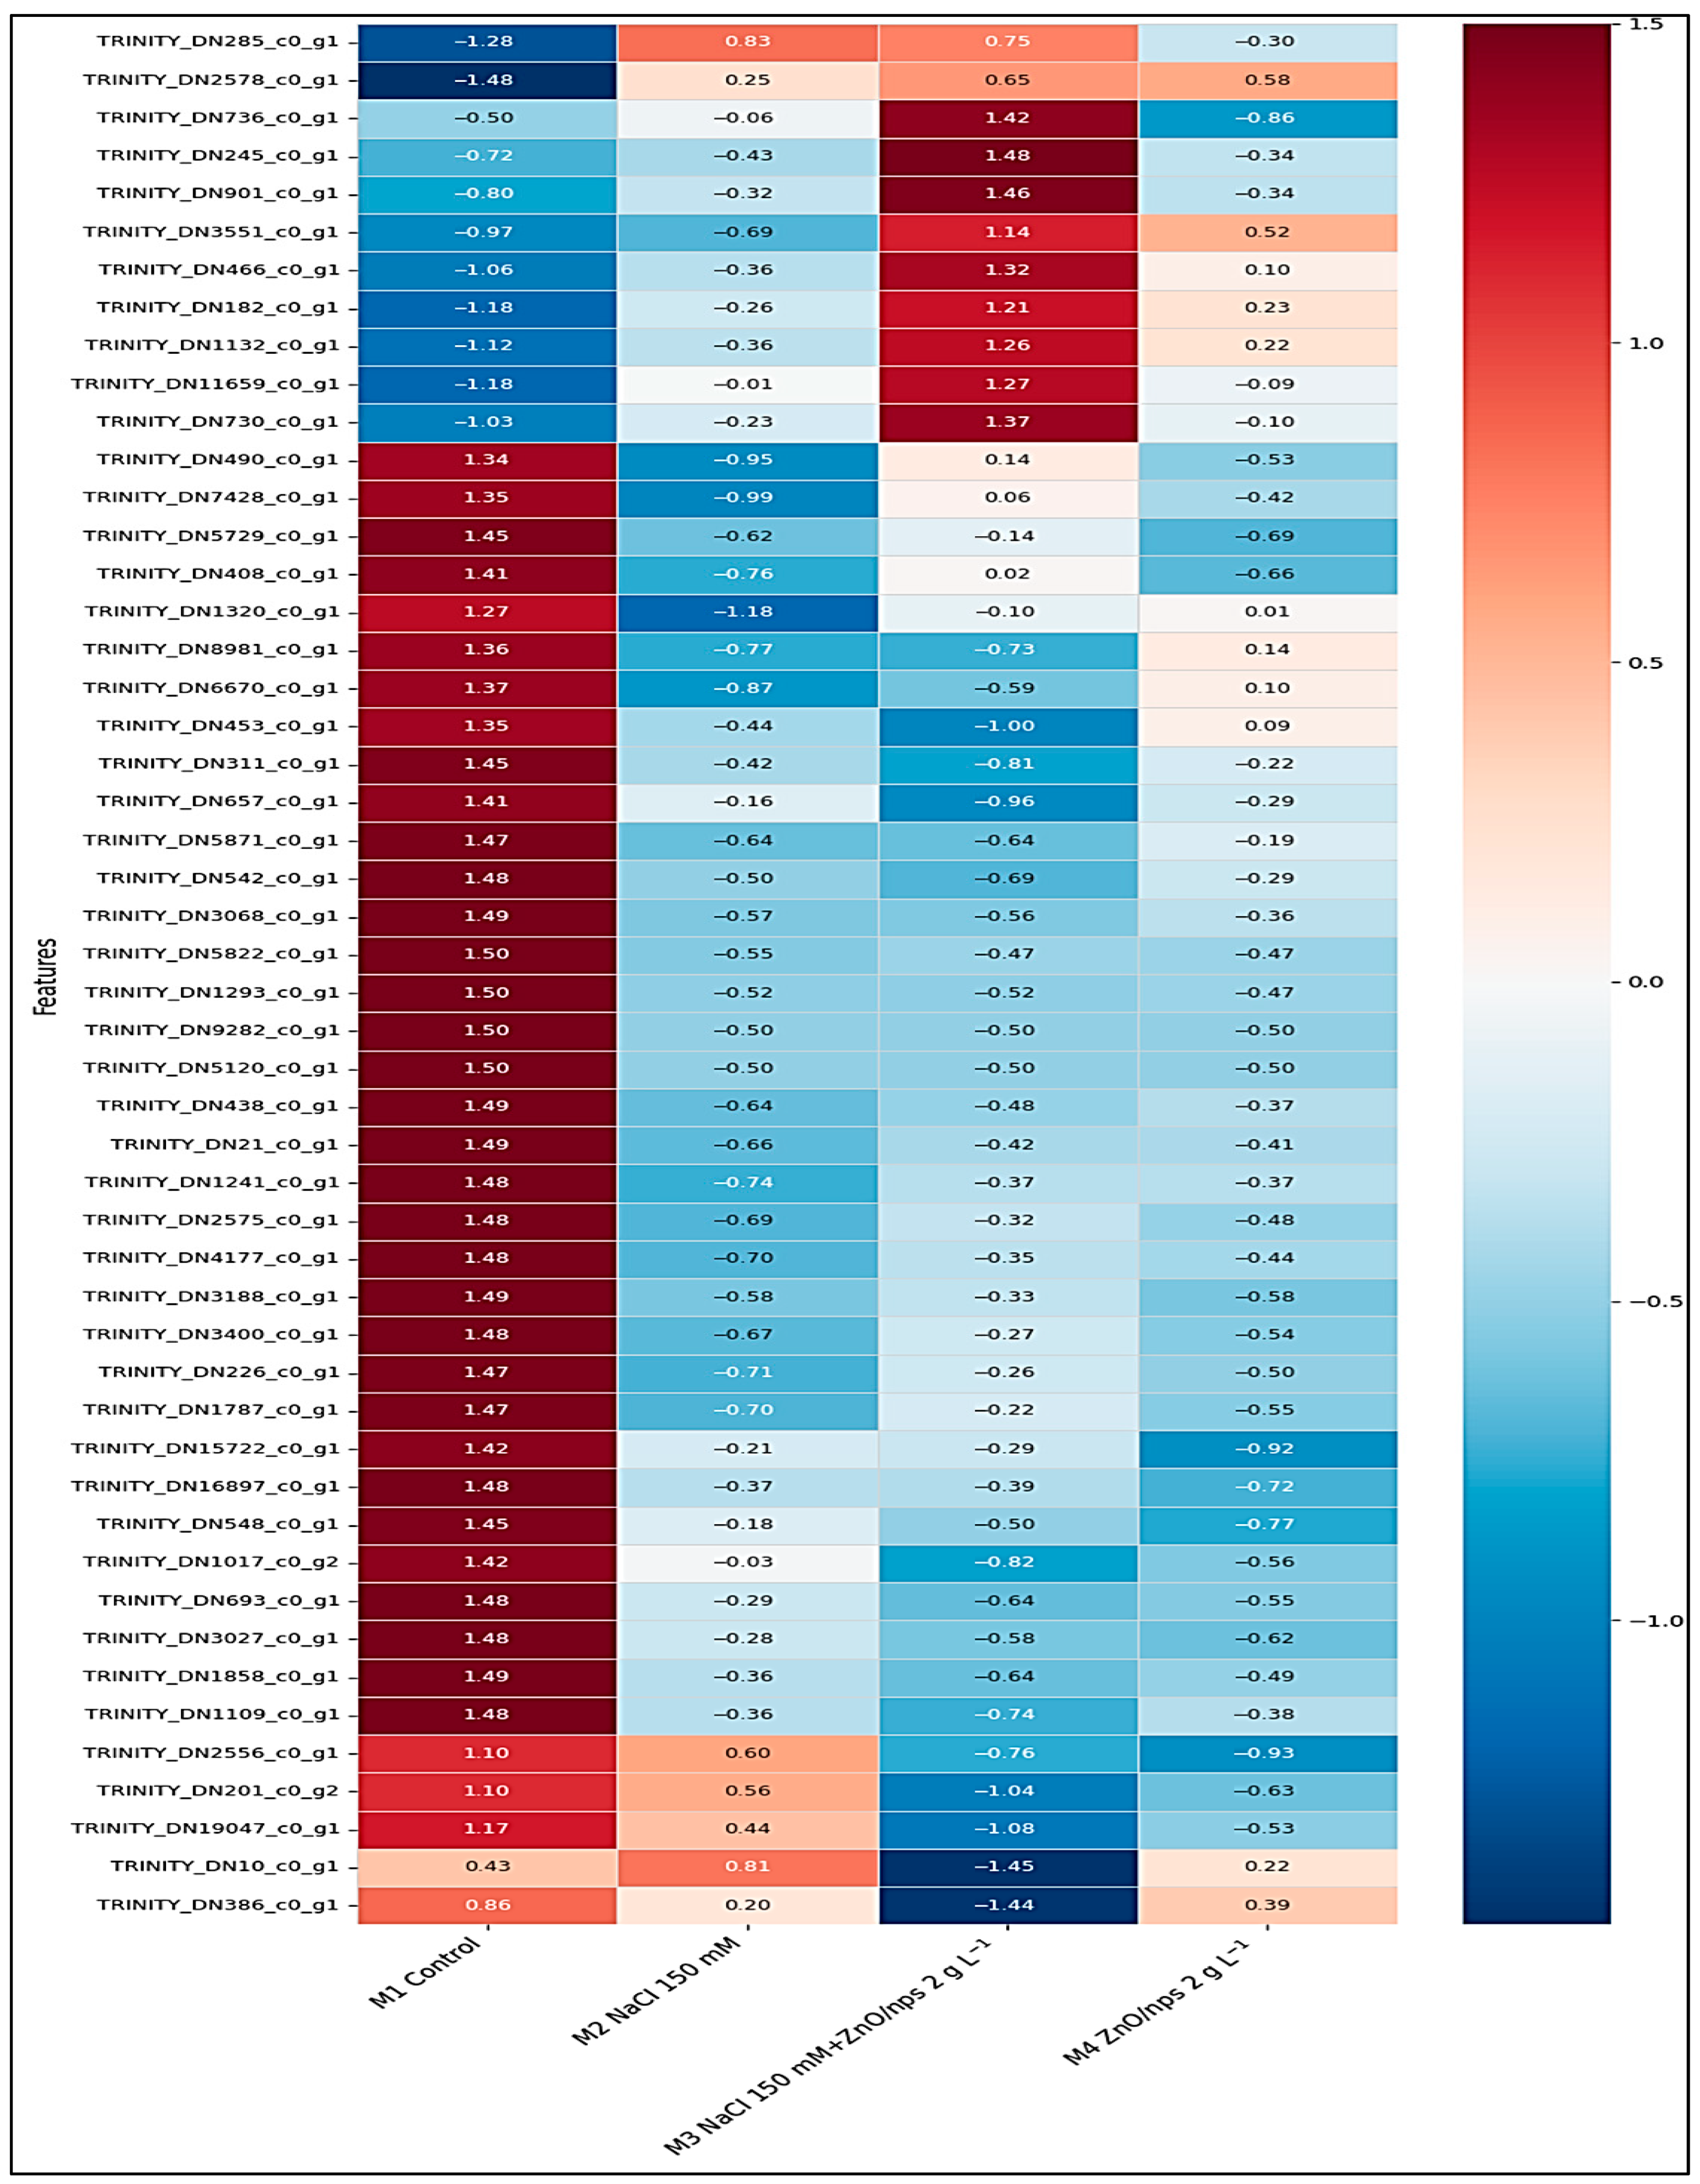
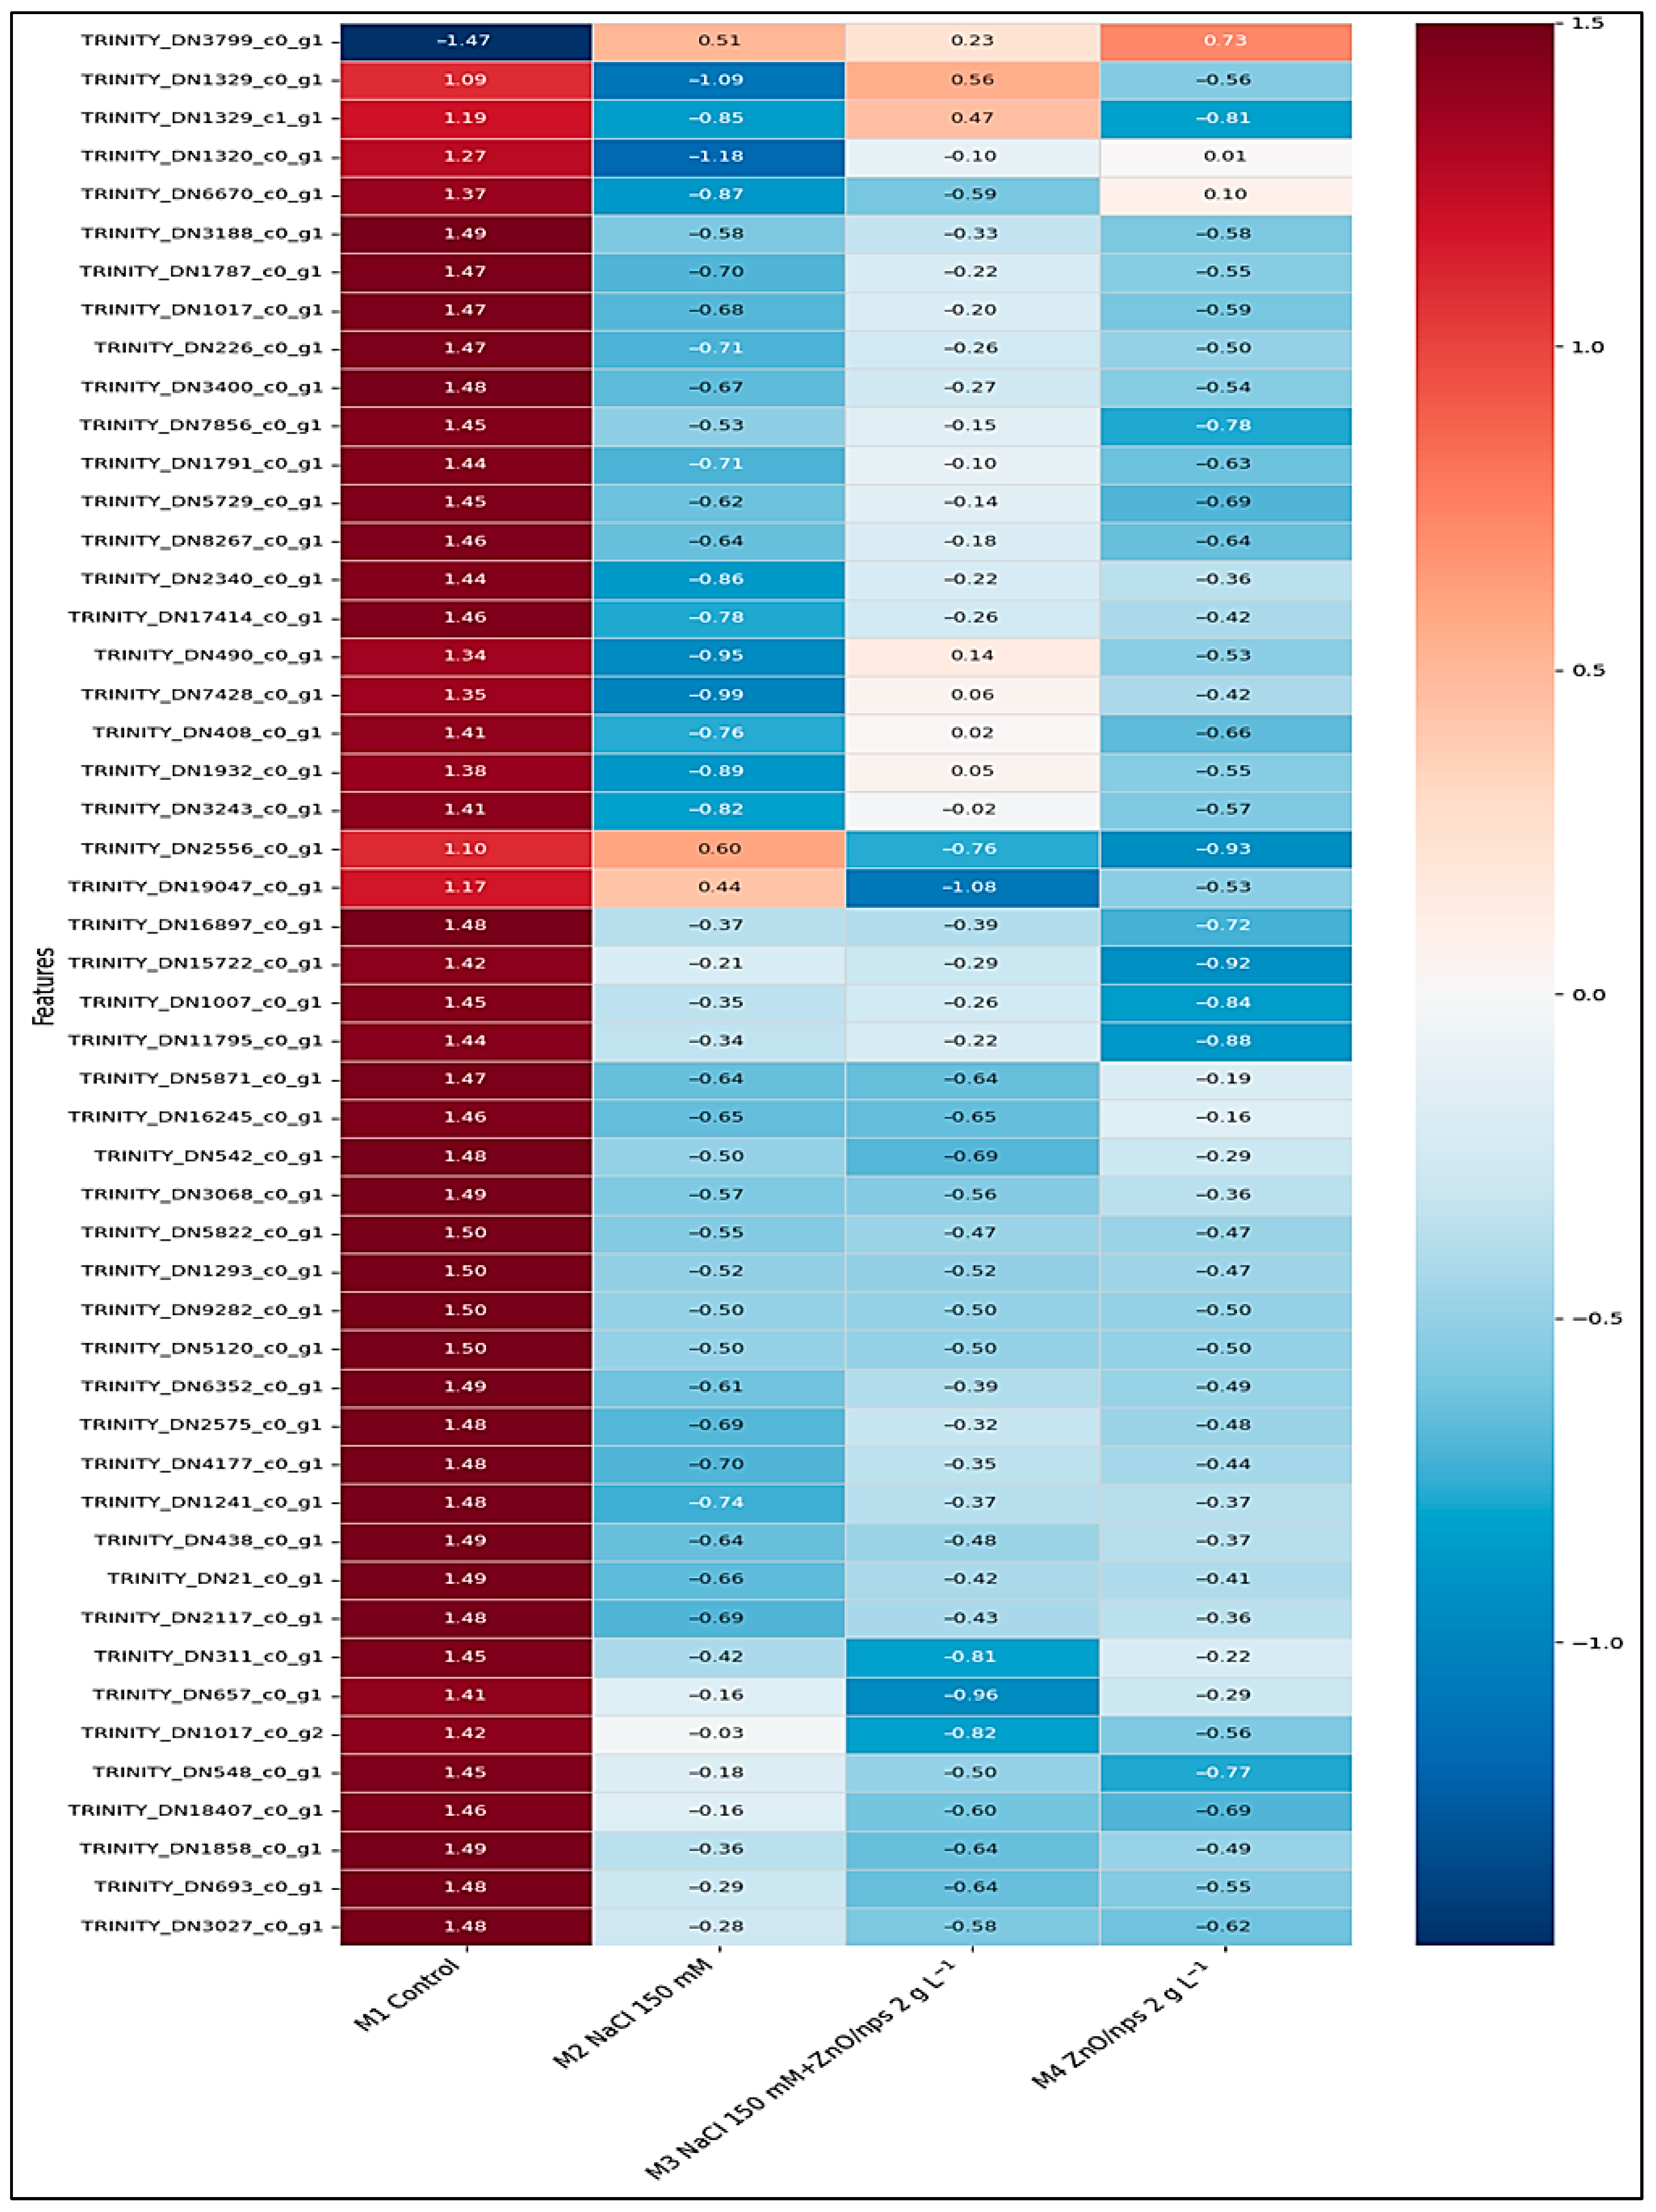
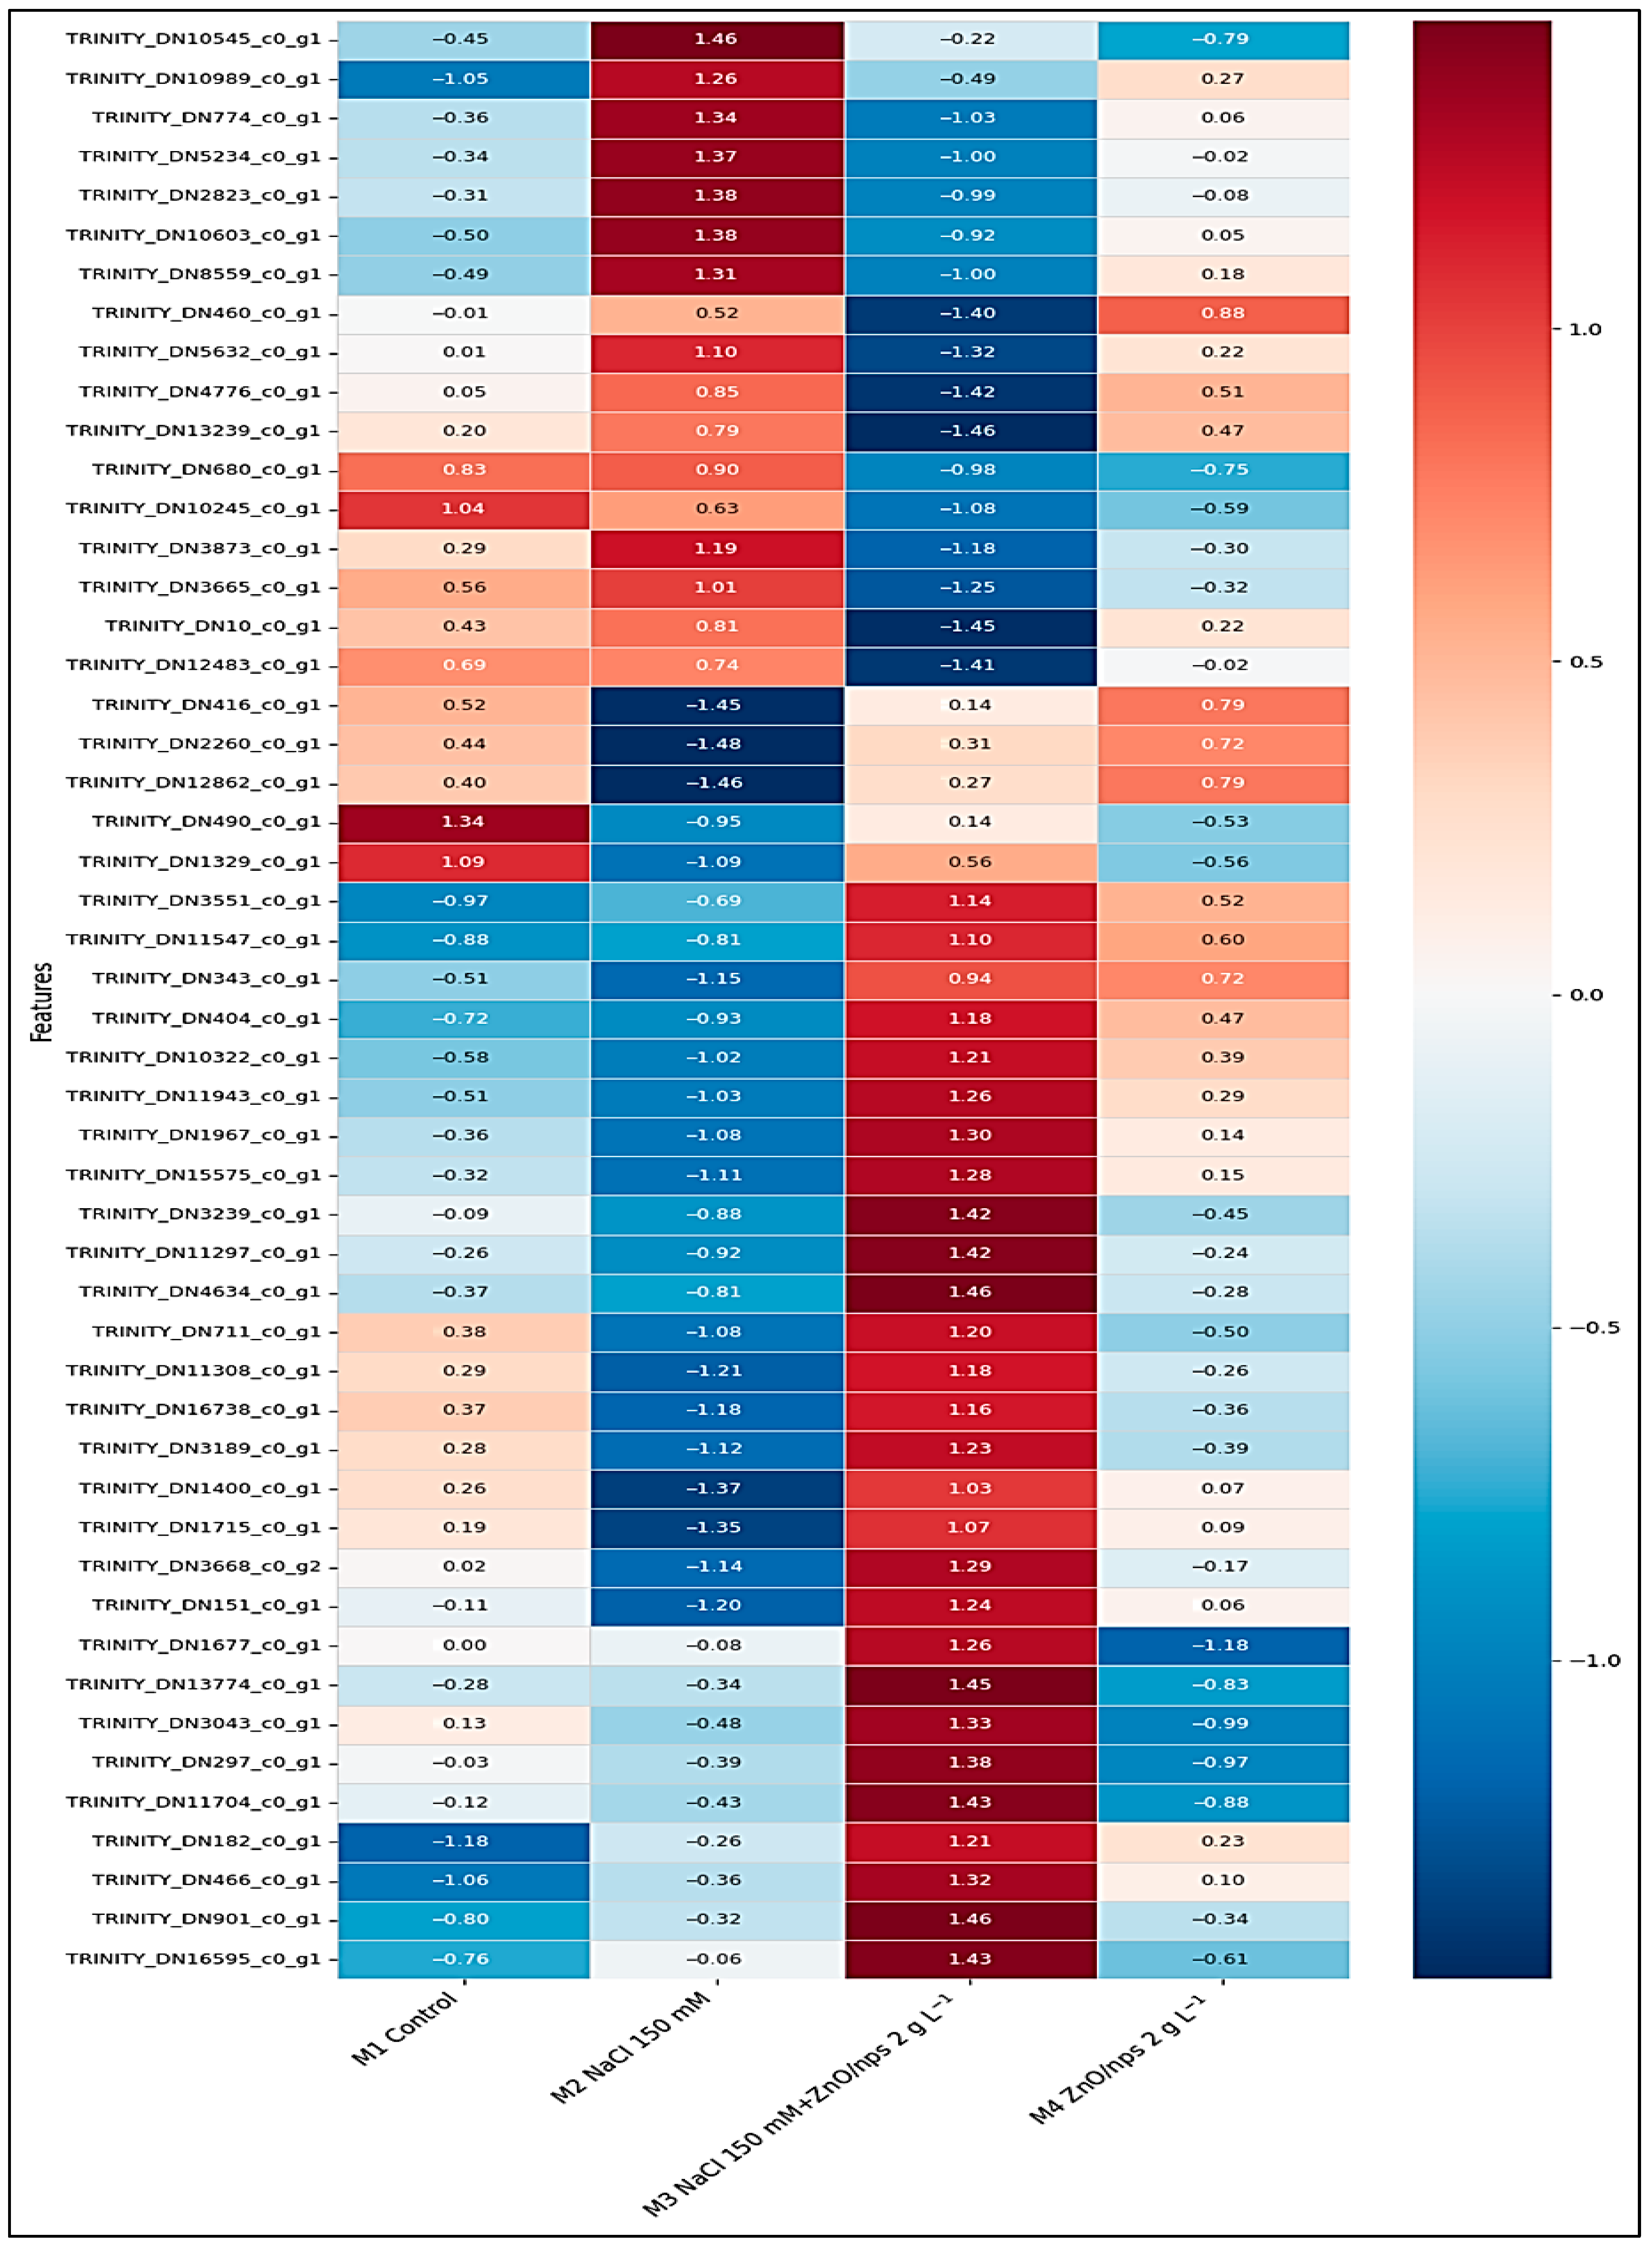
Visualizing the expression of genes across samples can be accomplished through the use of heat maps. During the pairwise differential analysis between treatments, the top fifty contigs that were differentially expressed in both directions were discovered. These contigs are listed in Tables S5-1, S5-2, S5-3 and S5-4. The heat maps (Figure 3, Figure 4, Figure 5 and Figure 6) illustrate this identification.

4. Discussion

In saline conditions, phenolic compounds prevent protein denaturation and lipid peroxidation, stabilizing cell membranes [35]. For this reason, the current study assessed the phenolics as a primary indication of the antioxidant activity of stressed Zea mays plants in combination with foliar spray with ZnO/NPs. Stress stimulates cell respiration, which shifts metabolic activities from glycolysis to the pentose phosphate cycle. Secondary metabolic pathways, such as Shikimic acid and phenylpropanoid synthesis, begin to speed after this point. This acceleration results in the production of secondary metabolites such as phenolic compounds and antioxidants, which aid in the regeneration of plant cells [49].
Seleiman et al. (2023) [50] indicated that salinity greatly affected the total phenolics (TPs) in maize plants. Compared to the control plants, those exposed to 120 mM NaCl exhibited a 30% increase in TPs relative to those subjected to 60 mM sodium chloride. The use of 0.1 g L−1 ZnO/NPs led to a thirty percent enhancement in total phenols relative to the control group. The synergistic impacts of ZnO/NPs, together with salinity, were highly significant for the TPs of maize plants. Plants exposed to 60 mM NaCl stress and sprayed with 100 mg/L ZnO/NPs demonstrated the highest TPs concentrations.
To eliminate ROS, plants utilize both non-enzymatic antioxidants and enzymatic antioxidants. POX, SOD, GR, GST, and CAT are among the enzymes considered most significant [33,50,51]. The accumulation of ROS in cells leads to protein denaturation, lipid peroxidation of membrane lipids, and electrolyte leakage. This influences chemiosmotic potential, hydrating the cell, formation and accumulation of secondary metabolites, and the proliferation, differentiation, and function of the cell [52].
According to our recent experiment, the addition of sodium chloride led to a significant increase in the activity of antioxidative enzymes. Plants that can withstand high amounts of salt stress typically contain antioxidant enzymes that function more effectively. When plants were subjected to salt stress, their responses varied with the amount of salt in the soil. Under significant salt stress, antioxidant enzymes functioned more effectively, as shown by several earlier studies.
At a concentration of 0.12 M sodium chloride, Seleiman et al. (2023) found that the antioxidant defense mechanisms of enzymes such as SOD, CAT, and APX in maize plants were considerably influenced by salt [50]. Compared with the control plants, the activities of the previously mentioned enzymes increased by 77%, 95%, and 102%, respectively, in Zea mays plants exposed to 0.12 M sodium chloride throughout the experiment. Notably, the antioxidant defense systems functioned more effectively after the application of ZnO/NPs to the leaves at a dosage of 0.1 g L−1. The total amount of all enzymes increased by 16%, 22%, and 26%, respectively, as a consequence of this. Regarding the antioxidant profile of maize plants, the interaction effects of ZnO/NPs and salt were substantial. When 0.12 M sodium chloride and 0.1 g L−1 ZnO/NPs were combined, the highest antioxidant activity was approximately 188.7 U. g−1 FW, 66.3 U. g−1 FW. min−1, and 41.7 µmol. g−1 FW. min−1, for SOD, CAT, and APX, respectively.
Recent research indicates that ZnO/NPs enhance antioxidant defense systems, enzymatic activity, and glucose metabolism in plants, hence mitigating abiotic stresses [53,54,55,56]. Fertilization with ZnO/NPs at a concentration of 200 µg/mL in Gossypium barbadense significantly enhanced the plant’s resistance to salinity by increasing its antioxidant activity [57].
Nanotechnology has a crucial role in improving salt tolerance in many plant species, according to recent studies [58,59,60]. Understanding how salt stress and foliar spray might cause changes at the transcriptome level, as well as the role of ZnO/NPs in modulating maize’s salt (NaCl) stress tolerance, was the major aim of this study. Although plants under NaCl stress produce more ROS, it is essential for their protection from oxidative damage that they maintain ROS production and breakdown in balance. To mitigate the detrimental impacts of drought stress through the reduction in oxidative stress, maize plants were shown to increase levels of antioxidant enzymes like SOD, CAT, and APX in response to the foliar spray of ZnO/NPs. Some of the DEG detected in the heatmaps (Figure 3, Figure 4, Figure 5 and Figure 6) may be classified to the general metabolic pathways.
The functional analysis of the DEG heatmaps revealed that the top 50 DEGs from the M1 and M2 comparison indicate that salt stress leads to the accumulation of ROS, such as hydrogen peroxide, which can result in cellular degradation. Certain genes encode enzymes that neutralize specific substances. The TRINITY ‘DN408_c0_g1’ encodes CAT enzyme, which decomposes hydrogen peroxide into water and oxygen, serving as a fundamental defense against stress [61]. Another TRINITY ‘DN2575_c0_g1’ encodes the gene for ascorbate peroxidase (APX), which utilizes vitamin C (ascorbate) to detoxify hydrogen peroxide in the chloroplasts and cytoplasm [62]. The TRINITY ‘DN548_c0_g1’ encodes the GST enzyme, which detoxifies cellular toxins by conjugating them with glutathione, thereby aiding in the management of oxidative damage [63].
Regarding osmotic correction and membrane stability. The subsequent Trinities encode for genes that assist the plant in retaining water and safeguarding cell membranes from collapse due to salinity: TRINITY ‘DN16897_c0_g1’ encodes aquaporin (PIP1), a water channel protein located in the cell membrane that regulates water flow and maintains turgor pressure [64], and the TRINITY ‘DN1791_c0_g1’ encodes dehydrin/LEA protein, classified as a late embryogenesis abundant protein (LEAP). It functions as a molecular barrier, inhibiting protein aggregation during dehydration [65].
Specific genes encode chaperone proteins that safeguard other proteins, as salt stress may induce protein denaturation and functional loss. These genes function as “chaperones” to rectify them. The TRINITY ‘DN21_c0_g1’ encodes the small heat shock protein (sHSP17), which associates with unfolded proteins to avert irreparable damage under stress [66]. The TRINITY ‘DN12862_c0_g1’ encodes the ubiquitin-conjugating enzyme that marks damaged proteins for degradation and recycling to prevent cellular accumulation [67].
The functional analysis of the DEG heatmaps of M1 and M2 comparison suggests that TRINITY ‘DN285_c0_g1’ encodes for 18S/26S. Ribosomal RNA, essential for protein synthesis, serves as a structural component of the ribosome. It is frequently the predominant transcript and is crucial for the synthesis of proteins required for repairing stress-induced damage [68]. The TRINITY ‘DN2578_c0_g1’ encodes aquaporin (PIP/TIP). ZnO/NPs can also modify root hydraulic conductivity, activating this gene. The TRINITY ‘DN10_c0_g1’ encodes profilin, an actin-binding protein essential for cytoskeletal stability, as salt and metal nanoparticles can compromise the cell’s structural integrity. Profilin facilitates the reorganization of actin filaments to preserve cellular morphology and motility under stress conditions [69].
The functional analysis of the DEG heatmaps comparing M1 and M4 reveals numerous necessary transcripts, including the following: The TRINITY ‘DN2340_c0_g1’ encodes for GST enzyme, which is essential in ROS scavenging. The TRINITY ‘DN8267_c0_g1’ encodes the POX enzyme, which is essential as an antioxidative enzyme. A Class III Peroxidase that degrades hydrogen peroxide produced under salinity stress [70]. The TRINITY_DN226_c0_g1 encodes the chlorophyll a/b binding protein, an essential protein for photosynthesis. This protein constitutes a component of the light-harvesting complex (LHCII). It is probably downregulated, as heavy metal stress generally suppresses photosynthesis and impairs chloroplast function [71].
In the functional analysis of the DEG heatmaps comparing M2 and M3, it reveals essential transcripts, including the following: The TRINITY ‘DN466’ encodes a chlorophyll a/b-binding protein (LHC) essential for photosynthetic defense, as salinity stress reduces chlorophyll levels. ZnO/NPs are recognized for their protective role in the photosynthetic machinery. This gene encodes a protein essential for light-harvesting; its overexpression indicates that ZnO/NPs are maintaining the plant’s capacity to generate energy under stress [72].
The TRINITY ‘DN1967’ encodes calmodulin (CaM), which functions in stress signaling. A calcium-binding protein functioning as a sensor and switch. It initiates the “alarm” response to saline stress, triggering subsequent defensive mechanisms [73]. ZnO/NPs regulate Ca2+ signaling to facilitate rapid plant adaptation [74]. The TRINITY_DN2260 encodes a cyclophilin (PPIase) protein that facilitates protein folding, as salt stress induces protein misfolding. Cyclophilins work as chaperones to repair damaged proteins, preserving cellular function during osmotic stress [75].
A de novo assembling approach was used with the reads, as we were looking for novel transcripts. In our open-field experiment, we used a maize variety, P0023, that differs from the standard lab lines. While high-quality reference genomes exist, maize exhibits exceptionally high intraspecific genetic diversity and structural variation. Since the P0023 under investigation is a distinct specific from the reference line, relying solely on reference mapping would likely result in the loss of reads corresponding to unique, genotype-specific transcripts. By using a de novo assembly approach, we ensured the capture of novel, stress-responsive transcripts specific to this cultivar that would have been discarded or misaligned if mapped strictly to the standard reference genome.
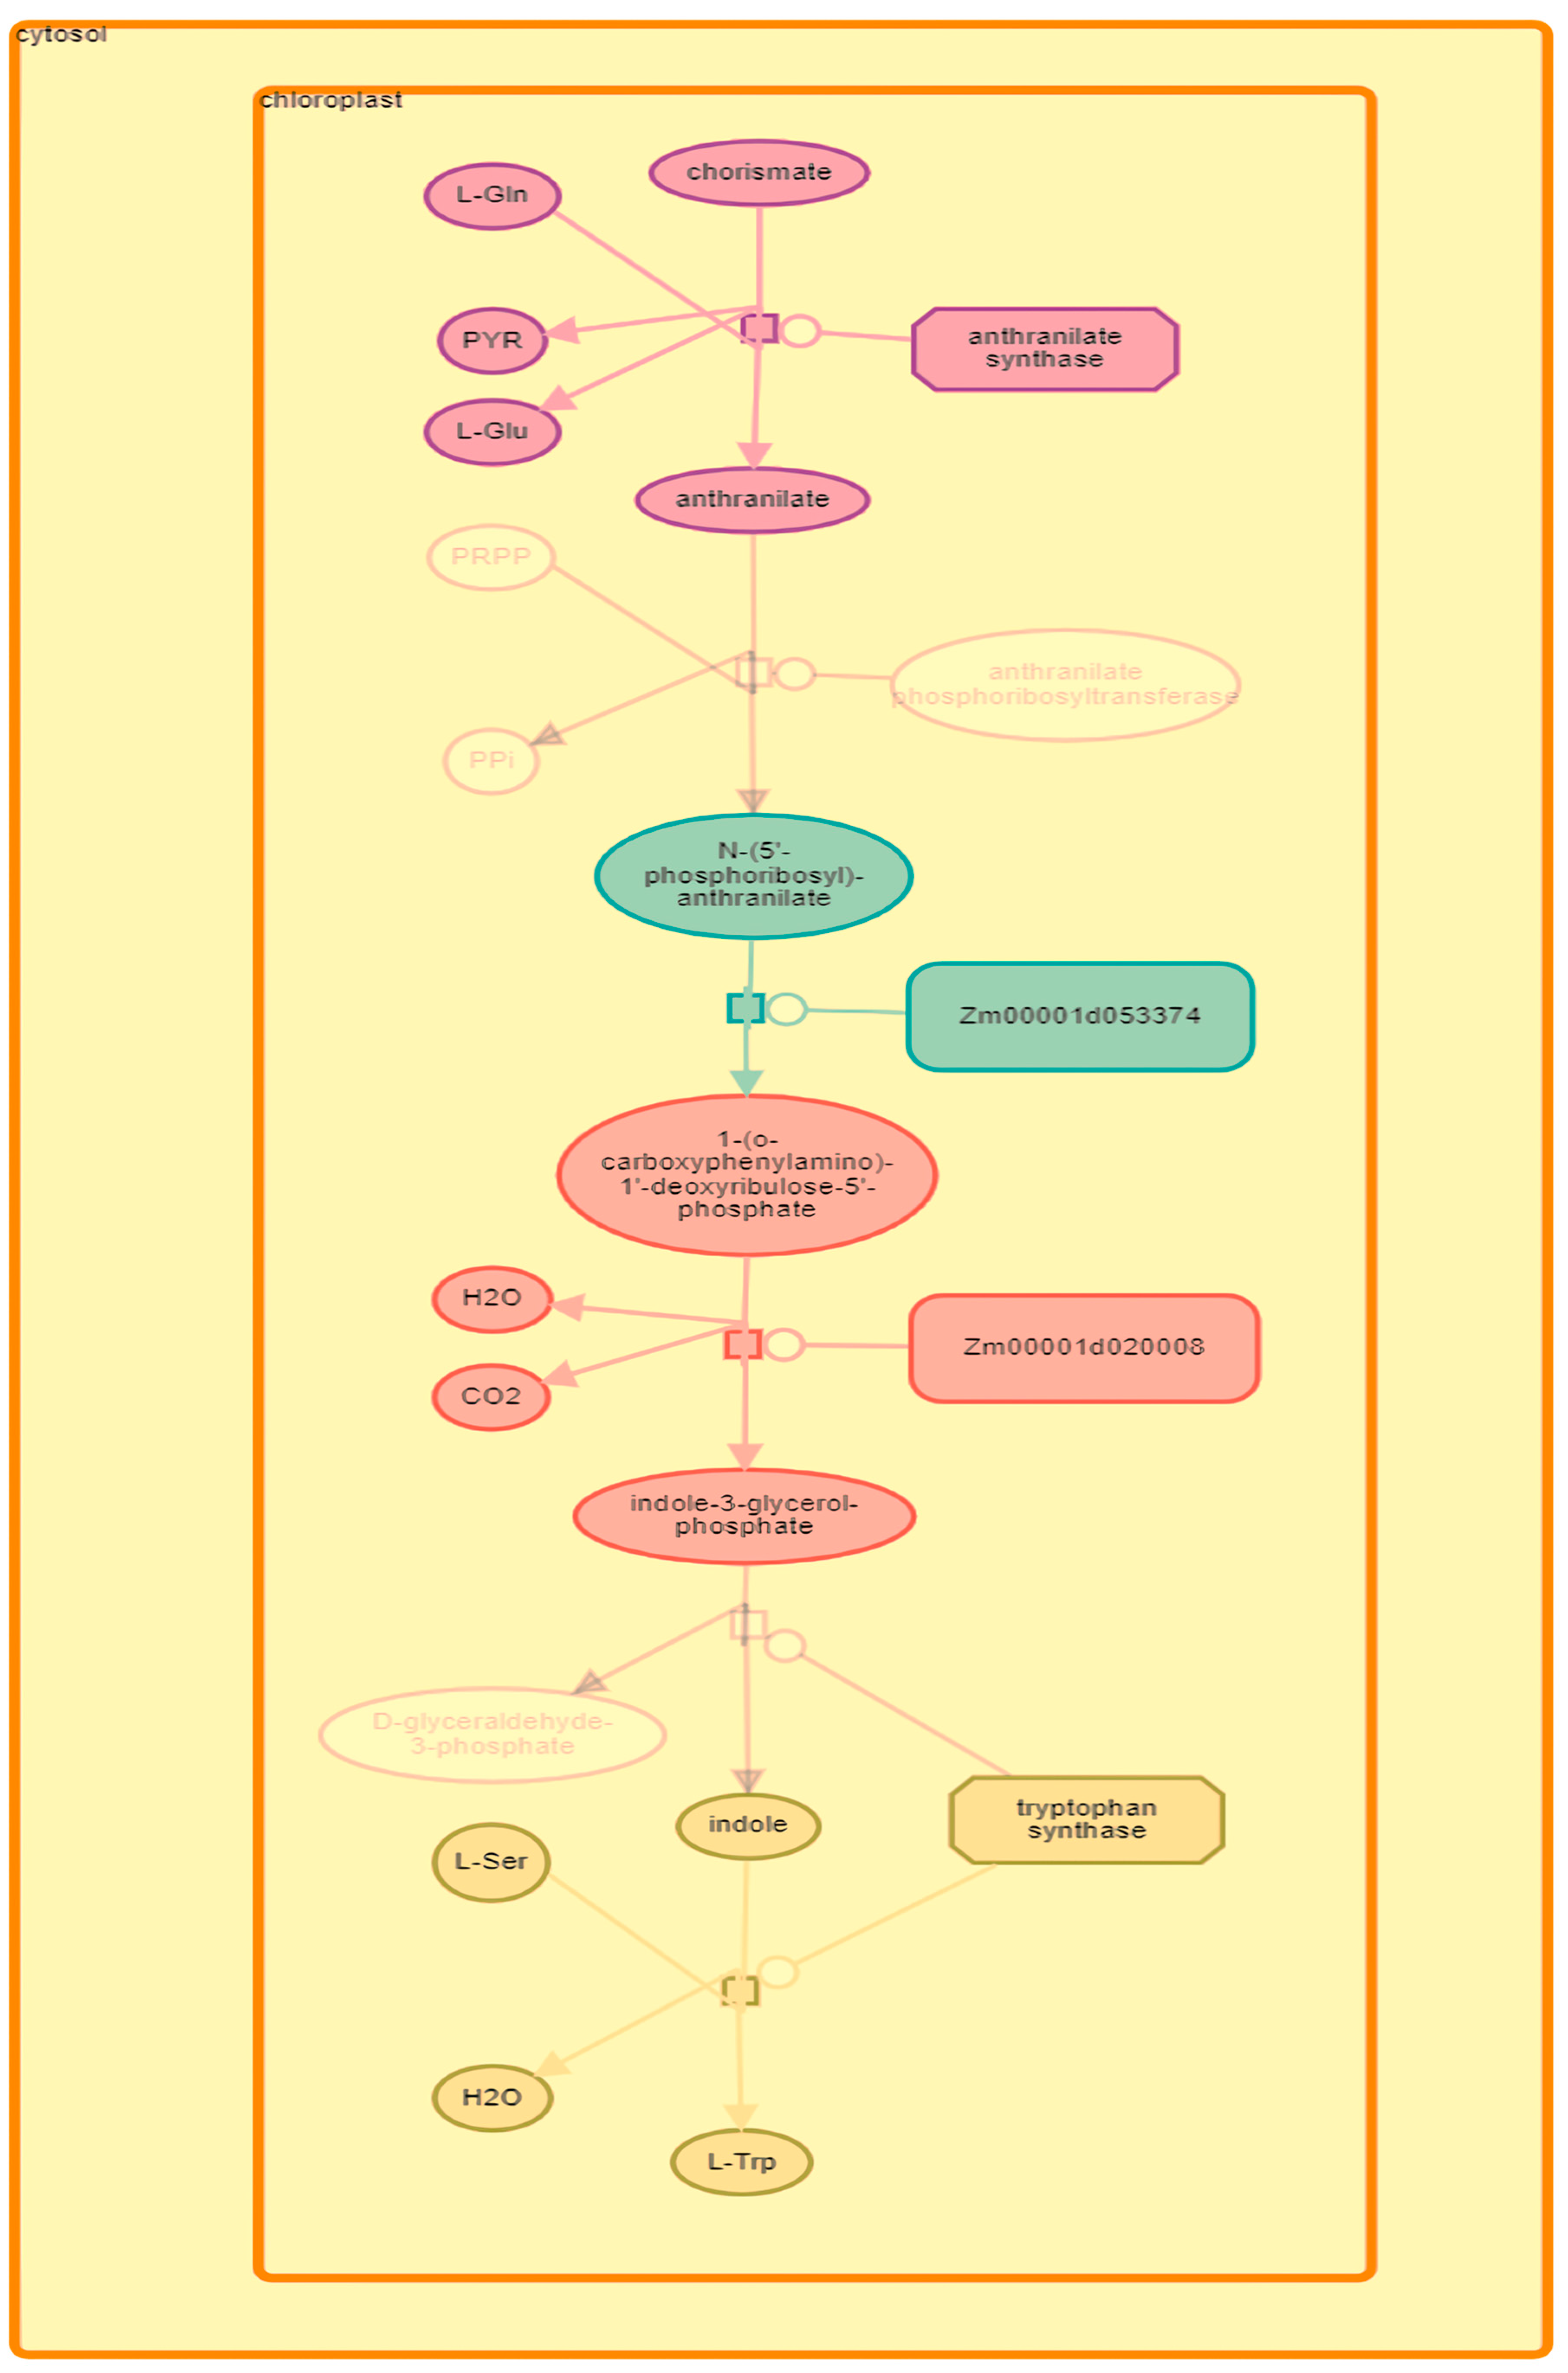
In the plant PR for the species Zea mays, the comparison between M1 and M2 revealed 21 sequences associated with various pathways, including abscisic acid (ABA) mediated signaling (2 genes), HSFA7/HSFA6B regulatory network induced by drought and ABA (2 genes), polyisoprenoid biosynthesis (2 genes), TCA cycle (plant) (2 genes), and mevalonate pathway (2 genes) (Table S6-1). Additionally, the same database revealed 303 down-regulated linked sequences (genes), including 16 associated with the TCA cycle (plant), 12 with jasmonic acid signaling, 8 with cytosolic glycolysis, 8 with cellulose biosynthesis, and 17 with tryptophan biosynthesis (Figure 7) (Table S6-2).
According to Ahemad and Kibret (2014), canola synthesis of IAA improved water use efficiency and nutritional availability to the plant [76]. So, down-regulation of the tryptophan biosynthetic pathway is needed, as tryptophan plays an essential role in plant growth and resilience under stress, serving as a precursor for plant natural products. Plants produce imperative protective metabolites like melatonin, camalexin, and indole glucosinolates (IGs) through tryptophan metabolism [77,78,79]. By forming a complex metabolic network through various interactions, the diverse range of tryptophan metabolites regulates plant health in response to both biotic and abiotic stressors. For this reason, managing plant health in stressful environments requires knowledge of the regulatory processes underlying the tryptophan metabolic network.
M1 and M3 comparisons identified 50 PR database sequences connected with distinct pathways. Three genes were found for sucrose biosynthesis, three for sulfonation, three for starch biosynthesis, and three for cyanate degradation (Table S6-3). In the same database, 130 down-regulated sequences (genes) were connected with homoserine synthesis, long-day florigen expression, pathogen recognition (fungal and bacterial), immunological response, and gibberellin signaling (Table S6-4).
Twenty-eight sequences were connected to various pathways in the PR database during the comparison of M1 and M4 and their respective pathways, including myo-inositol biosynthesis (1 gene), polyisoprenoid biosynthesis (1 gene), the Calvin cycle (1 gene), polar auxin transport (1 gene), and trehalose biosynthesis I (1 gene) (Table S6-5). Additionally, the same database identified 207 down-regulated linked sequences (genes), including lysine biosynthesis VI with 5 genes and arginine biosynthesis with 4 genes (Table S6-6).
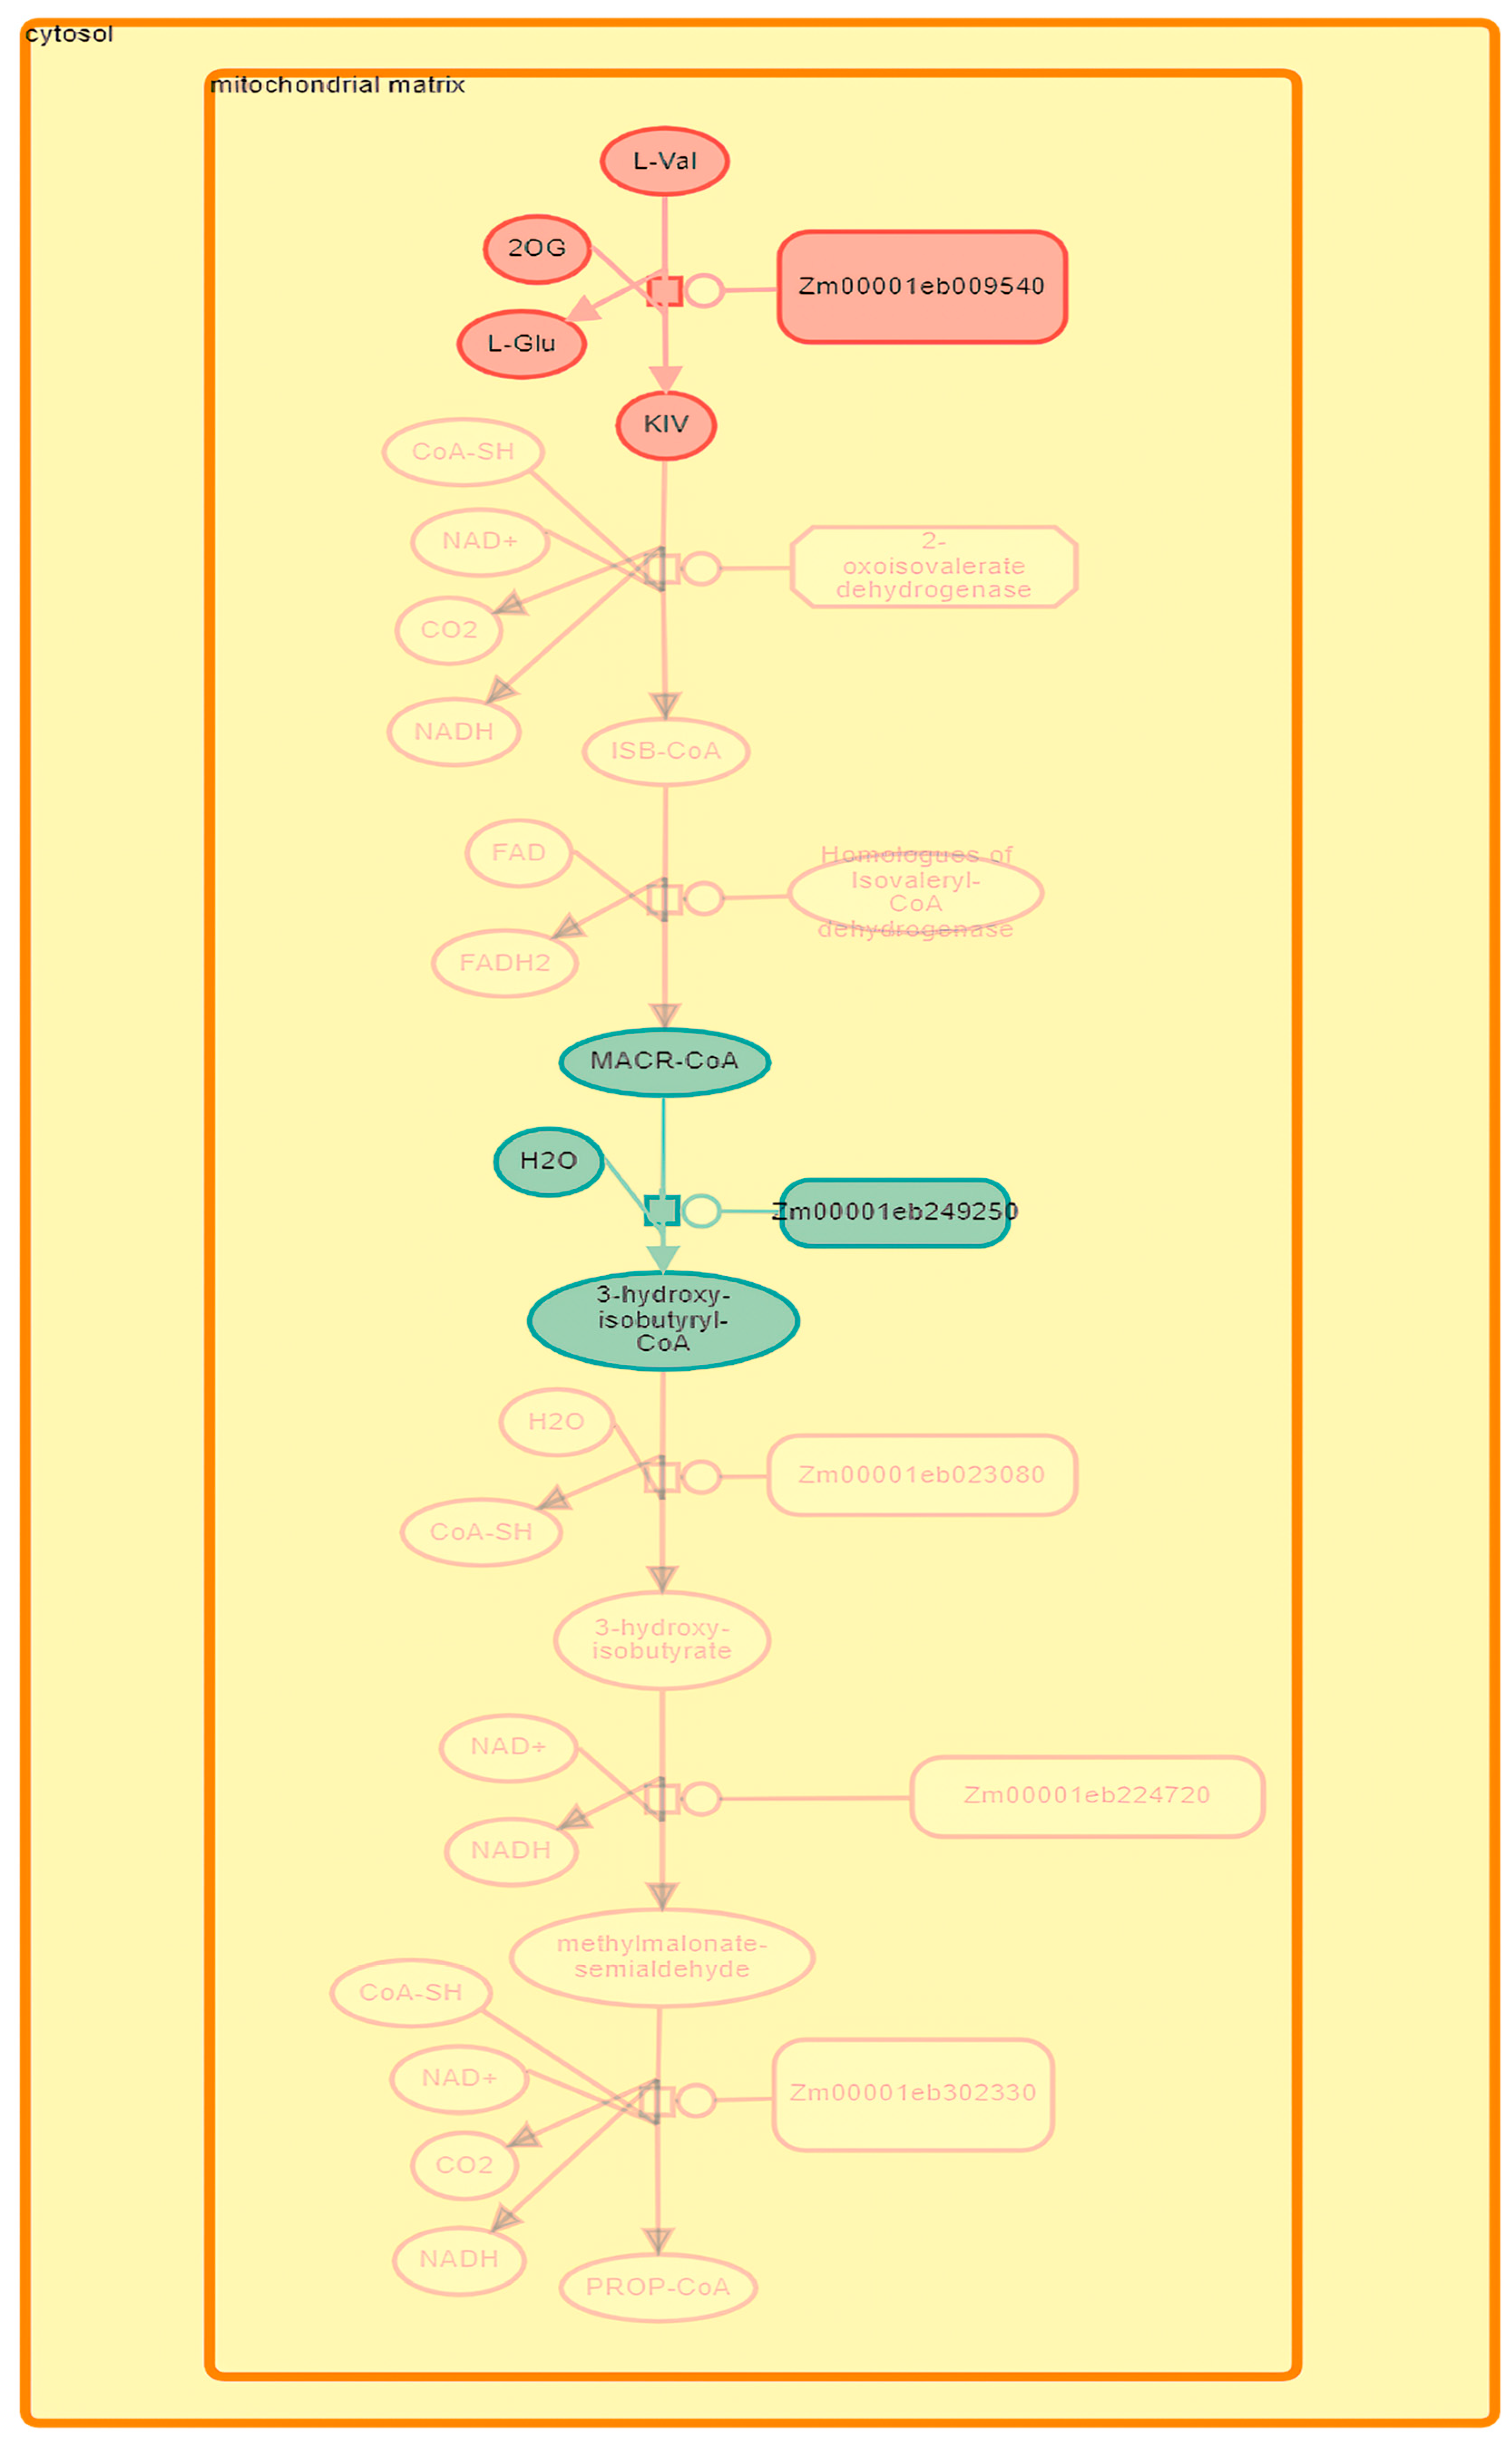
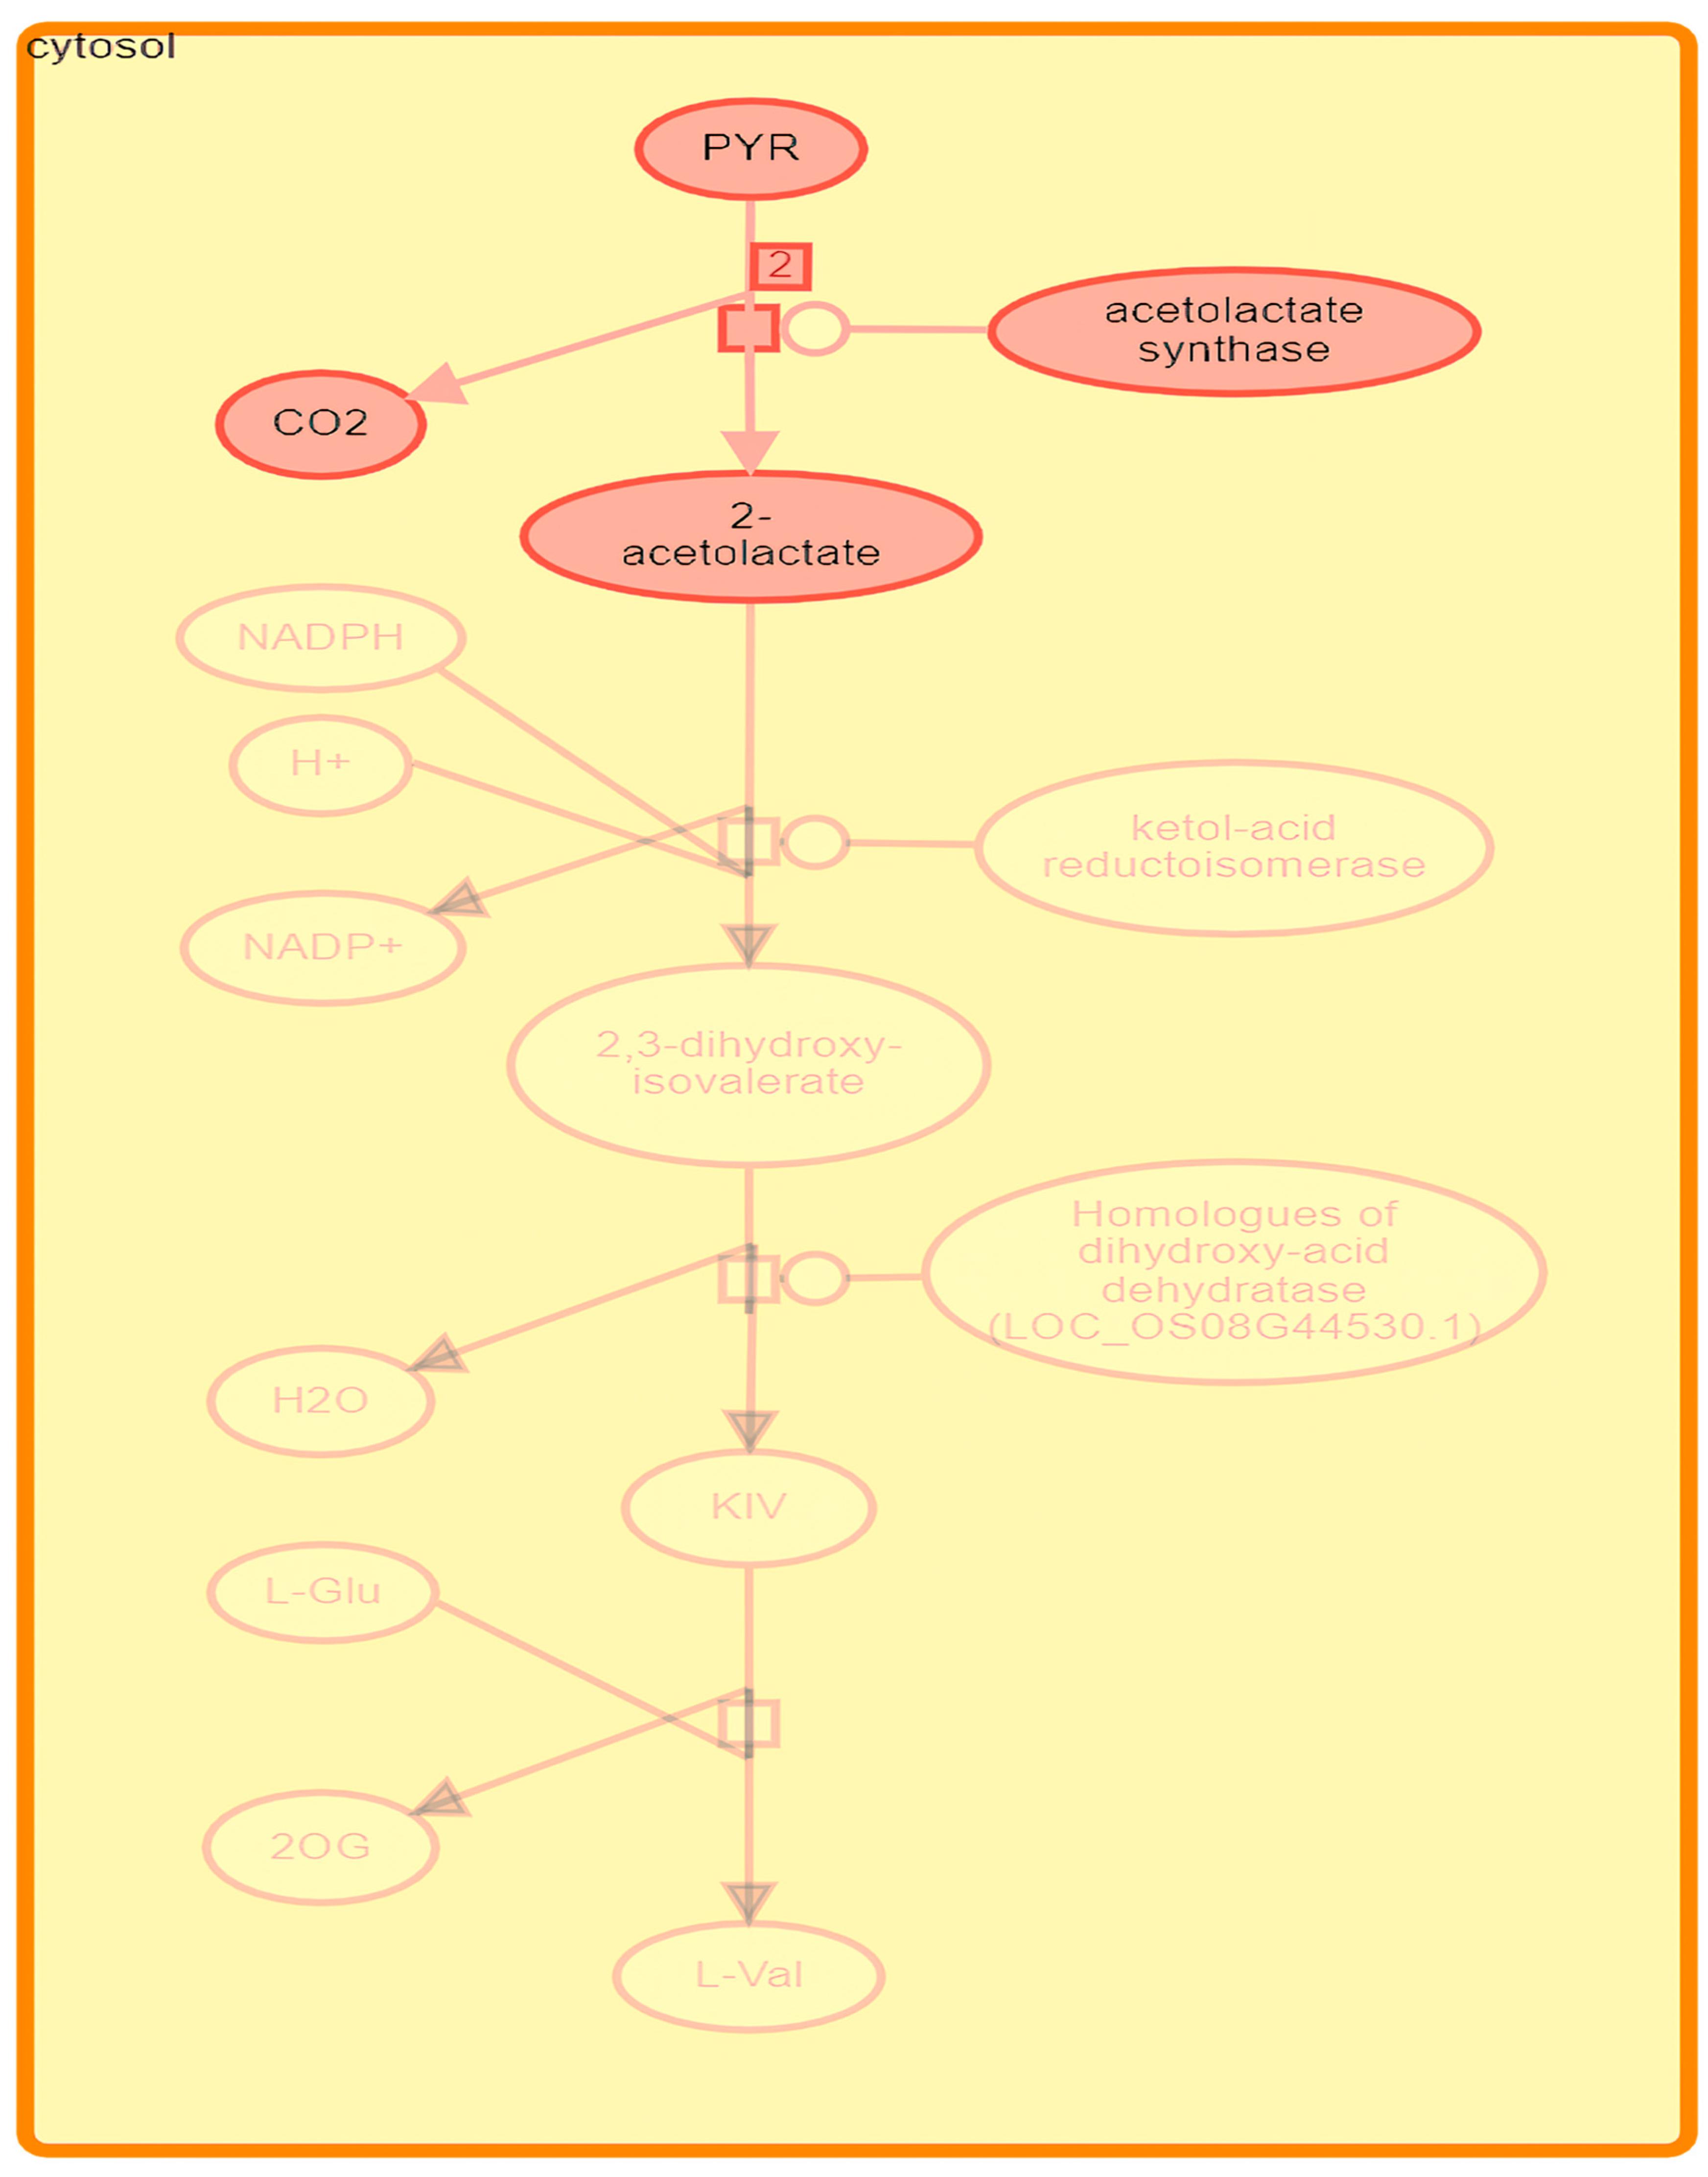
In the PR database, Zea mays exhibited 105 sequences associated with various pathways when M2 was compared to M3, including polyisoprenoid biosynthesis, valine degradation (Figure 8) (2 genes), glutathione redox reactions II (2 genes), nitrate assimilation (2 genes), and vitamin E biosynthesis (2 genes) (Table S6-7). Additionally, within the same database, five down-regulated associated sequences (genes) were identified, including isoleucine biosynthesis from threonine, the 13-LOX and 13-HPL pathways, jasmonic acid biosynthesis, valine biosynthesis (Figure 9), and trehalose biosynthesis I, with one gene corresponding to each pathway (Table S6-8). All the detected pathways in the PR database for Zea mays, enumerating the potential TRINITY IDs of the genes, their functional annotations (EC numbers), and their homology metrics (identity/coverage) relative to validated reference sequences were supplemented in Tables S7-1, S7-2, S7-3, S7-4, S7-5, S7-6, S7-7 and S7-8), for the up-and down-regulated sequences of the M1 vs. M2, M1 vs. M3, M1 vs. M4, and M2 vs. M3 comparisons, respectively.
Augmenting cellular valine production safeguards against oxidative stress by diminishing ROS levels and enhancing mitochondrial activity. Valine metabolism plays a crucial role in photosynthesis and respiration. Research indicates that valine enhances the expression of genes regulating mitochondrial function, such as peroxisome proliferator-activated receptor-γ coactivator 1α (PGC-1α), thereby supporting cellular energy production during oxidative stress induced by H2O2 [80]. There is strong evidence that proteins with valine-glutamine (VQ) motifs are essential for plant development, growth, and stress responses. These proteins have a core sequence that is highly conserved and reads F(aa)(aa)(hydrophobic aa)VQ(aa)(hydrophobic aa)TG, where aa refers to an amino acid [81]. Through their interactions with other proteins, notably WRKY transcription factors, some VQ proteins contribute to stress tolerance [82].
Among plant transcriptional regulators, the WRKY family is by far the largest. Binding to the conserved V and Q residues of the VQ proteins, they regulate biological processes in plants and react to various biotic and abiotic stresses [83]. In a previous study, six motifs were identified in maize [84]. Song et al. (2016) [84] showed that similar to VQ genes in Arabidopsis and rice, a significant proportion of ZmVQ genes (67.21%) demonstrated expression that was responsive to drought and osmotic stress. Biotic and abiotic stresses induced the expression of 22 out of 39 VQ genes in rice [85]. Analogous to ZmVQ genes which encode maize VQ proteins (ZmVQ21, ZmVQ13, and ZmVQ1), OsVQ genes which encode rice VQ proteins such as; OsVQ2, OsVQ16, and OsVQ20, they were significantly upregulated by drought [84,85].
The researchers of the prior work performed an extensive genome-wide examination of the gene architecture and tissue specificity of VQ domain-containing genes in maize. The analysis of VQ genes under drought and salt chloride conditions demonstrated that specific VQ genes are involved in responses to abiotic stress. A robust co-expression association between VQ genes and WRKY genes suggests that many VQ and WRKY genes are likely functionally interrelated [84]. The previous investigations explained the crucial role of the valine regulation in response to stress in plants.
Salt stress increases and prolongs starch buildup in early fruit development [86]. In the studies by Balibrea et al. (1999, 1996), it was found that salt stress had negatively affected starch accumulation [87,88], and this occurred due to the complete breakdown of transiently generated starch into soluble sugars in mature tomato fruits. Yin et al. (2010) found that the increase in starch accumulation may increase sugar content in salt-stressed red tomato fruits [86]. Balibrea et al. (2006) discovered that sucrose import during ripening enhanced sugar concentration in wild species under saline stress, suggesting various germplasm processes regulate sugar levels [89].

5. Conclusions

ZnO/NPs foliar spray maintained antioxidant enzyme levels in salt chloride-stressed maize leaves in this study. NaCl (at 150 mM) positively affected the phenolic burden, and these chemicals are expected to be promising in alleviating stress. The expression of genes involved in distinct synthesis or metabolic processes was examined. The foliar application of ZnO/NPs to stressed maize plants increased the expression of stress-responsive genes. Transcriptomic analysis indicated an upregulation of the tryptophan and valine biosynthetic pathways, implying a molecular response aimed at stress tolerance. The development of plants and chlorophyll content have been previously investigated under extreme salt stress using 150 mM NaCl. They are prospective environmental stress regulators for plants, stimulating various physiological processes and strengthening their defensive mechanisms. The regulatory effects of foliar application by chemically synthesized nanoparticles for NaCl-compensatory irrigated Zea mays plants were responsible for improving the potential of harmonizing the harmful effects of salinity stress.

Supplementary Materials

The following supporting information can be downloaded at: https://www.mdpi.com/article/10.3390/agronomy15122875/s1, Supplementary file S1. Table S1-1: Count table of the de novo transcript; Table S1-2: Upregulated and downregulated supertranscript genes. Supplementary file S2. Table S2-1: Upregulated and downregulated contigs_Maize_control_vs_salt stress (M1 × M2); Table S2-2: Upregulated and downregulated contigs_Maize_control_vs_salt + ZnO/NPs_2 g L−1 (M1 × M3); Table S2-3: Upregulated and downregulated contigs_Maize_control_vs_ZnO/NPs_2 g L−1 (M1 × M4); Table S2-4: Upregulated and downregulated contigs_Maize_salt_vs_salt + ZnO/NPs_2 g L−1 (M2 × M3); Supplementary file S3. Table S3-1: Combined pathway analysis using the plant reactome and KEGG databases of blasted, mapped, and annotated upregulated and downregulated contigs_Maize_control_vs_salt stress (M1 × M2); Table S3-2: Combined pathway analysis using the plant reactome and KEGG databases of blasted, mapped, and annotated upregulated and downregulated contigs_Maize_control_vs_salt + ZnO/NPs_2 g L−1 (M1 × M3); Table S3-3: Combined pathway analysis using the plant reactome and KEGG databases of blasted, mapped, and annotated upregulated and downregulated contigs_Maize_control_vs_ZnO/NPs_2 g L−1 (M1 × M4); Table S3-4: Combined pathway analysis using the plant reactome and KEGG databases of blasted, mapped, and annotated upregulated and downregulated contigs_Maize_salt_vs_salt + ZnO/NPs_2 g L−1 (M2 × M3); Supplementary file S4. Table S4-1: Pairwise analysis of Top 50 upregulated and downregulated blasted, mapped, and annotated contigs_Maize_control_vs_salt stress (M1 × M2); Table S4-2: Pairwise analysis of Top 50 upregulated and downregulated blasted, mapped, and annotated contigs_Maize_control_vs_salt + ZnO/NPs_2 g L−1 (M1 × M3); Table S4-3: Pairwise analysis of Top 50 upregulated and downregulated blasted, mapped, and annotated contigs_Maize_control_vs_ZnO/NPs_2 g L−1 (M1 × M4); Table S4-4: Pairwise analysis of Top 50 upregulated and downregulated blasted, mapped, and annotated contigs_Maize_salt_vs_salt + ZnO/NPs_2 g L−1 (M2 × M3); Supplementary file S5. Table S5-1: Heat map and top 50 DEG contigs_Maize_control_vs_salt stress (M1 × M2); Table S5-2: Heat map and top 50 DEG contigs_Maize_control_vs_salt + ZnO/NPs_2 g L−1 (M1 × M3); Table S5-3: Heat map and top 50 DEG contigs_Maize_control_vs_ZnO/NPs_2 g L−1 (M1 × M4); Table S5-4: Heat map and top 50 DEG contigs_Maize_salt_vs_salt + ZnO/NPs_2 g L−1 (M2 × M3); Supplementary file S6. Table S6-1: Pathways and their upregulated sequences linked to Zea mays in the plant reactome database_Maize_control_vs_salt stress (M1 × M2); Table S6-2: Pathways and their downregulated sequences linked to Zea mays in the plant reactome database_Maize_control_vs_salt stress (M1 × M2); Table S6-3: Pathways and their upregulated sequences linked to Zea mays in the plant reactome database__Maize_control_vs_salt + ZnO/NPs_2 g L−1 (M1 × M3); Table S6-4: Pathways and their downregulated sequences linked to Zea mays in the plant reactome database__Maize_control_vs_salt + ZnO/NPs_2 g L−1 (M1 × M3); Table S6-5: Pathways and their upregulated sequences linked to Zea mays in the plant reactome database_Maize_control_vs_ZnO/NPs_2 g L−1 (M1 × M4); Table S6-6: Pathways and their downregulated sequences linked to Zea mays in the plant reactome database_Maize_control_vs_ZnO/NPs_2 g L−1 (M1 × M4); Table S6-7: Pathways and their upregulated sequences linked to Zea mays in the plant reactome database_Maize_salt_vs_salt + ZnO/NPs_2 g L−1 (M2 × M3); Table S6-8: Pathways and their downregulated sequences linked to Zea mays in the plant reactome database_Maize_salt_vs_salt + ZnO/NPs_2 g L−1 (M2 × M3). Supplementary file S7. Table S7-1: Pathways and their upregulated sequences linked to Zea mays in the plant reactome database with functional annotations, homology metrics, and probable TRINITY IDs of genes _Maize_control_vs_salt stress (M1 × M2); Table S7-2: Pathways and their downregulated sequences linked to Zea mays in the plant reactome database with functional annotations, homology metrics, and probable TRINITY IDs of genes_Maize_control_vs_salt stress (M1 × M2); Table S7-3: Pathways and their upregulated sequences linked to Zea mays in the plant reactome database with functional annotations, homology metrics, and probable TRINITY IDs of genes__Maize_control_vs_salt + ZnO/NPs_2 g L−1 (M1 × M3); Table S7-4: Pathways and their downregulated sequences linked to Zea mays in the plant reactome database with functional annotations, homology metrics, and probable TRINITY IDs of genes__Maize_control_vs_salt + ZnO/NPs_2 g L−1 (M1 × M3); Table S7-5: Pathways and their upregulated sequences linked to Zea mays in the plant reactome database with functional annotations, homology metrics, and probable TRINITY IDs of genes_Maize_control_vs_ZnO/NPs_2 g L−1 (M1 × M4); Table S7-6: Pathways and their downregulated sequences linked to Zea mays in the plant reactome database with functional annotations, homology metrics, and probable TRINITY IDs of genes_Maize_control_vs_ZnO/NPs_2 g L−1 (M1 × M4); Table S7-7: Pathways and their upregulated sequences linked to Zea mays in the plant reactome database with functional annotations, homology metrics, and probable TRINITY IDs of genes_Maize_salt_vs_salt + ZnO/NPs_2 g L−1 (M2 × M3); Table S7-8: Pathways and their downregulated sequences linked to Zea mays in the plant reactome database with functional annotations, homology metrics, and probable TRINITY IDs of genes_Maize_salt_vs_salt + ZnO/NPs_2 g L−1 (M2 × M3).

Author Contributions

Conceptualization, M.A., R.R. and K.D.; data curation, M.A., K.D., M.W.N. and Z.T.; formal analysis, M.A., R.R. and K.D.; funding acquisition, Z.T.; investigation, M.A. and K.D.; methodology, M.A. and K.D.; project ad-ministration, Z.T.; resources, Z.T.; software, M.A., R.R. and K.D.; supervision, Z.T. and K.D.; validation, M.A. and K.D.; visualization, M.A.; writing—original draft, M.A., R.R., M.W.N. and K.D.; writing—review and editing, M.A., R.R., M.W.N., K.D. and Z.T. All authors have read and agreed to the published version of the manuscript.

Funding

The Hungarian University of Agriculture and Life Sciences Research Excellence Programme and Flagship Research Groups Programme supported this work.

Data Availability Statement

The raw reads (SRA’s) were deposited in the National Center for Biotechnology Information (NCBI) database under accession: PRJNA1141091 and ID: 1141091 and entitled: Maize treated with ZnO-nanoparticles against salt stress. The reads were as follows: (1) Repository name: Maize_control; Data identification number: SRR30013180; Direct URL to data: https://www.ncbi.nlm.nih.gov/sra/?term=SRR30013180 (Registration date: 28 July 2024). (2) Repository name: Maize_salt; Data identification number: SRR30013179; Direct URL to data: https://www.ncbi.nlm.nih.gov/sra/?term=SRR30013179 (Registration date: 28 July 2024). (3) Repository name: Maize_salt + ZnONP; Data identification number: SRR30013178; Direct URL to data: https://www.ncbi.nlm.nih.gov/sra/?term=SRR30013178 (Registration date: 28 July 2024). (4) Repository name: Maize_ZnONP; Data identification number: SRR30013177; Direct URL to data: https://www.ncbi.nlm.nih.gov/sra/?term=SRR30013177 (Registration date: 28 July 2024).

Conflicts of Interest

The authors declare no conflicts of interest.

Appendix A

Figure A1. HPLC chromatogram showing the separation of selected phenolics standards (a), M1: Control (tap water) (b); M2: Sodium Chloride (150 mM) (c); M3: Sodium Chloride (150 mM) with ZnO/NPs (2 g L−1) (d); M4: Tap water with ZnO/NPs (2 g L−1) (e).
Agronomy 15 02875 g0a1

References

  1. Erenstein, O.; Jaleta, M.; Sonder, K.; Mottaleb, K.; Prasanna, B.M. Global Maize Production, Consumption and Trade: Trends and R&D Implications. Food Secur. 2022, 14, 1295–1319. [Google Scholar] [CrossRef] [Scilit]
  2. Saldivar, S.O.S.; Perez-Carrillo, E. Maize. In Encyclopedia of Food and Health; Caballero, B., Finglas, P.M., Toldrá, F., Eds.; Academic Press: Oxford, UK, 2016; pp. 601–609. ISBN 978-0-12-384953-3. [Google Scholar]
  3. Oyebamiji, Y.O.; Adigun, B.A.; Shamsudin, N.A.A.; Ikmal, A.M.; Salisu, M.A.; Malike, F.A.; Lateef, A.A. Recent Advancements in Mitigating Abiotic Stresses in Crops. Horticulturae 2024, 10, 156. [Google Scholar] [CrossRef] [Scilit]
  4. Bennett, E.M.; Baird, J.; Baulch, H.; Chaplin-Kramer, R.; Fraser, E.; Loring, P.; Morrison, P.; Parrott, L.; Sherren, K.; Winkler, K.J.; et al. Chapter One–Ecosystem Services and the Resilience of Agricultural Landscapes. In Advances in Ecological Research; Bohan, D.A., Vanbergen, A.J., Eds.; The Future of Agricultural Landscapes, Part II; Academic Press: Oxford, UK, 2021; Volume 64, pp. 1–43. [Google Scholar]
  5. He, M.; He, C.-Q.; Ding, N.-Z. Abiotic Stresses: General Defenses of Land Plants and Chances for Engineering Multistress Tolerance. Front. Plant Sci. 2018, 9, 1771. [Google Scholar] [CrossRef] [Scilit]
  6. Berhanu, A.A.; Ayele, Z.B.; Dagnew, D.C.; Fenta, A.B.; Kassie, K.E. Smallholder Farmers’ Coping Strategies to Climate Change and Variability: Evidence from Ethiopia. Clim. Serv. 2024, 35, 100509. [Google Scholar] [CrossRef] [Scilit]
  7. Mareri, L.; Parrotta, L.; Cai, G. Environmental Stress and Plants. Int. J. Mol. Sci. 2022, 23, 5416. [Google Scholar] [CrossRef] [Scilit]
  8. Irik, H.A.; Bikmaz, G. Effect of Different Salinity on Seed Germination, Growth Parameters and Biochemical Contents of Pumpkin (Cucurbita pepo L.) Seeds Cultivars. Sci. Rep. 2024, 14, 6929. [Google Scholar] [CrossRef] [Scilit] [PubMed]
  9. Alkharabsheh, H.M.; Seleiman, M.F.; Hewedy, O.A.; Battaglia, M.L.; Jalal, R.S.; Alhammad, B.A.; Schillaci, C.; Ali, N.; Al-Doss, A. Field Crop Responses and Management Strategies to Mitigate Soil Salinity in Modern Agriculture: A Review. Agronomy 2021, 11, 2299. [Google Scholar] [CrossRef] [Scilit]
  10. Janaagal, M.; Sharma, P.; Kumari, G.; Gulia, H.; Suresh, G.; Tallapragada, S.; Devi, S.; Lakra, N.; Arya, S.S.; Pooja, P. Revolutionizing High Temperature Stress Relief: Exploring the Latest Advances in Salicylic Acid Application. J. Crop Health 2024, 76, 1293–1305. [Google Scholar] [CrossRef] [Scilit]
  11. Muhammad, M.; Waheed, A.; Wahab, A.; Majeed, M.; Nazim, M.; Liu, Y.-H.; Li, L.; Li, W.-J. Soil Salinity and Drought Tolerance: An Evaluation of Plant Growth, Productivity, Microbial Diversity, and Amelioration Strategies. Plant Stress 2024, 11, 100319. [Google Scholar] [CrossRef] [Scilit]
  12. Welti, E.A.R.; Kaspari, M. Sodium Addition Increases Leaf Herbivory and Fungal Damage across Four Grasslands. Funct. Ecol. 2021, 35, 1212–1221. [Google Scholar] [CrossRef] [Scilit]
  13. Acharya, B.R.; Gill, S.P.; Kaundal, A.; Sandhu, D. Strategies for Combating Plant Salinity Stress: The Potential of Plant Growth-Promoting Microorganisms. Front. Plant Sci. 2024, 15, 1406913. [Google Scholar] [CrossRef] [Scilit]
  14. Tarolli, P.; Luo, J.; Park, E.; Barcaccia, G.; Masin, R. Soil Salinization in Agriculture: Mitigation and Adaptation Strategies Combining Nature-Based Solutions and Bioengineering. iScience 2024, 27, 108830. [Google Scholar] [CrossRef] [Scilit]
  15. Maqsood, M.F.; Shahbaz, M.; Khalid, F.; Rasheed, Y.; Asif, K.; Naz, N.; Zulfiqar, U.; Zulfiqar, F.; Moosa, A.; Alamer, K.H.; et al. Biogenic Nanoparticles Application in Agriculture for ROS Mitigation and Abiotic Stress Tolerance: A Review. Plant Stress 2023, 10, 100281. [Google Scholar] [CrossRef] [Scilit]
  16. Ahmed, M.; Tóth, Z.; Decsi, K. The Impact of Salinity on Crop Yields and the Confrontational Behavior of Transcriptional Regulators, Nanoparticles, and Antioxidant Defensive Mechanisms under Stressful Conditions: A Review. Int. J. Mol. Sci. 2024, 25, 2654. [Google Scholar] [CrossRef] [Scilit]
  17. Zhou, X.; El-Sappah, A.H.; Khaskhoussi, A.; Huang, Q.; Atif, A.M.; Elhamid, M.A.A.; Ihtisham, M.; El-Maati, M.F.A.; Soaud, S.A.; Tahri, W. Nanoparticles: A Promising Tool against Environmental Stress in Plants. Front. Plant Sci. 2025, 15, 1509047. [Google Scholar] [CrossRef] [Scilit]
  18. Ashraf, H.; Ramzan, M.; Ahmad, M.Z.; Naz, G.; Usman, S.; Shah, A.A.; Shaffique, S.; Alataway, A.; Elansary, H.O. Sargassum-Synthesized ZnO Nanoparticles Induce Salt Tolerance in Maize Plants through Enhanced Physiological and Biochemical Mechanisms. Sci. Rep. 2025, 15, 30633. [Google Scholar] [CrossRef] [Scilit]
  19. Seleiman, M.F.; Ahmad, A.; Alshahrani, T.S. Integrative Effects of Zinc Nanoparticle and PGRs to Mitigate Salt Stress in Maize. Agronomy 2023, 13, 1655. [Google Scholar] [CrossRef] [Scilit]
  20. Geremew, A.; Stovall, L.; Woldesenbet, S.; Ma, X.; Carson, L. Nanopriming with Zinc Oxide: A Novel Approach to Enhance Germination and Antioxidant Systems in Amaranth. Front. Plant Sci. 2025, 16, 1599192. [Google Scholar] [CrossRef] [Scilit] [PubMed]
  21. Khan, M.N.; Li, Y.; Mu, Y.; Sultan, H.; Baloch, A.; Din, I.; Fu, C.; Li, J.; Khan, Z.; Kumar, S.; et al. Recent Advances in Nano-Enabled Plant Salt Tolerance: Methods of Application, Risk Assessment, Opportunities and Future Prospects. J. Integr. Agric. 2025, 24, 1611–1630. [Google Scholar] [CrossRef] [Scilit]
  22. Seleiman, M.F.; Ahmad, A.; Battaglia, M.L.; Bilal, H.M.; Alhammad, B.A.; Khan, N. Zinc Oxide Nanoparticles: A Unique Saline Stress Mitigator with the Potential to Increase Future Crop Production. S. Afr. J. Bot. 2023, 159, 208–218. [Google Scholar] [CrossRef] [Scilit]
  23. Li, L.; Huang, Z.; Zhou, Z.; Tao, Y.; Zhang, Y.; Mu, Y.; Wu, S.; Nie, L. Foliar Application of Zinc Oxide Nanoparticles Improved Yield and 2-Acetyl-1-Pyrroline Content in Fragrant Rice under Salt Stress. Crop Environ. 2025, 4, 107–117. [Google Scholar] [CrossRef] [Scilit]
  24. Qian, J.; Shan, R.; Shi, Y.; Li, H.; Xue, L.; Song, Y.; Zhao, T.; Zhu, S.; Chen, J.; Jiang, M. Zinc Oxide Nanoparticles Alleviate Salt Stress in Cotton (Gossypium hirsutum L.) by Adjusting Na+/K+ Ratio and Antioxidative Ability. Life 2024, 14, 595. [Google Scholar] [CrossRef] [Scilit] [PubMed]
  25. Ahmed, M.; Decsi, K.; Tóth, Z. Different Tactics of Synthesized Zinc Oxide Nanoparticles, Homeostasis Ions, and Phytohormones as Regulators and Adaptatively Parameters to Alleviate the Adverse Effects of Salinity Stress on Plants. Life 2023, 13, 73. [Google Scholar] [CrossRef] [Scilit] [PubMed]
  26. Rukhsar-Ul-Haqnull; Kausar, A.; Hussain, S.; Javed, T.; Zafar, S.; Anwar, S.; Hussain, S.; Zahra, N.; Saqib, M. Zinc Oxide Nanoparticles as Potential Hallmarks for Enhancing Drought Stress Tolerance in Wheat Seedlings. Plant Physiol. Biochem. PPB 2023, 195, 341–350. [Google Scholar] [CrossRef] [Scilit] [PubMed]
  27. Nazir, M.A.; Hasan, M.; Mustafa, G.; Tariq, T.; Ahmed, M.M.; Golzari Dehno, R.; Ghorbanpour, M. Zinc Oxide Nano-Fertilizer Differentially Effect on Morphological and Physiological Identity of Redox-Enzymes and Biochemical Attributes in Wheat (Triticum aestivum L.). Sci. Rep. 2024, 14, 13091. [Google Scholar] [CrossRef] [Scilit]
  28. Gupta, N.; Verma, V.K. Next-Generation Sequencing and Its Application: Empowering in Public Health Beyond Reality. Microb. Technol. Welf. Soc. 2019, 17, 313–341. [Google Scholar] [CrossRef] [Scilit]
  29. Nowak, B.; Tomkowiak, A.; Sobiech, A.; Bocianowski, J.; Kowalczewski, P.Ł.; Spychała, J.; Jamruszka, T. Identification and Analysis of Candidate Genes Associated with Yield Structure Traits and Maize Yield Using Next-Generation Sequencing Technology. Genes 2024, 15, 56. [Google Scholar] [CrossRef] [Scilit]
  30. Kim, K.-H.; Song, K.; Park, J.-M.; Kim, J.-Y.; Lee, B.-M. RNA-Seq Analysis of Gene Expression Changes Related to Delay of Flowering Time under Drought Stress in Tropical Maize. Appl. Sci. 2021, 11, 4273. [Google Scholar] [CrossRef] [Scilit]
  31. Yu, J.; Holland, J.B.; McMullen, M.D.; Buckler, E.S. Genetic Design and Statistical Power of Nested Association Mapping in Maize. Genetics 2008, 178, 539–551. [Google Scholar] [CrossRef] [Scilit]
  32. Ahmed, M.; Marrez, D.A.; Rizk, R.; Abdul-Hamid, D.; Tóth, Z.; Decsi, K. Interventional Effect of Zinc Oxide Nanoparticles with Zea mays L. Plants When Compensating Irrigation Using Saline Water. Nanomaterials 2024, 14, 1341. [Google Scholar] [CrossRef] [Scilit]
  33. Rizk, R.; Ahmed, M.; Abdul-Hamid, D.; Zedan, M.; Tóth, Z.; Decsi, K. Resulting Key Physiological Changes in Triticum aestivum L. Plants Under Drought Conditions After Priming the Seeds with Conventional Fertilizer and Greenly Synthesized Zinc Oxide Nanoparticles from Corn Wastes. Agronomy 2025, 15, 211. [Google Scholar] [CrossRef] [Scilit]
  34. Ahmed, M.; Marrez, D.A.; Abdelmoeen, N.M.; Mahmoud, E.A.; Abdel-Shakur Ali, M.; Decsi, K.; Tóth, Z. Proximate Analysis of Moringa Oleifera Leaves and the Antimicrobial Activities of Successive Leaf Ethanolic and Aqueous Extracts Compared with Green Chemically Synthesized Ag-NPs and Crude Aqueous Extract against Some Pathogens. Int. J. Mol. Sci. 2023, 24, 3529. [Google Scholar] [CrossRef] [Scilit] [PubMed]
  35. Ahmed, M.; Marrez, D.A.; Rizk, R.; Zedan, M.; Abdul-Hamid, D.; Decsi, K.; Kovács, G.P.; Tóth, Z. The Influence of Zinc Oxide Nanoparticles and Salt Stress on the Morphological and Some Biochemical Characteristics of Solanum lycopersicum L. Plants. Plants 2024, 13, 1418. [Google Scholar] [CrossRef] [Scilit]
  36. Kim, K.-H.; Tsao, R.; Yang, R.; Cui, S.W. Phenolic Acid Profiles and Antioxidant Activities of Wheat Bran Extracts and the Effect of Hydrolysis Conditions. Food Chem. 2006, 95, 466–473. [Google Scholar] [CrossRef] [Scilit]
  37. Venisse, J.-S.; Gullner, G.; Brisset, M.-N. Evidence for the Involvement of an Oxidative Stress in the Initiation of Infection of Pear by Erwinia Amylovora 1. Plant Physiol. 2001, 125, 2164–2172. [Google Scholar] [CrossRef] [Scilit]
  38. Chance, B.; Maehly, A.C. [136] Assay of Catalases and Peroxidases. In Methods in Enzymology; Academic Press: Oxford, UK, 1955; Volume 2, pp. 764–775. [Google Scholar]
  39. Bonnichsen, R.K.; Chance, B.; Theorell, H. Catalase Activity. Acta Chem. Scand. 1947, 1, 685–709. [Google Scholar] [CrossRef] [Scilit]
  40. Maehly, A.C. The Assay of Catalases and Peroxidases. In Methods of Biochemical Analysis; Wiley: Hoboken, NJ, USA, 1954; pp. 357–424. [Google Scholar]
  41. Habig, W.H.; Pabst, M.J.; Jakoby, W.B. Glutathione S-transferases: The first enzymatic step in mercapturic acid formation. J. Biol. Chem. 1974, 249, 7130–7139. [Google Scholar] [CrossRef] [Scilit] [PubMed]
  42. Beauchamp, C.; Fridovich, I. Superoxide Dismutase: Improved Assays and an Assay Applicable to Acrylamide Gels. Anal. Biochem. 1971, 44, 276–287. [Google Scholar] [CrossRef] [Scilit]
  43. Wingett, S.W.; Andrews, S. FastQ Screen: A Tool for Multi-Genome Mapping and Quality Control. F1000Research 2018, 7, 1338. [Google Scholar] [CrossRef] [Scilit]
  44. Bolger, A.M.; Lohse, M.; Usadel, B. Trimmomatic: A Flexible Trimmer for Illumina Sequence Data. Bioinformatics 2014, 30, 2114–2120. [Google Scholar] [CrossRef] [Scilit]
  45. Grabherr, M.G.; Haas, B.J.; Yassour, M.; Levin, J.Z.; Thompson, D.A.; Amit, I.; Adiconis, X.; Fan, L.; Raychowdhury, R.; Zeng, Q.; et al. Full-Length Transcriptome Assembly from RNA-Seq Data without a Reference Genome. Nat. Biotechnol. 2011, 29, 644–652. [Google Scholar] [CrossRef] [Scilit]
  46. Ahmed, M.; Tóth, Z.; Marrez, D.A.; Rizk, R.; Abdul-Hamid, D.; Decsi, K. Transcriptome Datasets of Salt-Stressed Tomato Plants Treated with Zinc Oxide Nanoparticles. Data Brief. 2025, 58, 111282. [Google Scholar] [CrossRef] [Scilit]
  47. Ahmed, M.; Tóth, Z.; Rizk, R.; Abdul-Hamid, D.; Decsi, K. Investigation of Antioxidative Enzymes and Transcriptomic Analysis in Response to Foliar Application of Zinc Oxide Nanoparticles and Salinity Stress in Solanum lycopersicum. Agronomy 2025, 15, 1715. [Google Scholar] [CrossRef] [Scilit]
  48. Li, B.; Dewey, C.N. RSEM: Accurate Transcript Quantification from RNA-Seq Data with or without a Reference Genome. BMC Bioinform. 2011, 12, 323. [Google Scholar] [CrossRef] [Scilit]
  49. Jethva, J.; Schmidt, R.R.; Sauter, M.; Selinski, J. Try or Die: Dynamics of Plant Respiration and How to Survive Low Oxygen Conditions. Plants 2022, 11, 205. [Google Scholar] [CrossRef] [Scilit] [PubMed]
  50. Seleiman, M.F.; Ahmad, A.; Alhammad, B.A.; Tola, E. Exogenous Application of Zinc Oxide Nanoparticles Improved Antioxidants, Photosynthetic, and Yield Traits in Salt-Stressed Maize. Agronomy 2023, 13, 2645. [Google Scholar] [CrossRef] [Scilit]
  51. Munns, R.; Tester, M. Mechanisms of Salinity Tolerance. Annu. Rev. Plant Biol. 2008, 59, 651–681. [Google Scholar] [CrossRef] [Scilit] [PubMed]
  52. Guo, Q.; Liu, L.; Barkla, B.J. Membrane Lipid Remodeling in Response to Salinity. Int. J. Mol. Sci. 2019, 20, 4264. [Google Scholar] [CrossRef] [Scilit]
  53. Adil, M.; Bashir, S.; Bashir, S.; Aslam, Z.; Ahmad, N.; Younas, T.; Asghar, R.M.A.; Alkahtani, J.; Dwiningsih, Y.; Elshikh, M.S. Zinc Oxide Nanoparticles Improved Chlorophyll Contents, Physical Parameters, and Wheat Yield under Salt Stress. Front. Plant Sci. 2022, 13, 932861. [Google Scholar] [CrossRef] [Scilit]
  54. Adrees, M.; Khan, Z.S.; Hafeez, M.; Rizwan, M.; Hussain, K.; Asrar, M.; Alyemeni, M.N.; Wijaya, L.; Ali, S. Foliar Exposure of Zinc Oxide Nanoparticles Improved the Growth of Wheat (Triticum aestivum L.) and Decreased Cadmium Concentration in Grains under Simultaneous Cd and Water Deficient Stress. Ecotoxicol. Environ. Saf. 2021, 208, 111627. [Google Scholar] [CrossRef] [Scilit] [PubMed]
  55. Aqeel, U.; Aftab, T.; Khan, M.M.A.; Naeem, M.; Khan, M.N. A Comprehensive Review of Impacts of Diverse Nanoparticles on Growth, Development and Physiological Adjustments in Plants under Changing Environment. Chemosphere 2022, 291, 132672. [Google Scholar] [CrossRef] [Scilit]
  56. Decsi, K.; Ahmed, M.; Tóth, Z. Genome-Wide Transcriptional Analysis Reveals Gamma-Aminobutyric Acid (GABA) Priming Induces Long-Term Stress Memory in Tomato (Solanum lycopersicum). Agriculture 2025, 15, 2012. [Google Scholar] [CrossRef] [Scilit]
  57. Hussein, M.M.; Abou-Baker, N.H. The Contribution of Nano-Zinc to Alleviate Salinity Stress on Cotton Plants. R. Soc. Open Sci. 2018, 5, 171809. [Google Scholar] [CrossRef] [Scilit]
  58. Fu, C.; Khan, M.N.; Yan, J.; Hong, X.; Zhao, F.; Chen, L.; Ma, H.; Li, Y.; Li, J.; Wu, H. Mechanisms of Nanomaterials for Improving Plant Salt Tolerance. Crop Environ. 2023, 2, 92–99. [Google Scholar] [CrossRef] [Scilit]
  59. Junedi, M.A.; Mukhopadhyay, R.; Manjari, K.S. Alleviating Salinity Stress in Crop Plants Using New Engineered Nanoparticles (ENPs). Plant Stress 2023, 9, 100184. [Google Scholar] [CrossRef] [Scilit]
  60. Li, Z.; Zhu, L.; Zhao, F.; Li, J.; Zhang, X.; Kong, X.; Wu, H.; Zhang, Z. Plant Salinity Stress Response and Nano-Enabled Plant Salt Tolerance. Front. Plant Sci. 2022, 13, 843994. [Google Scholar] [CrossRef] [Scilit] [PubMed]
  61. Gill, S.S.; Tuteja, N. Reactive Oxygen Species and Antioxidant Machinery in Abiotic Stress Tolerance in Crop Plants. Plant Physiol. Biochem. 2010, 48, 909–930. [Google Scholar] [CrossRef] [Scilit]
  62. Caverzan, A.; Passaia, G.; Rosa, S.B.; Ribeiro, C.W.; Lazzarotto, F.; Margis-Pinheiro, M. Plant Responses to Stresses: Role of Ascorbate Peroxidase in the Antioxidant Protection. Genet. Mol. Biol. 2012, 35, 1011–1019. [Google Scholar] [CrossRef] [Scilit] [PubMed]
  63. Sharma, R.; Sahoo, A.; Devendran, R.; Jain, M. Over-Expression of a Rice Tau Class Glutathione s-Transferase Gene Improves Tolerance to Salinity and Oxidative Stresses in Arabidopsis. PLoS ONE 2014, 9, e92900. [Google Scholar] [CrossRef] [Scilit]
  64. Postaire, O.; Tournaire-Roux, C.; Grondin, A.; Boursiac, Y.; Morillon, R.; Schäffner, A.R.; Maurel, C. A PIP1 Aquaporin Contributes to Hydrostatic Pressure-Induced Water Transport in Both the Root and Rosette of Arabidopsis1. Plant Physiol. 2010, 152, 1418–1430. [Google Scholar] [CrossRef] [Scilit]
  65. Liu, Q.; Liu, W.; Niu, Y.; Wang, T.; Dong, J. Liquid–Liquid Phase Separation in Plants: Advances and Perspectives from Model Species to Crops. Plant Commun. 2024, 5, 100663. [Google Scholar] [CrossRef] [Scilit]
  66. Cai, G.; Niu, M.; Sun, Z.; Wang, H.; Zhang, S.; Liu, F.; Wu, Y.; Wang, G. A Small Heat Shock Protein (SlHSP17.3) in Tomato Plays a Positive Role in Salt Stress. Front. Plant Sci. 2024, 15, 1443625. [Google Scholar] [CrossRef] [Scilit]
  67. Liu, W.; Tang, X.; Qi, X.; Fu, X.; Ghimire, S.; Ma, R.; Li, S.; Zhang, N.; Si, H. The Ubiquitin Conjugating Enzyme: An Important Ubiquitin Transfer Platform in Ubiquitin-Proteasome System. Int. J. Mol. Sci. 2020, 21, 2894. [Google Scholar] [CrossRef] [Scilit]
  68. Darriere, T.; Jobet, E.; Zavala, D.; Escande, M.L.; Durut, N.; de Bures, A.; Blanco-Herrera, F.; Vidal, E.A.; Rompais, M.; Carapito, C.; et al. Upon Heat Stress Processing of Ribosomal RNA Precursors into Mature rRNAs Is Compromised after Cleavage at Primary P Site in Arabidopsis Thaliana. RNA Biol. 2022, 19, 719–734. [Google Scholar] [CrossRef] [Scilit]
  69. Ramachandran, S.; Christensen, H.E.M.; Ishimaru, Y.; Dong, C.-H.; Chao-Ming, W.; Cleary, A.L.; Chua, N.-H. Profilin Plays a Role in Cell Elongation, Cell Shape Maintenance, and Flowering in Arabidopsis. Plant Physiol. 2000, 124, 1637–1647. [Google Scholar] [CrossRef] [Scilit]
  70. Su, P.; Yan, J.; Li, W.; Wang, L.; Zhao, J.; Ma, X.; Li, A.; Wang, H.; Kong, L. A Member of Wheat Class III Peroxidase Gene Family, TaPRX-2A, Enhanced the Tolerance of Salt Stress. BMC Plant Biol. 2020, 20, 392. [Google Scholar] [CrossRef] [Scilit]
  71. Chauhan, J.; Prathibha, M.; Singh, P.; Choyal, P.; Mishra, U.N.; Saha, D.; Kumar, R.; Anuragi, H.; Pandey, S.; Bose, B.; et al. Plant Photosynthesis under Abiotic Stresses: Damages, Adaptive, and Signaling Mechanisms. Plant Stress 2023, 10, 100296. [Google Scholar] [CrossRef] [Scilit]
  72. Chen, H.; Song, Y.; Wang, Y.; Wang, H.; Ding, Z.; Fan, K. Zno Nanoparticles: Improving Photosynthesis, Shoot Development, and Phyllosphere Microbiome Composition in Tea Plants. J. Nanobiotechnol. 2024, 22, 389. [Google Scholar] [CrossRef] [Scilit] [PubMed]
  73. Kundu, P.; Nehra, A.; Gill, R.; Tuteja, N.; Gill, S.S. Unraveling the Importance of EF-Hand-Mediated Calcium Signaling in Plants. S. Afr. J. Bot. 2022, 148, 615–633. [Google Scholar] [CrossRef] [Scilit]
  74. Kumar, V.; Naik, I.S.; Das, B.; Singh, A.; Nayak, P.; Mohapatra, C.; Debnath, D.; Tripathy, M.; Behera, K.; Masika, F.B.; et al. Nanoparticles in Plant System: A Comprehensive Review on Their Role in Diverse Stress Management and Phytohormone Signaling. Plant Stress 2025, 18, 101000. [Google Scholar] [CrossRef] [Scilit]
  75. Olejnik, P.; Mądrzak, C.J.; Nuc, K. Cyclophilins and Their Functions in Abiotic Stress and Plant–Microbe Interactions. Biomolecules 2021, 11, 1390. [Google Scholar] [CrossRef] [Scilit]
  76. Ahemad, M.; Kibret, M. Mechanisms and Applications of Plant Growth Promoting Rhizobacteria: Current Perspective. J. King Saud Univ. Sci. 2014, 26, 1–20. [Google Scholar] [CrossRef] [Scilit]
  77. Lv, Y.; Pan, J.; Wang, H.; Reiter, R.J.; Li, X.; Mou, Z.; Zhang, J.; Yao, Z.; Zhao, D.; Yu, D. Melatonin Inhibits Seed Germination by Crosstalk with Abscisic Acid, Gibberellin, and Auxin in Arabidopsis. J. Pineal Res. 2021, 70, e12736. [Google Scholar] [CrossRef] [Scilit]
  78. Wang, S.; Zhang, X.; Gong, D.-H.; Huang, Q.-Q.; Kandegama, W.M.W.W.; Georgiev, M.I.; Gao, Y.-Y.; Liao, P.; Hao, G.-F. Sophisticated Crosstalk of Tryptophan-Derived Metabolites in Plant Stress Responses. Plant Commun. 2025, 6, 101425. [Google Scholar] [CrossRef] [Scilit] [PubMed]
  79. Xu, D.; Sanden, N.C.H.; Hansen, L.L.; Belew, Z.M.; Madsen, S.R.; Meyer, L.; Jørgensen, M.E.; Hunziker, P.; Veres, D.; Crocoll, C.; et al. Export of Defensive Glucosinolates Is Key for Their Accumulation in Seeds. Nature 2023, 617, 132–138. [Google Scholar] [CrossRef] [Scilit]
  80. Sharma, S.; Zhang, X.; Azhar, G.; Patyal, P.; Verma, A.; KC, G.; Wei, J.Y. Valine Improves Mitochondrial Function and Protects against Oxidative Stress. Biosci. Biotechnol. Biochem. 2023, 88, 168–176. [Google Scholar] [CrossRef] [Scilit]
  81. Shan, N.; Xiang, Z.; Sun, J.; Zhu, Q.; Xiao, Y.; Wang, P.; Chen, X.; Zhou, Q.; Gan, Z. Genome-Wide Analysis of Valine-Glutamine Motif-Containing Proteins Related to Abiotic Stress Response in Cucumber (Cucumis sativus L.). BMC Plant Biol. 2021, 21, 492. [Google Scholar] [CrossRef] [Scilit] [PubMed]
  82. Yuan, G.; Qian, Y.; Ren, Y.; Guan, Y.; Wu, X.; Ge, C.; Ding, H. The Role of Plant-Specific VQ Motif-Containing Proteins: An Ever-Thickening Plot. Plant Physiol. Biochem. 2021, 159, 12–16. [Google Scholar] [CrossRef] [Scilit]
  83. Lai, Z.; Li, Y.; Wang, F.; Cheng, Y.; Fan, B.; Yu, J.-Q.; Chen, Z. Arabidopsis Sigma Factor Binding Proteins Are Activators of the WRKY33 Transcription Factor in Plant Defense. Plant Cell 2011, 23, 3824–3841. [Google Scholar] [CrossRef] [Scilit]
  84. Song, W.; Zhao, H.; Zhang, X.; Lei, L.; Lai, J. Genome-Wide Identification of VQ Motif-Containing Proteins and Their Expression Profiles Under Abiotic Stresses in Maize. Front. Plant Sci. 2016, 6, 1177. [Google Scholar] [CrossRef] [Scilit] [PubMed]
  85. Kim, D.Y.; Kwon, S.I.; Choi, C.; Lee, H.; Ahn, I.; Park, S.R.; Bae, S.C.; Lee, S.C.; Hwang, D.J. Expression Analysis of Rice VQ Genes in Response to Biotic and Abiotic Stresses. Gene 2013, 529, 208–214. [Google Scholar] [CrossRef] [Scilit] [PubMed]
  86. Yin, Y.-G.; Kobayashi, Y.; Sanuki, A.; Kondo, S.; Fukuda, N.; Ezura, H.; Sugaya, S.; Matsukura, C. Salinity Induces Carbohydrate Accumulation and Sugar-Regulated Starch Biosynthetic Genes in Tomato (Solanum lycopersicum L. Cv. ‘Micro-Tom’) Fruits in an ABA- and Osmotic Stress-Independent Manner. J. Exp. Bot. 2010, 61, 563–574. [Google Scholar] [CrossRef] [Scilit] [PubMed]
  87. Balibrea, M.; Parra, M.; Bolarín, M.; Pérez-Alfocea, F. Cytoplasmic Sucrolytic Activity Controls Tomato Fruit Growth under Salinity. Aust. J. Plant Physiol. 1999, 26, 561–568. [Google Scholar] [CrossRef] [Scilit]
  88. Balibrea, M.; Santa Cruz, A.; Bolarín, M.; Pérez-Alfocea, F. Sucrolytic Activities in Relation to Sink Strength and Carbohydrate Composition in Tomato Fruit Growing under Salinity. Plant Sci. 1996, 118, 47–55. [Google Scholar] [CrossRef] [Scilit]
  89. Balibrea, M.E.; Martínez-Andújar, C.; Cuartero, J.; Bolarín, M.C.; Pérez-Alfocea, F. The High Fruit Soluble Sugar Content in Wild Lycopersicon Species and Their Hybrids with Cultivars Depends on Sucrose Import during Ripening Rather than on Sucrose Metabolism. Funct. Plant Biol. FPB 2006, 33, 279–288. [Google Scholar] [CrossRef] [Scilit]
Figure 1. The effects of different treatments on the concentration of GR, POX, GST, SOD, and CAT enzymes in maize leaves. The small letters above the bars show how significant the results are. If they have the same letter over values, it means they are not statistically different (p < 0.05). mg: milligram. FW: fresh weight.
Agronomy 15 02875 g001
Figure 2. Transcript-level quantification in maize. The figure is derived in its original format from OmicsBox https://www.biobam.com/omicsbox/ (accessed: 7 June 2025).
Agronomy 15 02875 g002
Figure 3. Evaluation of control and treatments subjected to salinity stress using comparative transcriptome analysis (M1 vs. M2). Red indicates DEGs that were up-regulated, whereas blue indicates those that were down-regulated.
Agronomy 15 02875 g003
Figure 4. Evaluation of control and treatments subjected to salinity-stress and 2 g L−1 sprayed ZnO/NPs using comparative transcriptome analysis (M1 vs. M3). Red indicates DEGs that were up-regulated, whereas blue indicates those that were down-regulated.
Agronomy 15 02875 g004
Figure 5. Evaluation of control and treatments subjected to 2 g L−1 sprayed ZnO/NPs using comparative transcriptome analysis (M1 vs. M4). Red indicates DEGs that were up-regulated, whereas blue indicates those that were down-regulated.
Agronomy 15 02875 g005
Figure 6. Evaluation of salinity stress and treatments subjected to salinity-stress and 2 g L−1 sprayed ZnO/NPs using comparative transcriptome analysis (M2 vs. M3). Red indicates DEGs that were up-regulated, whereas blue indicates those that were down-regulated.
Agronomy 15 02875 g006
Figure 7. Biosynthesis of the amino acid L-tryptophan. The data utilized to generate the figure is sourced directly from OmicsBox https://www.biobam.com/omicsbox/ (accessed on 4 June 2025). L-Gln: L-glutamine. PYR: Pyruvate. L-Glu: L-glutamate. PRPP: phosphoribosyl pyrophosphate. PPi: pyrophosphate. L-Ser: L-serine. L-Trp: L-tryptophan. Zm00001d053374: gene encodes for the phosphoribosylanthranilate isomerase enzyme. Zm00001d020008: gene encodes for the indole-3-glycerol-phosphate synthase enzyme.
Agronomy 15 02875 g007
Figure 8. Degradation of the amino acid L-valine. The data utilized to generate the figure is sourced directly from OmicsBox https://www.biobam.com/omicsbox/ (accessed on 27 October 2025). NADPH: nicotinamide adenine dinucleotide phosphate (Reduced form). NAD+: nicotinamide adenine dinucleotide (oxidized form). KIV: 2-ketoisolvalerate. L-Glu: L-glutamate. 2OG: 2-oxoglutarate (α-ketoglutarate). L-Val: L-valine. FAD: flavin adenine dinucleotide. FADH2: reduced flavin adenine dinucleotide. CoA-SH: Co enzyme A. ISB Co-A: Isobutyryl Co-A. MACR Co-A: metylacrylyl Co-A. PROP Co-A: Propionyl Co-A. Zm00001eb009540: gene encodes for the transaminase enzyme. Zm00001eb249250: gene encodes for the crotonase enzyme. Zm00001eb023080: gene encodes for the hydroxyisobutyryl-CoA hydrolase enzyme. Zm00001eb224720: gene encodes for the hydroxyisobutyric acid dehydrogenase enzyme. Zm00001eb302330: gene encodes for the methylmalonic semialdehyde dehydrogenase enzyme.
Agronomy 15 02875 g008
Figure 9. Biosynthesis of the amino acid L-valine. The data utilized to generate the figure is sourced directly from OmicsBox https://www.biobam.com/omicsbox/ (accessed on 4 June 2025). PYR: Pyruvate. [2]: 2 molecules of pyruvate. NADPH: nicotinamide adenine dinucleotide phosphate (Reduced form). NADP+: nicotinamide adenine dinucleotide phosphate (oxidized form). KIV: 2-ketoisolvalerate. L-Glu: L-glutamate. 2OG: 2-oxoglutarate (α-ketoglutarate). L-Val: L-valine.
Agronomy 15 02875 g009
Table 1. Demonstration of the protocols of determining the antioxidative enzymes activities.
Protocol/EnzymeBuffer and ConditionsReagents/SubstratesReaction System and ProcedureMeasurement and UnitReference
1. Extraction50 mM Phosphate Buffer (pH 7.0) (Monobasic & dibasic sodium phosphate)
  • 1 mM PEG
  • 1 mM PMSF
  • 8% (w/v) PVP
  • 0.01% (v/v) Triton X-100
Sample: 500 mg leaf
Process: Homogenize, then Centrifuge at 11,500 rpm for 10 min at 4 °C.
Output: A supernatant.
N/A[37]
2. Peroxidase (POX)100 mM Phosphate Buffer (pH 6.0)
  • 5% Pyrogallol
  • 0.5% H2O2
Mix 0.05 mL extract + 2 mL reaction mixture.Absorbance at 420 nm
Unit: 1.0 mg purpurogallin in 20 s
Calculation: U mg−1 FW
[38]
3. Glutathione reductase (GR)0.1 M Tris Buffer + 2 mM EDTA
  • 50 µM NADPH
  • 0.5 mM GSSG
Mix 0.1 mL extract + 2 mL reaction mixture.Absorbance at 340 nm
Unit: NADPH coefficient: 6.2 mM−1 cm−1
Calculation: U mg−1 FW
[39,40]
4. Glutathione-s-transferase (GST)Potassium Phosphate Buffer(KH2PO4 & K2HPO4)
  • 6 mM GSH
  • 1 mM CDNB
Mix 0.05 mL extract + 1 mL reaction mixture.Absorbance at 340 nm
Unit: CDNB conjugation coefficient: 9.6 mmol L−1 cm−1
Calculation: U mg−1 FW
[41]
5. Superoxide dismutase (SOD)50 mM Na-Phosphate Buffer (pH 7.8)
  • 13 mM Methionine
  • 75 mM NBT
  • 20 μM Riboflavin
  • 0.1 mM EDTA
Mix 0.1 mL extract + 1 mL reaction mixture.Absorbance at 560 nm
Unit: Amount causing 50% inhibition of NBT reduction
Calculation: U mg−1 FW
[42]
6. Catalase (CAT)N/A (Titration)
  • 0.1 M H2O2
  • 10% H2SO4
  • 0.05 N KMnO4
Method: Titration of residual H2O2 with KMnO4.
Principle: Decomposition of H2O2 → H2O + O2
Titration volume
Calculation: mg of decomposed H2O2
[39,40]
Key Abbreviations are N/A: No measuring units, FW: Fresh Weight, PEG: Polyethylene Glycol, PMSF: Phenylmethylsulfonyl Fluoride, PVP: Polyvinylpyrrolidone, CDNB: 1-chloro-2,4-dinitrobenzene, NBT: Nitro Blue Tetrazolium, GSSG: Oxidized Glutathione, and NADPH: Nicotinamide Adenine Dinucleotide Phosphate (reduced form).
Table 2. HPLC examination of phenolics found in the leaves of maize that had been subjected to a variety of treatments.
Detected CompoundsRetention Time (min)Concentration (μg/g)/Treatment
M1M2M3M4
Gallic acid3.7118.49147.16106.52117.09
Protocatechuic acid6.47.156.405.245.51
Gentisic acid9.70000
p-hydroxybenzoic acid9.82.923.206.097.94
Catechin11.820.3622.2691.2387.94
Chlorogenic acid12.756.3479.3773.8449.85
Caffeic acid13.511.369.8510.089.37
Syringic acid14.66.277.088.409.30
Vanillic acid16.019.8716.8518.0817.03
Ferulic acid20.6381.53401.97400.13339.25
Sinapic acid21.5243.4283.08324.17278.09
Rutin24.52.312.652.843.08
p-coumaric acid25.44.763.533.293.13
Apigenin-7-glucoside27.54.465.304.123.28
Rosmarinic acid290000
Cinnamic acid35.13.211.971.941.97
Quercetin36.314.516.3915.2116.01
Apigenin39.219.8722.5626.5215.41
Kaempferol40.80000
Chrysin51.50.570.502.112.74
Total 917.371030.121099.81966.99
M1: Control (tap water); M2: Sodium Chloride (150 mM); M3: Sodium Chloride (150 mM) with ZnO/NPs (2 g L−1); M4: Tap water with ZnO/NPs (2 g L−1).
Table 3. Determination of maize leaves’ phenolics and flavonoids.
TreatmentsConcentrations (µg/g)
TPs (µg GAE/g DW)TFs (µg QE/g DW)
M119.99 ± 0.22 c18.83 ± 0.07 ab
M228.42 ± 0.47 a19.919 ± 0.06 a
M324.09 ± 0.20 b17.53 ± 0.63 b
M418.61 ± 0.33 d17.78 ± 0.11 b
Each value denotes the mean ± standard error. Values sharing the same letter are not significantly different at (p ≤ 0.05), with comparisons made among different treatments within the same column. M1: Control (tap water); M2: Sodium Chloride (150 mM); M3: Sodium Chloride (150 mM) with ZnO/NPs (2 g L−1); M4: Tap water with ZnO/NPs (2 g L−1). GAE: gallic acid equivalent. QE: quercetin equivalent. DW: dry weight.
Table 4. The top fifty up- and down-regulated sequences in maize according to the KEGG database and the possible pathways involving them.
ComparisonPathways That Are Connected to the KEGG DatabaseSequences That Are Connected to the KEGG Database
M1 vs. M2Metabolism of thiamine, seleno compound, arginine and proline, beta-Alanine, cysteine, methionine, pyrimidine, purine, and riboflavin. Biosynthesis of various plant secondary metabolites, benzoxazinoid, pantothenate and CoA. One carbon pool by folate.17
M1 vs. M3Metabolism of cysteine and methionine, pyrimidine, purine, arginine, proline, porphyrin, riboflavin, beta-alanine, drugs- cytochrome P450, sulfur, and thiamine. Biosynthesis of benzoxazinoid, various antibiotics, and various plant secondary metabolites. 16
M1 vs. M4Metabolism of cysteine and methionine, pyrimidine, purine, one carbon pool by folate, seleno compound, arginine and proline, porphyrin, beta-alanine, drugs- cytochrome P450, riboflavin, and thiamine. Biosynthesis of benzoxazinoid and various plant secondary metabolites18
M2 vs. M3Metabolism of thiamine, drug metabolism—cytochrome P450, drug- other enzymes, glutathione, purine, xenobiotics by cytochrome P450, riboflavin, and glycerophospholipid. Oxidative phosphorylation.10
M1: Control (tap water); M2: Sodium Chloride (150 mM); M3: Sodium Chloride (150 mM) with ZnO/NPs (2 g L−1); M4: Tap water with ZnO/NPs (2 g L−1).
Disclaimer/Publisher’s Note: The statements, opinions and data contained in all publications are solely those of the individual author(s) and contributor(s) and not of MDPI and/or the editor(s). MDPI and/or the editor(s) disclaim responsibility for any injury to people or property resulting from any ideas, methods, instructions or products referred to in the content.