Article

Development and Application of Image-Based High-Throughput Phenotyping Methodology for Salt Tolerance in Lentils

1
Agriculture Victoria, AgriBio, Centre for AgriBioscience, Bundoora, VIC 3083, Australia
2
Faculty of Veterinary and Agricultural Sciences, The University of Melbourne, Parkville, VIC 3010, Australia
3
Agriculture Victoria, Grains Innovation Park, Horsham, VIC 3400, Australia
4
Agriculture Victoria, Hamilton Centre, Hamilton, VIC 3300, Australia
5
School of Applied Systems Biology, La Trobe University, Bundoora, VIC 3086, Australia
*
Authors to whom correspondence should be addressed.
Agronomy 2020, 10(12), 1992; https://doi.org/10.3390/agronomy10121992
Submission received: 2 November 2020 / Revised: 8 December 2020 / Accepted: 15 December 2020 / Published: 18 December 2020
(This article belongs to the Special Issue Salinities—Framing Knowledge into Multiple Agricultural Contexts)

Abstract

:
Soil salinity is a major abiotic stress in Australian lentil-producing areas. It is therefore imperative to identify genetic variation for salt tolerance in order to develop lentil varieties suitable for saline soils. Conventional screening methods include the manual assessment of stress symptoms, which can be very laborious, time-consuming, and error-prone. Recent advances in image-based high-throughput phenotyping (HTP) technologies have provided unparalleled opportunities to screen plants for a range of stresses, such as salt toxicity. The current study describes the development and application of an HTP method for salt toxicity screening in lentils. In a pilot study, six lentil genotypes were evaluated to determine the optimal salt level and the growth stage for distinguishing lentil genotypes using red–green–blue (RGB) images on a LemnaTec Scanalyzer 3D phenomics platform. The optimized protocol was then applied to screen 276 accessions that were also assessed earlier in a conventional phenotypic screen. Detailed phenotypic trait assessments, including plant growth and green/non-green color pixels, were made and correlated to the conventional screen (r = 0.55; p < 0.0001). These findings demonstrated the improved efficacy of an image-based phenotyping approach that is high-throughput, efficient, and better suited to modern breeding programs.

1. Introduction

Soil salinity is identified as one of the major abiotic stress factors that limits crop productivity across the world [1,2,3]. In Australia, many agricultural regions are affected by a high soil salinity, which can result in poor plant growth due to reduced water and nutrient uptake [4]. The lentil (Lens culinaris Medik.) is comparatively more sensitive to salt with more than 90% of yield loss recorded at electrical conductivity (EC) = 3 dS/m (i.e., ~30 mM sodium chloride (NaCl)) compared to other grain crops such as barley (10% yield loss at EC = 6.6 dS/m; ~66 mM NaCl), wheat (10% yield loss at EC = 4.9 dS/m; ~49 mM NaCl), and canola (10% yield loss at EC = 7.3 dS/m; ~73 mM NaCl) [5,6]. Therefore, the identification of salt-tolerant lentil germplasm is of utmost importance for the sustainability of the lentil industry.
To identify useful genetic variation for salt-tolerance, efficient and reliable screening techniques need to be available [7]. Currently, the identification of salt-tolerant lentil accessions is dependent on conventional phenotyping under controlled/semi-controlled environments, visually assessing symptoms and manually measuring agronomic and physiological traits [4,8]. In most cases, hydroponics and pot-based greenhouse evaluations are used, but the obtained data are normally poorly correlated to the field observations [9,10]. Moreover, these methods require the development of a reliable scoring scale to rate the plants, as well as the availability of trained staff to interpret and distinguish visual symptoms/affects that may occur due to salt-stress or as a result of other confounding factors. To date, many conventional screening studies have been performed to measure salt tolerance in lentils based on morpho-physiological traits, including plant growth, shoot weight (fresh and dry), and leaf injury [11]. However, all these methods have limitations, including labor intensity, low efficiency, and obvious subjectivity [12].
In recent years, high-throughput phenotyping has been used to complement or replace conventional methods. For many crops, including cotton (Gossypium hirsutum L.) [13], perennial ryegrass (Lolium perenne L.) [14,15,16,17], cereals [18,19,20,21,22,23,24], and pulses [25,26,27,28,29], high-throughput phenomics has facilitated the rapid measurement of complex traits including plant growth, yield, and resistance to biotic and abiotic stress factors under field and greenhouse conditions [30,31]. Several types of digital imaging sensors, including visible/red–green–blue (RGB), fluorescence, hyperspectral and other 3D imaging techniques (e.g., light detection and ranging (LiDAR)) have been used depending on the type of application [32,33,34]. Of these, RGB and hyperspectral imaging have been the most popular and widely used methods for plant evaluation. RGB imaging is a popular way of extracting many external morphological characteristics of plants. It can be used to quantify a range of parameters such as digital volume (a proxy for biomass), color (mean color and color classifications), convex hull (the length of a shape that extends around the outer bounds of the shape), and compactness (how much of the area inside the convex hull is filled with plant tissue), which are considered proxies for traits that are traditionally associated with plant development and performance [32,33,34]. On the other hand, hyperspectral imaging covers a broader range in the electromagnetic spectrum and can hence be applied to evaluate more complex plant traits such as chlorophyll content, leaf/canopy senescence, water/nutrient status, and the healthiness of plants in respect to pest diseases, with greater precision [28,34].
Recently, several studies have used an RGB-based phenotypic assay to measure the salt toxicity responses of plants. Hairmansis et al. [24] developed an image-based phenotyping protocol to assess variations in total shoot area and senescence in rice (Oryza sativa L.) accessions under salt conditions. Furthermore, RGB coupled with fluorescence imaging was used in Arabidopsis thaliana, for extracting morpho-physiological characteristics (e.g., projected shoot area, rosette color variations, and rate of photosynthesis) related to salt stress [35]. In chickpeas (Cicer arietinum L.), RGB imaging (projected shoot area and plant growth rate) has been applied in conjunction with conventional measurements (seed number and senescence score) to understand genetic variation for salt tolerance [25]. Data generated from such high-throughput RGB image-based experiments have also been utilized in marker-trait association studies to identify genomic regions contributing to salt tolerance [36]. However, no such high-throughput phenomics approach has been developed in lentils so far.
In this paper, we describe the development and validation of an image-based phenotyping protocol for salt tolerance in lentils using an automated, high-throughput phenotyping system (LemnaTec Scanalyzer 3D). Initially, a conventional screening of 276 lentil accessions was performed under a semi-controlled environment to understand plant responses to salt toxicity using manual measurements (Experiment 1). Secondly, for the development of a high-throughput phenotyping (HTP) assay, a pilot study comprising six lentil genotypes with known variation to salt stress (control lines) was performed using a LemnaTec Scanalyzer 3D (Experiment 2). The optimal salt concentration and growth stage that could distinguish the response of lentil genotypes under salt treatment were determined. Finally, the optimized high-throughput method was applied to assess the genetic variation for salt tolerance in 276 accessions that were also evaluated with the conventional method (Experiment 3). The accuracy of the high-throughput imaging assay was compared with a conventional screen by calculating the correlations between the two methods. The developed and validated image-based assay offers a robust and faster approach for screening salt tolerance in lentils in a non-destructive manner while reducing cost, time, and labor input. This approach can ultimately be applied in future lentil breeding programs to identify salt-tolerant lentil accessions, thereby increasing the lentil productivity under saline conditions.

2. Materials and Methods

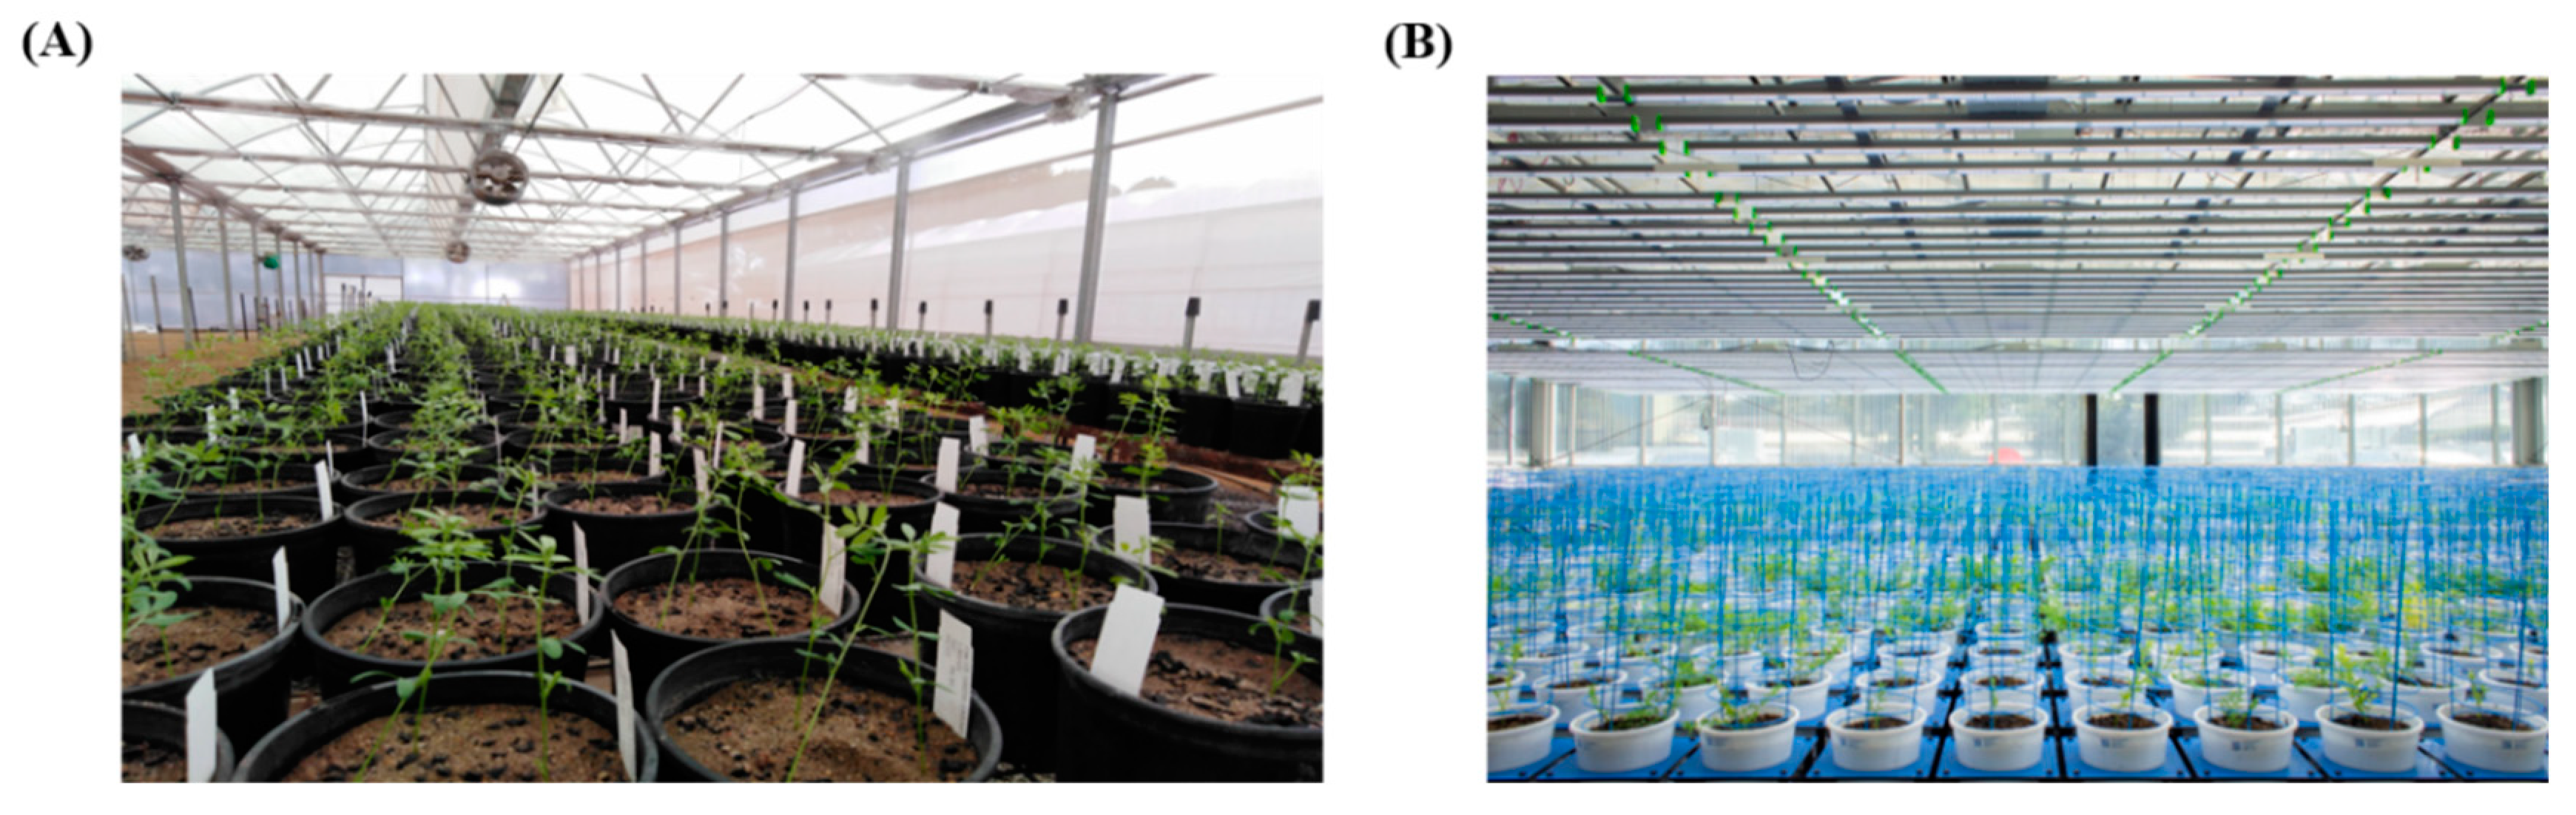
2.1. Experiment 1: Salt Tolerance Screening of Lentil Accessions Using Conventional Phenotyping

The conventional phenotyping experiment was carried-out at the Grains Innovation Park in Horsham, Victoria, Australia, based on protocols derived from the Pulse Breeding Australia (PBA), lentil breeding program. Two hundred and seventy-six lentil accessions from the Australian lentil breeding program were evaluated over autumn (March–May in the southern hemisphere) in a semi-controlled environment (i.e., screenhouse). Seeds of each lentil accession were sown in pots containing 1:1 coarse river sand and 5 mm bluestone chips. A total of 3312 plants were screened only under treatment conditions in a randomized complete block design with four replicates, where each replicate was comprised of three plants per pot (Figure 1A). The average day–night temperatures were maintained at 24 °C ± 3 °C/17 °C ± 2 °C in natural daylength. At 50% plant emergence, the salt treatment was applied with a dilute commercial nutrient solution (Nitrosol®: Amgrow Pty. Ltd., Lidcombe, New South Wales, Australia (nitrogen:phosphorous:potassium (NPK) 4:1:3) and Ca(NO3)2·H2O at 20% of the recommended concentration) in increments of 2 ds/m per day, until the desired level of 6 ds/m was reached, to minimize osmotic shock to the plants. The tolerance of accessions was assessed through a visual growth response scale (1–10) developed by Maher et al. [4] (Table S1) at 10 weeks of post-sowing. The plants were then harvested and dried at 70 °C for three days for further analysis, including shoot dry weights under saline conditions. Most of these lentil accessions were previously assessed in salt screening trials within the PBA lentil breeding program. The visual scores recorded from the current experiment were compared to the available rankings for these accessions from the breeding program trials [37].

2.2. Experiment 2: Optimization of Salt Toxicity Screening Using Image-Based Phenotyping

Based on the salt scores and ranking obtained from the PBA lentil breeding program, six contrasting lentil genotypes categorized as tolerant (T), moderately tolerant (MT), and intolerant (I) (two accessions per each class) were selected to develop the high-throughput salt phenotyping method on a LemnaTec Scanalyzer 3D (LemnaTec GmbH, Aachen, Germany) plant phenomics platform. Lentil seeds were sown in a commercial blend of potting mix (Australian Growing Solutions Pty. Ltd., Tyabb, Victoria, Australia) containing a mixture of composted pine bark, sawdust, propagation sand, gypsum, and a soil-wetting agent (SaturAid®, Debco Pty. Ltd., Tyabb, Victoria, Australia), as well as supplementation with iron chelate and Green Jacket® 9-month controlled-release fertilizer (18:2.5:10, Debco Pty. Ltd., Tyabb, Victoria, Australia). White 200 mm-diameter plastic pots were used for the experiment (Garden City Planters Pty. Ltd., Dandenong South, Victoria, Australia). To provide support for emerged seedlings, a wire cage (powder-coated with a blue resin) was placed in each pot at the time of sowing. Plants were then loaded onto the LemnaTec Scanalyzer 3D phenomics platform (LemnaTec GmbH, Aachen, Germany) at “Plant Phenomics Victoria,” Bundoora, Victoria, Australia, in a climate-controlled glasshouse at 22 °C ± 0.6 °C from 7:00 to 20:00 and 15 °C ± 0.6 °C at night. Throughout the experiment, the relative humidity of the glasshouse was maintained at 38.78% ± 7.02. Supplemental light was provided by full-spectrum, white, overhead light-emitting diodes (Photon Systems Instruments spol. s r.o., Drasov, Czech Republic) during daylight hours that provided a photosynthetic photon flux of 600 µmol m−2 s−1. The glasshouse was clad in plexiglass (poly(methyl methacrylate)) double-walled sheeting that allowed for the full spectrum of sunlight to pass through. Lentil accessions were subjected to four applications of NaCl (0.0, 42.5, 85.0, or 127.5 mmol), with four replicates of each treatment per accession, adding up to a total of 96 lentil plants. RGB color images were collected 10 days after germination via imaging on the LemnaTec Scanalyzer 3D phenomics platform (LemnaTec GmbH, Aachen, Germany) before the salt treatment was applied and then on alternate days for two months. Images were taken from the side at 0° and 90° and from above (top-view). At the end of the experiment, both the fresh and dry mass of each lentil accession were measured for further analysis.

2.3. Experiment 3: Evaluation of Lentil Accessions for Salt Tolerance Using Image-Based Phenotyping

A total of 276 lentil accessions previously evaluated in Experiment 1 were screened using the image-based phenotyping approach developed in Experiment 2 using a partial replication design. Among them, ninety accessions were screened in three replicates and 186 accessions were screened as single replicates, with a total number of 912 plants. Each of these accessions was tested under two conditions: control (0 mmol NaCl) and salt (100 mmol NaCl; determined from Experiment 2). Both control and salt treatments for each genotype were located in adjacent rows within a paired-plot design to minimize position effects. Otherwise, the positions of the genotypes were arranged as part of a randomized block design (Figure 1B). To minimize the osmotic shock, the salt treatment was applied via the white saucers placed beneath each pot in 33.3 mmol increments every 24 h until the target concentration was reached. To prevent Na+-induced Ca2+ deficiency, 2.965 mmol of calcium chloride was also added. Plants were watered daily using the automated LemnaTec Scanalyzer 3D system (LemnaTec GmbH, Aachen, Germany) to 80% soil gravimetric water content (SGWC), which was calculated by measuring the difference between the saturated mass and dry mass of the potting mix. Images were collected using the same method as “Experiment 2.” At the conclusion of the experiment, visual cues of the plants were also taken with the manual scoring scale. The vegetative portion was harvested and oven-dried at 65 °C for three days for dry mass measurements.

2.4. Data Analysis

2.4.1. Conventional Phenotyping

During the analysis, a single pot was considered as an experimental unit. The best linear unbiased estimates (BLUE) of visual symptom scores and shoot dry mass for each genotype were obtained from ASReml, on a pot mean basis [38]. The variations in these traits were plotted using the ggplot2 software package from the Comprehensive R Archive Network (CRAN) library, and the normal distribution of each trait was confirmed using dnorm function in RStudio [39]. The correlation coefficient (r) and Spearman rank correlation were computed for phenotypic traits and visualized using the ggpubr software package in RStudio [39,40].

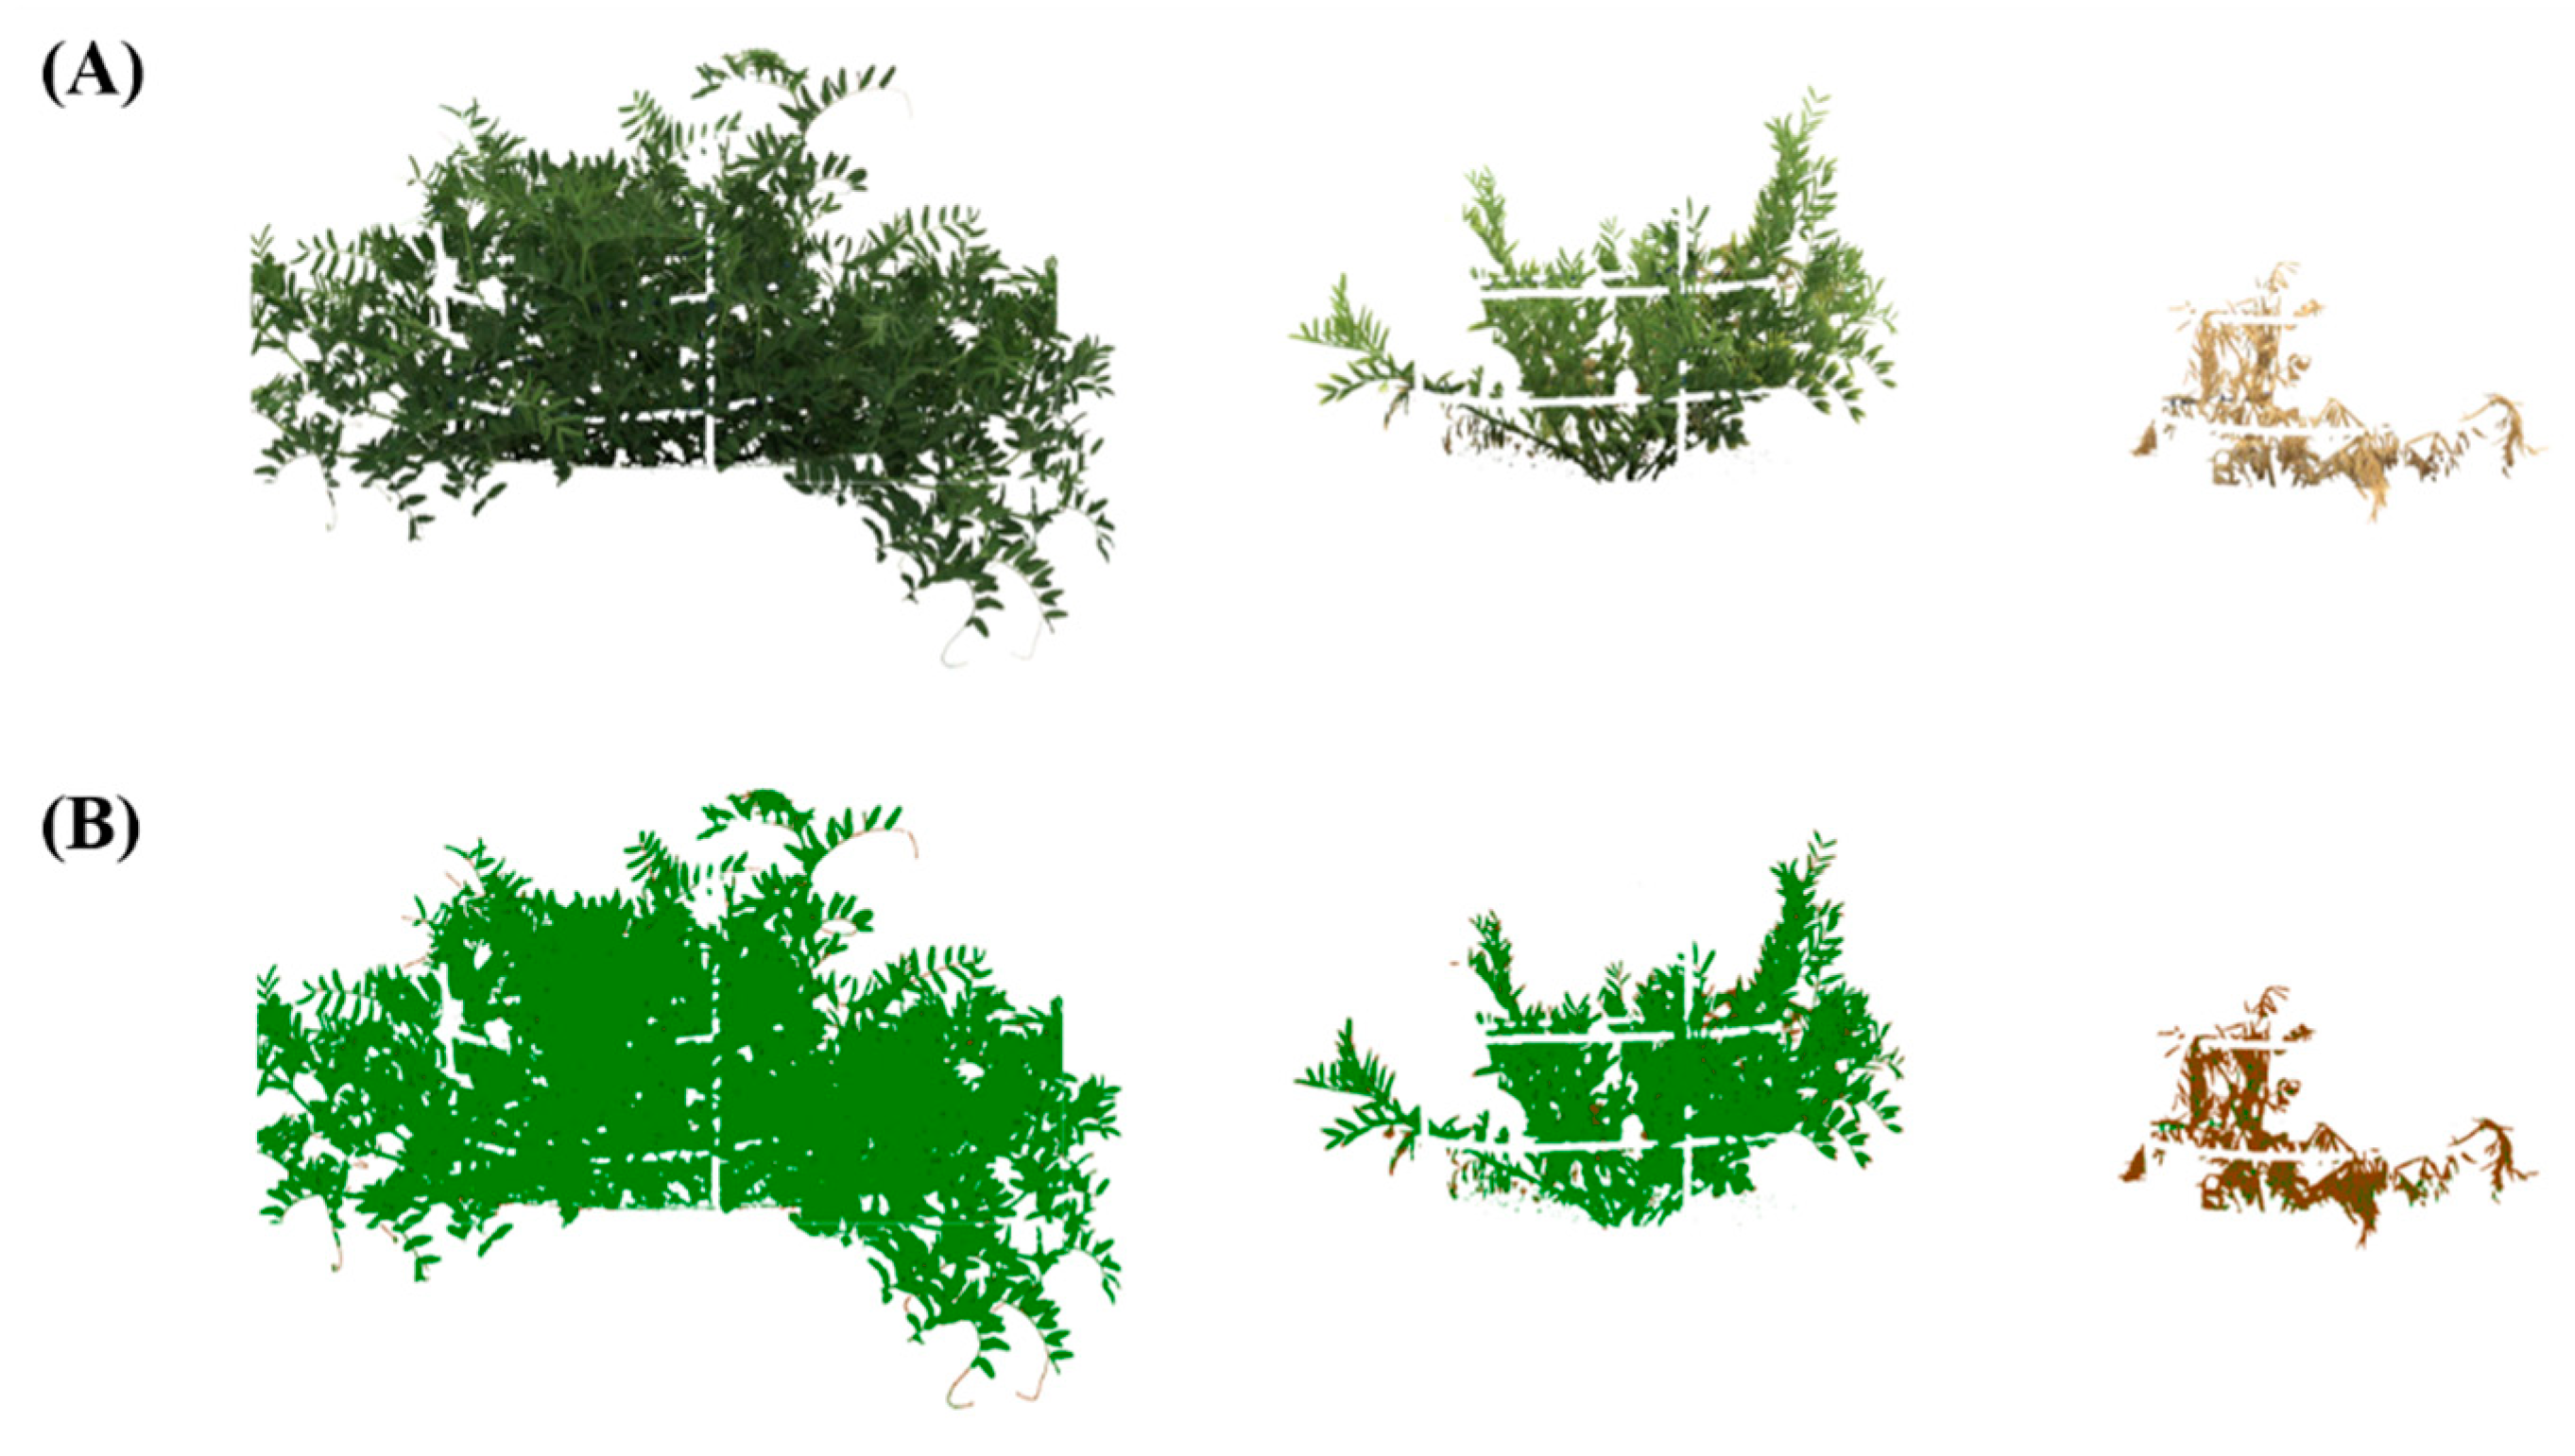
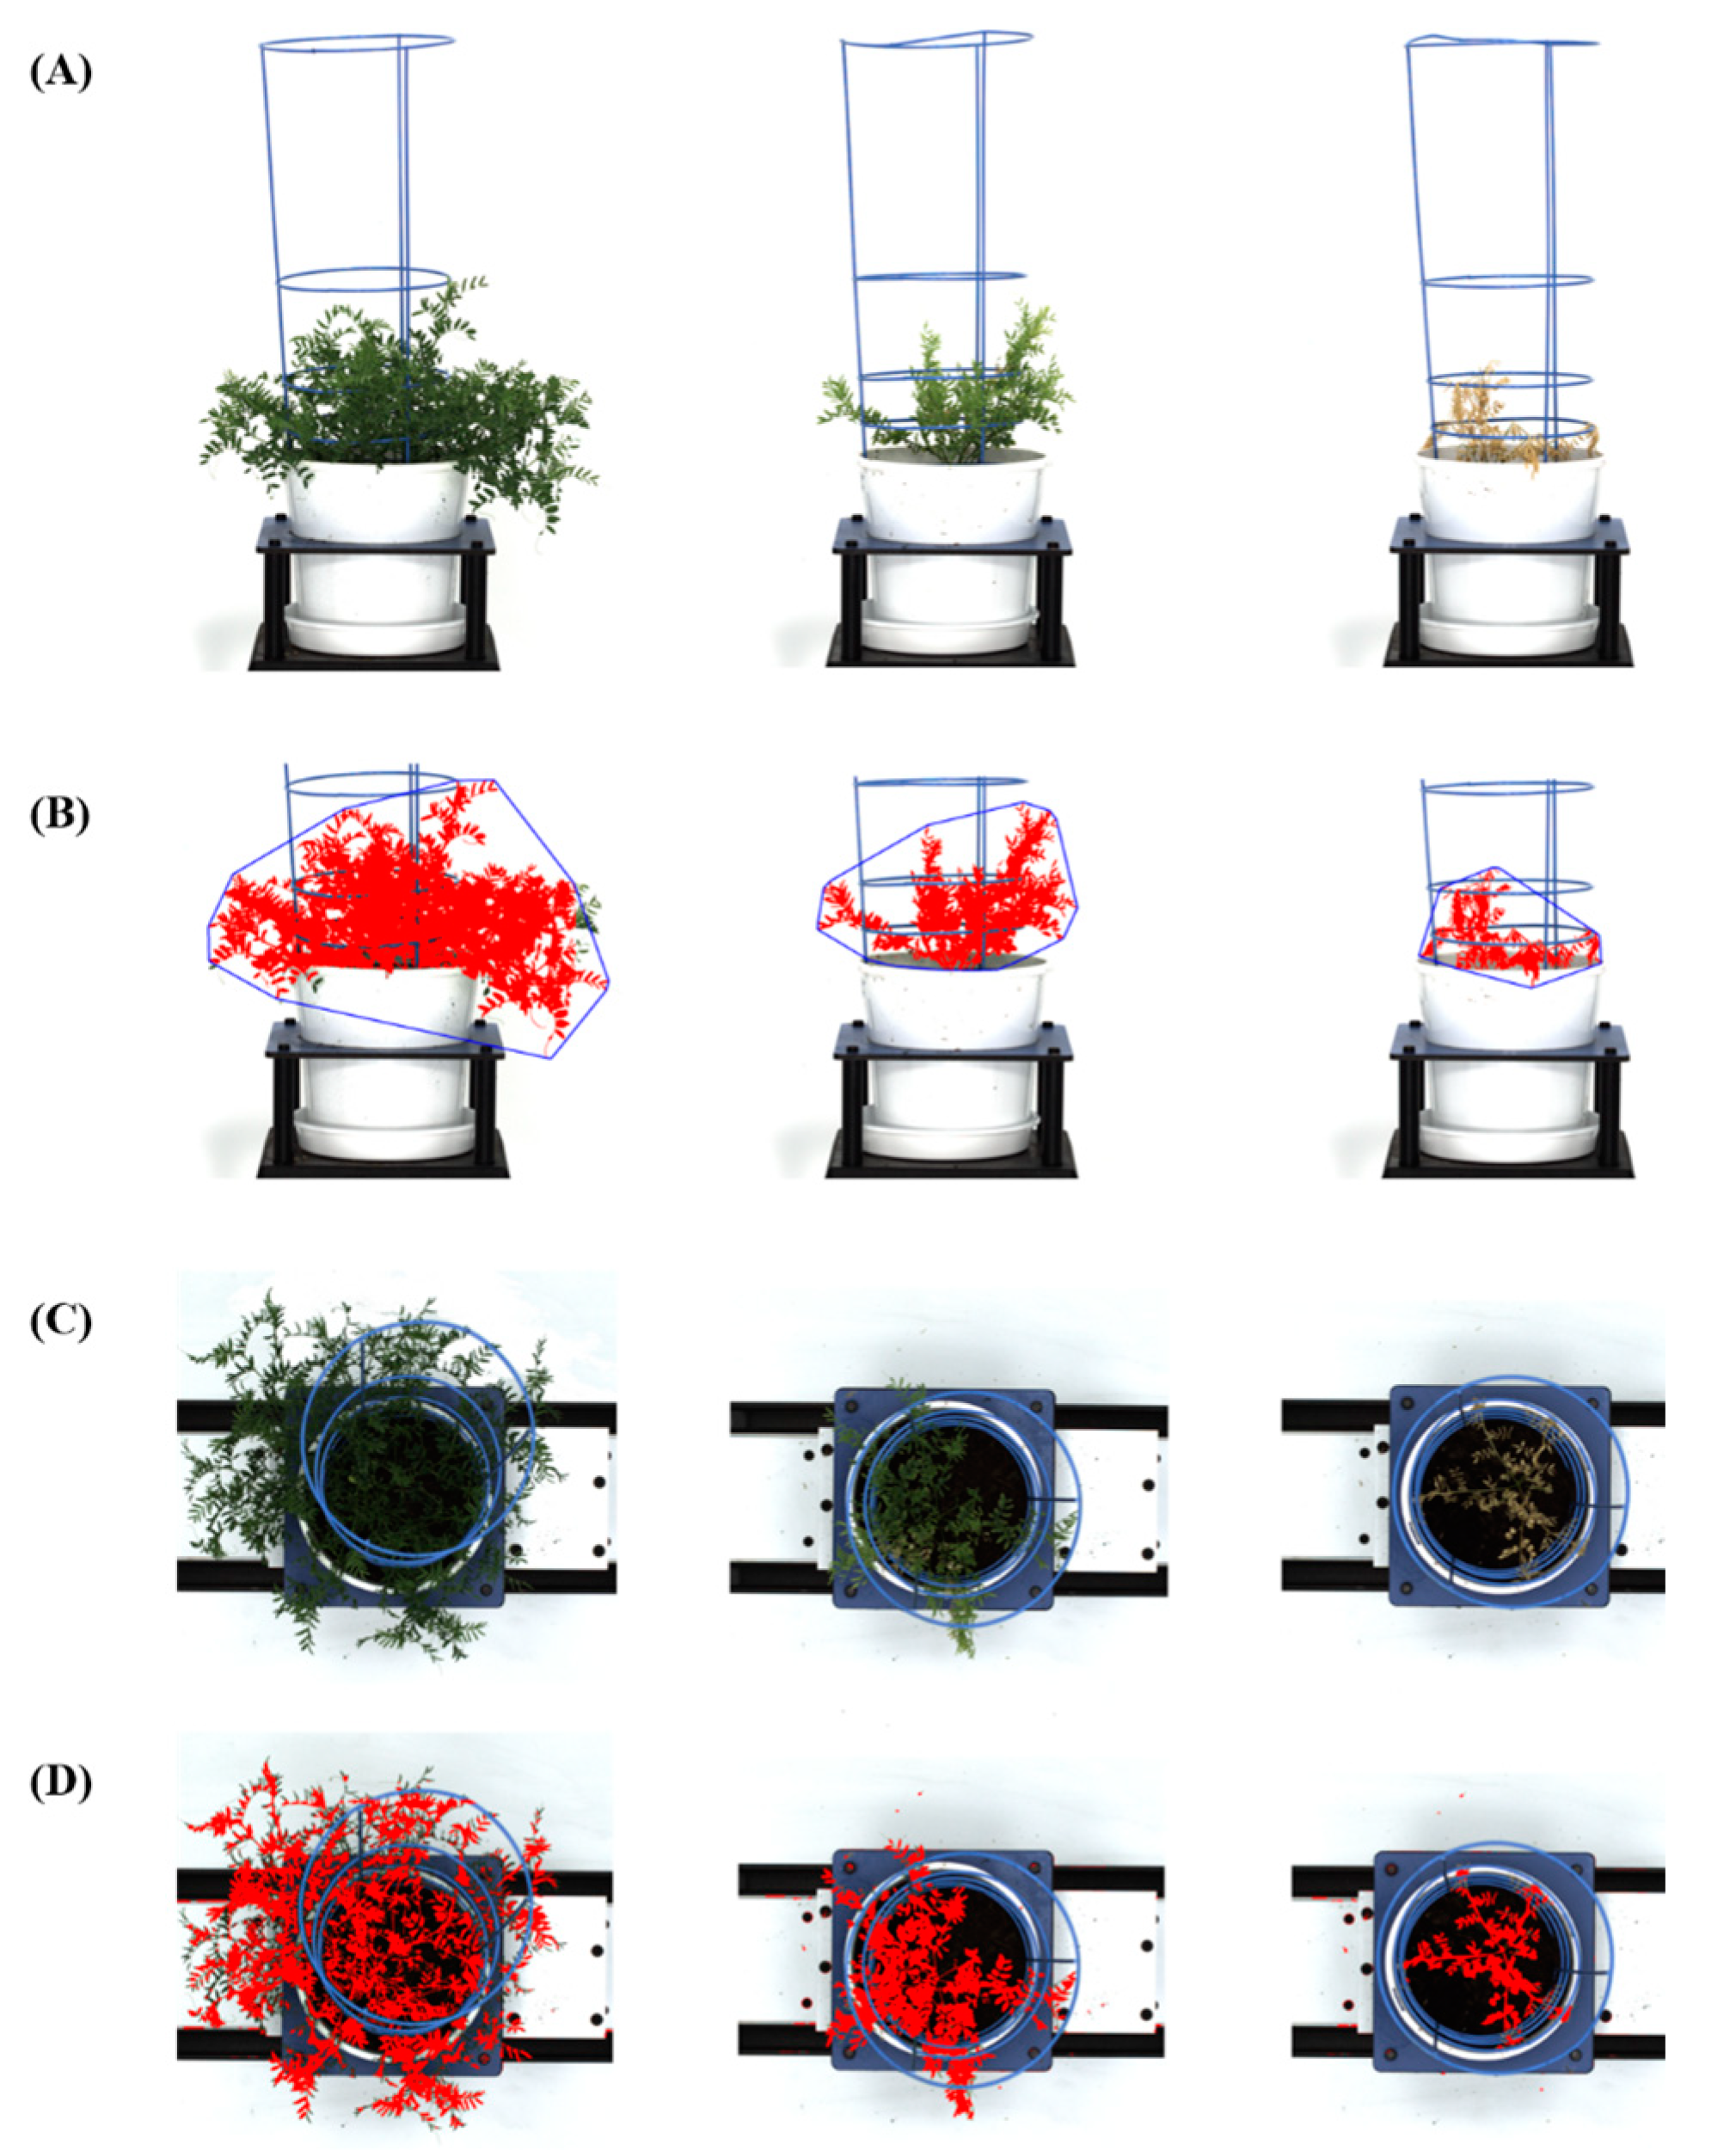
2.4.2. Image-Based Phenotyping

Image snapshots (each of which contained a 0°, 90°, and top-view image taken of each plant on a single occasion) were analyzed using a customized analysis pipeline that was written using the LemnaGrid software (LemnaTec GmbH, Aachen, Germany). RGB images were converted to the L*a*b greyscale, and channels were extracted to enable thresholding. Binary images were generated and then used as masks as part of a process to isolate the region-of-interest (plant) from the background. Data pertaining to growth parameters (area, convex hull area, compactness, and height), as well as color properties (green and non-green color), were collected. Digital volume was calculated by combining data from all three images in each snapshot according to the following formulae [41]:
V Summary = A s . 0 ° × A s . 90 ° × A t                                           V LemnaTec = A s . 0 ° × A s . 90 ° × A t
V IAP = A s 2 . average × A t . average                                 V Keygene = A s . 0 ° + A s . 90 ° + log ( A t 3 )
where As is the projected areas from side view (at different angles) and At is the projected area from the top-view. Color information was collected for all images, with foliage being classified as either “green” or “non-green.” The color binning was programmed in the LemnaGrid software (LemnaTec GmbH, Aachen, Germany) using a color-picker that specifies RGB values. “Green” colors were identified as (136,150,101), (79,91,56), (126,140,89), (102,122,77), (45,56,29), (60,74,43), (112,96,77), (167,142,76), (203,210,83), (134,138,76), (149,164,114), and “non-green” colors were identified as (135,116,78), (102,81,56), (159,140,92), (77,56,33), (182,157,112), and (250,231,166) (Figure 2).
Data generated from the LemnaTec system were tested for statistical significance. The adjusted mean values for each phenotypic trait were derived by running the BLUE model in ASReml [38]. The effects of salt stress were determined by performing an ANOVA at the final harvest. Duncan’s new multiple range test and Tukey’s post-hoc test of significance were conducted for each RGB trait measured in Experiment 2. The BLUEs obtained for phenotypic traits measured in Experiment 3 were plotted using Microsoft Excel and the ggpubr software package in RStudio [39,40]. Finally, the correlation coefficient (r) and Spearman rank correlation were computed and visualized using the ggpubr software package in RStudio [39,40].

3. Results

3.1. Experiment 1: Conventional Phenotyping of Lentil Accessions for Salt Toxicity Screening

A normal distribution was observed for both visual scores and the shoot biomass obtained from 276 accessions that were evaluated at 10 weeks. A wider distribution was observed for salt tolerance score (2.87–7.53), with a mean value of 5.29 (Figure 3A). However, shoot dry mass showed a narrow (4.56–5.76) level of distribution, with a mean value of 4.93 (Figure 3B). The scores and dry weights showed a negative correlation (r = −0.61; p < 0.0001) (Figure 3C). Among the studied lentil germplasm, 70% lentil accessions were categorized as MT, 16% as tolerant, and 14% as intolerant.
The tolerance levels identified from the current study were compared to the rankings available from breeding program trials. One hundred and fifty-six lentil accessions were categorized in the same tolerance class as classified within the breeding program (56%), while 117 accessions were categorized in an adjacent class (one level difference), giving a total of a 98.91% similarity. Only three accessions were misclassified (for example, a tolerant accession being classed as susceptible). The results were also compared using the Spearman rank correlation, where a highly significant correlation (r = 0.44; p < 0.0001) was observed (Figure 3D). Based on the salt tolerance classes, six lentil genotypes—ILL2024, CIPAL 1522 (T), PBA Hurricane, PBA Bolt (MT) and PBA Ace, and PBA Jumbo2 (I)—were selected to establish an image-based high-throughput phenotyping protocol for salt tolerance in lentils.

3.2. Experiment 2: Establishment of High-Throughput Phenotyping Protocol for Salt Tolerance

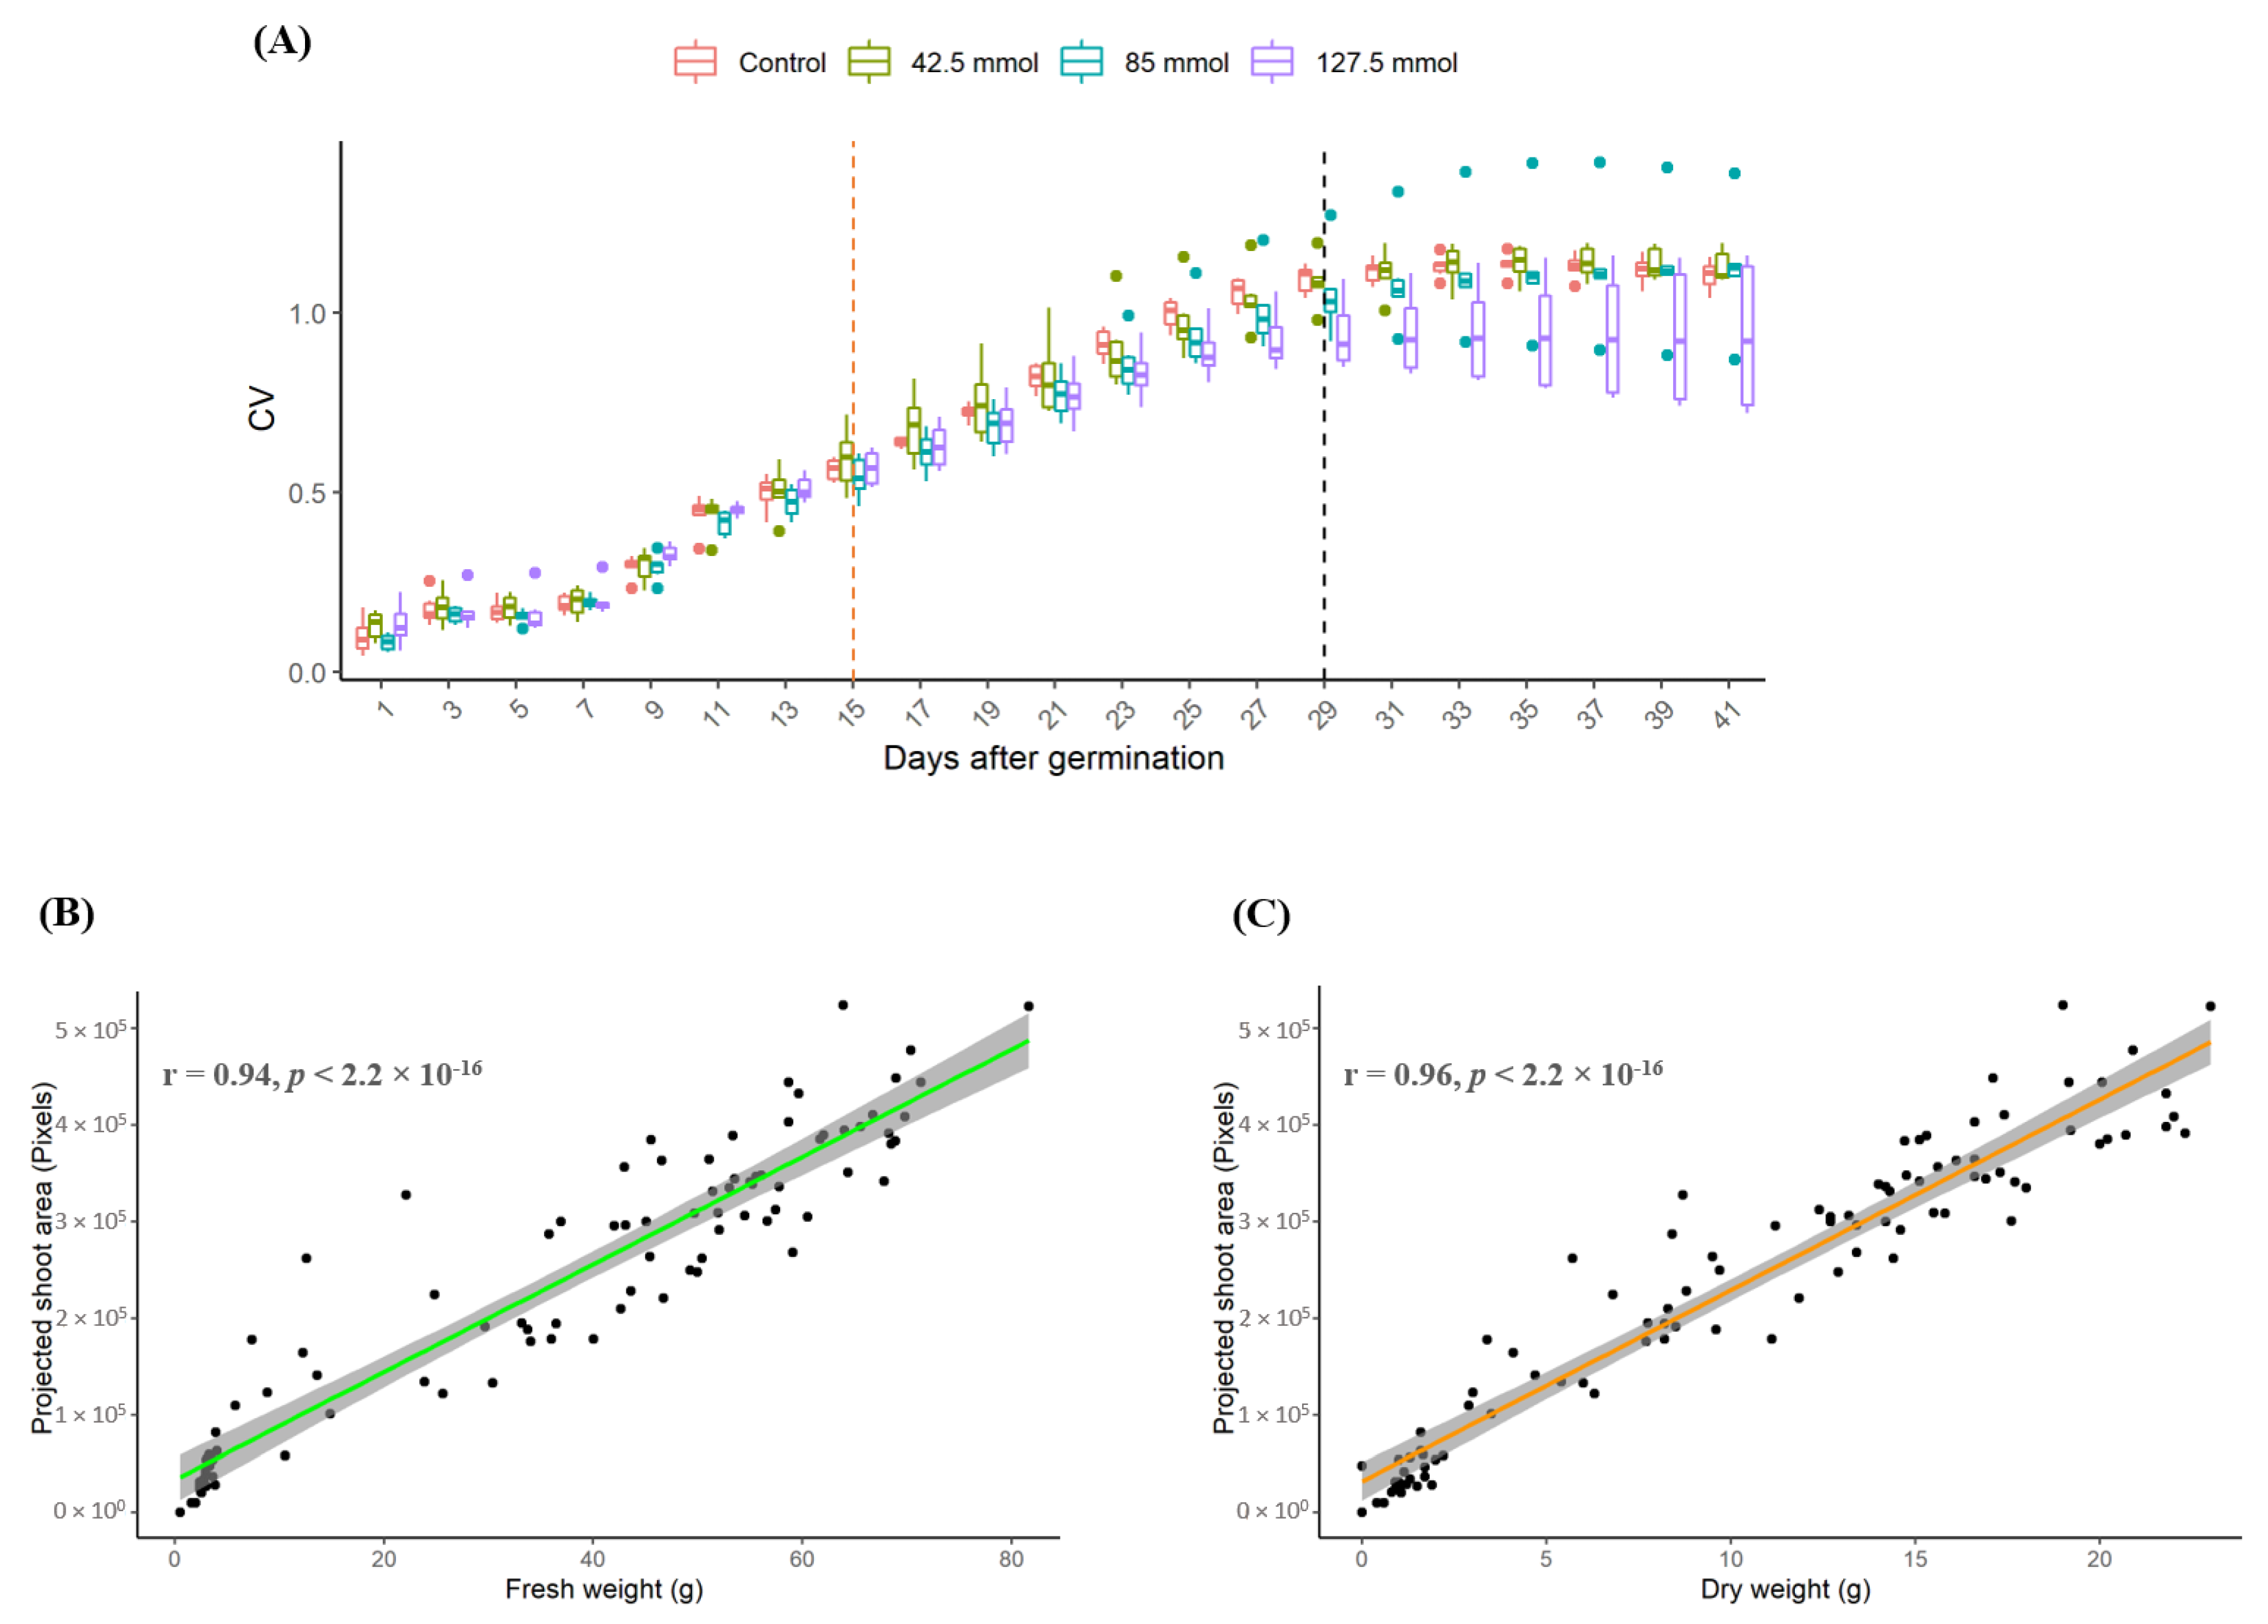
3.2.1. Identification of the Optimal Salt Concentration for the Image-Based Assay

The variation in the projected shoot area of six lentil genotypes was identified using a one-way ANOVA based on the applied salt treatment levels (Table 1 and Figure S1). No significant differences (p > 0.05) were observed at control or 42.5 mmol NaCl treatments. However, significant differences (p < 0.05) were detected among accessions at 85 and 127.5 mmol NaCl (Table 1 and Figure S1).
A two-way ANOVA was also performed to assess the interactions between genotype and salt concentration on the projected shoot area (Table 2). There was no significant effect (p > 0.05) on either genotype or salt treatment levels at 85 mmol NaCl (p = 0.40), whereas the effects were highly significant (p < 0.01) at 127.5 mmol NaCl. Therefore, a salt concentration between 85 and 127.5 mmol NaCl (100 mmol) was chosen as optimal for discriminating between tolerant and susceptible genotypes using image-based screening.

3.2.2. Determination of Growth Stage for Distinguishing Salt Tolerance in Lentil

Since there was no significant reduction in the coefficient of variations for the projected shoot area after two weeks of salt treatment (i.e., 29 days after the seed sowing); day 29 was identified as the earliest time point for distinguishing salt tolerance (Figure 4A). The results were further confirmed by post-hoc and Duncan’s new multiple range tests, where the means of projected shoot area did not significantly change after day 29 (Tables S2 and S3).

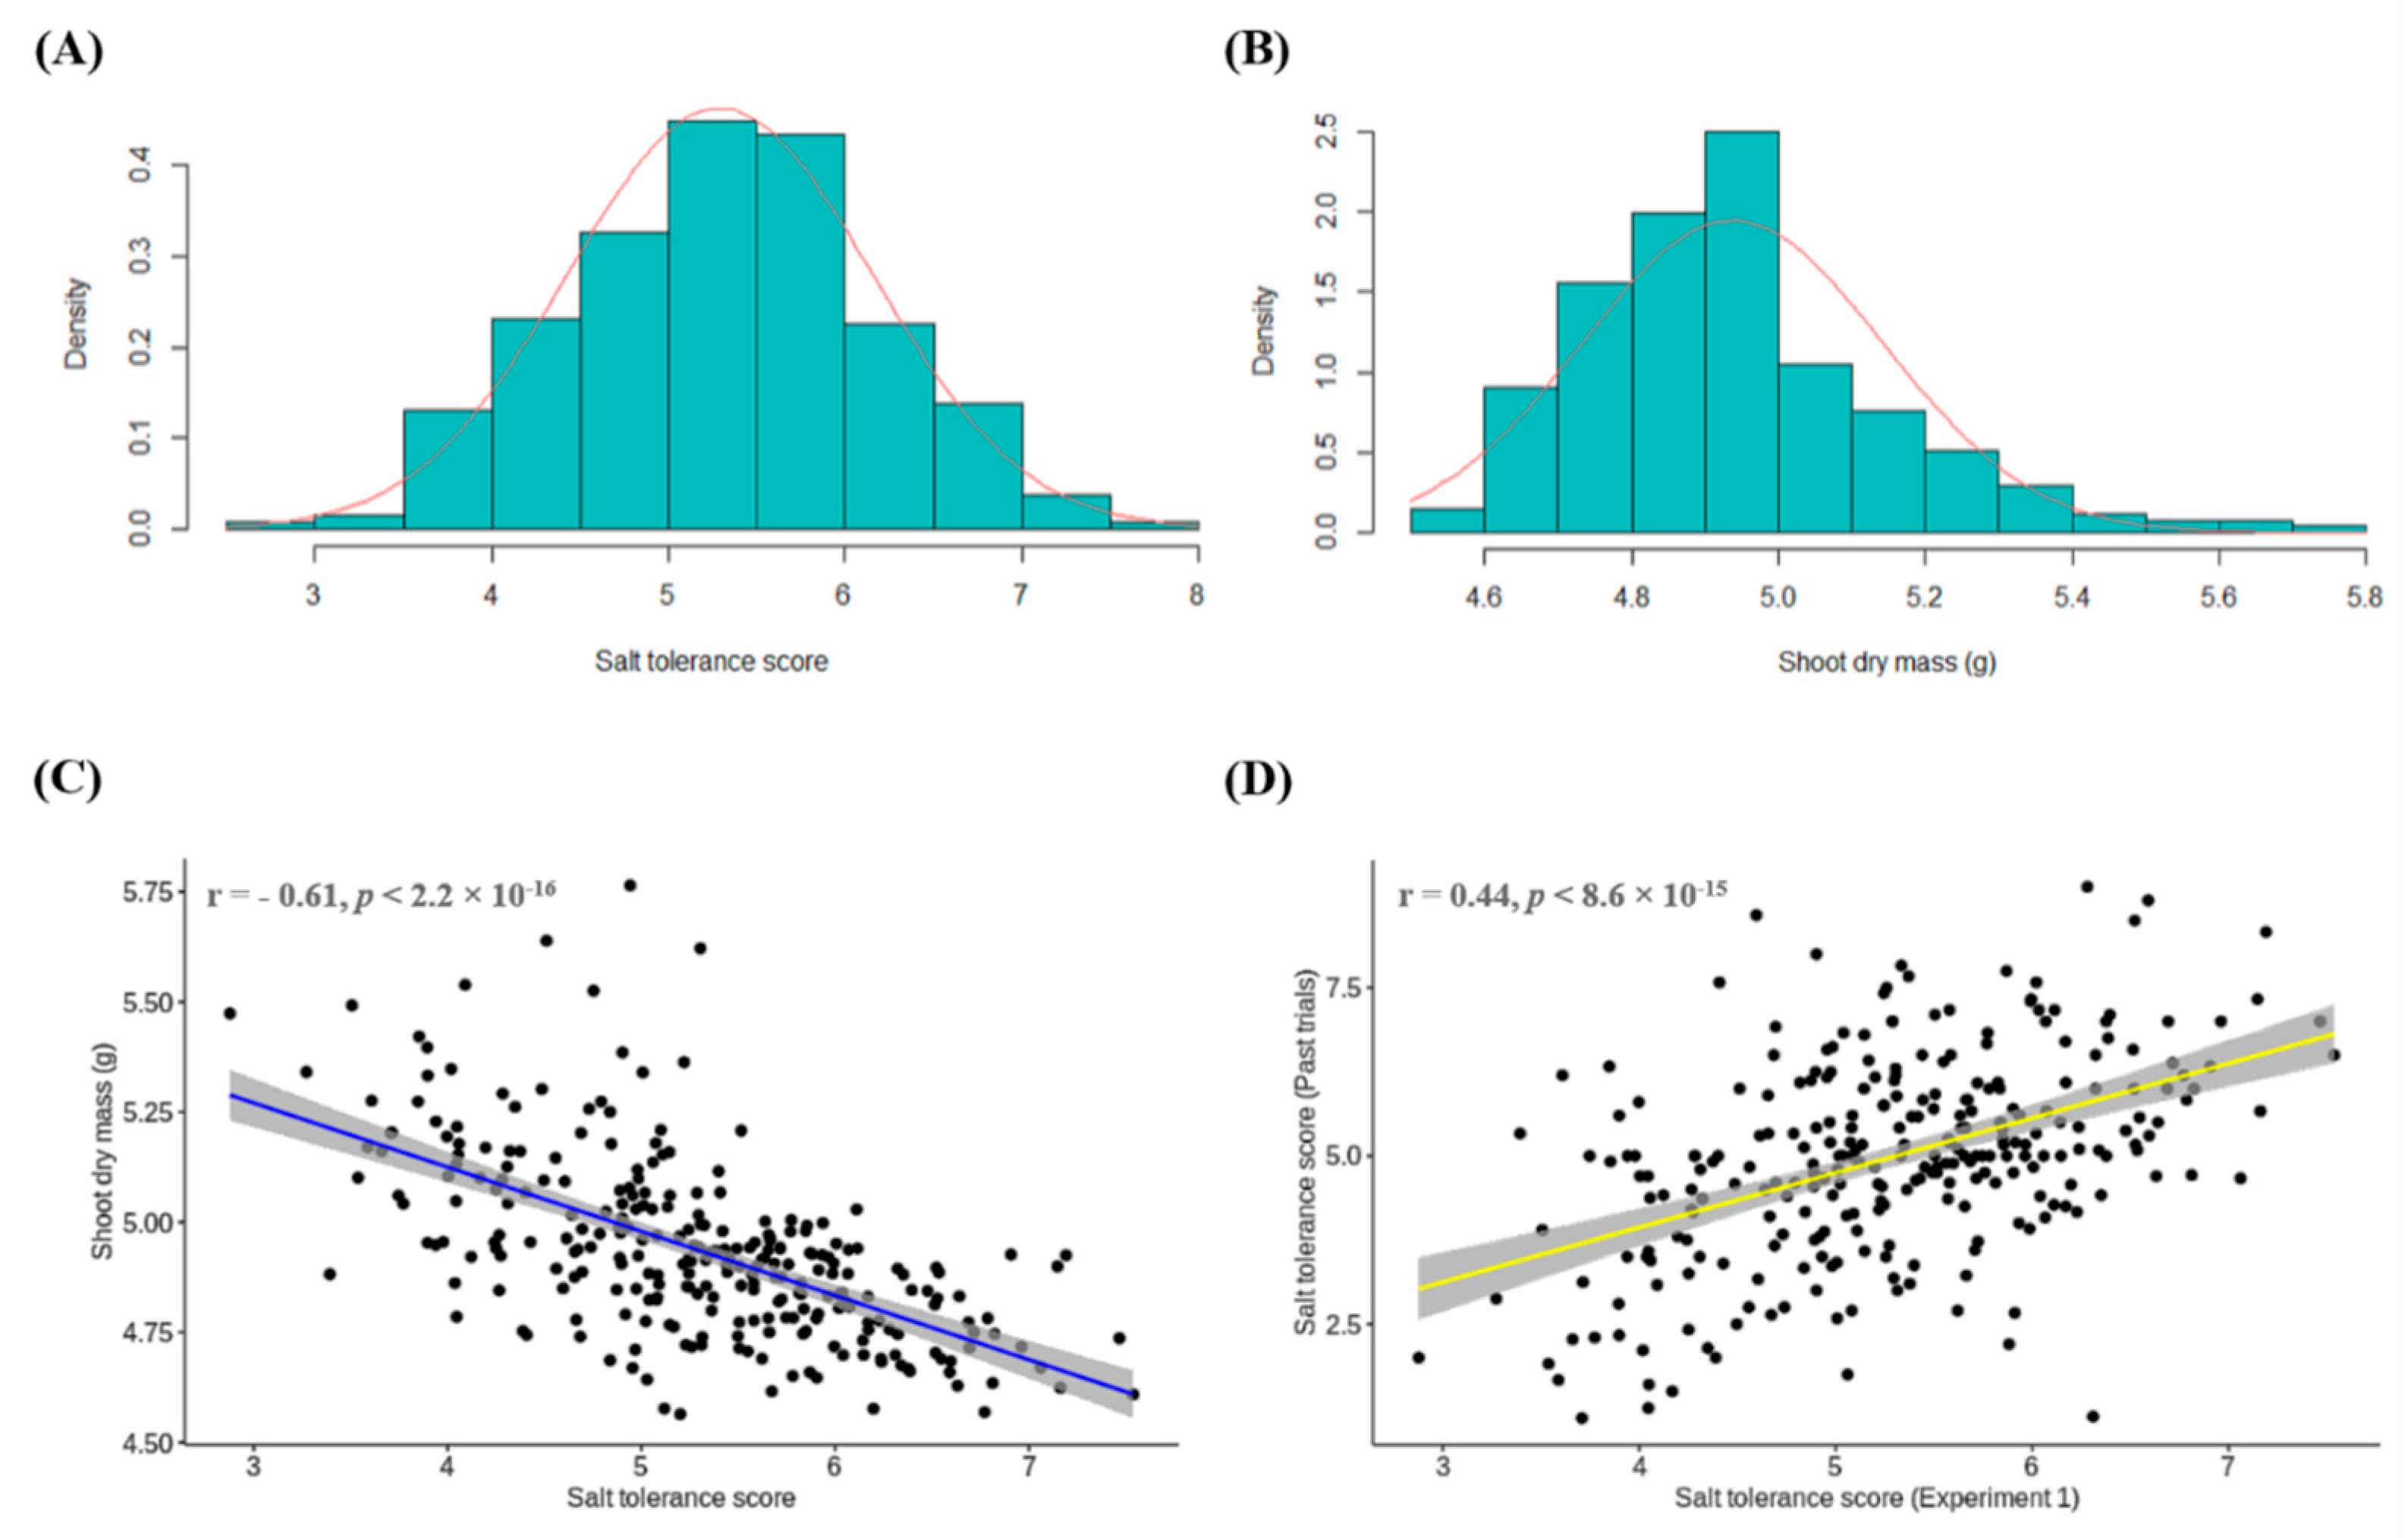
3.2.3. Relationship between Destructive and Non-Destructive Measurement

The projected shoot area of these six genotypes was further compared to their fresh and dry weights at the final harvesting stage. Significant correlations were observed between the projected shoot area and fresh (r = 0.94; p < 0.0001) or dry weights (r = 0.96; p < 0.0001), which implied that the projected shoot area could be used as a proxy for fresh or dry mass (Figure 4B,C).

3.3. Experiment 3: Application of High-Throughput Phenotyping Protocol for Salt Tolerance

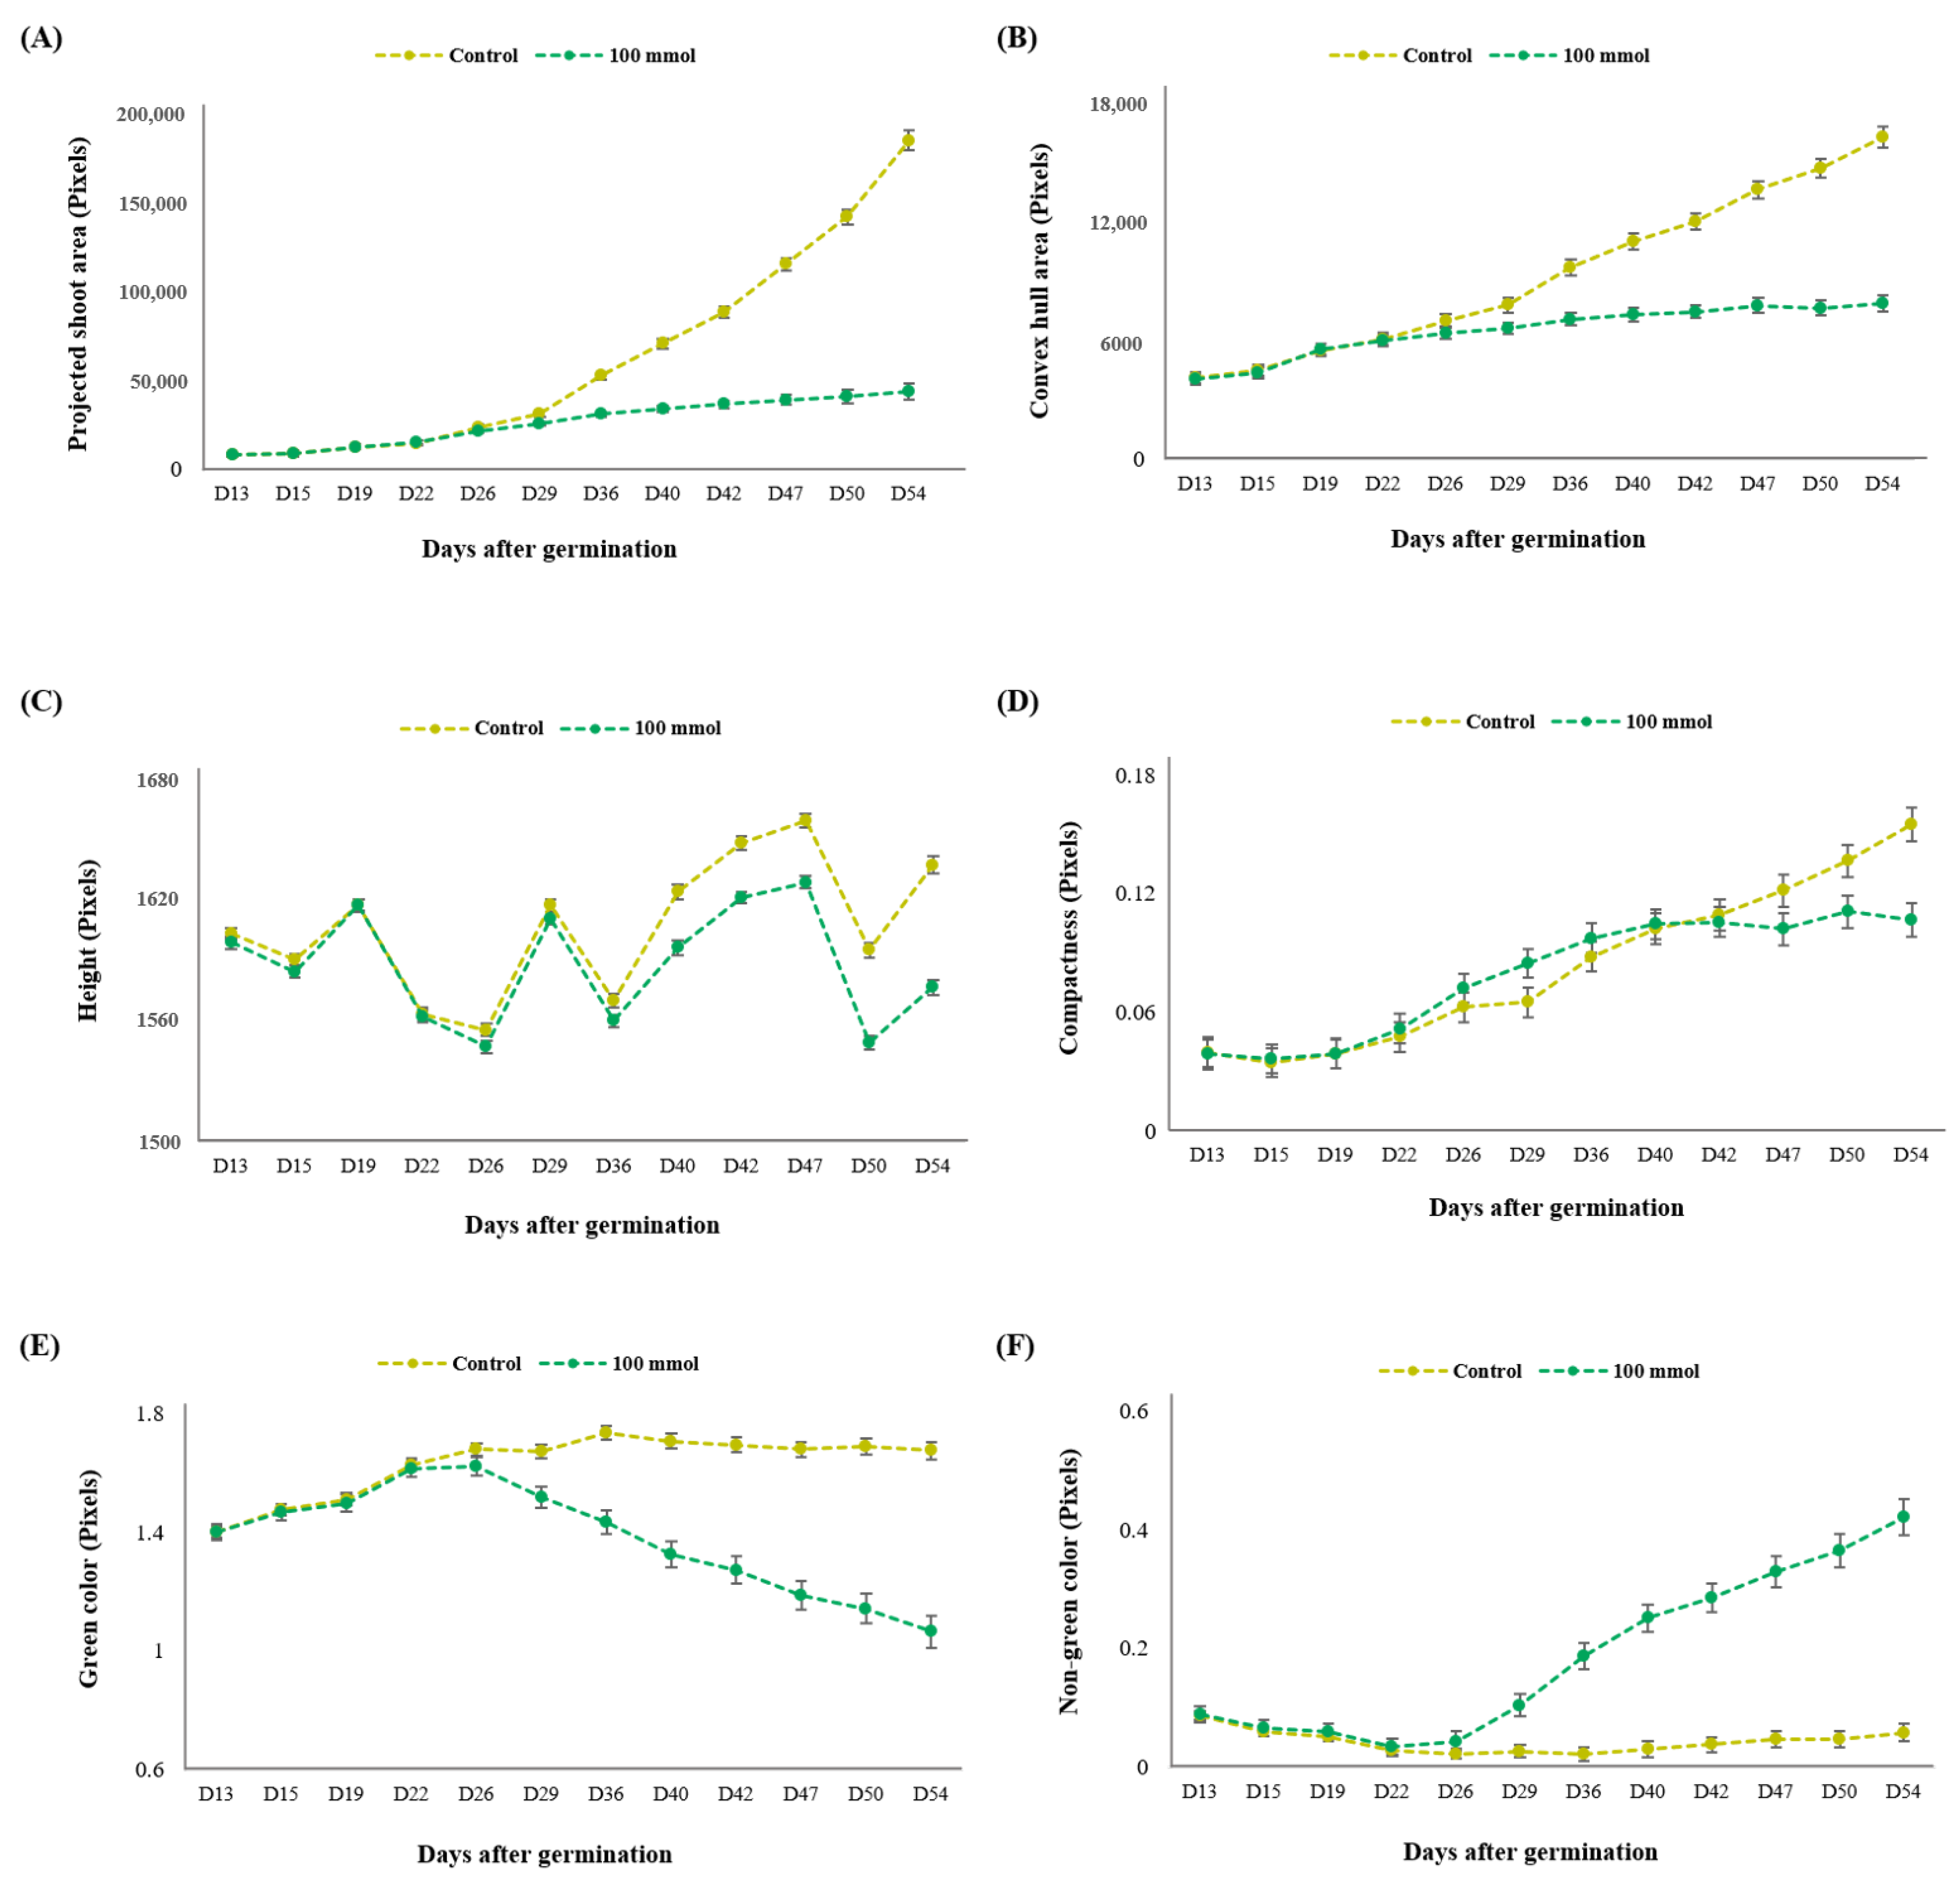
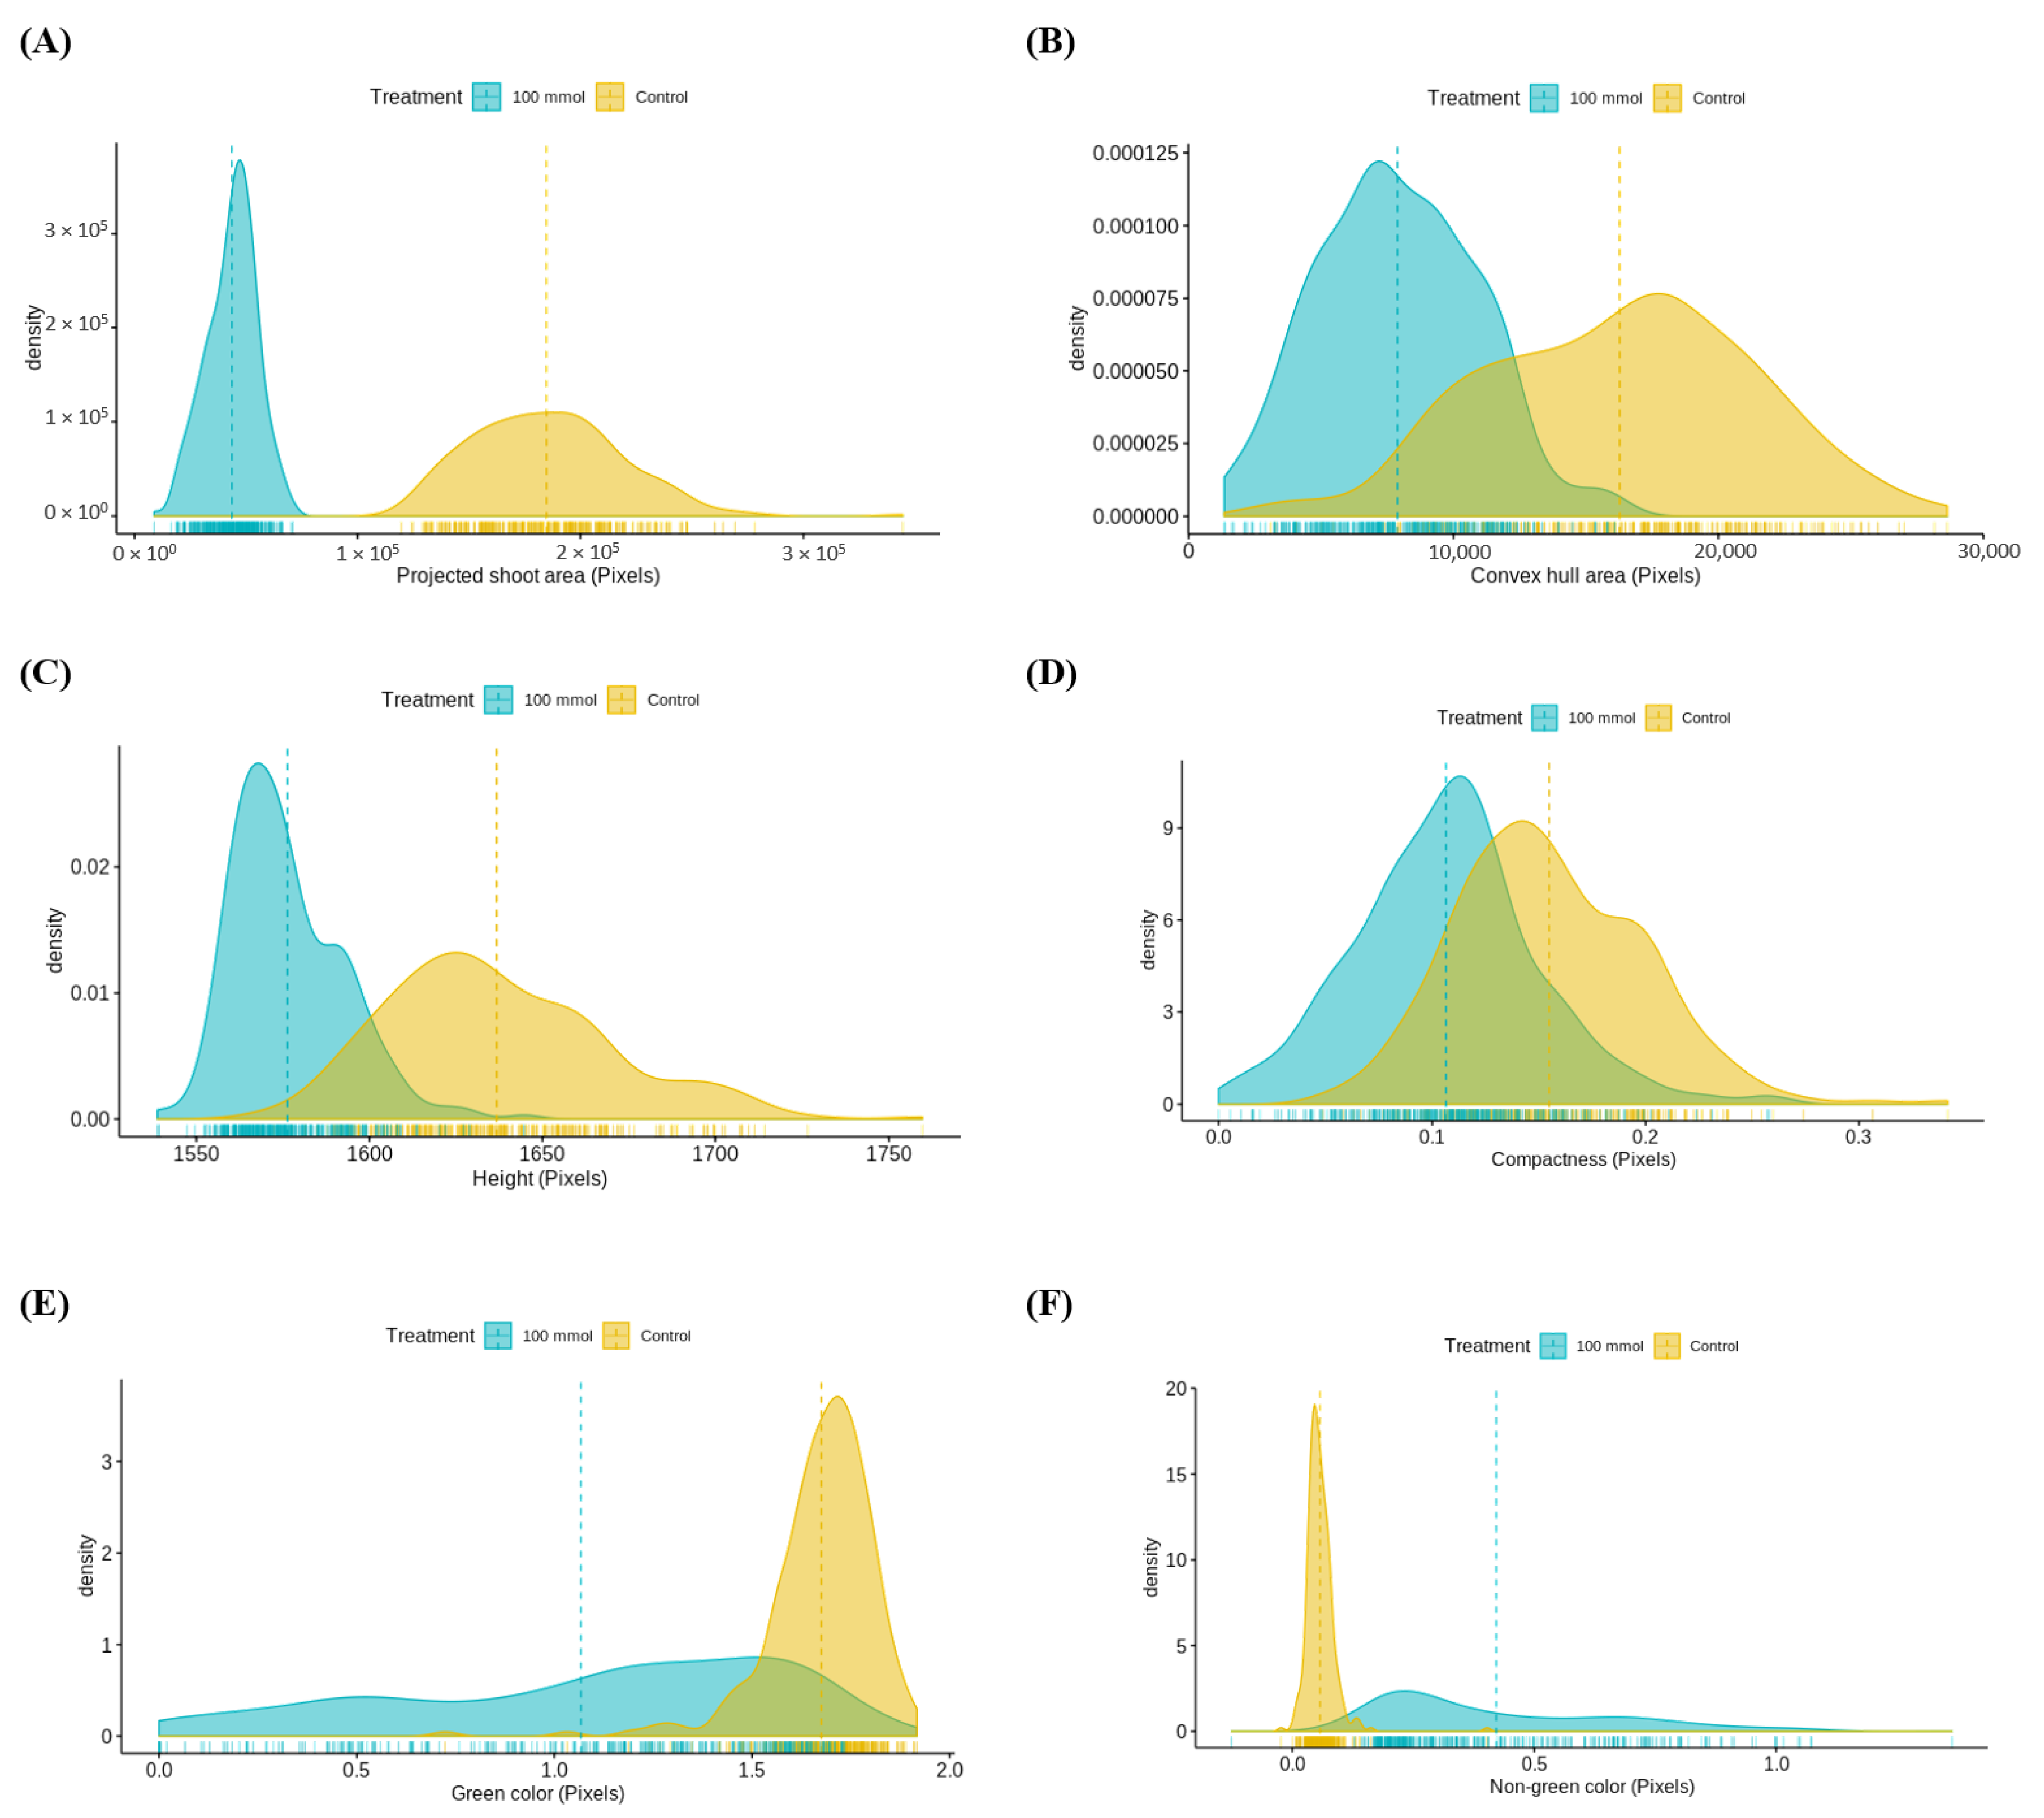
3.3.1. Assessment of Multiple Non-Destructive Measurements for Salt Tolerance in Lentils

In addition to the projected shoot area measured in the pilot study (Experiment 2), additional non-destructive traits such as convex hull area, compactness, height, and the green or non-green color of the lentil accessions were also measured in this experiment to define the most suitable set of non-destructive traits to study salt stress in lentils. The variations in the best linear unbiased estimates for control and salt-treated accessions over time for each of the characteristics are illustrated in Figure 5.
The projected shoot area of control lentil accessions continued to increase for the duration of the experiment. However, it plateaued for the treated lentil accessions after two weeks of exposure to 100 mmol NaCl (Figure 5A). This finding was also consistent with the results from the pilot experiment. A similar pattern was also observed for the convex hull area (Figure 5B). The salt stress effects on height and compactness were inconsistent throughout the experiment (Figure 5C,D). For color parameters, day 29 was not the ideal growth stage for distinguishing salt tolerance in the lentils (Figure 5E,F). Under salt-treated conditions, there was an alteration in the ratio of “green” to “non-green” pigmentations (chlorosis or necrosis). Though there were no differences between the color profiles under control conditions, the area of “green” reduced over time and the area of “non-green” increased overtime under the salt treatment (Figure 5E,F). Figure 6 illustrates the variations of each trait for individual lentil accessions at day 54 under control and salt-treated conditions.

3.3.2. Relationship between Destructive and Non-Destructive Measurements

Similar to the pilot study, the salt tolerance scores and shoot dry mass of the plants were measured at the completion of the experiment. For non-destructive traits, the volume estimation for each trait was derived from the four different methods (VSummmary, VIAP, VLemnaTec and VKeygene). The correlations between these traits and the destructive characteristics were calculated and are summarized in Table 3. The projected shoot area (r = 0.92–0.96) and convex hull area (r = 0.86–0.91) were highly correlated to shoot dry mass (Table 3). In compactness, similar correlation coefficients were found for the VIAP, VLemnaTec, and VKeygene (r = 0.82–0.90), while it was dissimilar for VSummary (r = 0.63). For height, the correlation coefficients ranged from 0.70 to 0.74. Strong correlations were also observed between color parameters and salt tolerance scores (Table 3). For “green,” a negative correlation was observed (Table 3), and for “non-green,” it was positive and ranged from 0.87 to 0.92.

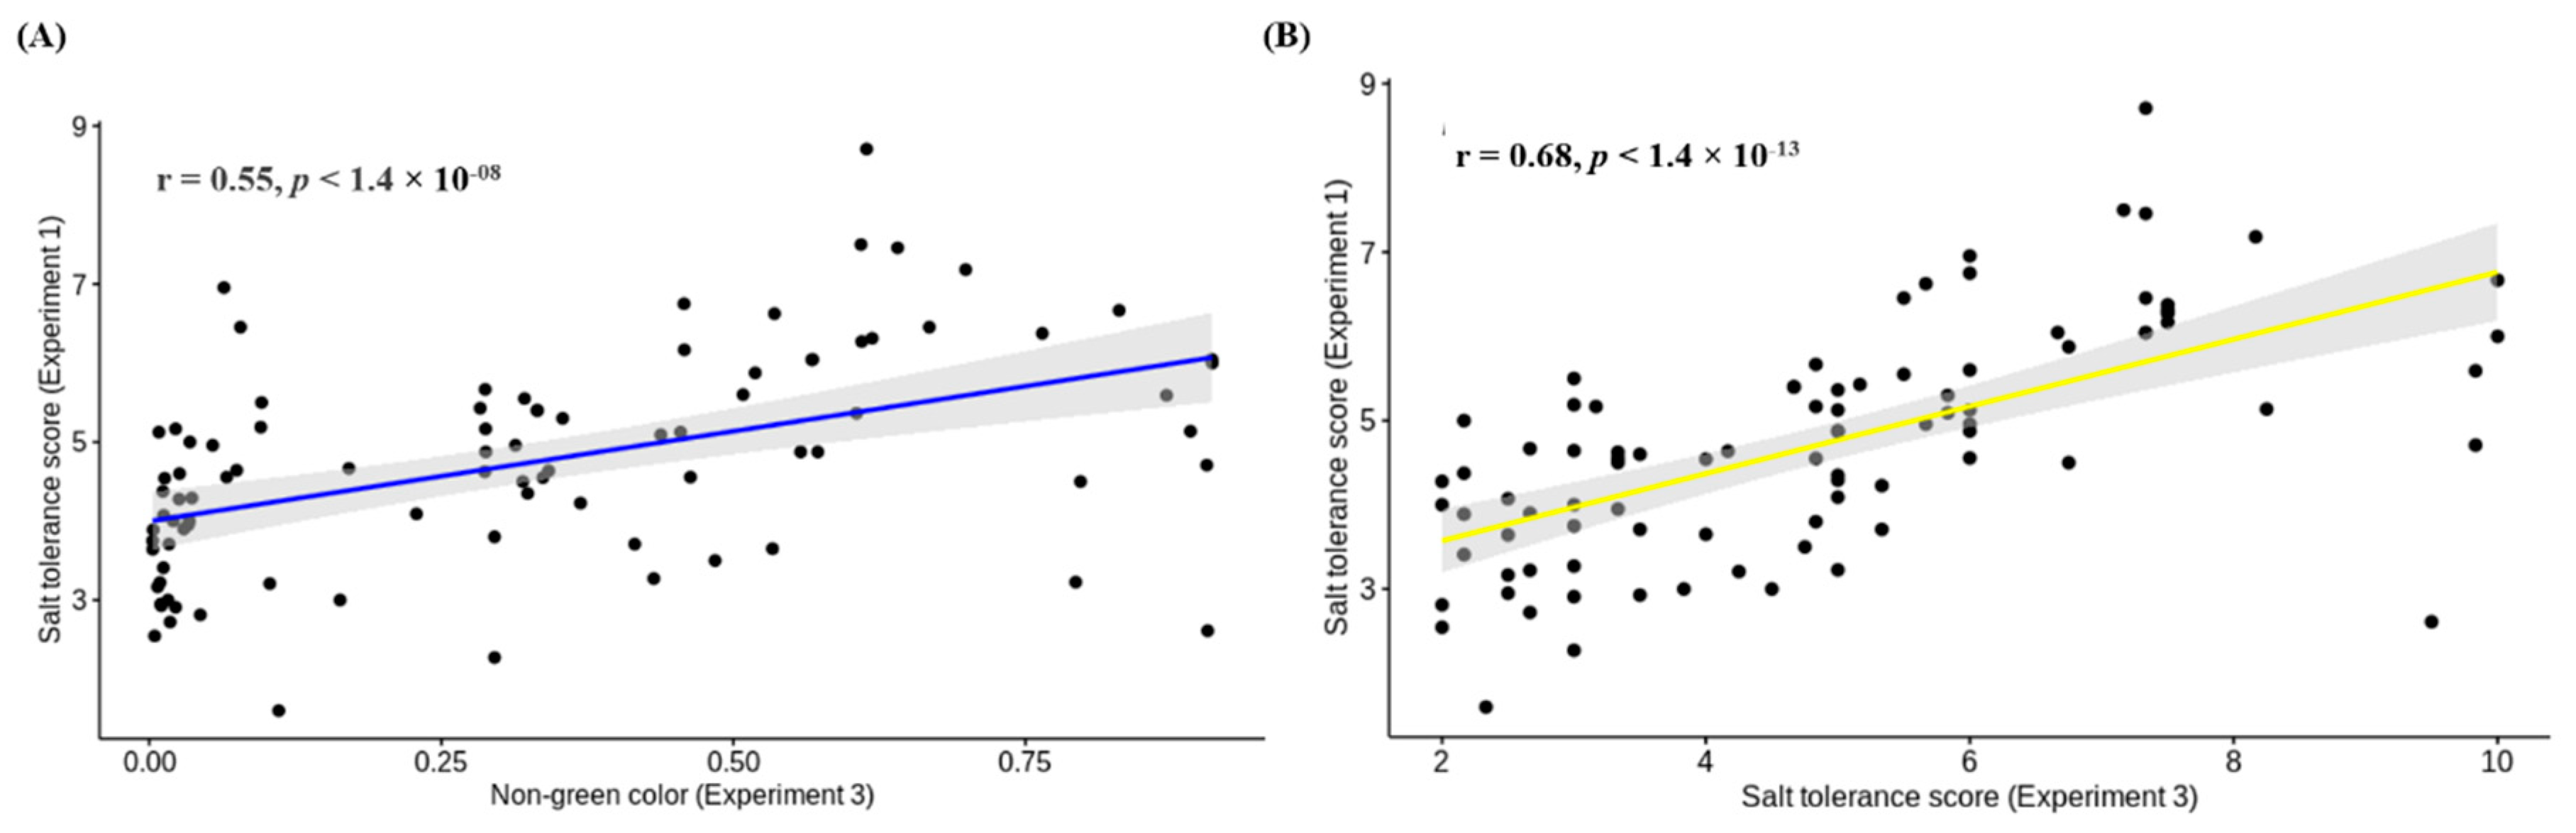
3.4. Comparison of Salt Tolerance Levels between Conventional and HTP Methods for Validation

The salt tolerance scores identified from the traditional screening (Experiment 1) and non-green color pixels collected from image-based assay (Experiment 3) were compared (only using the data from the replicated lentil accessions in Experiment 3), and a moderate correlation (r = 0.55; p < 0.0001) was observed (Figure 7A). These results were further validated by Spearman rank correlation analysis, where a significant correlation was observed between salt tolerance scores collected (manually) from Experiments 1 and 3 (r = 0.68; p < 0.0001) (Figure 7B). Notably, control lines, i.e., ILL2024 (T), PBA Bolt (MT), PBA Hurricane (MT), PBA Ace (I), and PBA Jumbo2 (I), displayed the same classification under both phenotyping methods. However, the classification of CIPAL1522 was T in the traditional phenotyping and MT in the HTP method. Illustrative examples of the range of salt tolerance in lentil accessions are shown in Figure 8 and Figure S2.

4. Discussion

4.1. Comparison of a High-Throughput Phenotyping Protocol to the Conventional Method for Salt Screening in Lentils

This paper describes a novel application of high-throughput phenotyping in a glasshouse-based experiment to quantify salt tolerance in a diverse range of lentil accessions. While there have been numerous studies that have used HTP to assess salt tolerance in other crops [24,25,35], it had not been applied to lentils before. This methodology is important because it will allow for the acceleration of the lentil breeding program by facilitating the faster identification of useful germplasm that can now be screened more rapidly than in traditional approaches.
To date, most lentil breeding programs have used conventional phenotypic screening to evaluate germplasm responses to salt toxicity under controlled or semi-controlled environments. In the current study, we deployed a similar conventional approach to determine genetic variation for salt tolerance in a set of 276 diverse lentil accessions obtained from the PBA lentil breeding program. The response to salt stress was measured using symptom scores, as well as dry mass, and compared to the already established rankings for these accessions within the breeding program. Some inconsistencies were observed in classifying the germplasm in different tolerance groups (T, MT, and I), which may have been due to a range of factors such as the difference in salt treatment applications, user error, growth conditions, etc. [4,42]. Such variabilities have also been observed in other studies related to abiotic and biotic stress assessments [42,43], which confirms that conventional screening methods lack consistency, reproducibility, and robustness, so they are therefore are less reliable [12]. These limitations can be overcome through the development of an image-based high-throughput screening method for salt tolerance in lentils. The development of an image-based assay would reduce the variations and inconsistencies between experiments and improve accuracy and robustness [43]. Similar methods have been developed for other crops such as rice and chickpeas, where authors used RGB imaging to assess response to salt stress by measuring multiple phenotypic traits at once [24,25].

4.2. Development of a High-Throughput Image-Based Method for Salt Toxicity Screening in Lentils

Six known lentil genotypes with variable responses to salt toxicity were selected for the development of an image-based high-throughput screen. In addition to the control-treatment, three additional salt concentrations were used for optimization purposes. The selection of these concentrations was based upon the salt levels identified in Australian agricultural lands. In Australia, soil is categorized into five major groups: non-saline (<2 dS/m; ~20 mmol/L), slightly saline (2–4 dS/m; ~20–40 mmol/L), moderately saline (4–8 dS/m; ~40–80 mmol/L), very saline (8–16 dS/m; ~80–160 mmol/L), and extremely saline (>16 dS/m; ~160 mmol/L) [44]. Thus, in the current study, three salt concentrations were chosen from the slightly saline, moderately saline, and very saline categories. The study identified that either 85 mmol or 127.5 mmol NaCl concentrations could be used to distinguish tolerant accessions from susceptible accessions. Therefore, a salt concentration in between these salt levels (100 mmol) was chosen as the optimal for the high-throughput image-based assay. A further comparison to already published studies indicated that similar salt concentrations have been used in other crops such as chickpeas and rice, where 40 mmol/L (40 mM) and 100 mmol/L (100 mM) salt treatments were applied, respectively [24,25].
In addition to the salt concentration, we also optimized the duration of the experiment to allow for the maximum differentiation of projected shoot area among the diverse set of genotypes. For the projected shoot area, 29 days of post-sowing were identified as the ideal time to differentiate responses to salt toxicity tolerance. Similar observations were made in rice, where day 20 was identified as the optimal number of days to distinguish salt tolerance response (at a 100 mM salt level) [24]. Another study on chickpeas indicated 56 days as the maximum duration of the experiment to evaluate salt toxicity response (at the 40 mM salt level) [25].

4.3. Application of Optimized High-Throughput Phenotyping Protocol

The study demonstrated that a glasshouse-based HTP assay can be reliably used to measure salt tolerance in lentils. The advantage of the HTP method is that a complete range of phenotypic traits can be quantitatively assessed in a shorter time frame than when using traditional methods. Though a range of traits associated with color, as well as height, convex hull, compactness, and projected shoot area, were collected, the area and color parameters were identified as the most informative traits for discriminating salt-tolerant lentil accessions from intolerant accessions. Several other image-based studies have also used these traits for determining salt tolerance in many crops. For instance, Awlia et al. [35] and Hairmansis et al. [24] applied RGB images to measure morphological variations (total shoot area, plant growth, and color parameters) in response to salt stress in Arabidopsis thaliana and rice, respectively. Similarly, Atieno et al. [25] employed an RGB-based phenotyping protocol to measure genetic variation in chickpeas for salt tolerance by measuring phenotypic traits such as projected shoot area and plant growth rate. A 3D image-based phenomics platform allows for the extraction of multiple trait features for salt tolerance without destructive harvest. The non-destructive nature of these methods means that surviving plants could be retained for further evaluation or for use in a breeding program.
The accuracy of the image-based protocol was also validated by calculating the correlations between destructive and non-destructive characteristics measured in the HTP assay. The study demonstrated a significant correlation between projected shoot area and dry mass, as well as convex hull area and dry mass. Therefore, both projected shoot area and convex hull area could be used as proxies for plant biomass. This finding was also in line with recent phenomics studies, where the projected area was used to predict plant biomass [24,29,45]. Leaf color (green or non-green color leaf pixels) derived from RGB images were also strongly correlated with visual symptom scores. This finding was in accordance with observations from Marzougui et al. [29], who observed a strong correlation between visual scores and color/texture features extracted from diseased root sections of Aphanomyces root rot disease. Therefore, the strong correlations observed between the manual and image-based traits collected within HTP experiment confirm the accuracy of image-based phenotyping for salt tolerance in lentils.

4.4. Validation of High-Throughput Phenotyping Protocol for Salt Tolerance in Lentils

Leaf color from high-throughput screening can be used to discriminate between salt-tolerant and susceptible lentil accessions, which also happens to strongly correlate with visual symptom scores. Therefore, leaf color classifications can be used as a substitute for manual symptom scores to validate the image-based phenotyping assay for salt tolerance in lentils. Among the color parameters, the non-green color was chosen for the validation as a direct measurement of the chlorosis or necrosis of plant tissues.
A relatively high correlation was observed (r = 0.55; p < 0.0001) between the visual symptom scores from Experiment 1 to the image-based non-green color measurement from Experiment 3. However, the correlation between manual symptom scores obtained from Experiments 1 and 3 was much higher (r = 0.68; p < 0.0001), which was expected due to the similarity in approaches being used. There were a couple of reasons for the deviations observed in correlations. Salt tolerance scores reflect more than the leaf color, i.e., the non-green color is only one of the components of what a breeder would assess for a salt tolerance score. In addition, the breeder would account for other attributes such as the general appearance of the plants and the shape of leaves, which also influence the score given to a plant. There is also known to be some variation from year to year and screen to screen in the salt tolerance ratings of lentil accessions using the current visual scoring system. This may be because any extraneous factor that causes stress symptoms on plant leaves such as necrosis or chlorosis would be confounded with the effects of salt on the visual assessment and, hence, the tolerance score [42]. Therefore, we can assume that the HTP assay, which runs in a controlled environment, has fewer extraneous stresses that may influence the morphological changes in plants, other than salt stress. Hence, the leaf color parameters measured in the glasshouse-based HTP experiment are especially useful to identify salt-tolerant and susceptible accessions without the need for slower conventional screening trials.

5. Conclusions

In summary, a high-throughput phenotyping protocol to screen lentil accessions for salt tolerance was developed. Projected shoot area and color parameters were identified as the most informative non-destructive traits for salt tolerance in lentils. Accurately measured phenotypic characteristics can be used as selection criteria for future lentil breeding programs. The tolerant lentil accessions identified from the current study could be used in the crossing scheme to develop salt-tolerant cultivars suited to the Australian environment. The integration of these phenotypic data into genotypic data will enable genome-wide association studies to understand the genetic basis of salt tolerance and the salt tolerance mechanism in lentils.

Supplementary Materials

The following are available online at https://www.mdpi.com/2073-4395/10/12/1992/s1, Figure S1: (A) Log10 projected shoot area of individual lentil accessions under four different salt concentrations (control, 42.5, 85, and 127.5 mmol), and (B) Family-wise confidence level on four salt treatment levels (T1: control, T2: 42.5 mmol, T3: 85 mmol, and T4: 127.5 mmol) for identifying best salt concentration in the HTP experiment. Figure S2: Morphological variation in tolerant and intolerant lentil accessions captured from side and top-views under different growth stages: (A) before salt application, (B) one week after salt application, (C) three weeks after salt application, and (D) final harvesting stage. Table S1: Scoring scale used to assess salt tolerance in lentil plants for Experiment 1. Table S2: Post-hoc pairwise comparison for identifying timeline for the imaging process. Table S3: Duncan’s new multiple range test for identifying timeline for imaging process.

Author Contributions

R.D. prepared the plant material, performed Experiment 1, performed Experiment 3, performed data analysis, performed data interpretation, prepared the primary drafts of the manuscript, and contributed to the finalization of the text; H.V.K. performed experimental designing for HTP assays, performed Experiment 2, performed data analysis, and data interpretation; A.M.D. provided scientific and technical advice, assisted with managing Experiments 2 and 3, wrote the analysis algorithms, supplied the raw data for Experiment 2 and Experiment 3, and reviewed the manuscript; G.M.R. and D.M.N. assisted in designing and managing Experiment 1 and provided technical and scientific advice; S.K., N.O.I.C., and K.F.S. conceptualized the project, provided scientific advices and reviewed the manuscript. All authors have read and agreed to the published version of the manuscript.

Funding

This work was supported by funding from Agriculture Victoria (Department of Jobs, Precincts and Regions, State Government of Victoria, Australia) and a Melbourne Research Scholarship from The University of Melbourne, Australia.

Acknowledgments

The authors wish to thank the following staff at Agriculture Victoria (Department of Jobs, Precincts and Regions, State Government of Victoria, Australia) for their assistance: Arun Shanmugam and Eunice Santiago at the Grains Innovation Park (Horsham) for their support in establishing Experiment 1; Katrina Hill at Plant Phenomics Victoria (Bundoora) for technical support in establishing and maintaining Experiments 2 and 3 and Bernard Le, Brittney Caruana, Daniel Rice, Yvonne Ogaji, Gurpreet Suri Kaur and Dhriti Sharma for their help in establishing Experiments 2 and 3. Seeds were supplied by the Australian Grains GeneBank in Horsham, Victoria, Australia.

Conflicts of Interest

The authors declare no conflict of interest.

References

  1. Kokten, K.; Karakoy, T.; Bakoglu, A.; Akcura, M. Determination of salinity tolerance of some lentil (Lens culinaris M.) varieties. J. Food Agric. Environ. 2010, 8, 140–143. [Google Scholar]
  2. Morton, M.J.L.; Awlia, M.; Al-Tamimi, N.; Saade, S.; Pailles, Y.; Negrào, S.; Tester, M. Salt stress under the scalpel—Dissecting the genetics of salt tolerance. Plant J. 2019, 97, 148–163. [Google Scholar] [CrossRef] [Green Version]
  3. Kumawat, K.R.; Gothwal, D.K.; Singh, D. Salinity tolerance of lentil genotypes based on stress tolerance indices. J. Pharmacogn. Phytochem. 2017, 6, 1368–1372. [Google Scholar]
  4. Maher, L.; Armstrong, R.; Connor, D. Salt Tolerant Lentils—A Possibility for the Future? In Solutions for a Better Environment, Proceedings of the 11th Australian Agronomy Conference, Geelong, Victoria, Australia, 2–6 February 2003; Unkovich, M., O’Leary, G., Eds.; The Australian Society of Agronomy Inc.: Geelong, Australia, 2003; Available online: http://www.agronomyaustraliaproceedings.org/images/sampledata/2003/c/17/maher.pdf (accessed on 21 October 2019).
  5. Jayasundara, H.P.S.; Thomson, B.D.; Tang, C. Responses of cool season grain legumes to soil abiotic stresses. Adv. Agron. 1998, 63, 77–151. [Google Scholar]
  6. Nadeem, M.; Li, J.; Yahya, M.; Wang, M.; Ali, A.; Cheng, A.; Wang, X.; Ma, C. Grain legumes and fear of salt stress: Focus on mechanisms and management strategies. IJMS 2019, 20, 799. [Google Scholar] [CrossRef] [PubMed] [Green Version]
  7. Kumar, J.; Pratap, A.; Kumar, S. (Eds.) Plant phenomics: An overview. In Phenomics in Crop Plants: Trends, Options and Limitations; Springer: London, UK, 2015; pp. 1–10. [Google Scholar]
  8. Rousseau, C.; Belin, E.; Bove, E.; Rousseau, D.; Fabre, F.; Berruyer, R.; Guillaumès, J.; Manceau, C.; Jacques, M.; Boureau, T. High throughput quantitative phenotyping of plant resistance using chlorophyll fluorescence image analysis. Plant Methods 2013, 9, 17. [Google Scholar] [CrossRef] [Green Version]
  9. Chen, Z.; Newman, I.; Zhou, M.; Mendham, N.; Zhang, G.; Shabala, S. Screening plants for salt tolerance by measuring K+ flux: A case study for barley. Plant Cell Environ. 2005, 28, 1230–1246. [Google Scholar] [CrossRef]
  10. Greco, M.; Chiappetta, A.; Bruno, L.; Bitonti, M.B. A comparison of hydroponic and soil-based screening methods to identify salt tolerance in the field in barley. J. Exp. Bot. 2012, 63, 3853–3868. [Google Scholar]
  11. Singh, D.; Singh, C.K.; Kumari, S.; Tomar, R.S.S.; Karwa, S.; Singh, R.; Singh, R.B.; Sarkar, S.K.; Pal, M. Discerning morpho-anatomical, physiological and molecular multiformity in cultivated and wild genotypes of lentil with reconciliation to salinity stress. PLoS ONE 2017, 12, e0177465. [Google Scholar] [CrossRef]
  12. Furbank, R.T.; Tester, M. Phenomics-technologies to relieve the phenotyping bottleneck. Trends Plant Sci. 2011, 16, 635–644. [Google Scholar] [CrossRef]
  13. Sun, S.; Li, C.; Paterson, A.H.; Jiang, Y.; Xu, R.; Robertson, J.S.; Snider, J.L.; Chee, P.W. In-field high throughput phenotyping and cotton plant growth analysis using LiDAR. Front. Plant Sci. 2018, 9, 16. [Google Scholar] [CrossRef] [PubMed] [Green Version]
  14. Wang, J.; Badenhorst, P.; Phelan, A.; Pembleton, L.; Shi, F.; Cogan, N.; Spangenberg, G.; Smith, K. Using sensors and unmanned aircraft systems for high-throughput phenotyping of biomass in perennial ryegrass breeding trials. Front. Plant Sci. 2019, 10, 1381. [Google Scholar] [CrossRef] [PubMed]
  15. Gebremedhin, A.; Badenhorst, P.; Wang, J.; Giri, K.; Spangenberg, G.; Smith, K. Development and validation of a model to combine NDVI and plant height for high-throughput phenotyping of herbage yield in a perennial ryegrass breeding program. Remote Sens. 2019, 11, 2494. [Google Scholar] [CrossRef] [Green Version]
  16. Ghamkhar, K.; Irie, K.; Hagedorn, M.; Hsiao, J.; Fourie, J.; Gebbie, S.; Hoyos-Villegas, V.; George, R.; Stewart, A.; Inch, C.; et al. Real-time, non-destructive and in-field foliage yield and growth rate measurement in perennial ryegrass (Lolium perenne L.). Plant Methods 2019, 15, 72. [Google Scholar] [CrossRef] [PubMed]
  17. Wang, J.; Dimech, A.M.; Spangenberg, G.; Smith, K.; Badenhorst, P. Rapid screening of nitrogen use efficiency in perennial ryegrass (Lolium perenne L.) using automated image-based phenotyping. Front. Plant Sci. 2020, 11, 565361. [Google Scholar] [CrossRef]
  18. Qiu, Q.; Sun, N.; Bai, H.; Wang, N.; Fan, Z.; Wang, Y.; Meng, Z.; Li, B.; Cong, Y. Field-based high-throughput phenotyping for maize plant using 3D LiDAR point cloud generated with a “Phenomobile”. Front. Plant Sci. 2019, 10, 554. [Google Scholar] [CrossRef] [Green Version]
  19. Zhang, X.; Huang, C.; Wu, D.; Qiao, F.; Li, W.; Duan, L.; Wang, K.; Xiao, Y.; Chen, G.; Liu, Q.; et al. High-throughput phenotyping and QTL mapping reveals the genetic architecture of maize plant growth. Plant Physiol. 2017, 173, 1554–1564. [Google Scholar] [CrossRef] [Green Version]
  20. Hu, Y.; Knapp, S.; Schmidhalter, U. Advancing high-throughput phenotyping of wheat in early selection cycles. Remote Sens. 2020, 12, 574. [Google Scholar] [CrossRef] [Green Version]
  21. Singh, D.; Wang, X.; Kumar, U.; Gao, L.; Noor, M.; Imtiaz, M.; Singh, R.P.; Poland, J. High-throughput phenotyping enabled genetic dissection of crop lodging in wheat. Front. Plant Sci. 2019, 10, 394. [Google Scholar] [CrossRef] [Green Version]
  22. Nguyen, G.N.; Maharjan, P.; Maphosa, L.; Vakani, J.; Thoday-Kennedy, E.; Kant, S. A robust automated image-based phenotyping method for rapid vegetative screening of wheat germplasm for nitrogen use efficiency. Front Plant Sci. 2019, 10, 1372. [Google Scholar] [CrossRef] [Green Version]
  23. Wang, H.; Shabala, L.; Zhou, M.; Shabala, S. Developing a high-throughput phenotyping method for oxidative stress tolerance in barley roots. Plant Methods 2019, 15, 12. [Google Scholar] [CrossRef] [PubMed] [Green Version]
  24. Hairmansis, A.; Berger, B.; Tester, M.; Roy, S.J. Image-based phenotyping for non-destructive screening of different salinity tolerance traits in rice. Rice 2014, 7, 16. [Google Scholar] [CrossRef] [PubMed] [Green Version]
  25. Atieno, J.; Li, Y.; Langridge, P.; Dowling, K.; Brien, C.; Berger, B. Exploring genetic variation for salinity tolerance in chickpea using image-based phenotyping. Sci. Rep. 2017, 7, 1300. [Google Scholar] [CrossRef] [PubMed] [Green Version]
  26. Zhanga, C.; Chenb, W.; Sankarana, S. High-throughput field phenotyping of Ascochyta blight disease severity in chickpea. Crop Prot. 2019, 125, 104885. [Google Scholar] [CrossRef]
  27. Humplík, J.F.; Lazár, D.; Fürst, T.; Husičková, A.; Hýbl, M.; Spíchal, L. Automated integrative high-throughput phenotyping of plant shoots: A case study of the cold-tolerance of pea (Pisum sativum L.). Plant Methods 2015, 11, 20. [Google Scholar] [CrossRef] [PubMed] [Green Version]
  28. Marzougui, A.; Ma, Y.; Zhang, C.; McGee, R.J.; Coyne, C.J.; Main, D.; Sankaran, S. Advanced imaging for quantitative evaluation of aphanomyces root rot resistance in lentil. Front. Plant Sci. 2019, 10, 383. [Google Scholar] [CrossRef] [PubMed] [Green Version]
  29. Ahmed, I.; Eramian, M.; Ovsyannikov, I.; van der Kamp, W.; Nielsen, K.; Duddu, H.S.; Rumali, A.; Shirtliffe, S.; Bett, K. Automatic Detection and Segmentation of Lentil Crop Breeding Plots from Multi-spectral Images Captured by UAV-mounted Camera. In Proceedings of the IEEE Winter Conference on Applications of Computer Vision (WACV), Waikoloa Village, HI, USA, 7–11 January 2019; pp. 1673–1681. [Google Scholar] [CrossRef]
  30. Marko, D.; Briglia, N.; Summerer, S.; Petrozza, A.; Cellini, F.; Iannacone, R. High-throughput phenotyping in plant stress response: Methods and potential applications to polyamine field. In Polyamines: Methods and Protocols, Methods in Molecular Biology; Alcàzar, R., Tiburcio, A.F., Eds.; Humana Press: New York, NY, USA, 2018. [Google Scholar] [CrossRef]
  31. Zhang, Y.; Zhang, N. Imaging technologies for plant high-throughput phenotyping: A review. Front. Agric. Sci. Eng. 2018, 5, 406–419. [Google Scholar] [CrossRef] [Green Version]
  32. Pratap, A.; Gupta, S.; Nair, R.M.; Gupta, S.K.; Schafleitner, R.; Basu, P.S.; Singh, C.M.; Prajapati, U.; Gupta, A.K.; Nayyar, H.; et al. Using plant phenomics to exploit the gains of genomics. Agronomy 2019, 9, 126. [Google Scholar] [CrossRef] [Green Version]
  33. Yol, E.; Toker, C.; Uzun, B. Traits for phenotyping. In Phenomics in Crop Plants: Trends, Options and Limitations; Kumar, J., Pratap, A., Kumar, S., Eds.; Springer: London, UK, 2015; pp. 11–26. [Google Scholar]
  34. Berger, B.; de Regt, B.; Tester, M. High-throughput phenotyping of plant shoots. In High-Throughput Phenotyping in Plants. Methods in Molecular Biology; Normanly, J., Ed.; Humana Press: New York, NY, USA, 2012; pp. 9–20. [Google Scholar]
  35. Awlia, M.; Nigro, A.; Fajkus, J.; Schmoeckel, S.M.; Negrão, S.; Santelia, D.; Trtílek, M.; Tester, M.; Julkowska, M.M.; Panzarová, K. High-throughput non-destructive phenotyping of traits that contribute to salinity tolerance in Arabidopsis thaliana. Front. Plant Sci. 2016, 7, 1414. [Google Scholar] [CrossRef] [Green Version]
  36. Al-Tamimi, N.; Brien, C.; Oakey, H.; Berger, B.; Saade, S.; Ho, Y.S.; Schmockel, S.M.; Tester, M.; Negrao, S. Salinity tolerance loci revealed in rice using high-throughput non-invasive phenotyping. Nat. Commun. 2016, 7, 13342. [Google Scholar] [CrossRef] [Green Version]
  37. GRDC. Available online: https://grdc.com.au/research/projects/project?id=4297 (accessed on 29 October 2020).
  38. Gilmour, A.R.; Gogel, B.J.; Cullis, B.R.; Welham, S.J.; Thompson, R. ASReml User Guide Release 4.1 Functional Specification; VSN International Ltd.: Hemel Hempstead, UK, 2015; pp. 1–329. Available online: www.vsni.co.uk (accessed on 9 August 2018).
  39. R Core Team. R: A Language and Environment for Statistical Computing; R Foundation for Statistical Computing: Vienna, Austria, 2018; Available online: https://www.R-project.org/ (accessed on 13 July 2019).
  40. Kassambara, A. ggpubr. 2020. Available online: https://rdrr.io/cran/ggpubr/ (accessed on 10 September 2020).
  41. Klukas, C.; Chen, D.; Pape, J.M. Integrated Analysis Platform: An open-source information system for high-throughput plant phenotyping. Plant Physiol. 2014, 165, 506. [Google Scholar] [CrossRef] [PubMed] [Green Version]
  42. Pulse Australia. Available online: http://www.pulseaus.com.au/growing-pulses/bmp/lentil (accessed on 11 November 2018).
  43. Spies, B.; Woodgate, P. Salinity and Hydrogeology. In Salinity Mapping Methods in the Australian Context; Department of the Environment and Heritage and Agriculture, Fisheries and Forestry: Canberra, Australia, 2005; p. 17. [Google Scholar]
  44. Mutka, A.M.; Bart, R.S. Image-based phenotyping of plant disease symptoms. Front. Plant Sci. 2014, 5, 734. [Google Scholar] [CrossRef] [PubMed] [Green Version]
  45. Chen, D.; Shi, R.; Pape, J.M.; Neumann, K.; Arend, D.; Graner, A.; Chen, M.; Klukas, C. Predicting plant biomass accumulation from image-derived parameters. GigaScience 2018, 7, 1–13. [Google Scholar] [CrossRef] [PubMed] [Green Version]
Figure 1. Experimental set up for (A) a conventional phenotyping experiment (Experiment 1) performed at Grains Innovation Park, Horsham, Australia, and (B) a high-throughput phenotyping experiment (Experiment 3) performed at “Plant Phenomics Victoria,” Bundoora, Victoria, Australia.
Agronomy 10 01992 g001
Figure 2. Green and non-green color variation in tolerant to intolerant lentil accessions (left to right) imaged at two weeks after salt application: (A) raw images of lentil accessions, and (B) processed images of lentil accessions.
Agronomy 10 01992 g002
Figure 3. Distribution graphs of salt tolerance traits using a conventional phenotyping method (Experiment 1): (A) salt tolerance score, where 1 is tolerant and 10 is intolerant, (B) shoot dry mass (g), (C) correlation plot between salt tolerance score and shoot dry mass, and (D) Spearman rank correlation plot for the scores obtained from the current study (Experiment 1) and scores captured from historical breeding program trials.
Agronomy 10 01992 g003
Figure 4. (A) Coefficient of variation (CV) of projected shoot area overtime where the red line indicates the day of salt treatment commenced, (B) relationship between projected shoot area and fresh weight (g), and (C) relationship between projected shoot area and dry weight (g).
Agronomy 10 01992 g004
Figure 5. The variation in non-destructive phenotypic traits over time: (A) projected shoot area, (B) convex hull area, (C) height, (D) compactness, (E) green color, and (F) non-green color.
Agronomy 10 01992 g005
Figure 6. Distribution curves of non-destructive phenotypic traits of individual lentil accessions: (A) projected shoot area, (B) convex hull area, (C) height, (D) compactness, (E) green color, and (F) non-green color.
Agronomy 10 01992 g006
Figure 7. Correlation analysis between Experiments 1 and 3: (A) correlation between salt tolerance scores (where 1 is tolerant and 10 is intolerant) from Experiment 1 and non-green color measurements from Experiment 3, and (B) Spearman rank correlation between salt tolerance scores from Experiments 1 and 3.
Agronomy 10 01992 g007
Figure 8. Snapshot red–green–blue (RGB) images of lentil accessions captured on the LemnaTec Scanalyzer 3D phenomics platform at two weeks after salt application. The images illustrate morphological variations in tolerant to intolerant lentil accessions (left to right): (A) side view, (B) side view where region-of-interest highlighted red with convex hull area marked in blue, (C) top-view, and (D) top-view where region-of-interest is highlighted in red.
Agronomy 10 01992 g008
Table 1. The effect of salt treatment levels on six genotypes based on a one-way ANOVA.
Salt Treatment (mmol)DfSum of SquaresMean SquaresF-Valuep-Value
0.0 (Control)53.88 × 10227.76 × 10211.8520.10
42.559.66 × 10211.93 × 10210.8110.54
85.051.25 × 10222.51 × 10212.9740.05 *
127.554.96 × 10219.91 × 10205.9130.001 ***
The asterisks are the statistically significant levels (* p < 0.05 and *** p < 0.001).
Table 2. Two-way ANOVA table on the effects of genotype and salt treatment level on projected shoot area.
Projected Shoot Area VariationDfSum of SquaresMean SquaresF-Valuep-Value
T2 vs. T1Genotype55.21 × 10221.04 × 10222.3140.06
Treatment13.44 × 10223.44 × 10227.6390.01 **
Genotype:Treatment53.31 × 10226.61 × 10211.4680.22
T3 vs. T1Genotype58.10 × 10221.62 × 10224.6890.01 **
Treatment12.02 × 10232.02 × 102358.610.001 ***
Genotype:Treatment51.82 × 10223.64 × 10211.0540.40
T4 vs. T1Genotype52.87 × 10225.73 × 10212.3520.06
Treatment14.09 × 10234.09 × 1023167.7320.001 ***
Genotype:Treatment55.42 × 10221.08 × 10224.4460.01 **
T1: 0.0 mmol (Control); T2: 42.5 mmol; T3: 85 mmol; T4: 127.5 mmol. The asterisks are the statistically significant levels (** p < 0.01 and *** p < 0.001).
Table 3. Validation of the high-throughput phenotyping (HTP) workflow by taking the correlations between manually measured traits and automatically processed phenotypic traits calculated from the four different digital volume formulae at day 54 of the HTP experiment. Significance (p < 0.0001) is indicated in bold.
Dry MassSalt Tolerance Scores
VSummaryVIAPVLemnaTecVKeygeneVSummaryVIAPVLemnaTecVKeygene
Projected shoot area0.920.950.950.96−0.24−0.32−0.32−0.43
Convex hull area0.860.910.910.90−0.20−0.44−0.44−0.45
Compactness0.630.900.900.82−0.04−0.32−0.33−0.35
Height0.740.710.720.70−0.39−0.54−0.58−0.54
Green color0.480.450.450.44−0.90−0.91−0.91−0.92
Non-green color−0.40−0.41−0.41−0.540.920.920.920.87
Publisher’s Note: MDPI stays neutral with regard to jurisdictional claims in published maps and institutional affiliations.

