Abstract
To investigate the relationship between structures and adsorption properties, four different morphologies of chitosan, with hydrogel (CSH), aerogel (CSA), powder (CSP), and electrospinning nanofiber (CSEN) characteristics, were employed as adsorbents for the removal of Acid Red 27. The structures and morphologies of the four chitosan adsorbents were characterized with SEM, XRD, ATR-FTIR, and BET methods. The adsorption behaviors and mechanisms of the four chitosan adsorbents were comparatively studied. All adsorption behaviors exhibited a good fit with the pseudo-second-order kinetic model (R2 > 0.99) and Langmuir isotherm model (R2 > 0.99). Comparing the adsorption rates and the maximum adsorption capacities, the order was CSH > CSA > CSP > CSEN. The maximum adsorption capacities of CSH, CSA, CSP, and CSEN were 2732.2 (4.523), 676.7 (1.119), 534.8 (0.885), and 215.5 (0.357) mg/g (mmol/g) at 20 °C, respectively. The crystallinities of CSH, CSA, CSP, and CSEN were calculated as 0.41%, 6.97%, 8.76%, and 39.77%, respectively. The crystallinity of the four chitosan adsorbents was the main factor impacting the adsorption rates and adsorption capacities, compared with the specific surface area. With the decrease in crystallinity, the adsorption rates and capacities of the four chitosan adsorbents increased gradually under the same experimental conditions. CSH with a low crystallinity and large specific surface area resulted in the highest adsorption rate and capacity.
1. Introduction
Synthetic dyes are widely employed in the textile industry, and a significant number of them have carcinogenicity and mutagenicity [1]. The dye molecules in textile wastewater are stable for oxidants and microorganisms that pose challenges to elimination [2]. Consequently, various techniques have been developed to treat wastewater contaminated with dyes, including adsorption [3], membrane filtration [4,5], electrochemical treatment [6], advanced oxidation processes [7], enhanced biotechnology methods [8], and so on. Among them, adsorption has been a subject of extensive studies, due to its operational convenience and high efficiency, with a central focus on achieving high adsorption rates and capacities [9].
Chitosan is widely acknowledged as an eco-friendly and efficient adsorbent for dyeing wastewater. Different morphologies and structures of adsorbents based on chitosan were developed for dye removal, such as powder, bead, film, hydrogel, aerogel, nanofibrous membrane adsorbents, and so on. The chitosan powder with a deacetylation degree of 53% achieved maximum adsorption capacities of 645.1 (0.945), 922.9 (2.040), 973.33 (2.778), 693.2 (1.147), and 728.2 (1.309) mg/g (mmol/g) for Acid Green 25, Acid Orange 10, Acid Orange 12, Acid Red 18, and Acid Red 73, respectively [10]. Dotto et al. reported a chitosan film that exhibited a maximum adsorption capacity of 194.6 mg/g (0.322 mmol/g) for Acid Red 18 [11]. Rêgo et al. prepared a chitosan film using chitosan powder with an 85 ± 1% deacetylation degree, which provided maximum adsorption capacities of 413.8 mg/g (0.774 mmol/g) for Tartrazine and 278.3 mg/g (0.460 mmol/g) for Amaranth [12]. The chitosan nanofibrous membrane obtained a maximum adsorption capacity of 1338 mg/g (1.963 mmol/g) for Acid Blue 113 and an adsorption rate constant (κ) of 9.25 × 10⁻⁵ g/mg/h [13]. Chitosan hydrogel beads were crafted for removing Congo Red, attaining a maximum adsorption capacity of 223.25 mg/g (0.320 mmol/g) and an adsorption rate constant (κ) of 5.16 × 10⁻⁵ g/mg/min [14]. A chitosan aerogel was employed as an adsorbent for Direct Yellow 27 removal, demonstrating a rate constant (κ) of 4.35 × 10⁻⁵ g/mmol/min and a maximum adsorption capacity of 495 mg/g (0.747 mmol/g) [15]. Through the above results, it is found that the maximum adsorption capacities of chitosan with different morphologies and structures are not the same, although those are converted to the number of moles. The adsorption rates and capacities vary under different experimental conditions, making it difficult to determine the most effective morphology and structure of chitosan adsorbents for dye removal.
The adsorption rate may be limited by many factors, such as the size of the adsorbate molecule, the concentration and affinity of the adsorbate to the adsorbent, and the diffusion coefficient of the adsorbate in the bulk phase [16]. In addition, the morphology and structure of the adsorbent should also be considered in relation to the adsorption rate and capacity. Therefore, it is essential to use the same dye and experimental conditions to study how chitosan with different morphologies and structures impacts adsorption rates and capacities. This is of great significance for the design and application of adsorbents.
In this work, four kinds of chitosan adsorbents with different morphologies were prepared: hydrogel (CSH), aerogel (CSA), powder (CSP), and electrospinning nanofiber (CSEN). CSH, CSA, CSP, and CSEN were characterized using scanning electron microscopy (SEM), X-ray diffraction (XRD), attenuated total reflection Fourier transform infrared spectroscopy (ATR-FTIR), and the Brunauer–Emmett–Teller (BET) method. Under the same experimental conditions, their adsorption behaviors towards Acid Red 27 were analyzed using adsorption kinetics and equilibriums. The relationships between the structures and adsorption properties of the four chitosan adsorbents were discussed to further explore the adsorption mechanisms.
2. Materials and Methods
2.1. Materials
Chitosan powder (CS, Mw = 1,000,000, 70% deacetylation degree), acetic acid (HAc, AR, 99.5%), sodium hydroxide (NaOH, AR, 97%), 1,1,1,3,3,3-Hexafluoro-2-propanol (HFIP, AR, 99.5%), and Acid Red 27 (AR 27, Mw = 604.5, BS, 85%) were purchased from Shanghai Maclin Co., LTD. The chemical structures of chitosan and AR 27 are shown in Figure 1. The deionized water was used without a special statement.
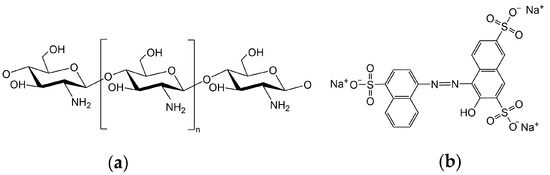
Figure 1.
Chemical structures of (a) chitosan and (b) Acid Red 27 (AR 27).
2.2. Preparation of CSP
The purchased chitosan powder was dispersed, and then the pH value of the dispersed solution was adjusted to 5.4 with 0.1% H2SO4. The sample was washed with deionized water until an approximately neutral pH value was reached. Finally, the sample was dried under vacuum at 60 °C to a constant weight and stored in a desiccator for further use as CSP.
2.3. Preparation of CSH
Chitosan hydrogel was prepared by the previously described method [17]. A certain amount of chitosan was dissolved in 1% HAc to prepare 1% chitosan solution. A 10% NaOH solution was dropped into 1% chitosan solution to precipitate chitosan. The precipitate was acidified and washed by the same method that was used for CSP. Finally, the precipitate was centrifuged to remove excess water, and sealed in a centrifugal tube for further use as CSH. A total of 1.120 g of CSH contained 0.020 g dry chitosan (water regain is 0.982 g/g).
2.4. Preparation of CSA
CSA was prepared as described by Su et al. [18]. A 1% chitosan solution was frozen and subjected to lyophilization at −70 °C, 1.0 kPa for 36 h. The freeze-dried sample was treated with 1.0% NaOH to neutralize HAc. The freeze-dried sample was acidified and washed according to the method used for CSP. Finally, the sample was dried in vacuum at 60 °C to a constant weight, and stored in a desiccator for further use as CSA.
2.5. Preparation of CSEN
A total of 1.0 g of CSH (except for acidification) was dissolved in 35 g of HFIP for 24 h as chitosan electrospinning solution. The spinning voltage, solution feeding rate, needle to collector distance, and temperature were 18.0 kV, 2.0 mL/h, 10.0 cm, and room temperature, respectively. CSEN was acidified and washed by the same method that was used for CSP. Finally, the nanofiber was dried in vacuum at 60 °C to a constant weight to remove residual solvent and placed in a desiccator to further serve as CSEN.
2.6. Characterization
The scanning electron microscopy (SEM, Merlin Compact, Germany Carl Zeiss) method was used to describe the morphologies of CSA, CSP, and CSEN. X-ray diffraction (XRD, D8 ADVANCE, Germany Bruker) analyses of CSH, CSA, CSP, and CSEN were performed to analyze the crystalline structures. The scanning rate was set at 2°/min with an operating voltage of 40 kV and a current of 40 mA. The chemical compositions of the four chitosan adsorbents were analyzed using the attenuated total reflection unit on the Thermo Scientific Nicolet iS50 infrared spectrometer (USA, ATR-FTIR). The specific surface areas of CSH, CSA, CSP, and CSEN were estimated using the Brunauer–Emmett–Teller (BET) analysis (Quantachrome, Autosorb-IQ, USA). The absorbance was measured using a visible-light spectrophotometer (UNICO, 2100, Shanghai, China). Before SEM, BET, and ATR-FTIR testing, CSH was subjected to elution with anhydrous ethanol and then dried using supercritical CO2 drying to avoid the disturbance of residual water, while the other three chitosan adsorbents were tested directly.
2.7. Adsorption Kinetics
A 500 mg/L AR 27 solution was prepared by diluting 2.0 g/L AR 27 stock solution. A total of 1.120 g CSH (0.020 g dry chitosan), 0.020 g CSA, 0.020 g CSP, and 0.020 g CSEN, respectively, were added into 100 mL of 500 mg/L AR 27 solution. The adsorption experiments were conducted in a shaker at 20 °C with a speed of 150 rpm. The absorbance was determined by taking samples at regular intervals using the spectrophotometer. Each batch adsorption experiment was conducted three times.
The standard working curve of AR 27 was determined as follows. Solutions of AR 27 with initial concentrations of 5, 10, 20, 30, 40, 50, 60, 70, and 80 mg/L were prepared. The absorbances of obtained solutions were measured at the maximum absorption wavelength (λmax = 520 nm). The resulting data were plotted with absorbances as the horizontal coordinate and concentrations as the vertical coordinate. Then, linear fitting was performed, and the fitted equation obtained was the standard working curve of AR 27.
The standard working curve of AR 27 is as follows:
where C (mg/L) is the concentration of AR 27 solution and A is the absorbance at the wavelength of 520 nm. The linear correlation coefficient R2 is 0.9994. The errors of intercept and slope are ±0.3830 and ±0.2564, respectively.
The adsorption capacities of the adsorbent at different times were calculated using the following equation:
where Qt (mg/g) is the adsorption capacity at time t (min); C0 and Ct (mg/L) are the dye concentrations at the beginning of the experiment and at time t (min), respectively; V (L) is the volume of solution; and m (g) is the mass of adsorbent.
The adsorption kinetics analysis was based on the pseudo-first-order (PFO) and pseudo-second-order (PSO) kinetic models.
The linear PFO kinetic model can be described by the following equation [19]:
Equation (3) can be derived using the following formula:
The linear PSO kinetic model can be described by the following equation [20]:
Equation (5) may be expressed in the following form:
where Qe and Qt (mg/g) are the adsorption capacities of adsorbent at equilibrium and time t (min), respectively; κ1 and κ2 represent the PFO and PSO rate constants, respectively.
2.8. Adsorption Isotherm
The experimental AR 27 solutions were prepared by diluting 2.0 g/L stock solution to obtain various concentrations of 10, 20, 30, 40, 50, 100, 200, 300, 500, 750, 1000, and 2000 mg/L. A total of 1.120 g CSH, 0.020 g CSA, 0.020 g CSP, and 0.020 g CSEN were added to 100 mL of AR 27 solutions with different initial concentrations. The adsorption experiments were conducted in a shaker with a speed of 150 rpm at 20 °C, 40 °C, and 60 °C, respectively. Adsorption isotherm analyses were based on the Langmuir and Freundlich models. Each batch adsorption experiment was conducted three times.
The Langmuir isotherm model is expressed as follows [21]:
Equation (7) can be represented by the following equation [20]:
where Qe (mg/g) is the equilibrium adsorption capacity; Ce (mg/L) is the equilibrium concentration; and b is the Langmuir constant. Qmax (mg/g) is the maximum adsorption capacity.
The Freundlich isotherm model is expressed as follows [20]:
Equation (9) can be transformed to the following equation [20]:
where Kf is the adsorption capacity and 1/n is the strength of adsorption capacity.
3. Results
3.1. Morphology Analysis
The surface appearances of CSH, CSA, CSP, and CSEN are shown in Figure 2. CSH appeared to be swollen and flocculent in the AR 27 solution during the adsorption tests, which can be seen from the digital image and microscope photograph in Figure 2a,b. As shown in Figure 2c, the supercritical CO2-dried CSH exhibit aggregated fine particles. The sizes of the fine particles are much smaller than CSP. However, in practice, the flocculence of CSH should be significantly smaller than these fine particles. As shown in Figure 2d, CSA possessed a high porosity, smooth surface, and macroscopic 3D network structure, which may be due to the irregular growth of ice crystals and sublimation during the freeze-drying process [22]. CSP had a rough surface, large particle size, and irregular morphology, as observed in Figure 2e. Figure 2f exhibits the clear, smooth, and uniform surface of CSEN. A total of 100 different fibers were randomly chosen for calculating the average diameter of CSEN through accessory SmartTiff V3 software. The diameters of CSEN were between 20 and 420 nm with an average value of 148 nm, which can be detected from the diameter distribution histogram in the top right corner of Figure 2f.
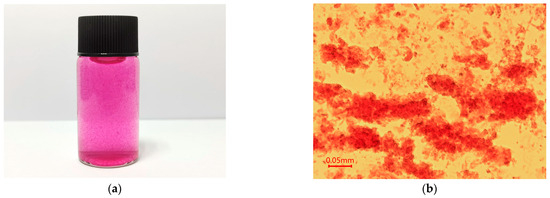
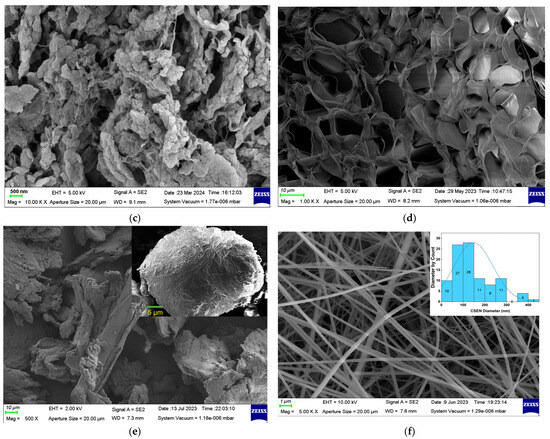
Figure 2.
(a) Digital image and (b) microscope photograph of chitosan hydrogel (CSH) dispersed in AR 27 solution. SEM images of (c) CSH, (d) chitosan aerogel (CSA), (e) chitosan powder (CSP), and (f) chitosan electrospinning nanofiber (CSEN).
3.2. XRD Analysis
XRD patterns showed that the four chitosan adsorbents with different morphologies contained large amounts of amorphous regions and small amounts of semicrystalline structures. As presented in Figure 3, the four chitosan adsorbents had a broad diffraction peak centered at about 2θ = 20°, which was the characteristic feature of semicrystalline domains of chitosan, resulting from the compact arrangement of hydrogen bonds in chitosan [23]. The crystallinities of CSH, CSA, CSP, and CSEN were calculated as 0.41%, 6.97%, 8.76%, and 39.77% using accessory DIFFRAC.EVA software, respectively. The crystallinity of CSH dispersed in the AR 27 solution and may be near zero. The lowest crystallinity of CSH may result from the swelling of the porous network. During the formation of CSH, the disruption of hydrogen bonds between chitosan molecules allowed increased freedom of molecular chain motion, and the water molecules entered among the chitosan molecular chains. Upon freezing, the chitosan solution underwent a volume expansion due to the formation of ice crystals, which led to the arrangement of chitosan molecular chains and an increase in the crystallinity of CSA. The crystallinity of CSP may be attributed to the drying process. CSEN possessed the highest crystallinity, owing to the stretching of chitosan molecules by electrostatic force and volatilization of HFIP from the electrospinning solution, which represented a tight arrangement of chitosan molecular chains.
Figure 3.
XRD patterns of CSH, CSA, CSP, and CSEN.
3.3. FTIR Analysis
As shown in Figure 4, the typical bands belonging to chitosan were found in the ATR-FTIR spectra of the purchased chitosan powder. The overlapping bands at 3371 cm−1 and 3278 cm−1 were attributed to the N-H and O-H groups, respectively [24]. The N-acetyl groups were detected in bands at approximately 1656 cm−1 (C=O stretching of amide-I) and 1376 cm−1 (C-N stretching of amide-III), as well as in the band at 1557 cm−1 (N-H bending of amide II). C-O-C stretching was observed at 1150 and 1022 cm−1 [25]. The bands of CSH, CSA, CSP, and CSEN were kept the same as the purchased chitosan powder, which indicated that there were no additive residues in the four chitosan adsorbents.
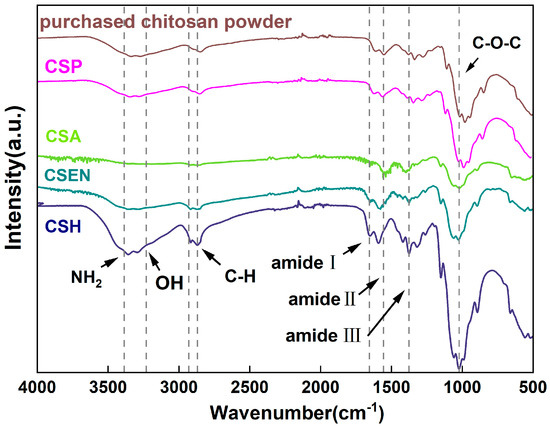
Figure 4.
ATR − FTIR spectra of the purchased chitosan powder, CSH, CSA, CSP, and CSEN.
3.4. BET Analysis
Figure 5a,b depict the N2 adsorption–desorption curves and pore size distribution of the four chitosan adsorbents. According to the IUPAC classification, CSH and CSEN are assigned to a typical type-IV isotherm curve with H1 type hysteresis loops, indicating the presence of mesopores (2–50 nm) in the two adsorbents [26,27]. Figure 5b further indicates that CSH and CSEN possess mesoporous characteristics. The mesopores of CSEN may be caused by the spaces between the nanofibers. In addition, CSA has some pores (>1 μm), which are clearly observed in Figure 2b. The type-II isotherm curves characteristic of CSA, and CSP’s adsorption isotherm, indicate its nonporous nature. The four chitosan adsorbents contain few micropores (<2 nm). The Brunauer–Emmett–Teller (BET) specific surface areas of CSH, CSA, CSP, and CSEN were determined to be 74.6, 9.6, 2.2, and 32.4 m2/g, respectively, as presented in Table 1. CSH (after supercritical CO2 drying) possesses the highest specific surface area, pore volume, and pore diameter, which cannot fully demonstrate the actual specific surface of CSH during the adsorption tests. In practice, the flocculent CSH should have a huge specific surface area compared to the supercritical CO2 dried CSH.
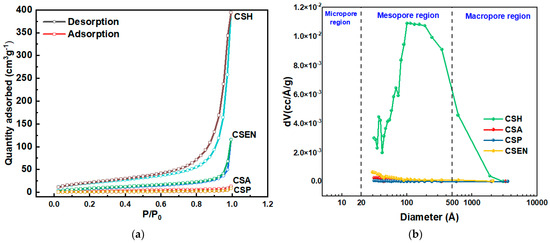
Figure 5.
(a) N2 adsorption–desorption curves and (b) pore size distribution of CSH, CSA, CSP, and CSEN. (a) the circular symbol denotes the desorption curve, while the square-shaped symbol indicates the adsorption curve.

Table 1.
Specific surface area (m2/g), pore volume (cc/g), and pore diameter (nm) of the four chitosan adsorbents.
3.5. Adsorption Kinetics Analysis
Figure 6a shows the adsorption capacities of CSH, CSA, CSP and CSEN at different times. As time went by, the adsorption capacity of AR 27 gradually increased until it reached equilibrium for each adsorbent. The steeper slope of the plots of Qt vs. time corresponded to a faster adsorption process. In terms of both rates and capacities of adsorption, the order was CSH > CSA > CSP > CSEN. The plot of Qt vs. time for AR 27 on CSH looked almost rectangular, which meant that CSH had the fastest adsorption rate. CSH reached over an 88% adsorption capacity within 60 min, while the other three absorbents took almost 1000 min.
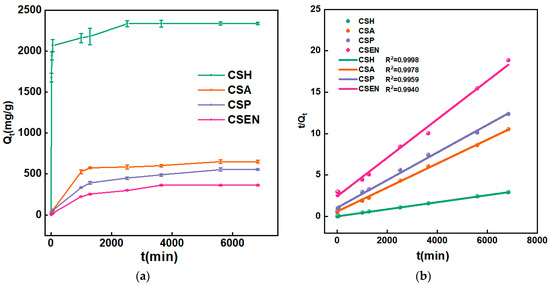
Figure 6.
(a) Plots of Qt vs. time for AR 27 on CSH, CSA, CSP, and CSEN. (b) Fitting curves of PSO model.
The fitting curves for PSO kinetics of CSH, CSA, CSP, and CSEN were carried out as represented in Figure 6b. Table 2 displays the fitting results from the PFO model and the PSO model. Compared to PFO, the PSO model in Table 2 provided a better fitting curve (R12 < R22) for the adsorption processes of the four chitosan adsorbents for AR 27. The results showed that the adsorption mechanisms of all the four chitosan adsorbents for AR 27 were dominated by chemisorption, which is consistent with previous research reports [27,28,29]. The isoelectric value of the chitosan was reported at pH 6.7 [30], so most of the amino groups were positively charged by protonation below pH 6.7. Electrostatic interaction occurred between the positively charged -NH3+ of the four chitosan adsorbents and the negatively charged -SO3- of AR 27 ions. Generally, the higher κ2 value indicates a faster rate of adsorption, resulting in a more rapid attainment of equilibrium. The κ2 values suggested that the adsorption rates of the four chitosan adsorbents were in the following order: CSH (1.32 × 10⁻⁵ mg/g/min) > CSA (3.50 × 10⁻⁶ mg/g/min) > CSP (2.59 × 10⁻⁶ mg/g/min) > CSEN (2.18 × 10⁻⁶ mg/g/min). The κ2 values of CSH and CSEN spanned an order of magnitude.
Table 2.
CSH, CSA, CSP, and CSEN adsorption parameters of PFO and PSO model (Temperature = 20 °C).
The adsorption mechanism is generally considered to involve three stages: (i) adsorbate mass transfer across the external boundary layer film of liquid surrounding the outside of the adsorbent; (ii) adsorption at a site on the surface of the adsorbent; (iii) diffusion of the adsorbate molecules to an adsorption site, either by a pore diffusion process through the liquid-filled pores, or by a solid surface diffusion mechanism [16]. In this study, the transfer mass rate of dye molecules across the external boundary layer film of liquid surrounding the outside of the four chitosan adsorbents should be similar, owing to the same experimental conditions. The second stage is often assumed to be extremely rapid. The third stage should be the adsorption rate-controlling stage. In other words, the differences in adsorption rates for the four chitosan adsorbents were caused by the diffusion of AR 27 molecules to an adsorption site, either by a pore diffusion process through the liquid-filled pores, or by a solid surface diffusion.
It is commonly believed that chitosan undergoes a glass transition during hydration, marked by the existence of an amorphous region, which facilitates the diffusion of small molecules [31,32]. Hydrogels are an open and accessible matrix, which are able to absorb and retain large volumes of water by the disruption of original hydrogen bonds [31,33]. The hydrogen bonds in the semicrystalline domains of chitosan can hinder the intraparticle diffusion rate of dye molecules. For dye molecules, the diffusion rate through the water-filled pores in hydrogels should be greater than the intraparticle diffusion rate in the amorphous region of the adsorbent, not to mention the semicrystalline domains. Thus, the intraparticle diffusion rate of dye molecules in the bulk phase of the adsorbent may be the main factor limiting the adsorption rate, which is negatively correlated with the corresponding crystallinity. More amorphous regions of adsorbents indicate that more adsorption sites are exposed for dye molecules, as well as the specific surface area. Therefore, CSH with the lowest crystallinity and largest specific surface area has the highest adsorption rate and capacity, while the adsorption rate and capacity of CSEN with the highest crystallinity are the lowest. This can also be confirmed from the adsorption rates and capacities of CSP and CSA. CSEN has a higher specific surface area. Nevertheless, the adsorption rate and capacity of CSEN do not seem to be consistent with its specific surface area, which demonstrates that the crystallinity of the four chitosan adsorbents was the main factor impacting the adsorption rates and capacities, compared with the specific surface area. Compared with CSP, the pores (>1μm) in CSA did not significantly improve its adsorption rate and capacity.
3.6. Adsorption Isotherm Analysis
Figure 7 depicts the equilibrium adsorption of CSH, CSA, CSP, and CSEN at 20 °C, 40 °C, and 60 °C. Under identical conditions, the four chitosan adsorbents exhibited different adsorption capacities. The adsorption capacities of each chitosan adsorbent increased as the temperature rose from 20 °C to 60 °C. At different temperatures, CSH has the largest adsorption capacity, while CSEN has the smallest adsorption capacity. But the adsorption capacity of CSA is greater than that of CSP at each temperature. The shapes of all the adsorption isotherms at each temperature are nearly rectangular because the equilibrium adsorption capacities (Qe) of the four chitosan adsorbents at low equilibrium dye concentrations (Ce) attained almost the same as those at high equilibrium dye concentrations. This demonstrates that all four chitosan adsorbents have high adsorption capacities even at low equilibrium dye concentrations. The rectangular adsorption isotherm curves were also reported in the literature [34].
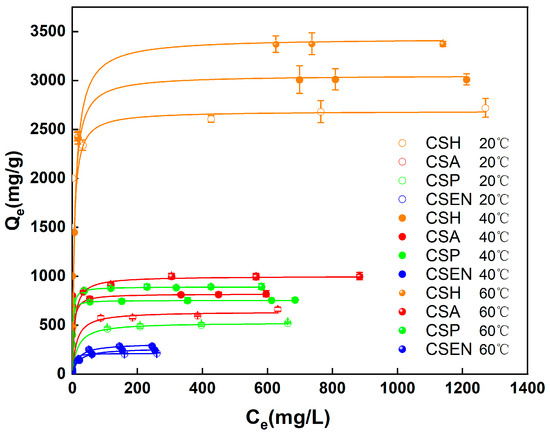
Figure 7.
Equilibrium adsorption of AR 27 on the four chitosan adsorbents at different temperatures.
The equilibrium adsorption isotherm serves as a fundamental tool for understanding the interaction between the adsorbent and adsorbate. Adsorption isotherms commonly include the Langmuir, Freundlich, Redlich–Peterson, Dubinin–Radushkevich, and BET models, and so on [35]. As most adsorption behaviors for dyes usually follow the Langmuir or Freundlich isotherm models, these two models were employed in this study. The fitting curves of the Langmuir isotherm and the fitting results for both the Langmuir and Freundlich isotherms are shown in Figure 8 and Table 3, respectively. Since RL2 was higher than RF2, the Langmuir model was more suitable for describing the adsorption behaviors of AR 27 removal by the four chitosan adsorbents. Therefore, the adsorption behaviors between the four chitosan adsorbents and AR 27 are monolayer adsorption behaviors.
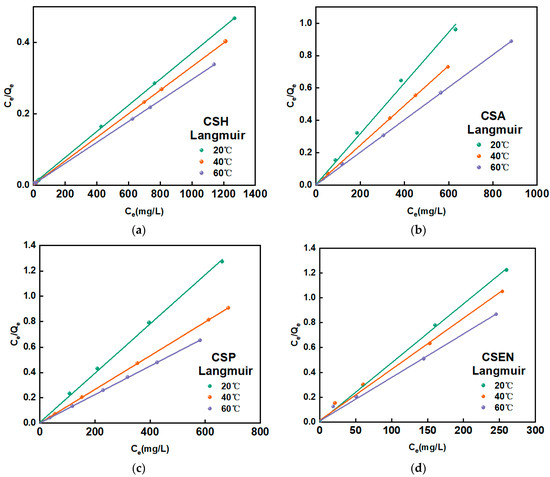
Figure 8.
Langmuir plot at different temperatures on (a) CSH, (b) CSA, (c) CSP, and (d) CSEN.
Table 3.
Adsorption isotherm constants for AR 27 on CSH, CSA, CSP, and CSEN.
The Qmax values were obtained from the Langmuir isotherm model, and the Qmax values of the four chitosan adsorbents increased gradually at 20 °C, 40 °C, and 60 °C for AR 27. The increases in temperature lead to the more rapid intraparticle diffusion of AR 27. At the same temperature, the Qmax values of the four chitosan adsorbents are ordered as follows: CSH > CSA > CSP > CSEN. This is in accord with the effect of the crystallinities of the four chitosan adsorbents on the adsorption rates for AR 27. More semicrystalline domains of adsorbents indicate that adsorption sites are exposed for dye molecules. At 20 °C, the Qmax of CSH is about 12.7 times that of CSEN. The low crystallinity of CSH cannot only facilitate the intraparticle diffusion of dye molecules, but also the exposure of more adsorption sites.
The Qmax values of the four chitosan adsorbents for AR 27 were much better than the reported non-chitosan adsorbents, as listed in Table 4. The maximum adsorption capacities (mmol/g) of chitosan with different morphologies and structures (powder, beads, films, and nanofibrous membranes) are not the same. It is seen that the Qmax value of CSH is much larger than that of other morphologies of the chitosan adsorbent. After subtracting the undeacetylated amino groups, every gram of the purchased chitosan powder (70% degree of deacetylation) has 4.343 mmol amino groups. Assuming that each amino group in the purchased chitosan powder adsorbed one AR 27 molecule, the theoretical maximum adsorption per gram of chitosan was 5.109 mmol/g for AR 27 (85% purity). The maximum adsorption capacity of CSH achieved 4.523 mmol/g for AR 27 at 20 °C, which is close to the theoretical value. However, the maximum adsorption capacities of the reported chitosan adsorbents are far from the corresponding number of amino groups, which may be owed to the same semicrystalline domains between CSA, CSP, and CSEN. The presence of semicrystalline domains should prevent the amino group from being fully exposed for AR 27 molecules. In semicrystalline domains, the molecular segments of chitosan are closely arranged, resulting in dye molecules which are hard to diffuse. Each molecule of AR 27 contains three sulfonic acid groups. When one sulfonic acid group of AR 27 binds with -NH3+ of chitosan, the other two sulfonic acid groups may create electrostatic repulsion for subsequent dye molecules. Steric hindrance from electrostatic repulsion may also be one of the factors that impact the maximum adsorption capacity.
Table 4.
Comparison of Qmax values of adsorbents for some dyes.
4. Conclusions
In this work, the adsorption behaviors of the four chitosan adsorbents (CSH, CSA, CSP, and CSEN) with different morphologies and structures for removing AR 27 were comparatively studied in a batch system. The crystallinities of CSH, CSA, CSP, and CSEN were calculated as 0.41%, 6.97%, 8.76%, and 39.77%, respectively. The specific surface areas of CSH, CSA, CSP, and CSEN were measured to be 74.6 (after supercritical CO2 drying), 9.6, 2.2, and 32.4 m2/g, respectively. The experimental data of the four chitosan adsorbents fitted very well to the PSO, which demonstrated that the adsorption mechanisms of all four chitosan adsorbents for AR 27 were dominated by chemisorption. The adsorption rates of the four chitosan adsorbents are ordered as follows: CSH (1.32 × 10⁻⁵ mg/g/min) > CSA (3.50 × 10⁻⁶ mg/g/min) > CSP (2.59 × 10⁻⁶ mg/g/min) > CSEN (2.18 × 10⁻⁶ mg/g/min). The Langmuir model was more suitable for describing the adsorption behaviors of AR 27 by the four chitosan adsorbents; these behaviors were indicated as monolayer adsorption behaviors. The maximum adsorption capacities of CSH, CSA, CSP, and CSEN were 2732.2 (4.523), 675.7 (1.119), 534.8 (0.885), and 215.6 (0.357) mg/g (mmol/g) at 20 °C. The crystallinity of the four chitosan adsorbents was the main factor impacting the adsorption rates and adsorption capacities, compared with the specific surface area. With the decrease in crystallinity, the adsorption rates and capacities of the four chitosan adsorbents increase gradually under the same experimental conditions. The maximum adsorption capacity of CSH with the lowest crystallinity and largest specific surface area achieved 3413.0 (5.646) mg/g (mmol/g), which was very close to the theoretical adsorption value and much better than the reported adsorbents.
Author Contributions
Conceptualization, H.W., C.L., L.W., S.Z. and P.N.; methodology, C.L., J.Z. and N.Z.; software, S.Z. and Z.L.; validation, H.L. and Y.W.; formal analysis, H.W., C.L., L.W. and Z.L.; investigation, H.W, C.L. and S.Z.; resources, H.W, C.L., S.Z. and P.N.; data curation, H.W, J.Z., Y.W. and H.L.; writing—original draft preparation, H.W, C.L., S.Z., P.N. and Z.L.; writing—review and editing, H.W., J.Z., C.L., L.W. and S.Z.; visualization, N.Z.; supervision, S.Z.; project administration, C.L. and S.Z.; funding acquisition, N.Z., Y.W., H.L. and L.W. All authors have read and agreed to the published version of the manuscript.
Funding
The project was supported by the National Natural Science Foundation of China (No. 52263002), the National Natural Science Foundation of China (No. 22104009), the Natural Science Foundation of Inner Mongolia (No. 2021LHMS01003), the Innovation Project of Guangxi Undergraduate Education (No. 202310594058), the Inner Mongolia Autonomous Region Directly Affiliated Universities Basic Scientific Research Business Fund Project (No. 311).
Data Availability Statement
Data are contained within the article.
Conflicts of Interest
The authors declare no conflict of interest.
References
- Vandevivere, P.C.; Bianchi, R.; Verstraete, W. Treatment and Reuse of Wastewater from the Textile Wet-Processing Industry: Review of Emerging Technologies. J. Chem. Technol. Biotechnol. 1998, 72, 289–302. [Google Scholar] [CrossRef]
- Fan, L.L.; Zhang, Y.; Luo, C.N.; Lu, F.G.; Qiu, H.M.; Sun, M. Synthesis and characterization of magnetic β-cyclodextrin-chitosan nanoparticles as nano-adsorbents for removal of methyl blue. Int. J. Biol. Macromol. 2012, 50, 444–450. [Google Scholar] [CrossRef] [PubMed]
- Kolya, H.; Kang, C.W. Next-Generation Water Treatment: Exploring the Potential of Biopolymer-Based Nanocomposites in Adsorption and Membrane Filtration. Polymers 2023, 15, 38. [Google Scholar] [CrossRef] [PubMed]
- Zhao, R.; Jin, P.R.; Zhu, J.Y.; Li, Y.; Li, G.C.; Volodine, A.; Liu, Y.Y.; Zheng, J.F.; van der Bruggen, B. Amino acid-based loose polyamide nanofiltration membrane with ultrahigh water permeance for efficient dye/salt separation. J. Membr. Sci. 2023, 673, 11. [Google Scholar] [CrossRef]
- Solanki, Y.S.; Agarwal, M.; Gupta, A.B. Develop an integrating coagulation and RO systems to treat highly turbid water using synthesized coagulants. Water Sci. Technol. 2022, 85, 562–577. [Google Scholar] [CrossRef] [PubMed]
- Thanushree, M.S.; Mahadevappa, M.; Shivaswamy, M.; Mahesh, S.; Premanandasagar, C. Electrochemical treatment of real cotton fabric industry wastewater using copper and stainless steel electrodes. J. Water Sanit. Hyg. Dev. 2023, 13, 197–207. [Google Scholar] [CrossRef]
- Banerjee, P.; DasGupta, S.; De, S. Removal of dye from aqueous solution using a combination of advanced oxidation process and nanofiltration. J. Hazard. Mater. 2007, 140, 95–103. [Google Scholar] [CrossRef]
- Bouabidi, Z.B.; El-Naas, M.H.; Zhang, Z.E. Immobilization of microbial cells for the biotreatment of wastewater: A review. Environ. Chem. Lett. 2019, 17, 241–257. [Google Scholar] [CrossRef]
- Teo, S.H.; Ng, C.H.; Islam, A.; Abdulkareem-Alsultan, G.; Joseph, C.G.; Janaun, J.; Taufiq-Yap, Y.H.; Khandaker, S.; Islam, G.J.; Znad, H.; et al. Sustainable toxic dyes removal with advanced materials for clean water production: A comprehensive review. J. Clean. Prod. 2022, 332, 18. [Google Scholar] [CrossRef]
- Wong, Y.C.; Szeto, Y.S.; Cheung, W.H.; McKay, G. Adsorption of acid dyes on chitosan—Equilibrium isotherm analyses. Process Biochem. 2004, 39, 693–702. [Google Scholar] [CrossRef]
- Dotto, G.L.; Moura, J.M.; Cadaval, T.R.S.; Pinto, L.A.A. Application of chitosan films for the removal of food dyes from aqueous solutions by adsorption. Chem. Eng. J. 2013, 214, 8–16. [Google Scholar] [CrossRef]
- Rego, T.V.; Cadaval, T.R.S., Jr.; Dotto, G.L.; Pinto, L.A.A. Statistical optimization, interaction analysis and desorption studies for the azo dyes adsorption onto chitosan films. J. Colloid Interface Sci. 2013, 411, 27–33. [Google Scholar] [CrossRef] [PubMed]
- Li, C.; Lou, T.; Yan, X.; Long, Y.-z.; Cui, G.; Wang, X. Fabrication of pure chitosan nanofibrous membranes as effective absorbent for dye removal. Int. J. Biol. Macromol. 2018, 106, 768–774. [Google Scholar] [CrossRef] [PubMed]
- Chatterjee, S.; Lee, D.S.; Lee, M.W.; Woo, S.H. Enhanced adsorption of congo red from aqueous solutions by chitosan hydrogel beads impregnated with cetyl trimethyl ammonium bromide. Bioresour. Technol. 2009, 100, 2803–2809. [Google Scholar] [CrossRef] [PubMed]
- Sirvio, J.A.; Visanko, M.; Liimatainen, H. Synthesis of imidazolium-crosslinked chitosan aerogel and its prospect as a dye removing adsorbent. RSC Adv. 2016, 6, 56544–56548. [Google Scholar] [CrossRef]
- Cheung, W.H.; Szeto, Y.S.; McKay, G. Intraparticle diffusion processes during acid dye adsorption onto chitosan. Bioresour. Technol. 2007, 98, 2897–2904. [Google Scholar] [CrossRef] [PubMed]
- Hidayat, E.; Harada, H.; Mitoma, Y.; Yonemura, S.; Halem, H.I. Rapid Removal of Acid Red 88 by Zeolite/Chitosan Hydrogel in Aqueous Solution. Polymers 2022, 14, 893. [Google Scholar] [CrossRef] [PubMed]
- Su, C.; Yang, H.; Zhao, H.; Liu, Y.; Chen, R. Recyclable and biodegradable superhydrophobic and superoleophilic chitosan sponge for the effective removal of oily pollutants from water. Chem. Eng. J. 2017, 330, 423–432. [Google Scholar] [CrossRef]
- Lagergren, S. Zur Theorie der sogenannten Adsorption gelöster Stoffe, Kungliga Svenska Ventenskapsakademiens. Handlingar 1898, 2, 15. [Google Scholar] [CrossRef]
- Ho, Y.S.; McKay, G. Sorption of dye from aqueous solution by peat. Chem. Eng. J. 1998, 2, 115–124. [Google Scholar] [CrossRef]
- Langmuir, I. The adsorption of gases on plane surfaces of glass, mica and platinum. J. Am. Chem. Soc. 1918, 40, 1361–1403. [Google Scholar] [CrossRef]
- Li, D.; Tian, X.; Wang, Z.; Guan, Z.; Li, X.; Qiao, H.; Ke, H.; Luo, L.; Wei, Q. Multifunctional adsorbent based on metal-organic framework modified bacterial cellulose/chitosan composite aerogel for high efficient removal of heavy metal ion and organic pollutant. Chem. Eng. J. 2020, 383, 123127. [Google Scholar] [CrossRef]
- Wang, S.F.; Shen, L.; Zhang, W.D.; Tong, Y.J. Preparation and mechanical properties of chitosan/carbon nanotubes composites. Biomacromolecules 2005, 6, 3067–3072. [Google Scholar] [CrossRef] [PubMed]
- Munim, S.A.; Saddique, M.T.; Raza, Z.A.; Majeed, M.I. Fabrication of cellulose-mediated chitosan adsorbent beads and their surface chemical characterization. Polym. Bull. 2020, 77, 183–196. [Google Scholar] [CrossRef]
- Perez-Nava, A.; Reyes-Mercado, E.; Gonzalez-Campos, J.B. Production of chitosan nanofibers using the HFIP/acetic acid mixture as electrospinning solvent. Chem. Eng. Process.-Process Intensif. 2022, 173, 108849. [Google Scholar] [CrossRef]
- Wang, J.; Shen, L.; Li, H.; Ding, B.; Nie, P.; Dou, H.; Zhang, X. Mesoporous Li4Ti5O12/carbon nanofibers for high-rate lithium-ion batteries. J. Alloys Compd. 2014, 587, 171–176. [Google Scholar] [CrossRef]
- Bhattacharyya, K.G.; Sen Gupta, S. Removal of Cu(II) by natural and acid-activated clays: An insight of adsorption isotherm, kinetic and thermodynamics. Desalination 2011, 272, 66–75. [Google Scholar] [CrossRef]
- Kumari, H.J.; Krishnamoorthy, P.; Arumugam, T.K.; Radhakrishnan, S.; Vasudevan, D. An efficient removal of crystal violet dye from waste water by adsorption onto TLAC/Chitosan composite: A novel low cost adsorbent. Int. J. Biol. Macromol. 2017, 96, 324–333. [Google Scholar] [CrossRef] [PubMed]
- Arora, C.; Soni, S.; Sahu, S.; Mittal, J.; Kumar, P.; Bajpai, P.K. Iron based metal organic framework for efficient removal of methylene blue dye from industrial waste. J. Mol. Liq. 2019, 284, 343–352. [Google Scholar] [CrossRef]
- Subramani, S.E.; Thinakaran, N. Isotherm, kinetic and thermodynamic studies on the adsorption behaviour of textile dyes onto chitosan. Process Saf. Environ. Prot. 2017, 106, 1–10. [Google Scholar] [CrossRef]
- Piron, E.; Domard, A. Interaction between chitosan and uranyl ions. Part 1. Role of physicochemical parameters. Int. J. Biol. Macromol. 1997, 21, 327–335. [Google Scholar] [CrossRef] [PubMed]
- Zhou, D.; Zhang, L.; Guo, S.L. Mechanisms of lead biosorption on cellulose/chitin beads. Water Res. 2005, 39, 3755–3762. [Google Scholar] [CrossRef] [PubMed]
- Sannino, A.; Pappadà, S.; Madaghiele, M.; Maffezzoli, A.; Ambrosio, L.; Nicolais, L. Crosslinking of cellulose derivatives and hyaluronic acid with water-soluble carbodiimide. Polymer 2005, 46, 11206–11212. [Google Scholar] [CrossRef]
- Yoshida, H.; Okamoto, A.; Kataoka, T. Adsorption of acid dye on cross-linked chitosan fibers: Equilibria. Chem. Eng. Sci. 1993, 48, 2267–2272. [Google Scholar] [CrossRef]
- Kayranli, B. Adsorption of textile dyes onto iron based waterworks sludge from aqueous solution; isotherm, kinetic and thermodynamic study. Chem. Eng. J. 2011, 173, 782–791. [Google Scholar] [CrossRef]
- Chiou, M.S.; Li, H.Y. Equilibrium and kinetic modeling of adsorption of reactive dye on cross-linked chitosan beads. J. Hazard. Mater. 2002, 93, 233–248. [Google Scholar] [CrossRef]
- Al-Zawahreh, K.; Barral, M.T.; Al-Degs, Y.; Paradelo, R. Comparison of the sorption capacity of basic, acid, direct and reactive dyes by compost in batch conditions. J. Environ. Manag. 2021, 294, 113005. [Google Scholar] [CrossRef] [PubMed]
- Guerrero-Coronilla, I.; Morales-Barrera, L.; Cristiani-Urbina, E. Kinetic, isotherm and thermodynamic studies of amaranth dye biosorption from aqueous solution onto water hyacinth leaves. J. Environ. Manag. 2015, 152, 99–108. [Google Scholar] [CrossRef] [PubMed]
- Salem, A.E.-N.M.; Ahmed, M.A.; El-shahat, M.F. Selective adsorption of amaranth dye on Fe3O4/MgO nanoparticles. J. Mol. Liq. 2016, 219, 780–788. [Google Scholar] [CrossRef]
- Abdellaoui, K.; Pavlovic, I.; Bouhent, M.; Benhamou, A.; Barriga, C. A comparative study of the amaranth azo dye adsorption/desorption from aqueous solutions by layered double hydroxides. Appl. Clay Sci. 2017, 143, 142–150. [Google Scholar] [CrossRef]
- Yusof, N.H.; Foo, K.Y.; Wilson, L.D.; Hameed, B.H.; Hazwan Hussin, M.; Sabar, S. Microwave-Assisted Synthesis of Polyethyleneimine Grafted Chitosan Beads for the Adsorption of Acid Red 27. J. Polym. Environ. 2020, 28, 542–552. [Google Scholar] [CrossRef]
Disclaimer/Publisher’s Note: The statements, opinions and data contained in all publications are solely those of the individual author(s) and contributor(s) and not of MDPI and/or the editor(s). MDPI and/or the editor(s) disclaim responsibility for any injury to people or property resulting from any ideas, methods, instructions or products referred to in the content. |
© 2024 by the authors. Licensee MDPI, Basel, Switzerland. This article is an open access article distributed under the terms and conditions of the Creative Commons Attribution (CC BY) license (https://creativecommons.org/licenses/by/4.0/).