Abstract
Kaolinite and dickite are differently ordered polytypes of kaolinite-group minerals, whose differences are in the stacking mode of layers and ion occupation. Fourier transform infrared spectroscopy was used to collect information about the differences between the two minerals. The common characteristics of kaolinite and dickite are bands near 4530 and 7068 cm−1, which are attributed to the combination of the inner Al-OH stretching vibration and outer Al-OH bending vibration and the overtone of the inner Al-OH stretching vibration, respectively. The difference is that kaolinite has secondary peaks at 4610 and 7177 cm−1, and the secondary peak of dickite is near 4588 cm−1. The OH stretching vibration has the first fundamental overtone of the stretching vibration in the range of 7000–7250 cm−1. In addition to the overtones generated by single OH stretching vibrations, overtones combining different OH stretching vibrations are also found, which are formed by adjacent peaks of OH stretching vibrations. The average factor of the first fundamental overtone with an OH-group stretching vibration is approximately 1.95. The near-infrared spectrum (NIR) of phyllosilicates is closely related to their structure and isomorphism. Therefore, the near-infrared region can distinguish between kaolinite and dickite and provide a basis for deposit research and geological remote sensing.
1. Introduction
Kaolinite minerals are the most common polytypes of aluminous phyllosilicates. They can be used in many types of materials, such as ceramics, glass, and refractory materials, and even as gemstones or handicrafts if the texture is pure and uniform. Kaolinite-group minerals include three ordered polytypes that are stable at normal temperature and pressure levels, namely, kaolinite, dickite, and nacrite, of which the first two are common. These minerals exist in a wide range of geological environments. Kaolinite exists in soil, sedimentary rocks, and hydrothermal deposits. Dickite is generally related to higher temperature and pressure conditions and mainly occurs in hydrothermal or sedimentary rocks; it can be used as a sign of exploration/zoning [1] and for detecting metallogenic environments [2] and geological activities [3].
Kaolinite and dickite display two different types of OH groups. The inner OH groups are located within the octahedral sheets, while the three nonequivalent inner surface OH groups are located on top of the octahedral sheets, sharing weak hydrogen bonds with the oxygen atoms of the next tetrahedral sheet. OH groups are very sensitive to the occurrence of defects, such as isomorphism and planar defects, and to the structural changes associated with phase transitions, which can be used to detect the structural order in hydrous minerals, especially in layered silicates [4]. Changes in the cationic environment will affect the vibrational properties of the OH groups, so the structural differences among clay minerals can be reflected by changes in hydroxyl bond vibrations.
Naturally occurring intergrowths of kaolinite-group minerals are very common, and their properties are very similar. Therefore, it is necessary to devise a simple characterization technique to identify and distinguish these minerals. Infrared spectroscopy is a powerful tool to characterize mineral species and study mineral structure. The mid-infrared region (MIR, 400–4000 cm−1) is often used to detect the basic vibration of functional groups [5], and the near-infrared region (NIR, generally 4000–12,500 cm−1) can reflect the vibration characteristics of the combination bands of hydroxyl and metal ions, as well as the overtone bands of water and some functional groups in minerals. These overtones will be sensitive to any change in the crystalline structure. Near-infrared spectroscopy has been widely used to identify kaolinite in mineral mixtures (e.g., [6,7,8,9]) and to study the stacking sequence of kaolinite-group minerals [10].
The purpose of this paper is to investigate the differences in the near-infrared spectra of kaolinite and dickite, which can thus realize the rapid identification of the two minerals. The results are applicable to ceramics, jade studies, and archaeology. In addition, the attribution of the OH group vibration peaks is discussed in detail, and attempts at rationalizing the origin of these bands are described. The careful measurement and interpretation of clay minerals may be very important for deposit research and geological remote sensing.
2. Materials and Methods
2.1. Materials
All samples were natural. The sample BL-DSL-4 is from Balin, Chifeng City, Inner Mongolia Autonomous Region, China; QJ-1 and QJ-8 are from the Shoushan area, Fuzhou City, Fujian Province, China. The dickite samples GS-1, GS-4, and GS-8 are from the Shoushan area, Fuzhou City, Fujian Province, China. Typical mineral samples were selected for this study. Each sample was moderately shattered, and the uniform part of each sample, without other phases, was used for the experiments.
Isomorphic substitution is very common in layered silicate minerals, and impurity elements will have varying degrees of influence on the results of spectral experiments. SEM-EDS analyses of the samples before this study showed that most samples contained the isomorphic elements potassium and iron, and a few samples contained other types of isomorphic elements (Table 1). Since the contents of impurity elements in the samples were very low, they were considered unlikely to affect the results of this study.

Table 1.
Mineral composition of the samples.
2.2. Methods
X-ray diffraction (XRD) data were acquired using the Smart lab X-ray powder diffractometer at the Institute of Earth Science, China University of Geosciences, Beijing (CUGB). The system was equipped with a conventional copper target X-ray tube (set to 45 kV and 200 mA) and a graphite monochromator, with a stepping scanning mode with a scanning speed of 4°/min and a step length of 0.02° in the range of 3–90°. The testing temperature was 15 °C, and the humidity was 22%. The samples were pulverized to 200-mesh powders using an agate mortar and stored immediately in a plastic bag to minimize contamination and oxidation. The results were analyzed using the MDI Jade 6.5 software and the International Center of Diffraction Database (ICDD). Baseline correction and normalization were performed before analysis.
Fourier transform infrared spectroscopy (FTIR) measurements were performed at room temperature using the Bruker Tensor II spectrometer at the Gem Research Center, the School of Gemology, China University of Geosciences, Beijing (CUGB). The spectra were collected in transmission mode in a tablet of KBr. The mid-infrared scanning range was 400–4000 cm−1 with a resolution of 4 cm−1, and the ratio of sample to KBr was 1:150. The near-infrared scanning range was 4000~8000 cm−1, with a resolution of 8 cm−1. Each spectrum was averaged from 64 scans to improve the signal-to-noise ratio. Baseline correction and normalization were performed.
Clay minerals often consist of aggregates of small particles of the same size as near-infrared waves, and if the size of the particles is larger than the IR wavelength, the IR spectrum is affected by multiple scattering within the particles, which can produce interference effects and reduce the signal strength [11,12]. The mineral shape also affects the signal [12]. In this study, because it was difficult to crush the sample to a size smaller than the wavelength of a near-infrared wave (more than 6000-mesh), the ratio of sample to KBr was increased to 2:150 in the near-infrared range to enhance the spectral signal.
Infrared hydroxyl vibration usually has small peak spacing, and a large number of spectral peaks coincide. Therefore, the original FTIR spectra were analyzed by taking the second derivative to find the spectral peaks [13,14,15]. The absorption maximum in the second-derivative spectrum was converted to the minimum. This greatly reduced the apparent spectral bandwidth and largely eliminated baseline differences between spectra [16]. Then, Peakfit v4.12 software was used to fit the peaks in order to find the exact locations and forms of their component peaks. All of the spectra were fitted using a combined Gauss–Lorentz area function, r2 > 0.95.
Raman microprobe spectra were tested with the Horiba LabRAM HR-Evolution laser Raman spectrometer. The analytical conditions included a laser wavelength of 532 nm, a grating of 600 (500 nm), a range of 100–4000 cm−1, a resolution of 1 cm−1, a scanning time of 10 s, and an accumulation of 3 times, with the polished surface cleaned with alcohol before measurement.
3. Results
3.1. X-ray Diffraction
The XRD patterns of the six samples with PDF cards of kaolinite and dickite from the ICDD® database are shown in Figure 1. All of the samples are consistent with the characteristics of kaolinite-group minerals, showing common strong peaks of d(001) = 12.321–12.467° and d(002) = 24.839–24.970° and medium-intensity peaks of d(−110) = 20.281–20.460° and d(−133) = 38.460–38.823°. The classical method to distinguish kaolinite and dickite is to use the number and shape of peaks in the range of 34–40° (gray area in Figure 1). The samples BL-DSL-4, QJ-1, and QJ-8 have six peaks within this range, which is characteristic of kaolinite. The samples GS-1, GS-4, and GS-8 have four peaks within this range, which is characteristic of dickite. All of the samples were found to be pure minerals without any other phases.
3.2. Characteristics of MIR
There are four main spectral bands in the mid-infrared range: 400–600 cm−1, 650–800 cm−1, 850–1200 cm−1, and 3500–3750 cm−1. The spectral peaks are highly consistent with the standard spectra of kaolinite-group minerals (Figure 2), and no additional peaks appeared.
The number and intensity of peaks in the high-frequency region of 3600–3750 cm−1 are often used to distinguish kaolinite-group minerals. Kaolinite shows three or four peaks in this range, with the strongest near 3700 cm−1 and a weak peak in the middle. Dickite has three, which weaken in turn. We could observe more vibration modes after fitting the spectrum (Table 2 and Figure 3) [12,17]. It is worth noting that there was no change in the dipole moment at the positions near 3685 cm−1 in kaolinite and 3645 cm−1 in dickite, which should show no peak; however, weak peaks were fitted at the corresponding positions. This may have been caused by the structural ideality, which decreased due to the isomorphism, and then the dipole moment changed slightly.
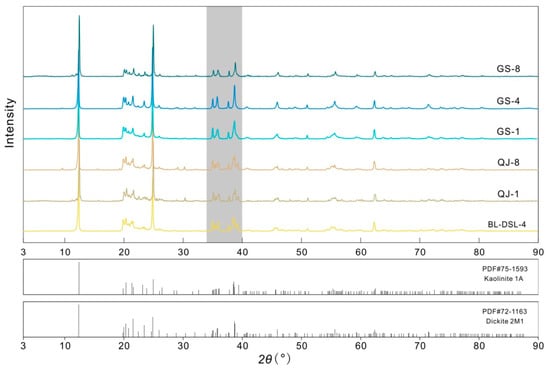
Figure 1.
Powder XRD patterns of the samples.
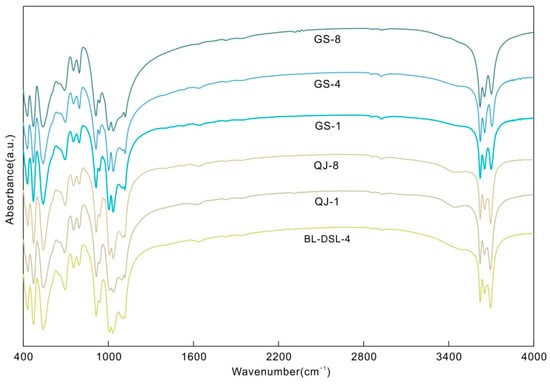
Figure 2.
MIR spectra of the kaolinite and dickite samples.
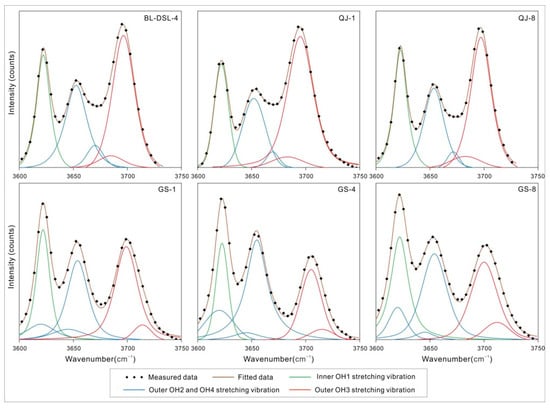
Figure 3.
MIR spectral component analysis of the OH stretching region.
3.3. Raman
Raman spectroscopy has proven most useful for the elucidation of the kaolinite hydroxyl structure [18]. Raman spectra can detect the vibrations of nonpolar groups that cause a change in polarizability; these vibrations may be non-infrared-active. Thus, it can be a supplement to the infrared spectra. Kaolinite and dickite show 3685 and 3645 cm−1 outer OH stretching vibration Raman peaks, respectively (Figure 4 and Figure 5), which cannot be observed in normal infrared spectra. Although there is no infrared activity, it will still affect the combination bands and overtone.
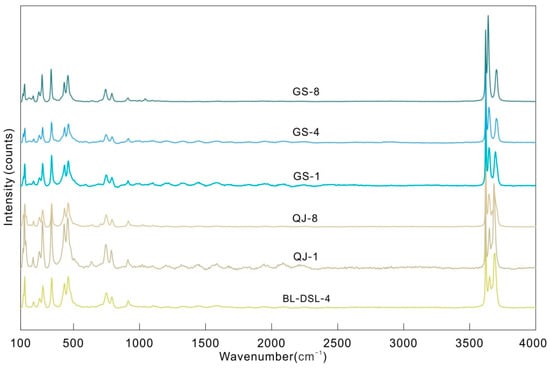
Figure 4.
Raman spectra of the kaolinite and dickite samples.

Figure 5.
Raman spectral component analysis of the OH stretching region.
Table 2.
The MIR and Raman bands related to kaolinite mineral samples and their assignments (cm−1).
Table 2.
The MIR and Raman bands related to kaolinite mineral samples and their assignments (cm−1).
| Band Assignment [19,20,21,22,23,24,25,26,27,28,29,30,31,32] | Active | BL-DSL-4 | QJ-1 | QJ-8 | GS-1 | GS-4 | GS-8 |
|---|---|---|---|---|---|---|---|
| Lattice vibration | R | 122 | 118 | 122 | 122 | 120 | 118 |
| Si2O5 out of plane | R | 131 | 127 | 131 | 131 | 132 | 131 |
| ν2(e) of AlO6 octahedron | R | 140 | 142 | ||||
| A1g(ν1) of AlO6 octahedron | R | 196 | 194 | 198 | 198 | 198 | 195 |
| O-H-O stretching vibration | R | 243 | 241 | 241 | 241 | 241 | 238 |
| O-H-O stretching vibration | R | 268 | 266 | 268 | 266 | 266 | 263 |
| Si-O stretching vibration | R | 334 | 332 | 334 | 334 | 334 | 331 |
| Si-O stretching vibration | IF | 412 | 412 | 412 | 411 | 412 | 412 |
| Si-O bending vibration | IF, R | 431 | 432 | 431 | 429 | 428 | 428 |
| Si-O bending vibration | IF, R | 472 | 473 | 472 | 471 | 471 | 471 |
| Si-O-Al vibration | IF | 541 | 542 | 541 | 539 | 541 | 540 |
| Si-O-Al vibration | IF | 694 | 692 | 695 | 694 | 695 | 692 |
| Si-O-Al vibration | IF, R | 754 | 754 | 754 | 754 | 754 | 752 |
| Si-O stretching vibration | IF, R | 794 | 795 | 794 | 794 | 794 | 795 |
| Outer Al-OH bending vibration | IF, R | 914 | 914 | 914 | 913 | 913 | 912 |
| Inner Al-OH bending vibration | IF | 937 | 937 | 938 | 937 | 937 | 937 |
| Si-O-Al vibration | IF | 1007 | 1009 | 1009 | 1004 | 1003 | 1001 |
| Si-O-Si vibration | IF | 1033 | 1034 | 1034 | 1033 | 1034 | 1036 |
| Si-O stretching vibration | IF | 1099 | 1094 | 1100 | 1097 | 1100 | 1092 |
| Si-O stretching vibration | IF | 1115 | 1117 | 1116 | 1116 | 1117 | 1118 |
| Outer OH2, OH4 stretching vibration | IF, R | 3620 | 3620 | 3620 | |||
| Inner OH1 stretching vibration | IF, R | 3622 | 3622 | 3623 | 3622 | 3623 | 3622 |
| Outer OH2, OH4 stretching vibration | R | 3645 | 3645 | 3645 | |||
| Outer OH2, OH4 stretching vibration | IF, R | 3653 3670 | 3652 3669 | 3654 3672 | 3654 | 3655 | 3654 |
| Outer OH3 stretching vibration | R | 3685 | 3683 | 3683 | |||
| Outer OH3 stretching vibration | IF, R | 3696 | 3695 | 3697 | 3699 3714 | 3705 3715 | 3700 3712 |
3.4. Characteristics of NIR
The main NIR spectral characteristics of kaolinite and dickite are located in the 4000–4800 cm−1 and 7000–7600 cm−1 regions (Table 3 and Figure 6, Figure 7 and Figure 8).
Table 3.
The bands in the range of 4000–8000 cm−1 for related samples and their assignments (cm−1).
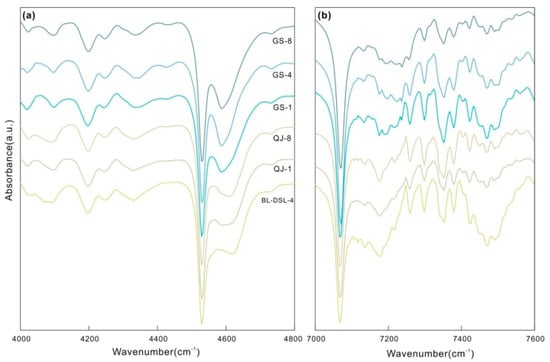
Figure 6.
NIR spectra of the kaolinite and dickite samples. (a) The range of the OH combination bands (4000–4800 cm−1); (b) the range of the OH stretching overtone bands (7000–7600 cm−1).
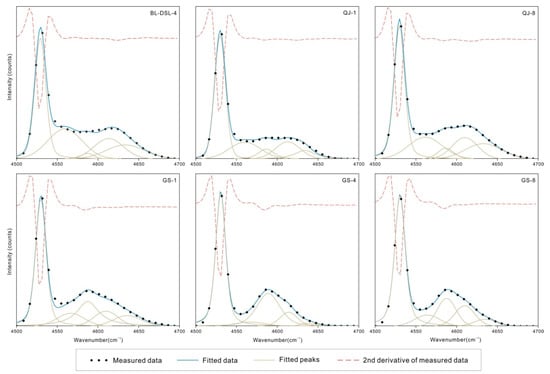
Figure 7.
NIR spectral component analysis of the OH combination bands.
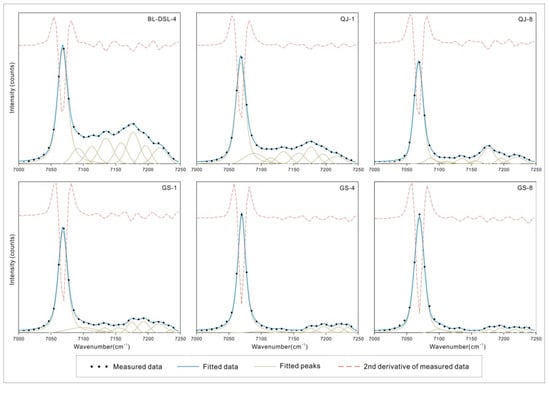
Figure 8.
NIR spectral component analysis of the OH stretching overtone bands.
There are multiple weak peaks in the range of 4000–4400 cm−1, assigned to the combination of lattice deformation vibrations and OH stretching vibrations. In the range of 4500–4700 cm−1, kaolinite and dickite both fit five peaks with similar positions. The maximum peaks are located near 4530 cm−1, which is a common characteristic of kaolinite-group minerals. A shoulder peak is present on the side of the higher wave number; the kaolinite shoulder is near 4613 cm−1, and the dickite shoulder is near 4587 cm−1, which can be used to distinguish the two minerals.
All samples have a large number of disordered but clear peaks in the range of 7000–8000 cm−1. According to the theoretical calculation and the change in intensity before and after heating, a series of spectral peaks after 7250 cm−1 is considered to be caused by H2O in the crystal structure of clay minerals. H2O causes many disordered peaks in this region, which are also common in serpentine, montmorillonite, and other phyllosilicates [6,33,34]. The first fundamental overtone of the OH stretching vibrations is in the range of 7000–7250 cm−1, and a strong peak and multiple weak peaks were obtained after fitting. The strong peaks of both minerals are near 7068 cm−1, and there is a secondary peak at 7177 cm−1 for kaolinite, but not for dickite. GS-1 has a very weak spectral peak at 7155 cm−1, while the peaks of GS-4 and GS-8 are too weak to be shown here.
4. Discussion
Assignment of OH Vibration in NIR Spectra
The band frequency relationships between the MIR and NIR spectra were determined via trial-and-error summations. Combined with the data obtained in this experiment, we determined suitable peak assignments as far as possible.
The bands of kaolinite-group minerals in the region of 4000–5000 cm−1 correspond to the combination of OH stretching vibration and lattice vibration or bending vibration (νOH + δOH). The band at 4530 cm−1 is attributed to the combination of the band near 3622 cm−1, assigned to inner OH stretching vibration, and the peak near 914 cm−1, assigned to Al-OH bending vibration. The characteristic peaks near 4613 cm−1 for kaolinite and 4587 cm−1 for dickite correspond to the 3696 cm−1 and 914 cm−1 combination and the 3654 cm−1 and 937 cm−1 band combination, respectively. The specific corresponding values are shown in Table 4. All of the errors are within 10 cm−1 [36], and the strength is also in agreement.
Table 4.
The major NIR bands in 4500~4700 cm−1 for related samples and their corresponding MIR peaks (cm−1).
Both minerals have a weak peak near 4730 cm−1, which may be the combination of the OH stretching vibration near 3620 cm−1 and Si-O stretching vibration near 1100 cm−1 [11].
The absorption in the range of 7000–8000 cm−1 corresponds to the first fundamental overtone of OH stretching vibration (2νOH). The strongest peaks of both minerals are near 7068 cm−1, assigned to inner OH stretching vibration. The secondary peak of kaolinite near 7177 cm−1 corresponds to the outer OH stretching vibration, which is a non-infrared-active band shown in the Raman spectrum. The non-infrared-active band of dickite is located at 3645 cm−1, corresponding to the weak peak near 7100 cm−1. The specific corresponding values of the two minerals are presented in Table 5. Bishop [32] showed the overtone of the OH stretching vibration of kaolinite near 7232 cm−1, but only the dickite samples showed a similar weak peak in this study. The average factor between the OH stretching vibration and its overtone is 1.95 (±0.003) (Figure 9), not simply two-fold but slightly less, as explained by quantum mechanics [35]. Petit [37] proposed a constant k based on anharmonicity, and k = −171 cm−1 for kaolinite minerals. He considered that the relationship between OH stretching vibration and its overtone should be two-fold minus this constant k. However, this method has an error in this study and cannot well explain the relationship.
Table 5.
The major NIR bands in 7000~7250 cm−1 for related samples and their corresponding MIR peaks (cm−1).
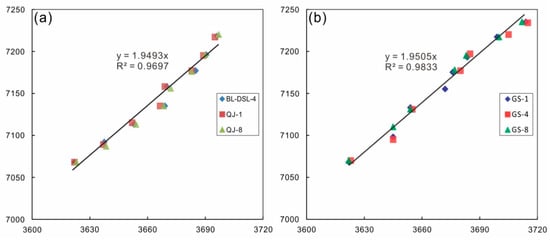
Figure 9.
Relationship between the overtone vibrations and stretching vibrations of OH: (a) relationship for kaolinite; (b) relationship for dickite.
In addition to the fundamental overtone generated by OH stretching vibration, kaolinite and dickite have three bands each that cannot match a single OH stretching vibration. Comparing the NIR spectra of the samples before and after drying, it is found that there is no obvious change, so the influence of adsorbed water is excluded. The combination of double OH stretching vibration can lead to better matching results (Table 5: fitted peaks near 7092, 7158, and 7196 cm−1 for kaolinite and fitted peaks near 7155, 7175, and 7193 cm−1 for dickite), which is also proposed in the results of Petit [37]. This combination is related to the band position of OH stretching vibration, where adjacent peaks can produce combined absorption, but there is no intuitive correlation with band type or assignment. This has not been mentioned in previous studies.
The non-infrared-active bands at 3683 cm−1 for kaolinite and 3645 cm−1 for dickite do not have corresponding peaks in the range of OH combination but have their own overtone and combined overtone above 7000 cm−1. This also provides a new method to identify the vibration of non-infrared-active bands, i.e., considering whether there is a corresponding fundamental overtone in the NIR region.
5. Conclusions
- The common characteristic peaks in the near-infrared spectra of kaolinite-group minerals are located near 4530 and 7068 cm−1, corresponding to the combination of inner OH stretching vibration and outer OH bending vibration and the first fundamental overtone of inner OH. Next to the characteristic peak, kaolinite has two secondary peaks near 4610 and 7177 cm−1, corresponding to the combination of outer OH stretching vibration and bending vibration and the overtone of outer OH stretching vibration. The secondary peak of dickite is near 4588 cm−1, corresponding to the combination of outer OH stretching vibration and inner OH bending vibration. There is no secondary characteristic peak in the first fundamental overtone region of dickite.
- The OH combination vibration of kaolinite-group minerals is located at 4000–4800 cm−1. The OH stretching vibration will be combined with the lattice deformation vibration, OH bending vibration, and Si-O vibration to form new vibration absorption. Moreover, 7000–7250 cm−1 is the first fundamental overtone region for the OH stretching vibration, with a strong absorption peak and several weak peaks. Kaolinite and dickite each have three different combined overtones for the OH stretching vibration, which are composed of adjacent OH stretching vibrations.
- The non-infrared-active OH stretching vibration of kaolinite and dickite showed an infrared-active absorption peak in the overtone region. It can be used to identify vibration types that cannot be observed by MIR spectra.
- Due to the influence of non-ideal conditions, the actual peak position of the overtone peak is lower than the theoretical position. The factor of the first fundamental overtone of the OH group stretching vibration is approximately 1.95.
Author Contributions
Conceptualization, M.H.; data curation, S.W. and B.P.; formal analysis, S.W., M.Y. and B.P.; funding acquisition, M.H.; investigation, M.Y. and B.P.; methodology, S.W. and M.Y.; resources, M.H.; writing—original draft, S.W.; writing—review and editing, S.W., M.Y. and B.P. All authors have read and agreed to the published version of the manuscript.
Funding
This research was funded by the National Mineral Rock and Fossil Specimens Resource Center (http://www.nimrf.net.cn/, accessed on 1 June 2022) to Mingyue He.
Data Availability Statement
Not applicable.
Acknowledgments
I thank my classmates for their company and help during my graduate career. I hope that you all have a happy graduation and a bright future thanks to this paper.
Conflicts of Interest
The authors declare no conflict of interest.
References
- Chen, H.Y.; Zhang, S.T.; Chu, G.B.; Zhang, Y.; Cheng, J.M.; Tian, J.; Han, J.S. The short wave infrared (SWIR) spectral characteristics of alteration minerals and applications for ore exploration in the typical skarn-porphyry deposits, Edong ore district, eastern China. Acta Petrol. Sin. 2019, 35, 3629–3643. [Google Scholar]
- Deng, Y.K.; Cao, J.J.; Dang, W.Q.; Wang, G.Q.; Liu, X.; Li, D.W. XRD and NIR Analysis of Oxidation Particles in Dabashan Polymetallic Deposit and Its Significance. Spectrosc. Spectr. Anal. 2019, 39, 2929–2934. [Google Scholar]
- Zhang, C.; Ye, F.W.; Wu, D.; Wang, J.G.; Guo, B.J. Characteristics Recognition of Imaging Spectra for Uranium Mineralization Altered Mineral Assemblage in Xiangshan. Uranium Geol. 2021, 37, 69–77. [Google Scholar]
- Farmer, V.C. (Ed.) The Infrared Spectra of Minerals; The Mineralogical Society of Great Britain & Ireland: Middlesex, UK, 1974; 539p. [Google Scholar]
- Yu, X.Y. Colored Gemmology, 2nd ed.; Geological Publishing House: Beijing, China, 2016; pp. 86–87. [Google Scholar]
- Bishop, J.L.; Lane, M.D.; Dyar, M.D.; Brown, A.J. Reflectance and emission spectroscopy study of four groups of phyllosilicates: Smectites, kaolinite-serpentines, chlorites and micas. Clay Miner. 2008, 43, 35–54. [Google Scholar] [CrossRef]
- Post, J.L.; Crawford, S.M. Uses of near-infared spectra for the identification of clay minerals. Appl. Clay Sci. 2014, 95, 383–387. [Google Scholar] [CrossRef]
- Liao, Y.P.; Cao, J.J.; Wu, Z.Q.; Luo, S.Y.; Wang, Z.Y. Near Infrared Spectroscopy of the Cretaceous Red Beds in Inner Mongolia Dongshengmiao. Spectrosc. Spectr. Anal. 2015, 35, 2521–2525. [Google Scholar]
- Guo, X.F.; Zhu, X.; Zu, E.D. Near Infrared Spectroscopy Study for Different Types of Phyllosilicate Gemstones Minerals. Bull. Chin. Ceram. Soc. 2018, 37, 2270–2273. [Google Scholar]
- Giese, R.F. Kaolin minerals: structures and stabilities. Rev. Mineral. Geochem. 1988, 19, 29–66. [Google Scholar]
- Petit, S.; Madejová, J.; Decarreau, A. Characterization of Octahedral Substitutions in Kaolinites Using Near Infrared Spectroscopy. Clays Clay Miner. 1999, 47, 103–108. [Google Scholar] [CrossRef]
- Balan, E.; Saitta, A.M.; Mauri, F.; Calas, G. First-principles modeling of the infrared spectrum of kaolinite. Am. Mineral. 2001, 86, 1321–1330. [Google Scholar] [CrossRef]
- Medeghini, L.; Mignardi, S.; De Vito, C.; Conte, A.M. Evaluation of a FTIR data pretreatment method for Principal Component Analysis applied to archaeological ceramics. Microchem. J. 2016, 125, 224–229. [Google Scholar] [CrossRef]
- Todorova, M.H.; Atanassova, S.L. Near infrared spectra and soft independent modelling of class analogy for discrimination of Chernozems, Luvisols and Vertisols. J. Near Infrared Spectrosc. 2016, 24, 271–280. [Google Scholar] [CrossRef]
- Yin, Y.S.; Yin, J.; Zhang, W.; Tian, H.; Hu, Z.M.; Feng, L.H.; Chen, D.L. Characterization of Mineral Matter in Coal Ashes with Infrared and Raman Spectroscopy. Spectrosc. Spectr. Anal. 2018, 38, 789–793. [Google Scholar]
- Rinnan, Å.; Berg, F.; Engelsen, S.B. Review of the most common pre-processing techniques for near-infrared spectra. Trends Anal. Chem. 2009, 28, 1201–1222. [Google Scholar] [CrossRef]
- Balan, E.; Lazzeri, M.; Saitta, A.M.; Allard, T.; Fuchs, Y.; Mauri, F. First-principles study of OH-stretching modes in kaolinite, dickite, and nacrite. Am. Mineral. 2005, 90, 50–60. [Google Scholar] [CrossRef]
- Johansson, U.; Frost, R.L.; Forsling, W.; Kloprogge, J.T. Raman Spectroscopy of the Kaolinite Hydroxyls at 77 K. Appl. Spectrosc. 1998, 52, 1277–1282. [Google Scholar] [CrossRef]
- Han, X. Study on the Mineralogical Characteristics of Laos Stones. Master’s Thesis, China University of Geosciences, Wuhan, China, 2019. [Google Scholar]
- Jiang, J.P. Study on the Mineralogical Characteristics of Laos Stones. Master’s Thesis, China University of Geosciences, Beijing, China, 2020. [Google Scholar]
- Farmer, V.C. Differing effects of particle size and shape in the infrared and Raman spectra of kaolinite. Clay Miner. 1998, 33, 601–604. [Google Scholar] [CrossRef]
- Balan, E.; Delattre, S.; Guillaumet, M.; Salje, E.K. Low-temperature infrared spectroscopic study of OH-stretching modes in kaolinite and dickite. Am. Mineral. 2010, 95, 1257–1266. [Google Scholar] [CrossRef]
- Frost, R.L.; Johansson, U. Combination Bands in the Infrared Spectroscopy of Kaolins—A Drift Spectroscopic Study. Clays Clay Miner. 1998, 46, 466–477. [Google Scholar] [CrossRef]
- Castellano, M.; Turturro, A.; Riani, P.; Montanari, T.; Finocchio, E.; Ramis, G.; Busca, G. Bulk and surface properties of commercial kaolins. Appl. Clay Sci. 2010, 48, 446–454. [Google Scholar] [CrossRef]
- Frost, R.L.; Kloprogge, J.T. Towards a single crystal Raman spectrum of kaolinite at 77 K. Spectrochim. Acta Part A: Mol. Biomol. Spectrosc. 2001, 57, 163–175. [Google Scholar] [CrossRef]
- Dong, J.K.; Du, Y.S. A Study of Mineralogical Characteristics of Larderite Deposits in Fujian Province. Acta Geosci. Sin. 2017, 38, 208–222. [Google Scholar]
- Yuan, Y.; Shi, G.H.; Lou, F.S.; Wu, S.J.; Shi, M.; Huang, A.J. Mineralogical and Spectral Characteristics of “Gaozhou Stone” from Jiangxi Province. Spectrosc. Spectr. Anal. 2015, 35, 65–70. [Google Scholar]
- Hu, X.C.; Yan, J.; Zhu, X.M. The Specific IR Spectra of Qingtian Stones from Zhejiang. Phys. Test. Chem. Anal. (Part B Chem. Anal.) 2016, 52, 24–28. [Google Scholar]
- Han, W.; Ke, J.; Chen, H.; Lu, T.J.; Yin, K. Diffuse Reflectance Spectroscopy of Red Colored “Laowo Stone”. Spectrosc. Spectr. Anal. 2016, 36, 2634–2638. [Google Scholar]
- Liu, Y.G.; Chen, T. Infrared and Raman Spectra Study on Tianhuang. Spectrosc. Spectr. Anal. 2012, 32, 2143–2146. [Google Scholar]
- Johnston, C.T.; Helsen, J.; Schoonheydt, R.A.; Bish, D.L.; Agnew, S.F. Single-crystal Raman spectroscopic study of dickite. Am. Mineral. 1998, 83, 75–84. [Google Scholar] [CrossRef]
- Frost, R.L.; Tran, T.H.; Rintoul, L.; Kristof, J. Raman microscopy of dickite, kaolinite and their intercalates. The Analyst 1998, 123, 611–616. [Google Scholar] [CrossRef]
- Bishop, J.L.; Pieters, C.M.; Edwards, J.O. Infrared spectroscopic analyses on the nature of water in montmorillonite. Clays Clay Miner. 1994, 42, 702–716. [Google Scholar] [CrossRef]
- Wu, S.; He, M.Y.; Yang, M.; Zhang, B.Y.; Wang, F.; Li, Q.Z. Near-Infrared Spectroscopy Study of Serpentine Minerals and Assignment of the OH Group. Crystals 2021, 11, 1130. [Google Scholar] [CrossRef]
- Bishop, J.; Murad, E.; Dyar, M.D. The influence of octahedral and tetrahedral cation substitution on the structure of smectites and serpentines as observed through infrared spectroscopy. Clay Miner. 2002, 37, 617–628. [Google Scholar] [CrossRef]
- Baron, F.; Petit, S. Interpretation of the infrared spectra of the lizardite-nepouite series in the near- and mid-infrared range. Am. Mineral. 2016, 101, 423–430. [Google Scholar] [CrossRef]
- Petit, S.; Decarreau, A.; Martin, F. Refined relationship between the position of the fundamental OH stretching and the first overtones for clays. Phys. Chem. Miner. 2005, 31, 585–592. [Google Scholar] [CrossRef]
Publisher’s Note: MDPI stays neutral with regard to jurisdictional claims in published maps and institutional affiliations. |
© 2022 by the authors. Licensee MDPI, Basel, Switzerland. This article is an open access article distributed under the terms and conditions of the Creative Commons Attribution (CC BY) license (https://creativecommons.org/licenses/by/4.0/).