Abstract
In a batch reactor, the EF advanced oxidation decolorization of aqueous solutions of methyl orange MO, a commercial azo reactive textile dye, was investigated in the presence of two different electrodes. The evaluation included various operational variables such as the IC current intensity (60 mA, 80 mA, and 100 mA), initial concentration of pollutant MO (20 mg/L, 40 mg/L, and 60 mg/L), initial pH of solution (3, 5, and 7), temperature of solution (20 °C, 30 °C, and 50 °C), and initial concentration of catalyst [Fe2+] (0.1 mM, 0.2 mM, and 0.3 mM) on the discoloration rate. A Box-Behnken Design of Experiment (BBD) was used to optimize the parameters that directly affect the Electro-Fenton (EF) process. Under the optimal experimental conditions such as [Fe2+] = 0.232 mM, pH = 3, IC = 80 mA, [MO] = 60 mg/L, and T = 30 ± 0.1 °C, the maximum discoloration rate achieved was 94.9%. The discoloration of the aqueous MO solution during the treatment time was confirmed by analysis of the UV-visible spectrum. After a review of the literature on organic pollutant degradation, the EF system provided here is shown to be one of the best in terms of discoloration rate when compared to other AOPs.
1. Introduction
The treatment of wastewater from diverse industrial processes is one of the world’s most difficult challenges today [1]. The industrial sector consumes a huge amount of water, and its effluent comprises a variety of substances [2]; synthetic dyes are the most frequent [3]. Degradation of these refractory organic pollutants by conventional methods such as adsorption, membrane filtration, coagulation, and biological methods have proven ineffective in removing most of the labeled refractory organic compounds due to their slow reaction rates, harmfulness to bacteria and yeast strains [4,5], sludge removal, and requirement for rigorous pH and temperature control. Advanced oxidation processes (AOPs) have been the topic of several articles in the quest for techniques suited for the entire removal of refractory organic pollutants due to their simplicity of operation, low equipment requirements, and low cost and abatement efficiency compared to the other methods mentioned above [6,7], as well as its ability to degrade several types of hazardous organic compounds [8,9]. Among AOPs, the Electro-Fenton (EF) process has been successfully applied to treat and mineralize refractory organic pollutants (azo dye, real textile, and pharmaceutical pollutants). This process is based on a well-known fundamental reaction called the Fenton reaction (1) for the in-situ creation of hydroxyl radicals (OH.) which react non-selectively and are capable of oxidizing all organic molecules until total mineralization [10,11].
H2O2 + Fe2+ ➔ Fe3+ + OH− + OH
Fe3+ + 1e− ➔ Fe2+
O2 + 2H++2e− ➔ H2O2
Fe2+ + OH− ➔ Fe3+ + OH−
However, similar to the other AOPs, total decolorization of a dye is rarely observed or is only obtained after an unreasonably long time with very high energy consumption in the Electro-Fenton process. In this experiment, a strategy based on initiating the reaction with catalytic amounts of hydrogen peroxide was used to improve the efficiency of the process, resulting in a high rate of discoloration in a short period and lower energy usage.
The statistical approach of using designs of experiments (Doe) is a powerful tool in process optimization when dealing with multi-factors [12]. In terms of process optimization, combining experience plans with response surfaces is a method that is based on well-structured logic and produces faster and more reliable results [13].
In this study, the Doe methodology was applied to optimize the discoloration rate of an aqueous solution of a commercial textile dye, methyl orange MO, by the Electro-Fenton process. More specifically, the objectives of this study are to (i) test the EF process in the degradation of an anionic textile dye MO, (ii) follow the evolution of factors such as the concentration of Fe2+ ions, pH, applied current (IC), the initial concentration of the pollutant [MO], and solution temperature that have a direct influence on the EF process, and (iii) optimize the discoloration rate by applying the Doe method using a response surface design called Box-Behnken (BBD).
2. Results and Discussion
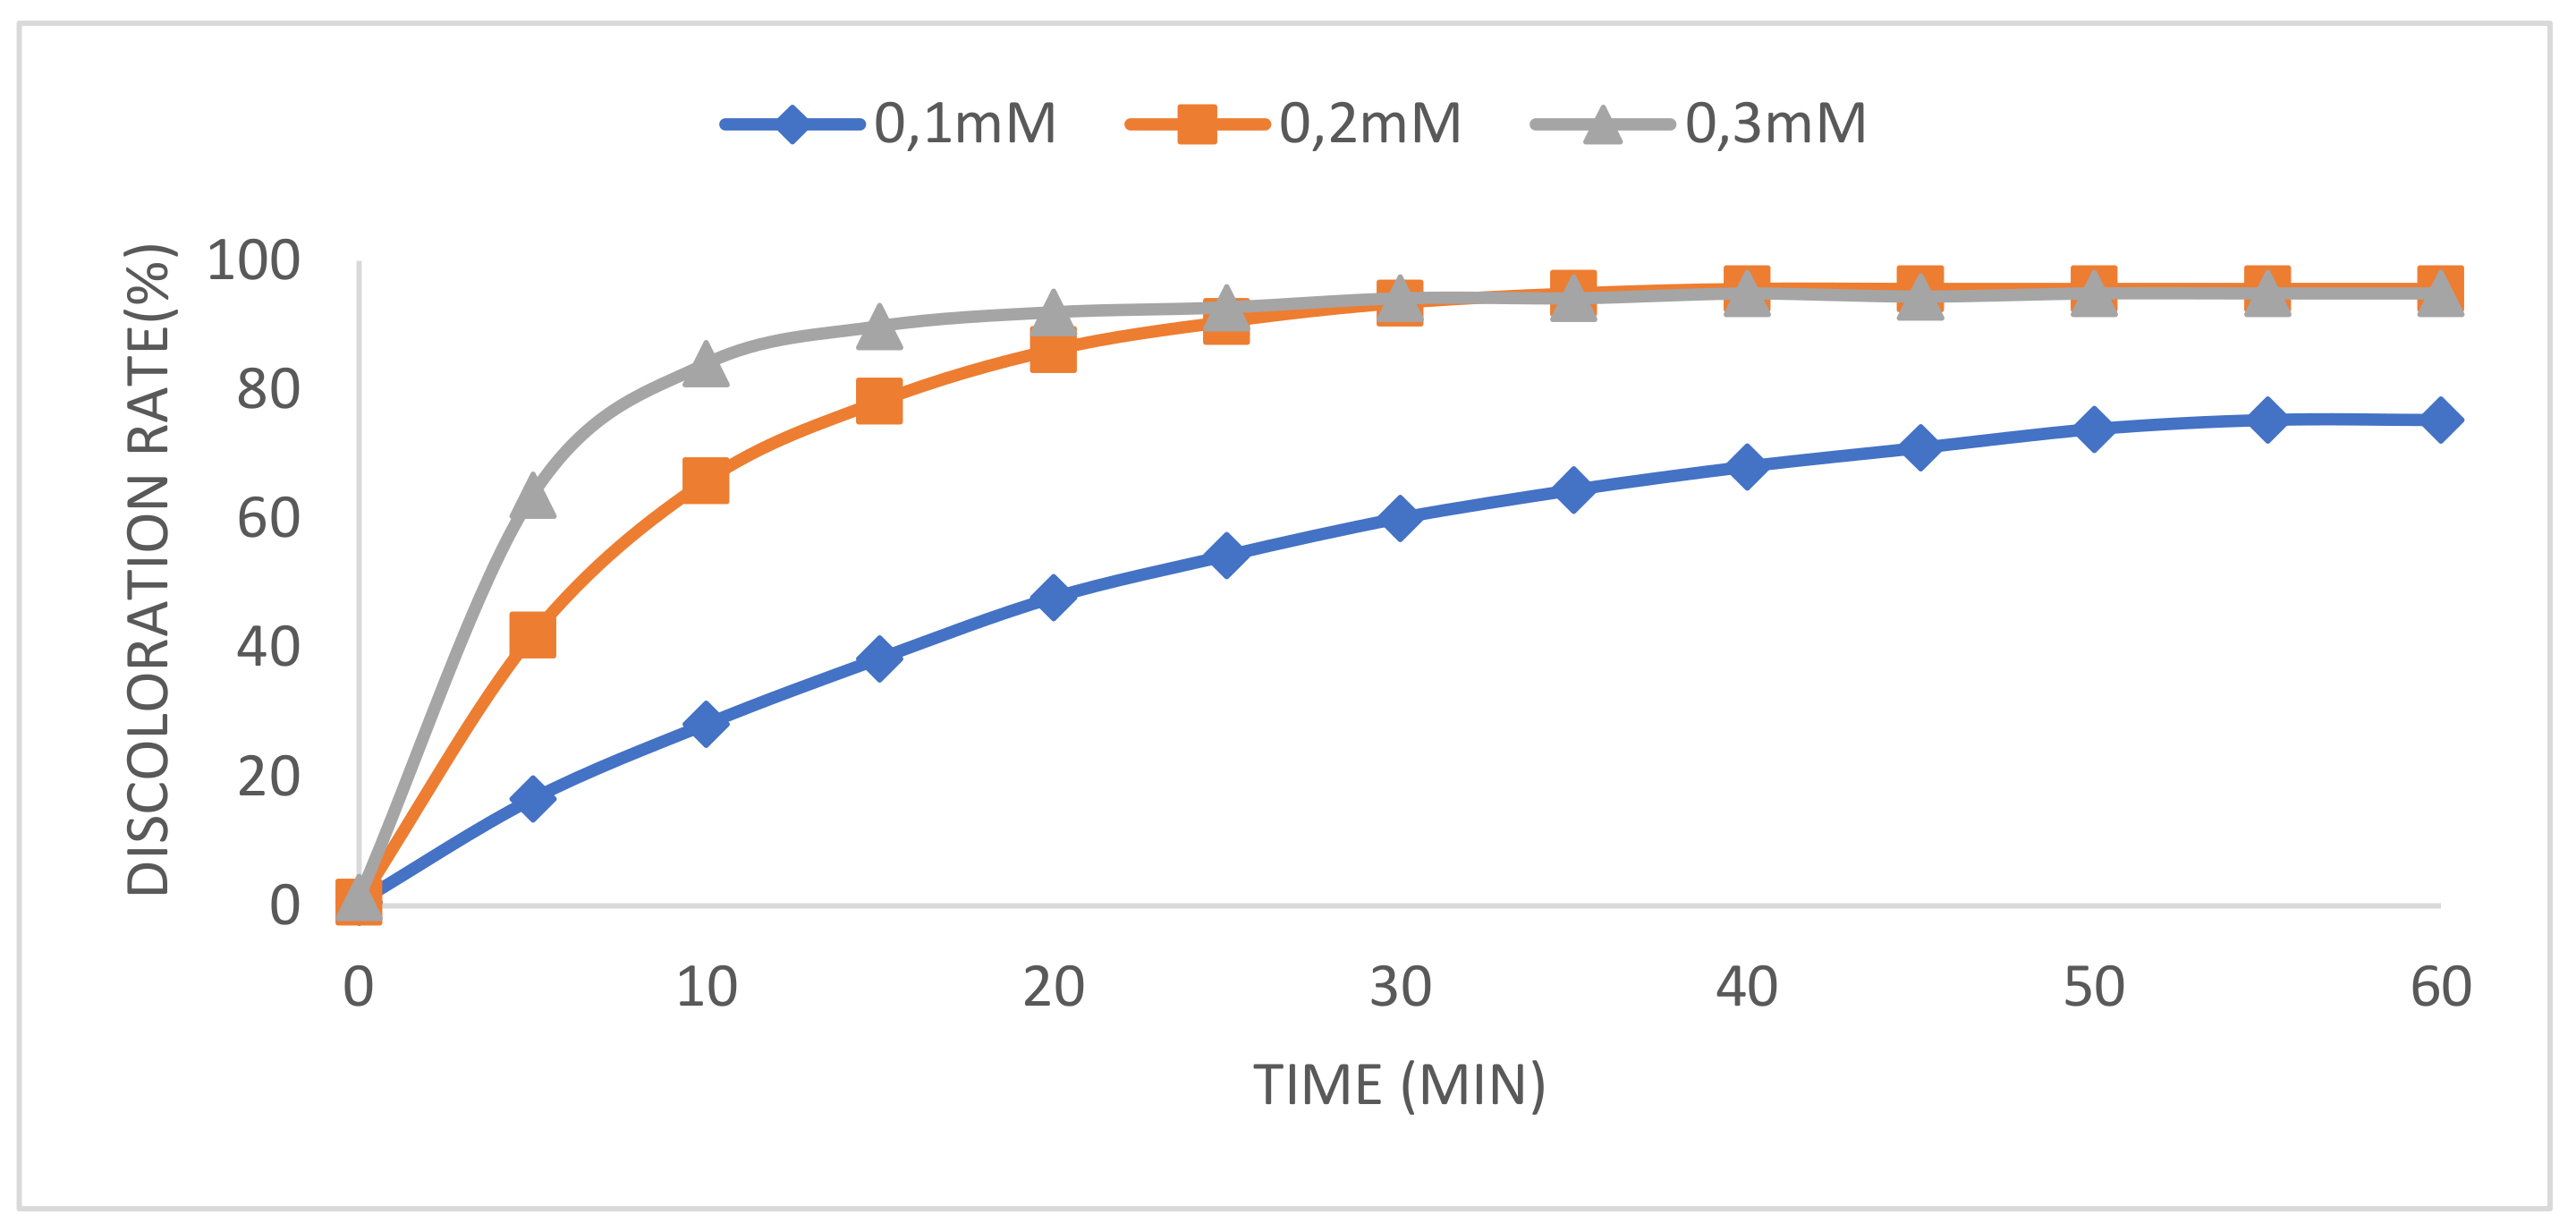
2.1. Effect of Catalyst Concentration
In the Electro-Fenton process, Fe2+ ions function as an important catalyst, and their existence in the solution has a significant impact on the process efficiency [14]. Fe2+ ions promote the generation of hydroxyl radicals in the reaction medium [15]. The effect of ferrous ion concentration on discoloration rate is shown in Figure 1. With an increase in ferrous ion concentration from 0.1 mM to 0.3 mM, the discoloration rate efficiency increases from 47.75% to 92.01% in the first 20 min. However, after 50 min, increasing the ferrous ion concentration from 0.2 mM to 0.3 mM results in a decrease in color removal efficiency from 93.09% to 91.55%. Perhaps an excess of Fe2+ in the solution promotes the production of iron sludge while also increasing the OH. scavenging action by Fe2+ reaction 4, which has a detrimental impact on organic pollutant degradation [16,17]. It is clear that the concentration of Fe2+ has a significant impact on the generation of HO. hydroxyl radicals and consequently the degradation of organic pollutants in the aqueous solution [18].
Figure 1.
Effect of initial Fe2+concentration on discoloration rate. Reaction condition: [MO] = 20 mg/L, 50 mM Na2SO4, [Ic] = 100 mA, 8.8 mM H2O2, and pH = 3, T = 30 ± 0.1 °C.
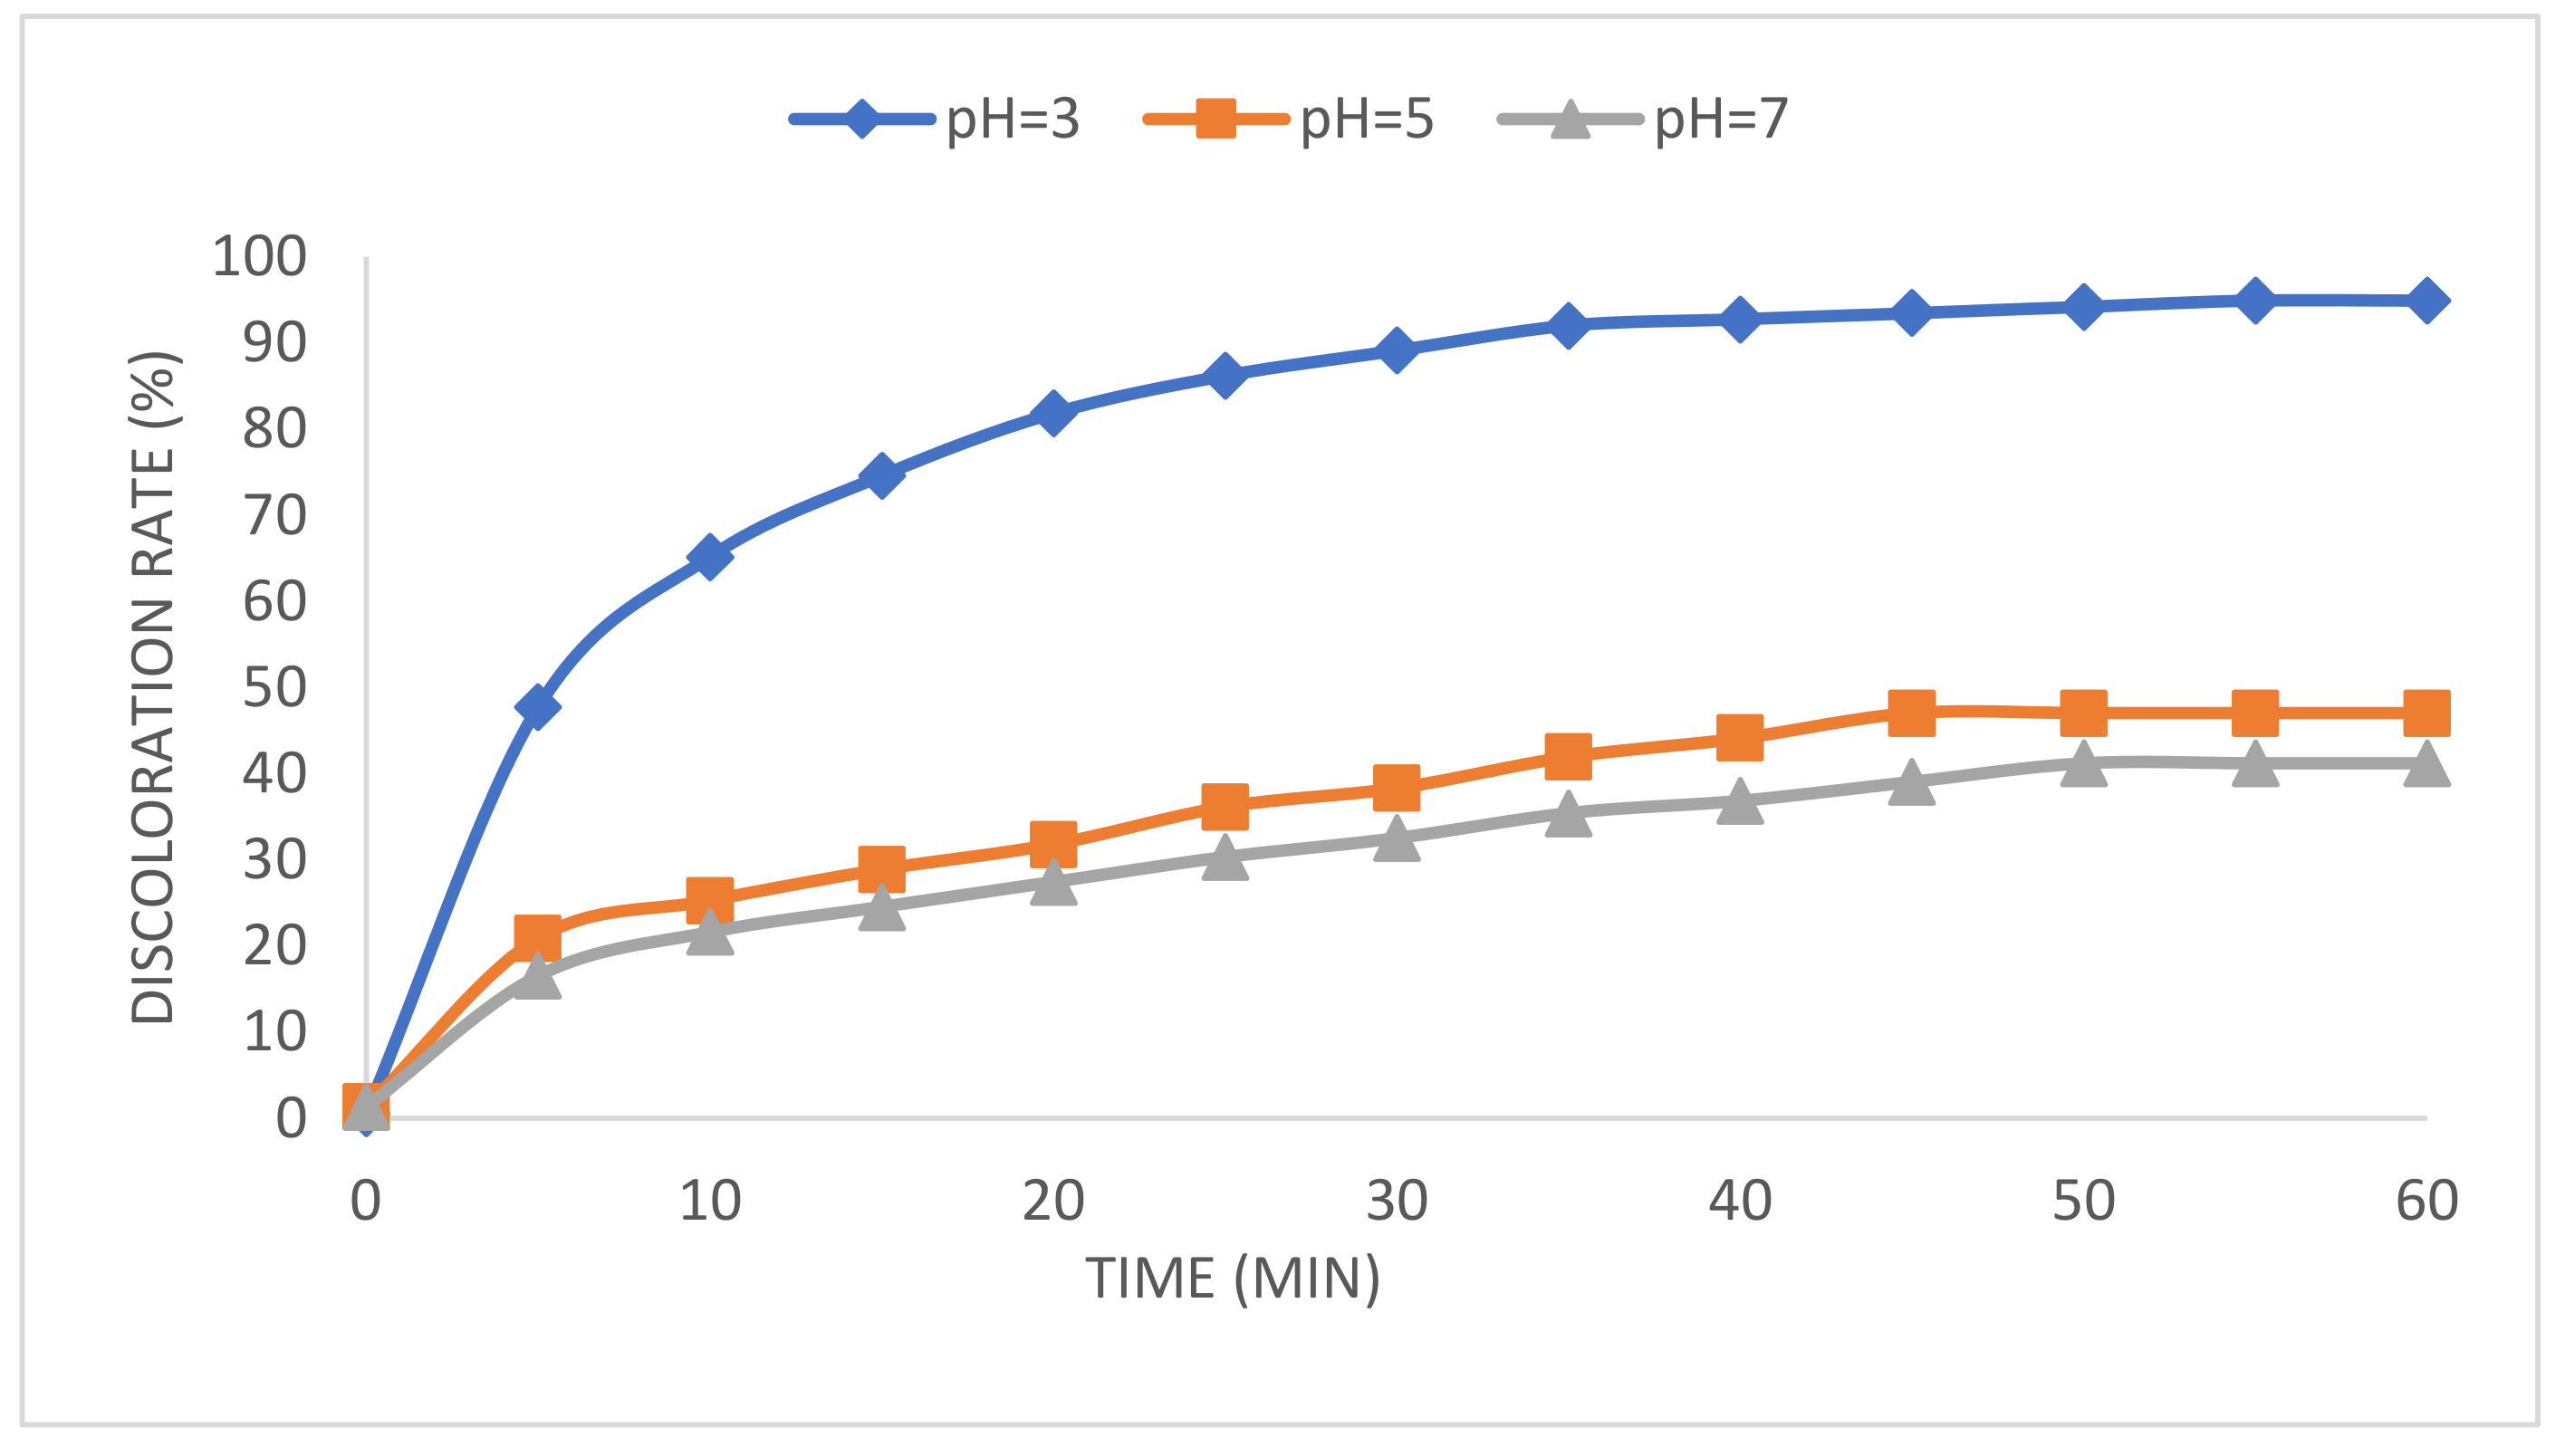
2.2. Effect of Solution pH
The EF process’s oxidation efficiency and in-situ OH. production in the reaction medium were both influenced by the pH of the wastewater [19]. Tests were performed at three different initial pH values (3, 5, or 7) to evaluate the impact of pH on the rate of discoloration (Figure 2). The EF process attained at pH = 5 and 7 had discoloration rates of 47.02% and 41.21%, respectively, because the hydrolysis and precipitation of Fe3+ become stronger when the pH is a high value. Therefore, the capacity of Fe3+ decreases [20]. When the pH is almost equal to 3, the efficiency of the EF process reaches a very high discoloration rate of almost 94%. The increase in the rate of discoloration can be explained by the increase in the activity of Fe(OH)+ in the aqueous solution [21]. This result is consistent with the findings of other researchers who reported that the Electro-Fenton process has an optimum pH of about 3 [22,23].
Figure 2.
Effect of initial pH on the rate of discoloration. Reaction condition: [MO] = 20 mg/L 50 mM Na2SO4, [IC] = 100 mA, 0.2 mM Fe2+, 8.8 mM H2O2, and T = 30 ± 0.1 °C.
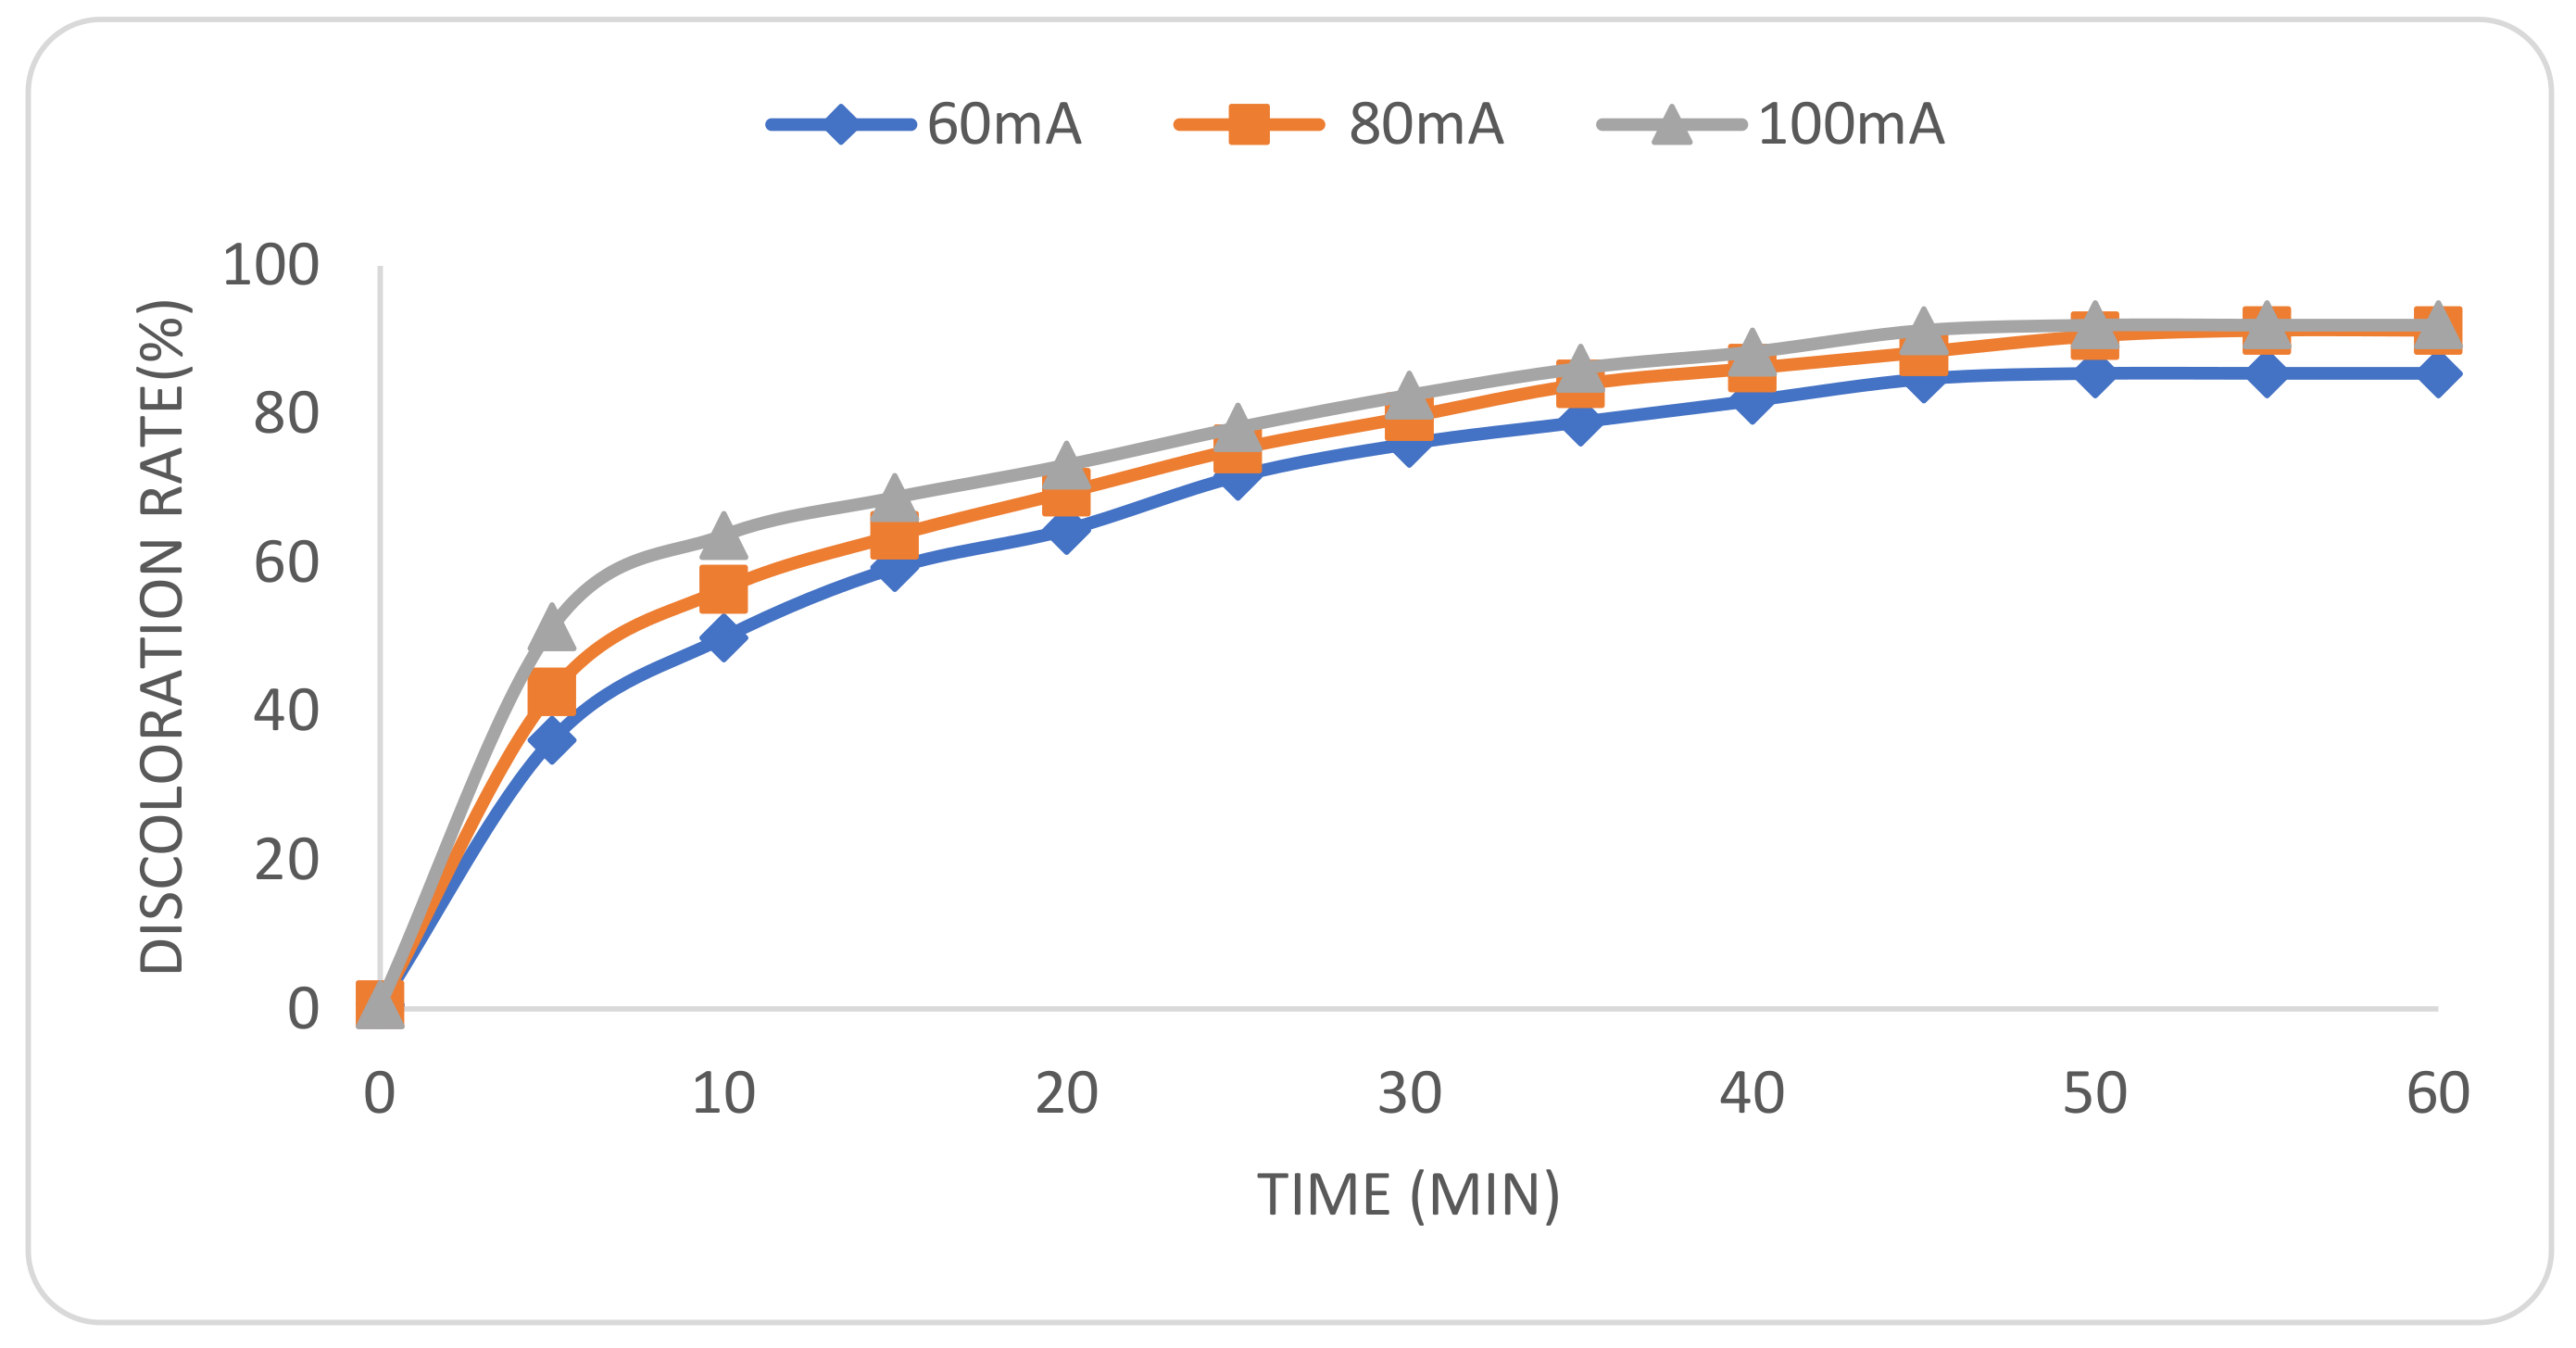
2.3. Effect of Applied Current
The current intensity is a critical parameter in electrochemistry since it influences oxidation efficiency [24]. The impact of the current intensity on the processing efficiency of the electrochemical system was investigated using different current intensities ranging from 60 to 100 mA. The rate of discoloration rises in proportion to the applied current’s intensity [25]. In all cases, the rate of discoloration was much quicker during the first 20 min of electrolysis, as indicated in Figure 3. The discoloration rate reached more than 94% with an intensity of 80 mA and 100 mA and an electrolysis time of less than 50 min. It is possible that increasing the current IC causes a quick increase in the formation of OH. hydroxyl radicals in the reaction media [26,27]. However, with an intensity of 60 mA and an electrolysis time of 60 min, the process allows for a discoloration rate of 85%, indicating that the current intensity applied improves the performance of the EF oxidation process.
Figure 3.
Effect of current intensity on discoloration rate [MO] = 20 mg/L, 50 mM Na2SO4, IC = 100 mA, PH = 3, 0.2 mM Fe2+; 8.8 mM H2O2, and T = 30 ± 0.1 °C.
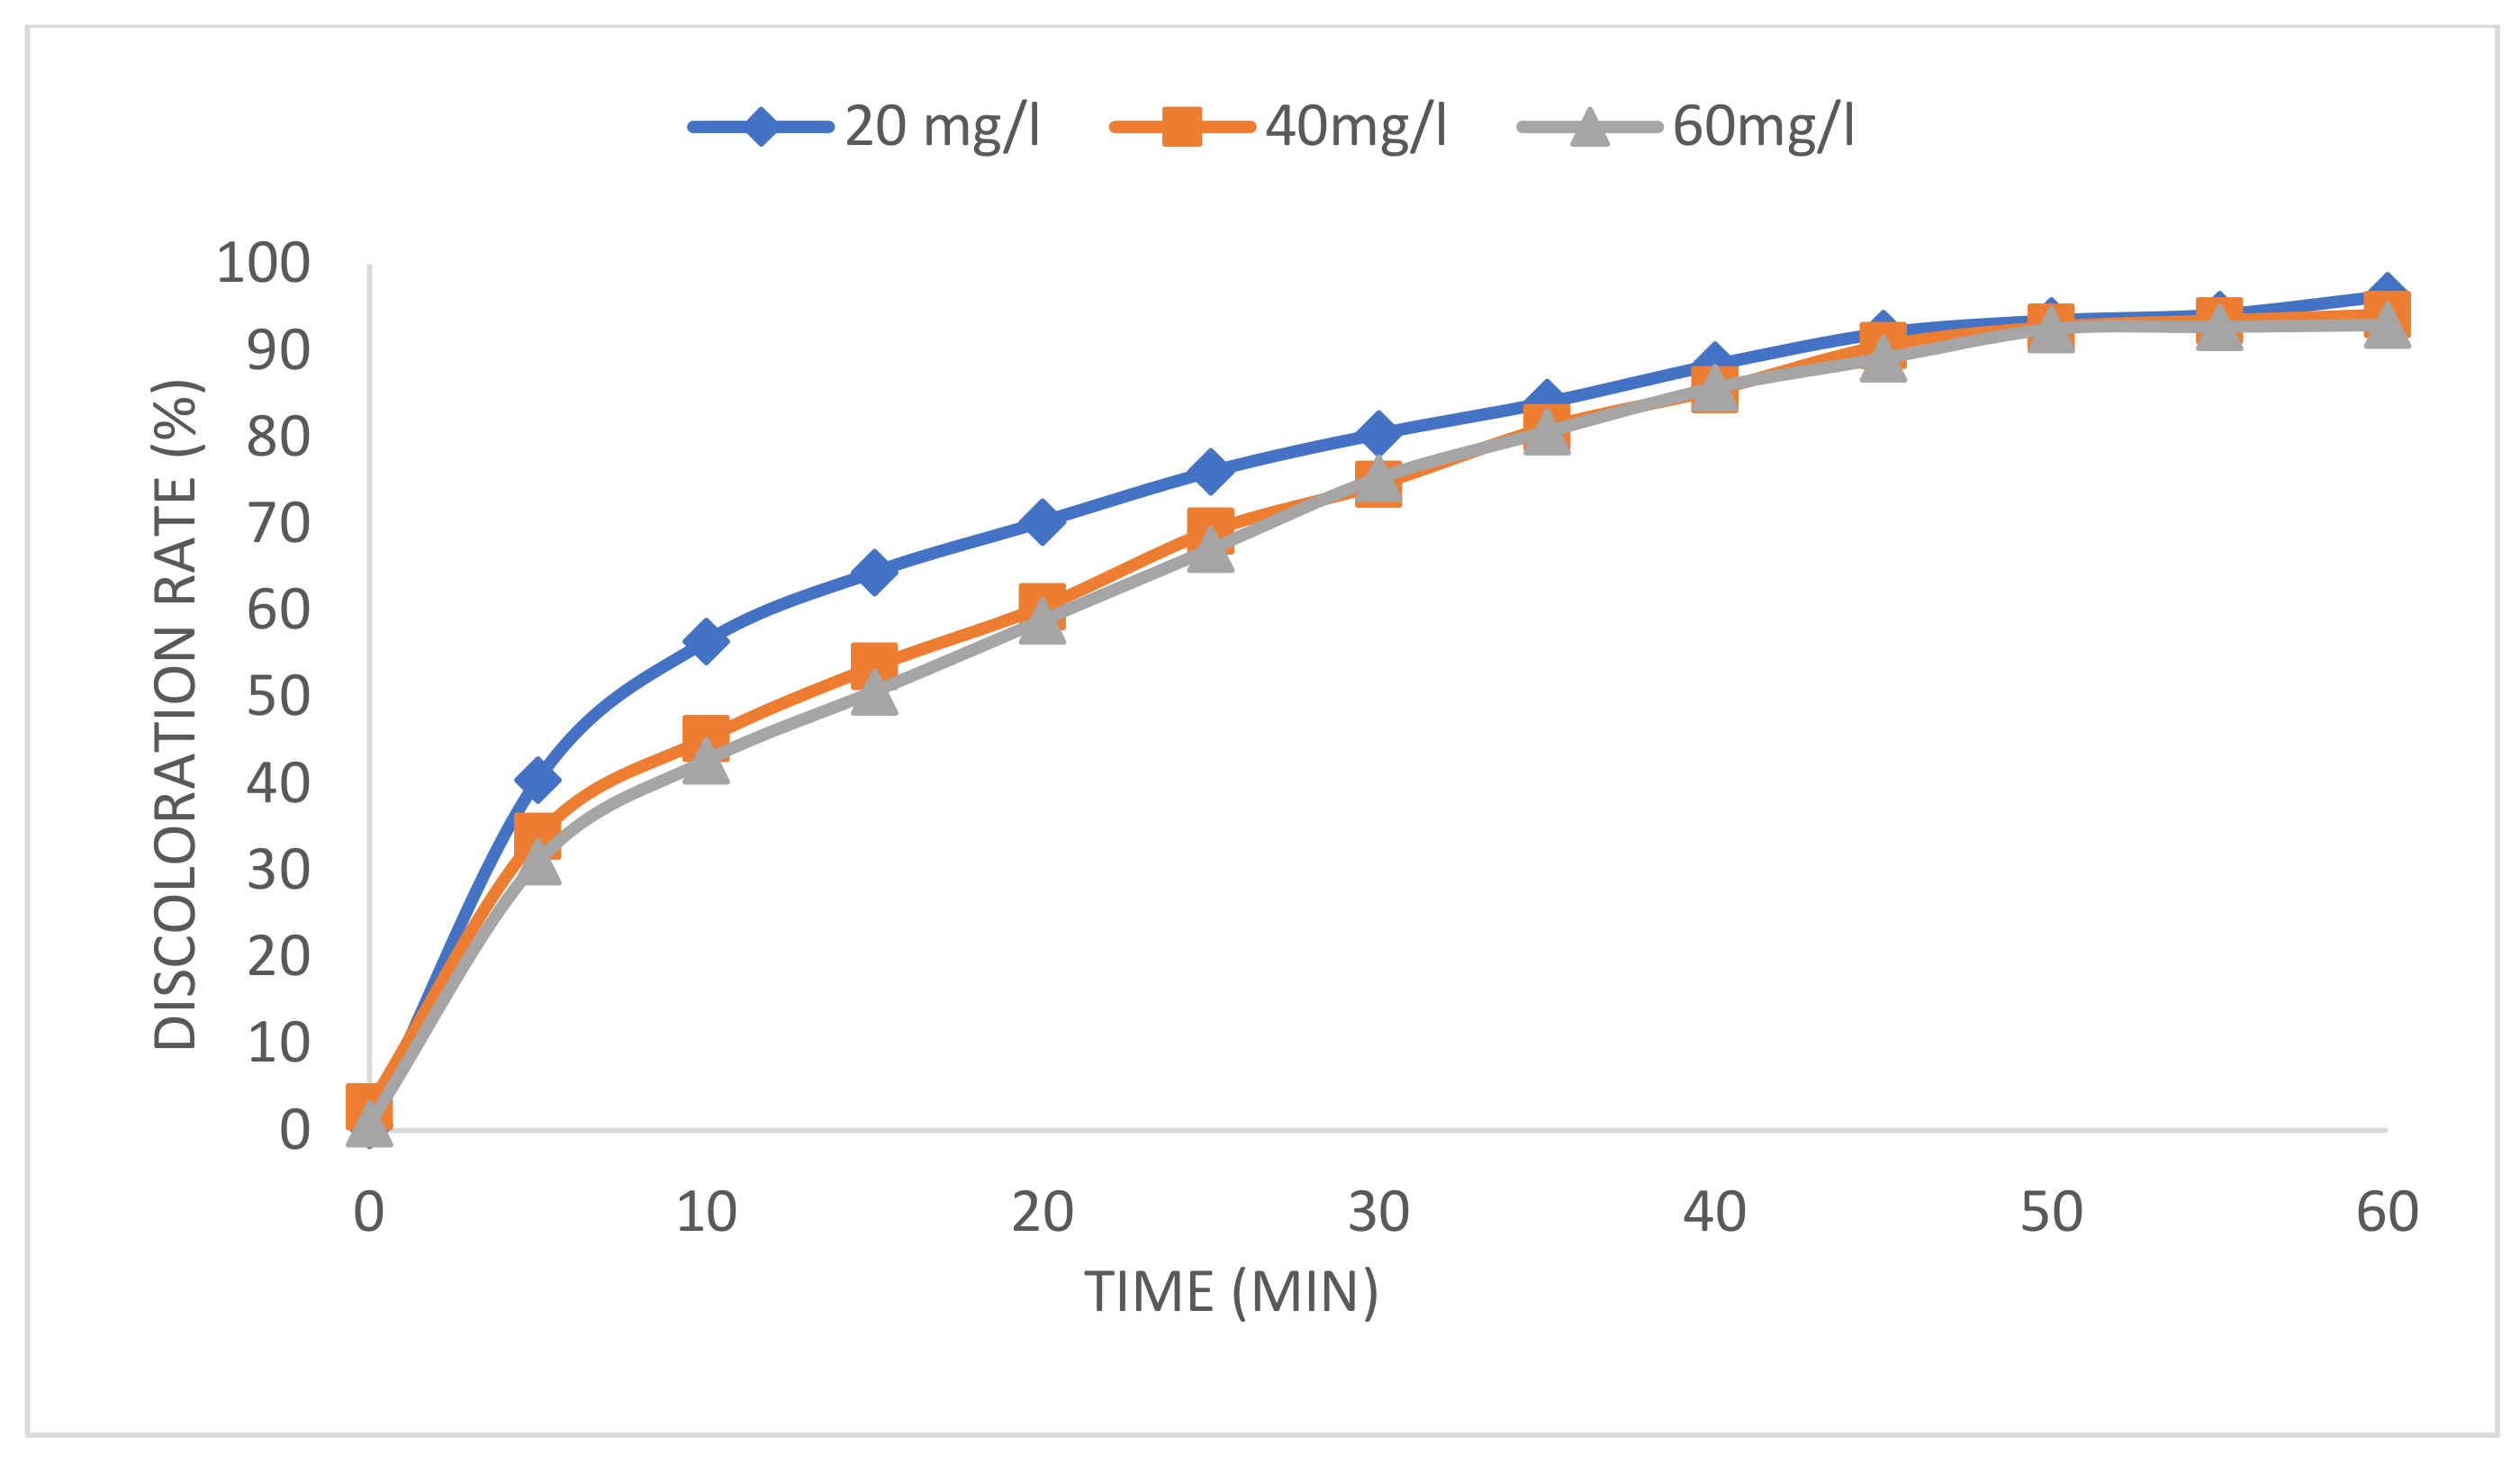
2.4. Effect of Initial Dye Concentrations
Initial dye concentrations are one of the most important components of the degradation reaction from the standpoint of application [28]. Figure 4 shows the discoloration efficiency as a function of electrolysis times; the dye was prepared at different concentrations from 20 mg/L to 60 mg/L. This result shows that for the first 30 min of electrolysis, the discoloration efficiency decreases from 80.4% to 75.3% when the concentration of pollutant increases from 20 mg/L to 60 mg/L, moreover the increase in organic pollutant concentration always leads to a decrease in the discoloration rate and prolongs the life of electrochemical oxidation process [14]. This can be explained by reaction 1’s reduction of H2O2 and Fe2+, or by the slower oxidation of a larger amount of organic matter with the same amount of hydroxyl radicals [29]. Therefore, it was insufficient to degrade organic pollutants at high concentrations. These results are confirmed by the findings of other researchers [30,31].
Figure 4.
Effect of initial dye concentration on discoloration rate. Reaction condition: 50 mM Na2SO4, IC = 100 mA, pH = 3, 0.2 mM Fe2+, [H2O2] = 8.8 mM, and T = 30 ± 0.1 °C.
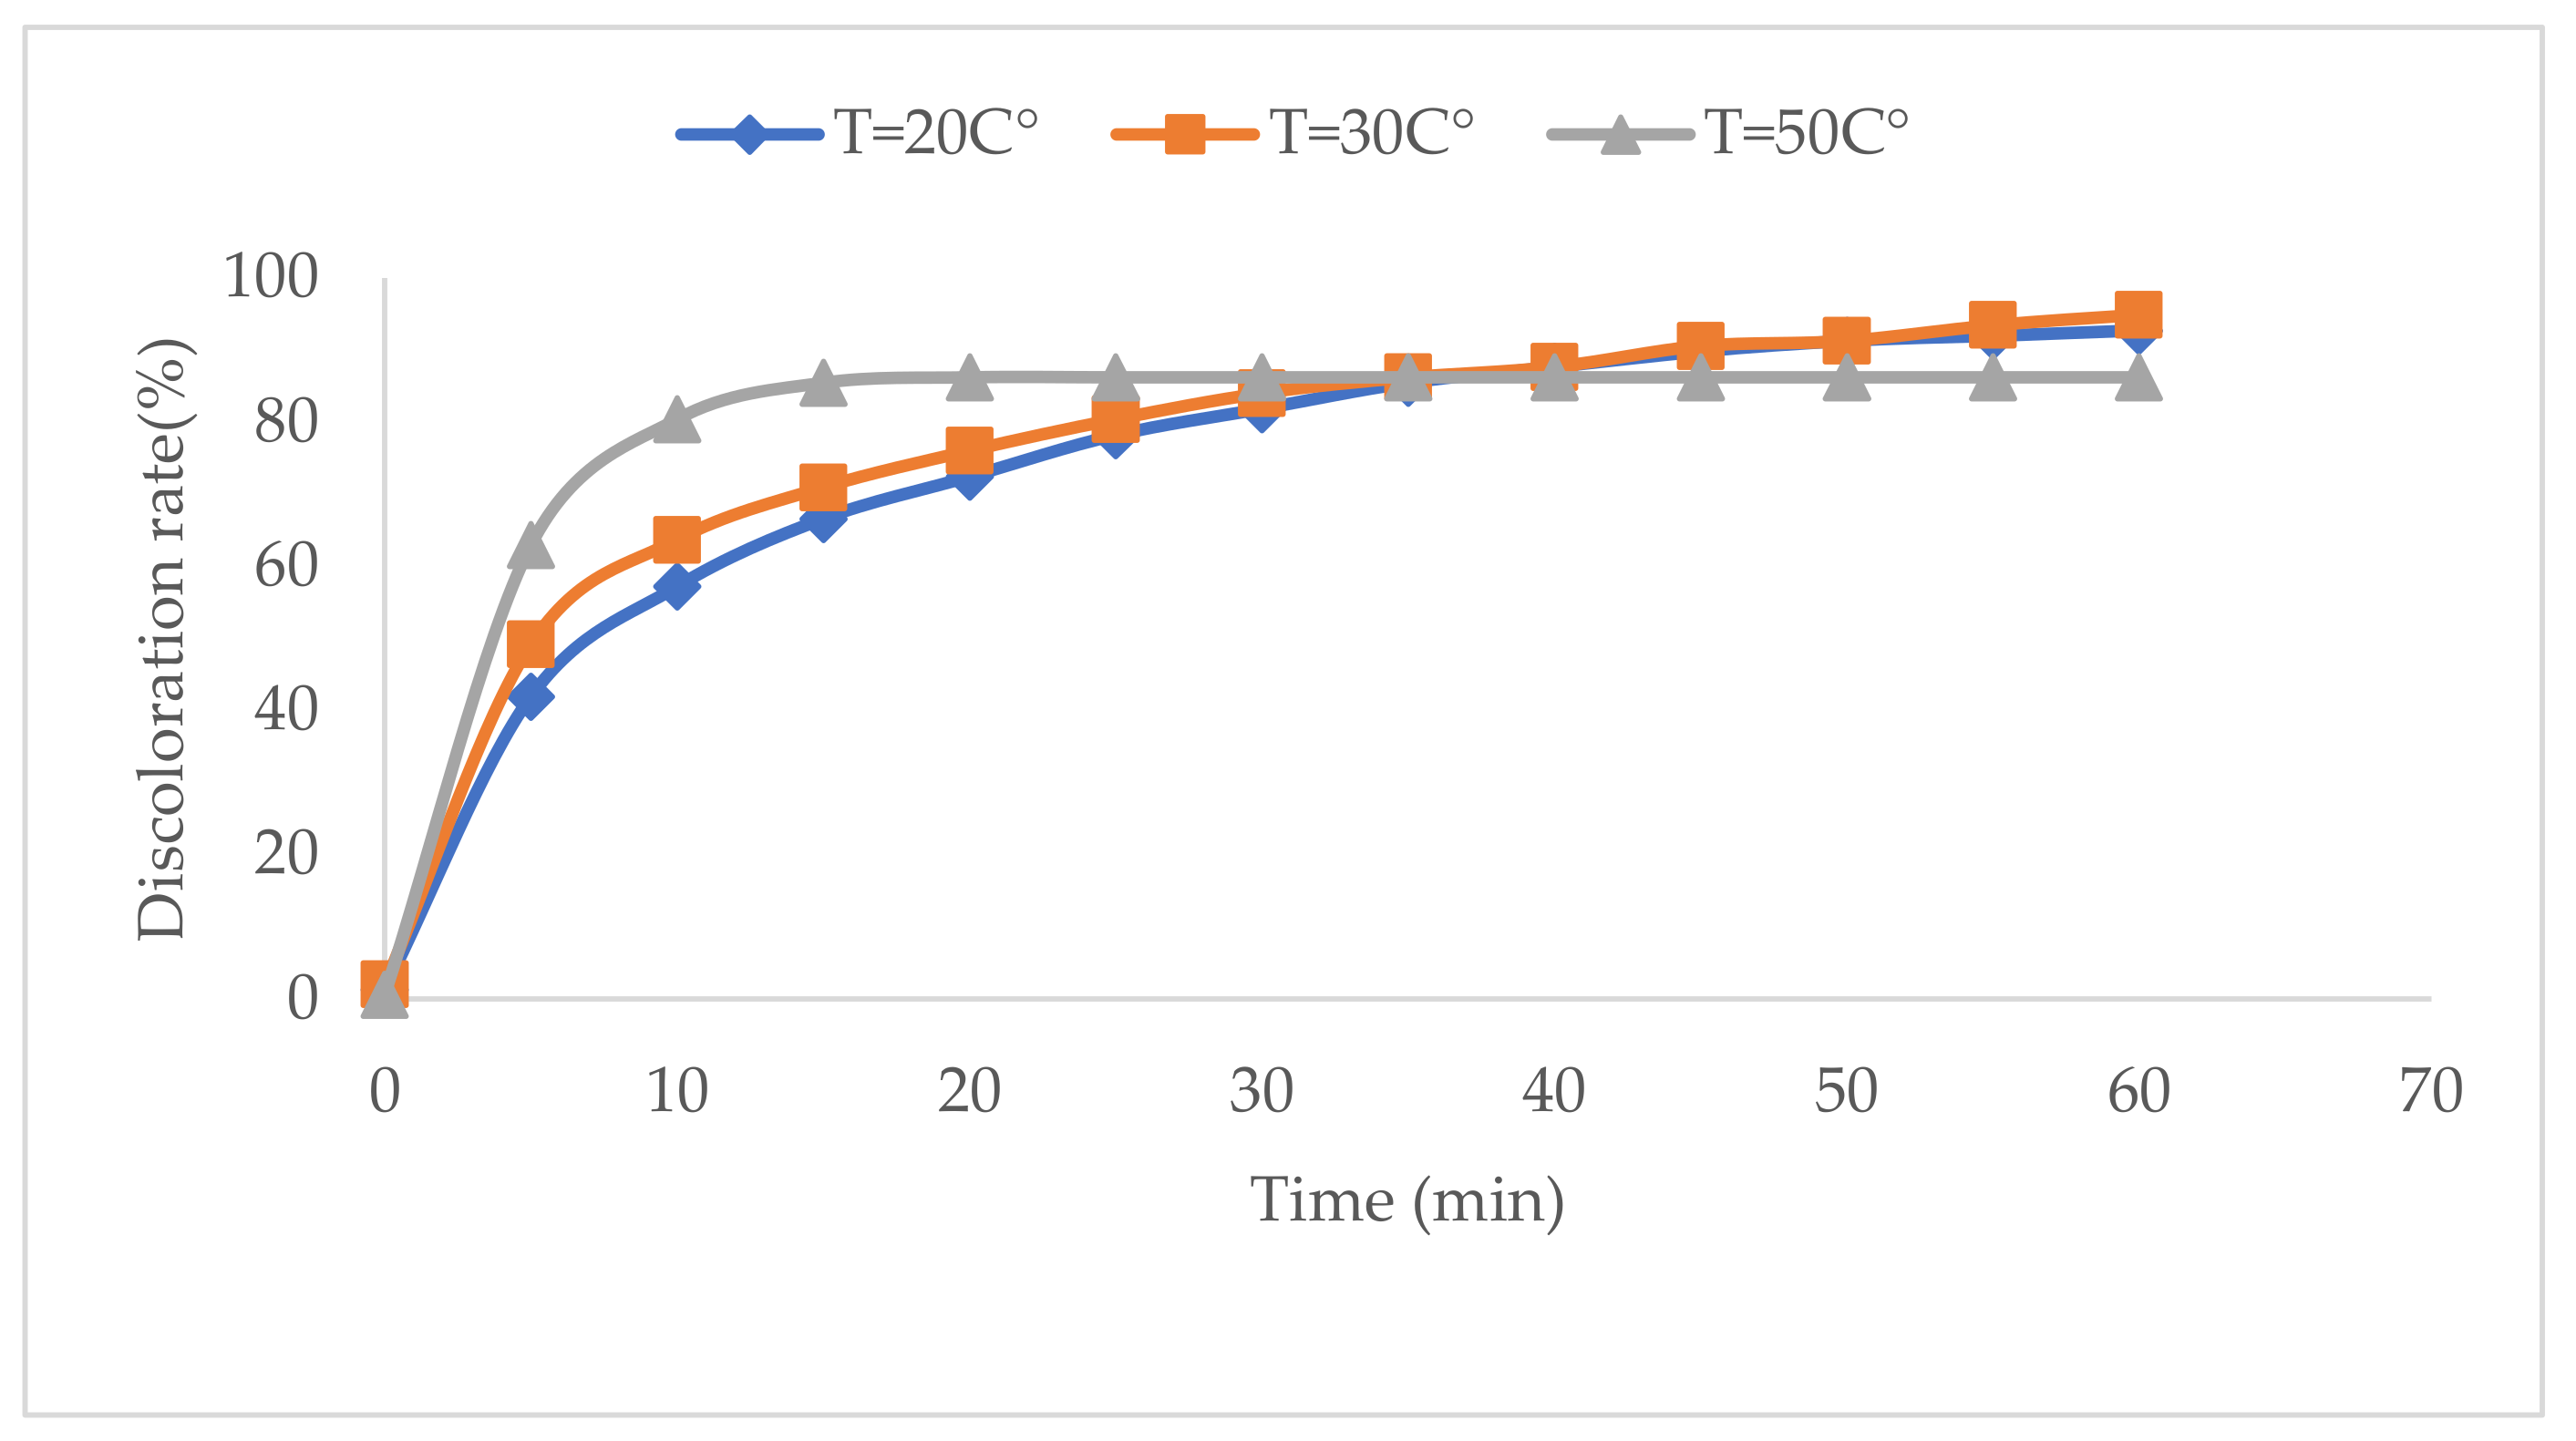
2.5. Effect of Temperature
The effect of temperature on dye degradation was studied at 20, 30, and 50 °C and the results obtained are presented in Figure 5. The discoloration efficiency during the first 20 min increases from 72.42% to 86.21% when the temperature increases from 20 °C to 50 °C, respectively. These results show that increasing the temperature can promote the creation of hydroxyl radicals oxidizing the dye molecules [32]. Indeed, the temperature of the solution has an impact on the rate of electron transfer and, thus, on the rate of Fe2+ regeneration. However, 30 °C as the working temperature seems to be a reasonable choice [33] because when we increase the temperature from 20 °C to 30 °C, and after 50 min of electrolysis, we notice an increase in the discoloration rate of about 2%. On the other hand, we observe a decrease of about 8% when the temperature increases from 30 °C to 50 °C. The negative effect of temperature on the rate of discoloration, can be explained by the lower concentration of dissolved oxygen and the self-decomposition of hydrogen peroxide at high temperature [34].
Figure 5.
Effect of solution temperature on discoloration rate. Reaction condition: [MO] = 20 mg/L, 50 mM Na2SO4, IC = 100 mA, pH = 3, [Fe2+] = 0.2 Mm, and [H2O2] = 8.8 mM.
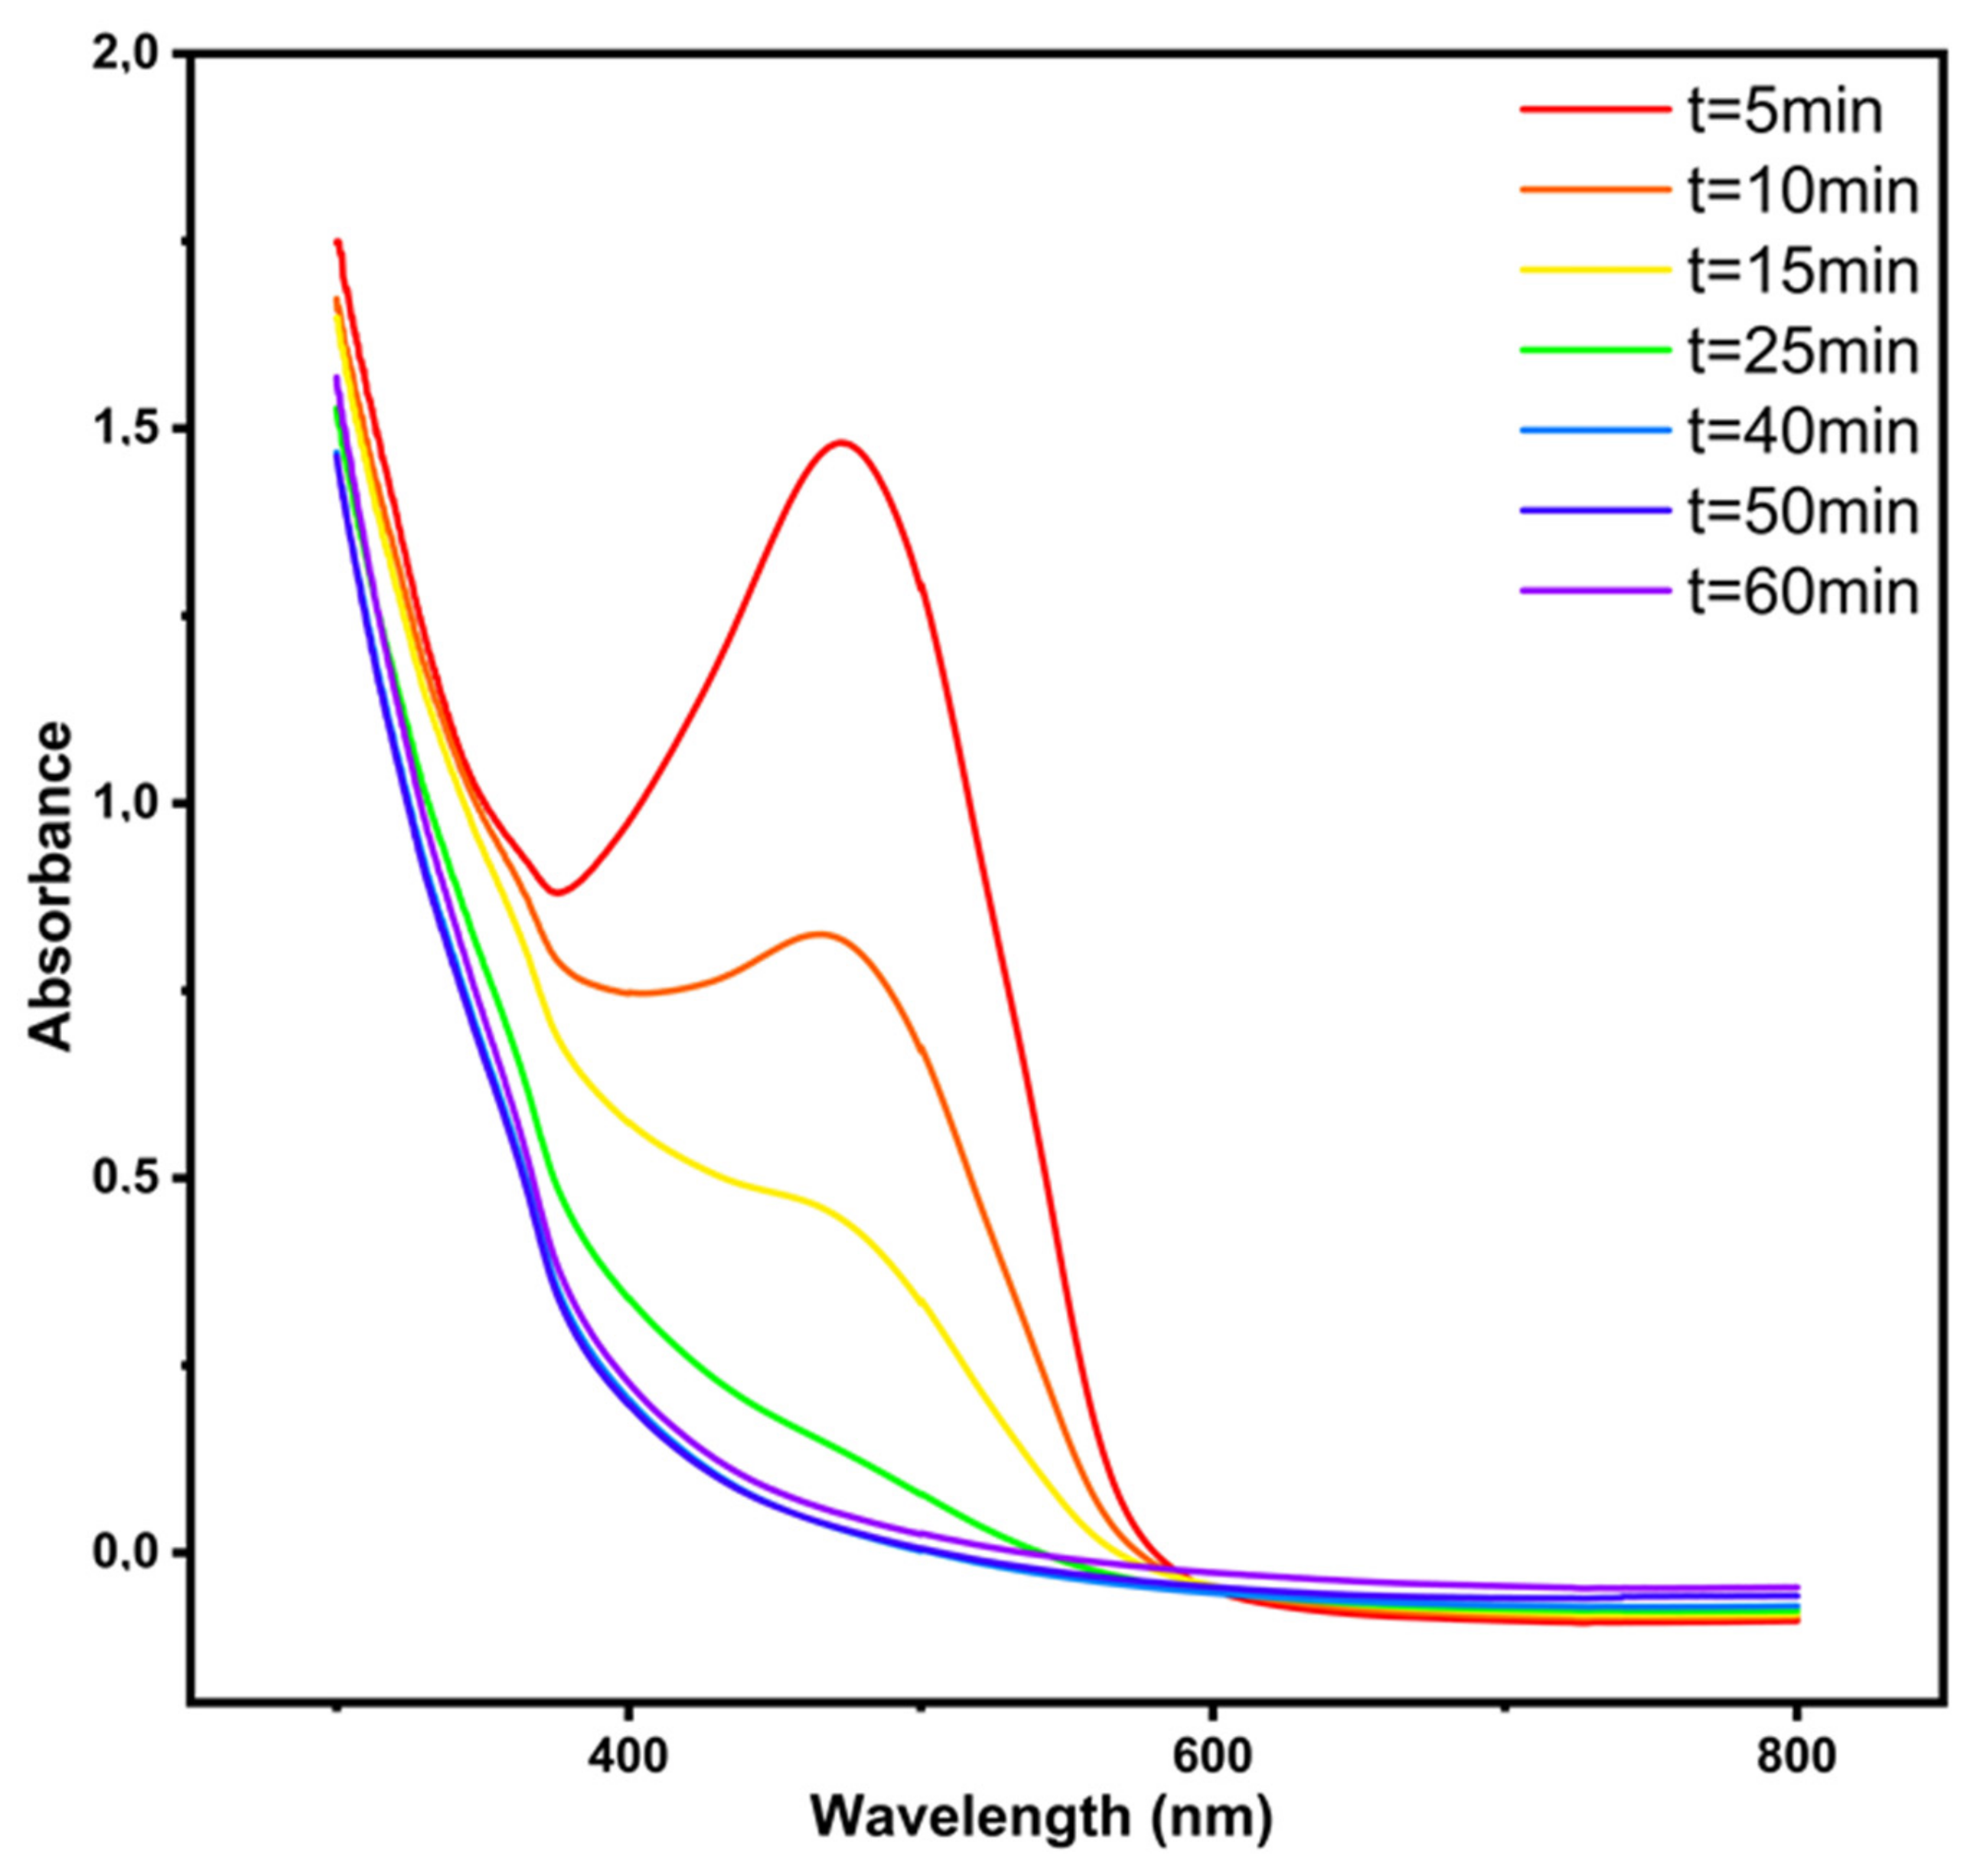
2.6. Evolution of the Methyl Orange Solution’s UV-Visible Spectra
Figure 6 shows the evolution of the UV-visible spectra of the 60 mg/L methyl orange solution as a function of the electrolysis time. We see before treatment appears a broad absorption band of about 400–500 nm that characterizes the azo group [35]. This absorption band decreases steadily and in the same ratio throughout the electrolysis until it disappears after 60 min. This disappearance can be explained by the production of aromatic amines from the reduction of azo groups, which are highly reactive in the presence of oxygen [36], as well as the cleavage of aromatic rings to produce N2 gas [35], both of which result in a decrease in OM concentration, indicating that the degradation is effective.
Figure 6.
UV-visible absorption spectra demonstrating the progression of MO degradation over time. Reaction condition: [Fe2+] = 0.2 mM, 50 mM Na2SO4, [H2O2] = 8.8 mM, IC = 100 mA, T = 30 ± 0.1 °C, and pH = 3.
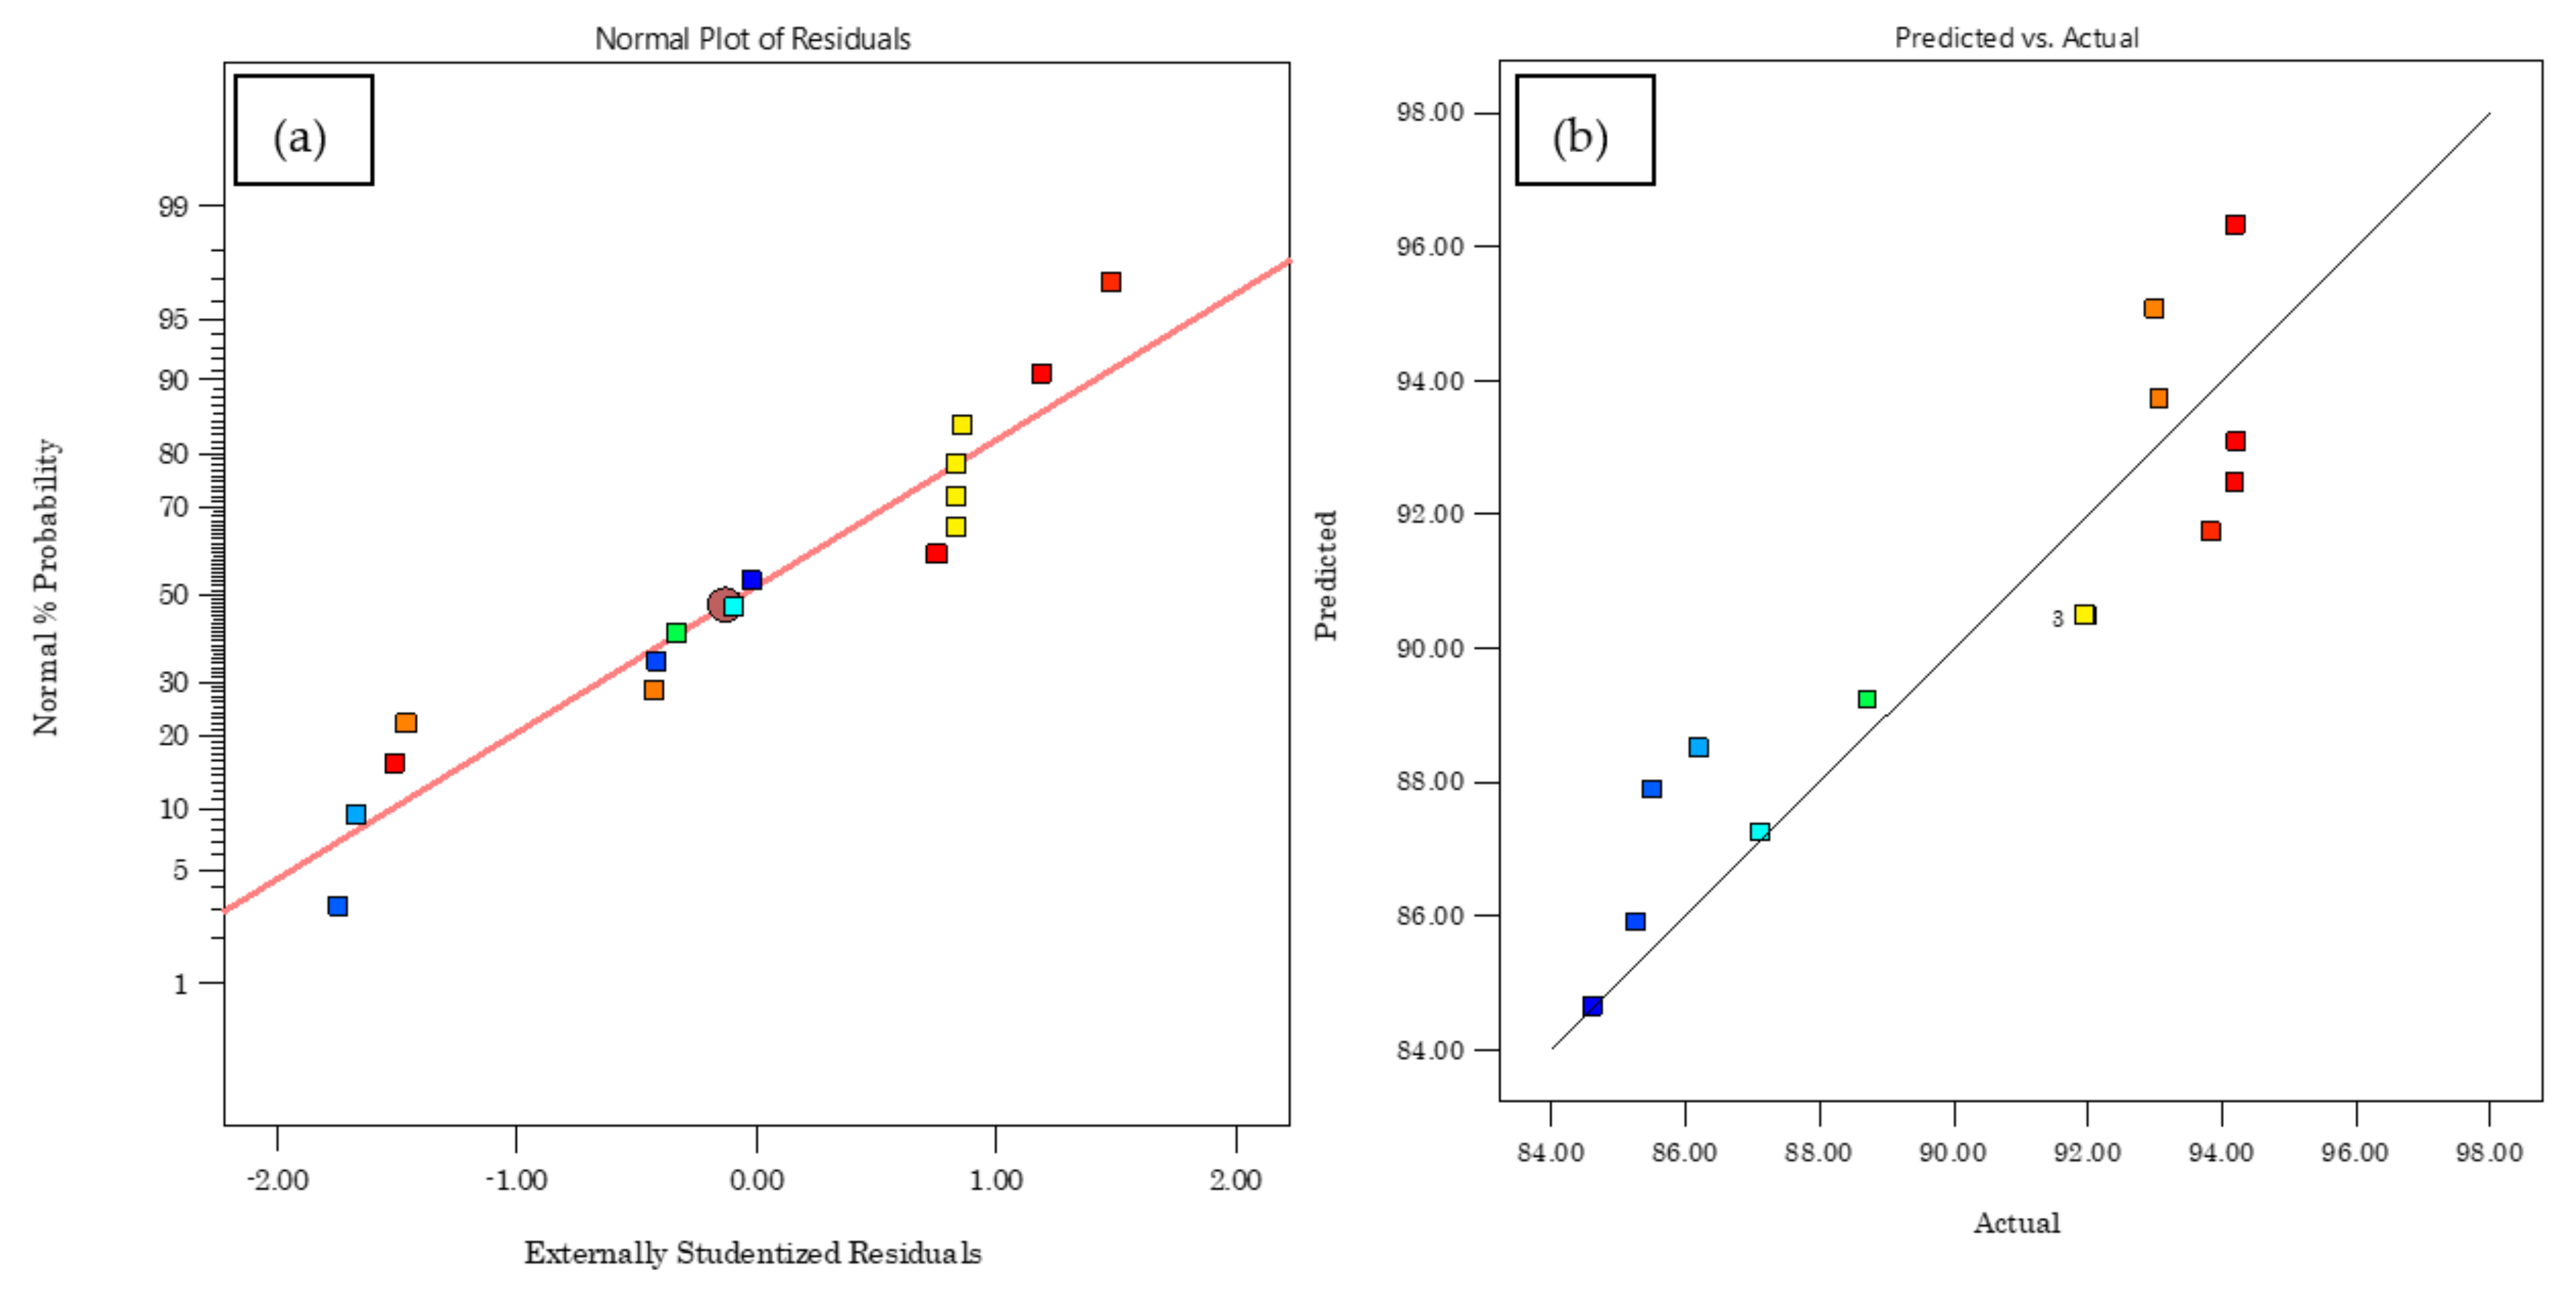
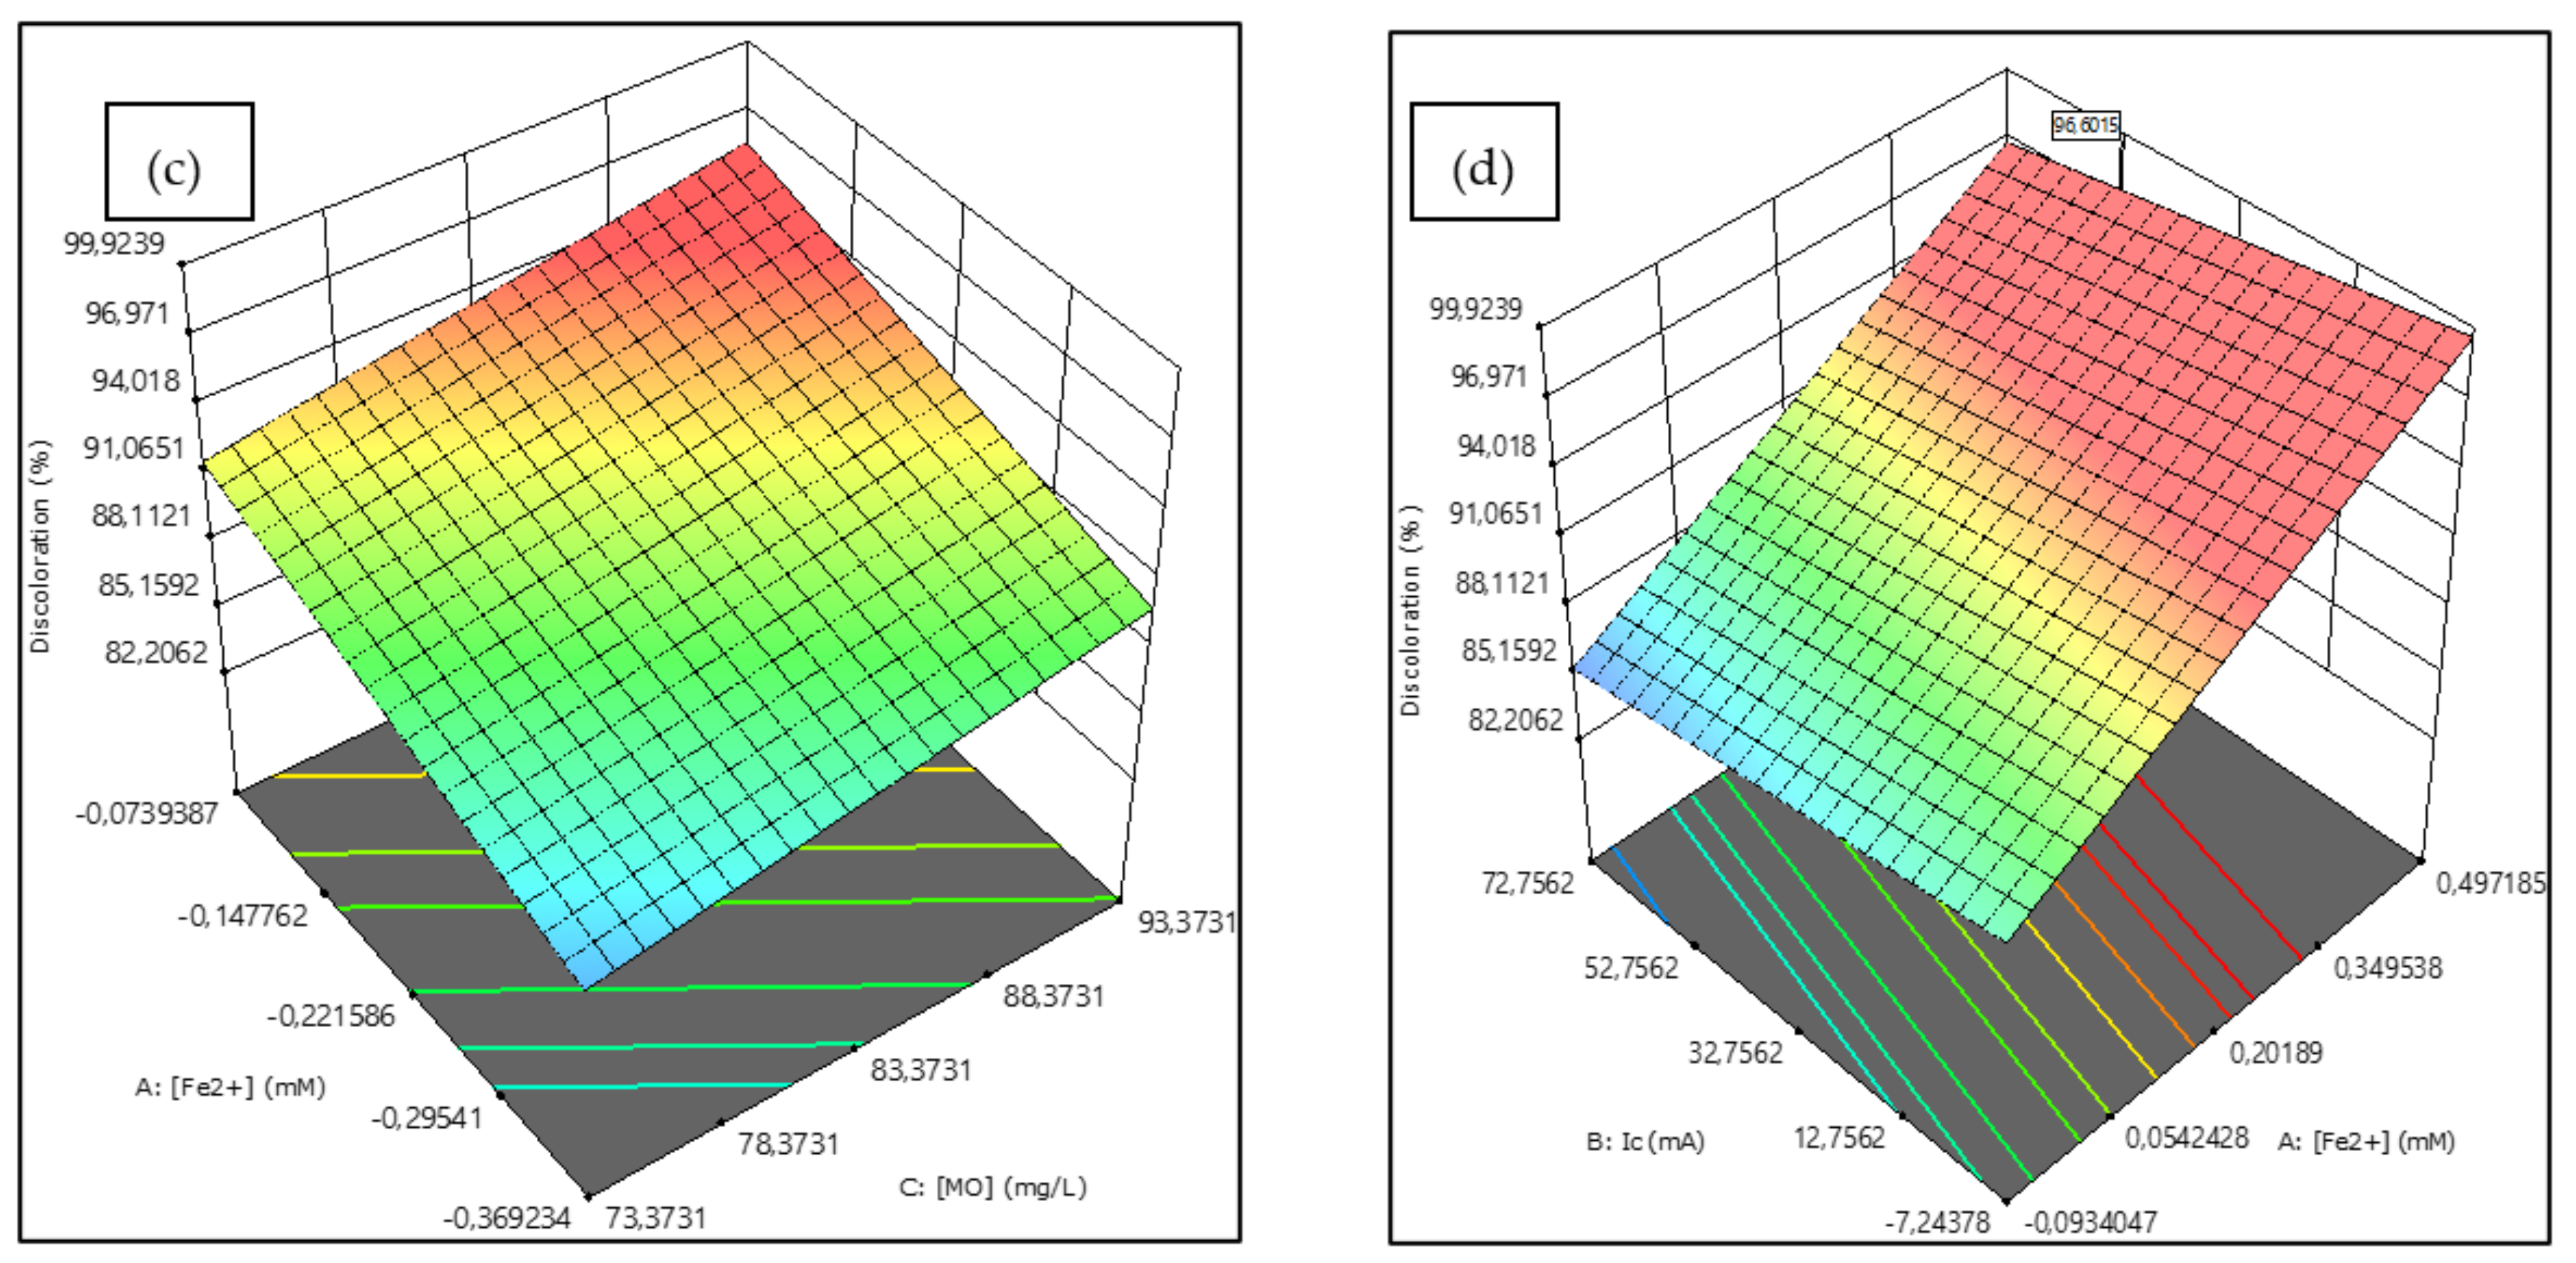
2.7. BBD Plan Optimization and Statistical Modelling
The BBD design was employed in this study to describe the relationship between the rate of discoloration and changes in the factors listed in Table S1. Analysis of variance (ANOVA) and significance of lack of fit were used to examine if the model correctly described the results of the experimental design [37]. However, the predictive quality of the models was checked using the multilinear regression coefficients (R2), the predicted coefficient (R2predicted), and the adjusted coefficient (R2adjusted). In addition, the distribution and normalcy of residuals were assessed using a plot of normal and anticipated residual values versus normal values. After this step, we found that the response studied had a better fit with the linear model than the quadratic model. The analysis of variance ANOVA in Table 1, shows that the regression of fading rate is highly significant with an F value of 16.31 and p-value of 0.0002 [38]; on the other hand, the lack of fit (F value of 13,726.38) implies that significance. There is only a 0.01% chance that such a large Fit value could occur due to noise. Moreover, the R2 coefficient of the predicted model is 0.80 which confirms the correlation and good fit between the experimental and calculated data. This is also confirmed by the difference between the adjusted R2 (0.75) and the predicted R2 (0.62), which is reasonable given that it is less than 0.2.
Table 1.
ANOVA analysis of the model.
ANOVA examination of coded words reveals that [Fe2+] and [MO] have a significant impact on the discoloration rate since their p values are less than 0.05 [39], whereas the p values of the other items are more than 0.1, indicating that these terms are statistically unimportant [40]. As a result, only the effects of important terms were taken into account in the following equation when coding components to forecast fading rate values.
Equation (5) represents the model equation in terms of real factors:
where DR is the discoloration rate.
DR = 81.5 + 19.28 X1 − 0.034 X2 + 0.195 X3
Indeed, the term X2 has a negative effect on the rate of discoloration with a negative coefficient of −0.034 in the same context. The normal graph of the residuals represented in Figure 7a indicates that the distribution of the points of the residuals follows the right line correctly, which justifies that the distribution is homogeneous. In addition, the importance of the experimental values was verified by plotting the predicted graph compared to the actual graph; we can then conclude that the method of Box-Behnken is suitable for our answer.

Figure 7.
(a) Normal probability plot, (b) predicted plot versus actual plot, (c) 3D surface plot of [Fe2+] versus [MO], and (d) 3D surface plot of the effect of Ic versus [Fe2+] on the discoloration response.
Figure 7b shows that the set of values was distributed close to each other around the diagonal line, which confirms the accuracy and validity of the predicted model. The 3D response surface plots obtained from Equation (5) for the discoloration rate are shown in Figure 7c, clearly showing that the discoloration rate increased with the increase in the initial pollutant concentration from 36.41 mg/L to 76.41 mg/L and the catalysis concentration from 0.087 mM to 0.38 mM.
2.8. Numerical Optimization Using the Desirability Function
One of the goals of this research is to attain the highest possible discoloration rate using the parameters indicated in Table S2. The greatest D-function value among the alternatives determined using the desirability function is chosen as the ideal option that matches the proportions indicated in Table 2.
Table 2.
Verification experiments under optimal conditions.
The point prediction option of the Design Expert software was used for the optimization of the process parameters; the optimized parameters obtained from the statistical software are listed in Table 2. Select experiments for decolorization of an aqueous solution were carried out to determine the validity of the RSM Model based on Box-Behnken Design under optimization conditions, and it was discovered that the experimental percentage (94.9%) and the predicted percentage of decolorization (95%) had a 0.1% error. Therefore, it was confirmed that Equation (5) was capable of calculating the precise rate of discoloration of the aqueous solution.
3. Materials and Methods
3.1. Chemical Product
The sodium hydroxide (NaOH), sulfuric acid (H2SO4), and H2O2 (30% by weight) used in this study were of analytical grade. Ferrous sulfate heptahydrate (FeSO4, 7H2O2), anhydrous sodium sulfate (Na2SO4), and methyl orange (C14H14N3NaO3S) were ACS reagent grade, purchased from (Sigma-Aldrich, Saint-Louis, Missouri, États-Unis). Discoloration experiments were performed using distilled water (resistivity 18.2 ohms.cm) obtained from a Milli-pore Symplicity 185 system.
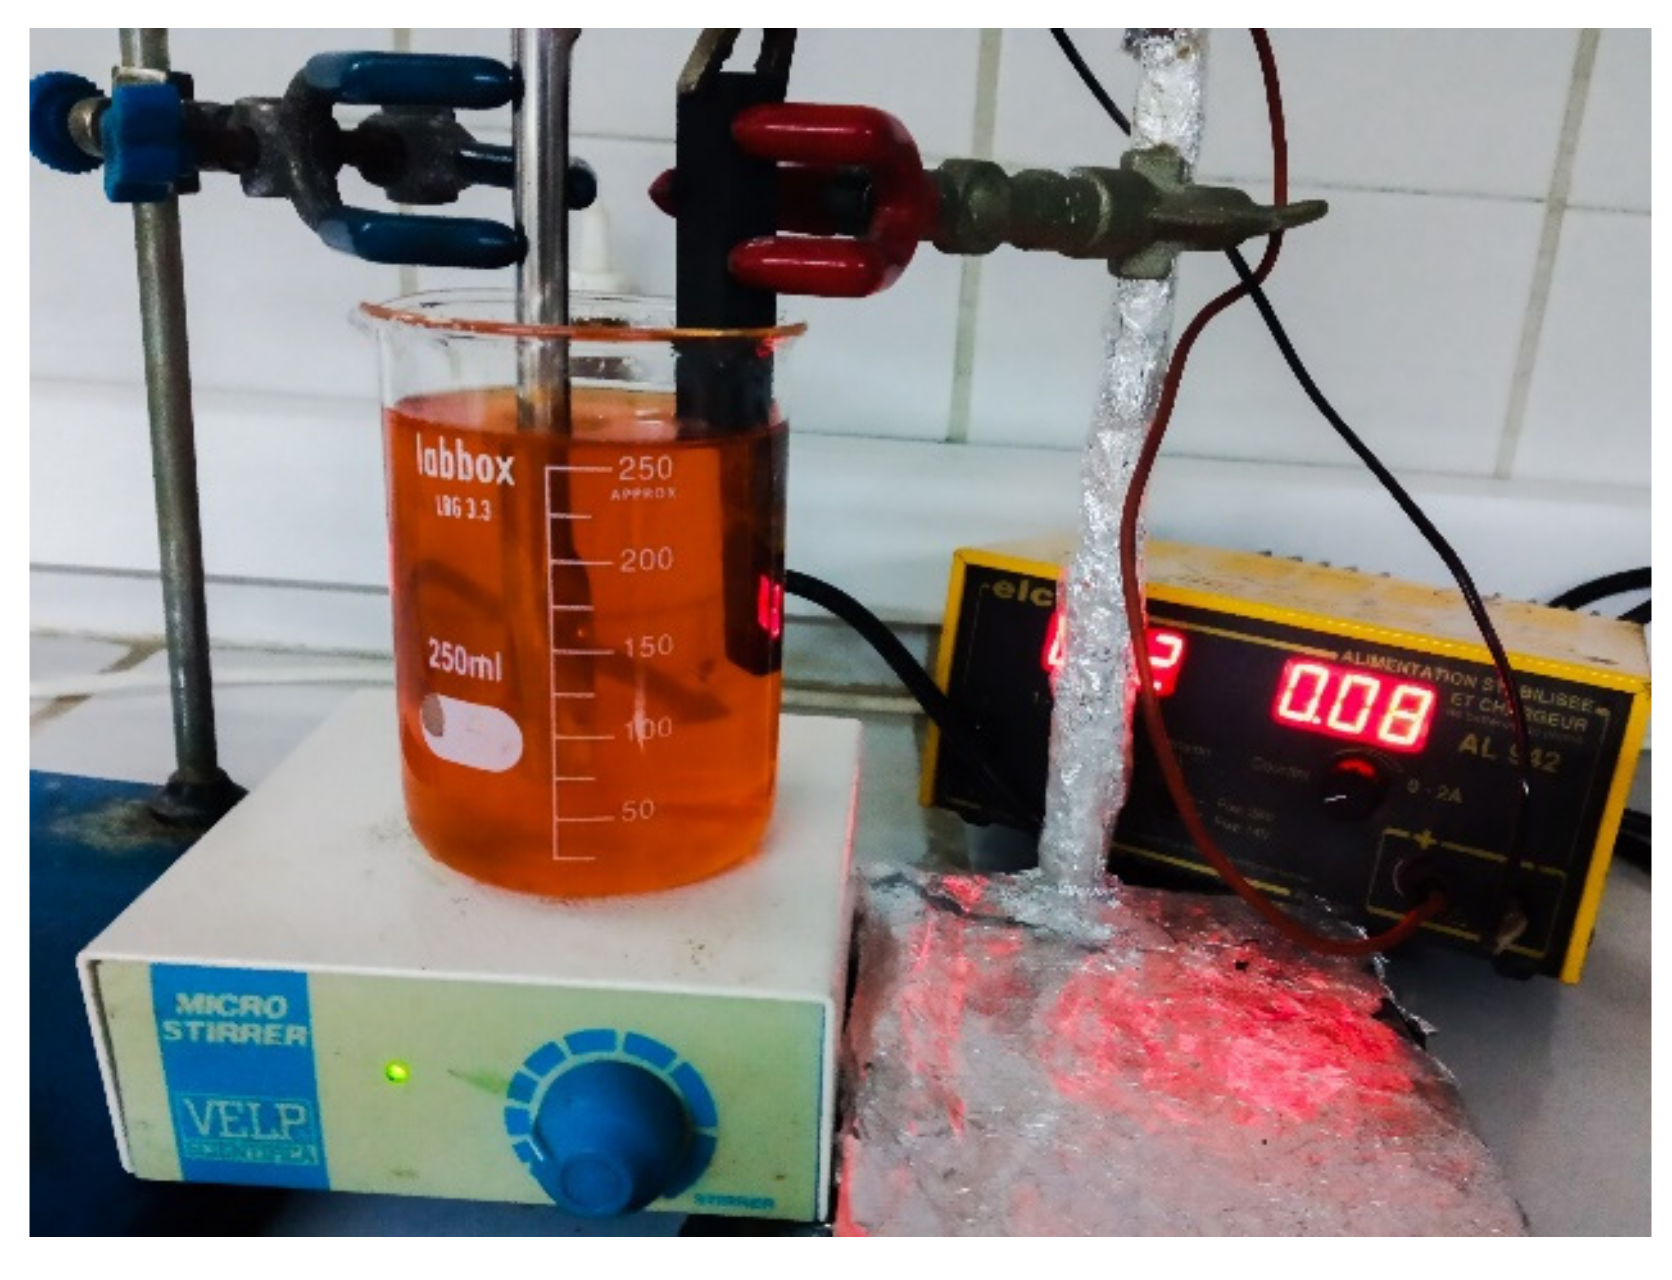
3.2. Electrochemical Equipment and Procedures
A digital power supply (AL-942, 1-3V, 0-2A) was used to apply DC current to a 250 mL undivided cylindrical glass cell with an internal diameter of 6cm and two electrodes. A carbon graphite electrode (1 cm × 1.5 cm × 10 was cm) was placed on the inner wall of the electrochemical cell covering the entire inner perimeter, and a stainless-steel electrode (1 cm × 2.5 cm × 16 cm) was inserted into the center of the cell. Before electrolysis, the solution was saturated with oxygen for 10 min by a pump (SOBO pump, 220–240 V). For the agitation of the solution, we used a digital mechanical stirrer (F203A0161, 500 rpm). To measure the temperature of the solution, we used a classical thermometer. The electrolyzes were carried out with a constant current (Figure 8). Before beginning the electrolysis process, a catalytic quantity of ferric iron was added to the solutions. The current was maintained constant during electrolysis, and samples were obtained at regular electrolysis times. The initial pH of the solutions was adjusted to 3 with sulfuric acid H2SO4 (0.1M) and sodium hydroxide NaOH (0.1M) and checked with a pH meter (HANNA instruments-HI 98127) which was well calibrated with standard buffers at pH values of 4 and 7 [41]. The ionic strength of the solution was kept constant at 50mM by the addition of Na2SO4 [42]. MO concentrations were determined by a UV-visible spectrophotometer (UV-2005, HJD501), and the detected wavelength was 464 nm as shown in Figure S1 [43]. The calibration curve was found as illustrated in Figure S2.
Figure 8.
Experimental instrument used in the Electro-Fenton process.
The color removal efficiency was calculated using Equation (6) [44]:
where DR is Discoloration Rate (%), C0 is the dye concentration at time t = 0, and Ct is the dye concentration at time t.
3.3. Experimental Design
The design of experiments (Doe) approach is a robust tool for understanding and optimizing the experimental parameters of organic pollutant degradation by EF, allowing a rational interpretation of their influence on the selected response with a significant reduction in the number of experiments and a better understanding of the process mechanism [45]. In this study, the effect of the three parameters, namely, Fe2+ concentration (X1), applied current IC (X2), and pollutant concentration (X3) were described by a quadratic polynomial model using the following Equation (7) including linear effects, interaction effects, and quadratic effects, i.e., for k = 3 independent factors.
where Yi is the measured response to experiment I, β is the constant regression coefficient, Xi and Xj are the independent coded predictor variables called factors, and ꜫ is the design difference between the observed and estimated values of the measured response called total error [46]. In addition, the BBD design was developed using the Design-Expert software and taking into consideration that there is no secondary constraint on the studied response. A total of 16 experiments were suggested and conducted in random order to account for any randomized hidden effects (Table S1).
Table 3 displays the factor limitations and Figure S3 illustrates the geometric position of the experimental points in the BBD design. After the modeling was completed, we proceeded to the optimization which consisted of finding the optimal fading rate according to the criteria and constraints illustrated in Table S2. In this study, the numerical optimization method was applied using the desirability function (D) as reported by [47].
Table 3.
Limitations of the BBD plan factors.
4. Conclusions
Electrochemical oxidation based on the initiation of EF reactions with the use of two electrodes: carbon graphite and stainless steel has been used to successfully treat aqueous solutions containing methyl orange (MO) dye at a concentration of 60 mg/L during an electrolysis time of 60 min. The experiment was performed in a 250 mL glass reactor under acidic conditions to follow the effect of different operational parameters (electrolysis dose, solution pH, applied current, dye concentration, and temperature) on the EF process performance. For this effect, the optimization of these parameters was performed by the BBD design that allows describing a matrix of three variables on a set of 16 experiments. These results were confirmed by a BBD design which was applied to determine the optimal experimental conditions in terms of discoloration rate. Under the optimal conditions of the three parameters (Fe2+ = 0.232 mM, Ic = 80 mA, MO = 60 mg/L), a maximum discoloration rate of 94.5% was achieved. Analysis using UV-visible spectrophotometers clearly showed that initiating EF reactions is an important and very effective way to save time and energy during the discoloration of aqueous solutions. Coupling the Electro-Fenton process with another treatment process makes it applicable to the treatment of wastewater from textile factories.
Supplementary Materials
The following supporting information can be downloaded at: https://www.mdpi.com/article/10.3390/catal12060665/s1, Figure S1. Molecular structure and absorption spectrum of methyl orange MO; Figure S2: Calibration curve of methyl orange dye at 464 nm wavelength; Figure S3: geometrical location of the experimental points of the BDD design. Table S1: Experimental design matrix and response. Table S2: Optimization constraints using the desirability function.
Author Contributions
Conceptualization, A.A. (Abderrazzak Adachi) and F.E.O.; methodology, A.A. (Abderrazzak Adachi) and I.E.M.; software, A.A. (Amine Assouguem) and M.K.; validation, A.A. (Abderrazzak Adachi), A.L. and N.E.; formal analysis, M.K., A.A. (Amine Assouguem) and I.P.; investigation, A.A.; data curation, A.A. (Abderrazzak Adachi), A.L. and N.E.; writing—original draft preparation, A.A. (Abderrazzak Adachi), A.L. and M.K.; writing—review and editing, A.A. (Abderrazzak Adachi), M.H.A., R.B. and A.L.; visualization, M.H.A. and H.R.H.M.; supervision, A.L. All authors have read and agreed to the published version of the manuscript.
Funding
The authors extend their appreciation to the Researchers Supporting Project number (RSP-2021/191), King Saud University, Riyadh, Saudi Arabia.
Acknowledgments
This project was supported by the Researchers Supporting Project number (RSP-2021/191), King Saud University, Riyadh, Saudi Arabia.
Conflicts of Interest
The authors declare no conflict of interest.
References
- Daghrir, R.; Drogui, P.; Robert, D. Photoelectrocatalytic Technologies for Environmental Applications. J. Photochem. Photobiol. A Chem. 2012, 238, 41–52. [Google Scholar] [CrossRef]
- Benmessaoud, S.; Anissi, J.; Kara, M.; Assouguem, A.; AL-Huqail, A.A.; Germoush, M.O.; Ullah, R.; Ercisli, S.; Bahhou, J. Isolation and Characterization of Three New Crude Oil Degrading Yeast Strains, Candida Parapsilosis SK1, Rhodotorula Mucilaginosa SK2 and SK3. Sustainability 2022, 14, 3465. [Google Scholar] [CrossRef]
- Sala, M.; Gutiérrez-Bouzán, M.C. Electrochemical Treatment of Industrial Wastewater and Effluent Reuse at Laboratory and Semi-Industrial Scale. J. Clean. Prod. 2014, 65, 458–464. [Google Scholar] [CrossRef]
- Lou, W.; Kane, A.; Wolbert, D.; Rtimi, S.; Assadi, A.A. Study of a Photocatalytic Process for Removal of Antibiotics from Wastewater in a Falling Film Photoreactor: Scavenger Study and Process Intensification Feasibility. Chem. Eng. Process. Process Intensif. 2017, 122, 213–221. [Google Scholar] [CrossRef]
- Ganzenko, O.; Oturan, N.; Sirés, I.; Huguenot, D.; van Hullebusch, E.D.; Esposito, G.; Oturan, M.A. Fast and Complete Removal of the 5-Fluorouracil Drug from Water by Electro-Fenton Oxidation. Environ. Chem. Lett. 2018, 16, 281–286. [Google Scholar] [CrossRef] [Green Version]
- Isarain-Chávez, E.; Rodríguez, R.M.; Cabot, P.L.; Centellas, F.; Arias, C.; Garrido, J.A.; Brillas, E. Degradation of Pharmaceutical Beta-Blockers by Electrochemical Advanced Oxidation Processes Using a Flow Plant with a Solar Compound Parabolic Collector. Water Res. 2011, 45, 4119–4130. [Google Scholar] [CrossRef]
- Sirés, I.; Oturan, N.; Oturan, M.A. Electrochemical Degradation of β-Blockers. Studies on Single and Multicomponent Synthetic Aqueous Solutions. Water Res. 2010, 44, 3109–3120. [Google Scholar] [CrossRef]
- Ganzenko, O.; Trellu, C.; Oturan, N.; Huguenot, D.; Péchaud, Y.; van Hullebusch, E.D.; Oturan, M.A. Electro-Fenton Treatment of a Complex Pharmaceutical Mixture: Mineralization Efficiency and Biodegradability Enhancement. Chemosphere 2020, 253, 126659. [Google Scholar] [CrossRef]
- Kamagate, M.; Assadi, A.A.; Kone, T.; Giraudet, S.; Coulibaly, L.; Hanna, K. Use of Laterite as a Sustainable Catalyst for Removal of Fluoroquinolone Antibiotics from Contaminated Water. Chemosphere 2018, 195, 847–853. [Google Scholar] [CrossRef]
- Lei, H.; Li, H.; Li, Z.; Li, Z.; Chen, K.; Zhang, X.; Wang, H. Electro-Fenton Degradation of Cationic Red X-GRL Using an Activated Carbon Fiber Cathode. Process Saf. Environ. Prot. 2010, 88, 431–438. [Google Scholar] [CrossRef]
- Garcia-Segura, S.; Almeida, L.C.; Bocchi, N.; Brillas, E. Solar Photoelectro-Fenton Degradation of the Herbicide 4-Chloro-2-Methylphenoxyacetic Acid Optimized by Response Surface Methodology. J. Hazard. Mater. 2011, 194, 109–118. [Google Scholar] [CrossRef] [PubMed]
- Weissman, S.A.; Anderson, N.G. Design of Experiments (DoE) and Process Optimization. A Review of Recent Publications. Org. Process Res. Dev. 2015, 19, 1605–1633. [Google Scholar] [CrossRef]
- Spessato, L.; Duarte, V.A.; Viero, P.; Zanella, H.; Fonseca, J.M.; Arroyo, P.A.; Almeida, V.C. Optimization of Sibipiruna Activated Carbon Preparation by Simplex-Centroid Mixture Design for Simultaneous Adsorption of Rhodamine B and Metformin. J. Hazard. Mater. 2021, 411, 125166. [Google Scholar] [CrossRef] [PubMed]
- Özcan, A.; Gençten, M. Investigation of Acid Red 88 Oxidation in Water by Means of Electro-Fenton Method for Water Purification. Chemosphere 2016, 146, 245–252. [Google Scholar] [CrossRef]
- Özcan, A.; Oturan, M.A.; Oturan, N.; Şahin, Y. Removal of Acid Orange 7 from Water by Electrochemically Generated Fenton’s Reagent. J. Hazard. Mater. 2009, 163, 1213–1220. [Google Scholar] [CrossRef]
- Al-Qaradawi, S.; Salman, S.R. Photocatalytic Degradation of Methyl Orange as a Model Compound. J. Photochem. Photobiol. A Chem. 2002, 148, 161–168. [Google Scholar] [CrossRef]
- Akyol, A.; Yatmaz, H.C.; Bayramoglu, M. Photocatalytic Decolorization of Remazol Red RR in Aqueous ZnO Suspensions. Appl. Catal. B Environ. 2004, 54, 19–24. [Google Scholar] [CrossRef]
- El Ouadrhiri, F.; Elyemni, M.; Lahkimi, A.; Lhassani, A.; Chaouch, M.; Taleb, M. Mesoporous Carbon from Optimized Date Stone Hydrochar by Catalytic Hydrothermal Carbonization Using Response Surface Methodology: Application to Dyes Adsorption. Int. J. Chem. Eng. 2021, 2021, 5555406. [Google Scholar] [CrossRef]
- de Luna, M.D.G.; Sablas, M.M.; Hung, C.M.; Chen, C.W.; Garcia-Segura, S.; Dong, C. Di Modeling and Optimization of Imidacloprid Degradation by Catalytic Percarbonate Oxidation Using Artificial Neural Network and Box-Behnken Experimental Design. Chemosphere 2020, 251, 126254. [Google Scholar] [CrossRef]
- Jawad, A.H.; Sahu, U.K.; Jani, N.A.; ALOthman, Z.A.; Wilson, L.D. Magnetic Crosslinked Chitosan-Tripolyphosphate/MgO/Fe3O4 Nanocomposite for Reactive Blue 19 Dye Removal: Optimization Using Desirability Function Approach. Surf. Interfaces 2022, 28, 101698. [Google Scholar] [CrossRef]
- Zhang, M.; Dong, H.; Zhao, L.; Wang, D.; Meng, D. Science of the Total Environment A Review on Fenton Process for Organic Wastewater Treatment Based on Optimization Perspective. Sci. Total Environ. 2019, 670, 110–121. [Google Scholar] [CrossRef] [PubMed]
- He, H.; Zhou, Z. Technology Electro-Fenton Process for Water and Wastewater Treatment. Crit. Rev. Environ. Sci. Technol. 2017, 47, 2100–2131. [Google Scholar] [CrossRef]
- Hsueh, C.L.; Huang, Y.H.; Wang, C.C.; Chen, C.Y. Degradation of Azo Dyes Using Low Iron Concentration of Fenton and Fenton-like System. Chemosphere 2005, 58, 1409–1414. [Google Scholar] [CrossRef] [PubMed]
- Panizza, M.; Cerisola, G. Electro-Fenton Degradation of Synthetic Dyes. Water Res. 2009, 43, 339–344. [Google Scholar] [CrossRef]
- Ghanbari, F.; Moradi, M. Journal of Environmental Chemical Engineering A Comparative Study of Electrocoagulation, Electrochemical Fenton, Electro-Fenton and Peroxi-Coagulation for Decolorization of Real Textile Wastewater Electrical Energy Consumption and Biodegradability Imp. Biochem. Pharmacol. 2015, 3, 499–506. [Google Scholar] [CrossRef]
- Hodaifa, G.; Ochando-Pulido, J.M.; Rodriguez-Vives, S.; Martinez-Ferez, A. Optimization of Continuous Reactor at Pilot Scale for Olive-Oil Mill Wastewater Treatment by Fenton-like Process. Chem. Eng. J. 2013, 220, 117–124. [Google Scholar] [CrossRef]
- Ifelebuegu, A.O.; Ezenwa, C.P. Removal of Endocrine Disrupting Chemicals in Wastewater Treatment by Fenton-like Oxidation. Water Air Soil Pollut. 2011, 217, 213–220. [Google Scholar] [CrossRef]
- Wang, S. A Comparative Study of Fenton and Fenton-like Reaction Kinetics in Decolourisation of Wastewater. Dyes Pigment. 2008, 76, 714–720. [Google Scholar] [CrossRef]
- Kuleyin, A.; Gök, A.; Akbal, F. Treatment of Textile Industry Wastewater by Electro-Fenton Process Using Graphite Electrodes in Batch and Continuous Mode. J. Environ. Chem. Eng. 2021, 9, 104782. [Google Scholar] [CrossRef]
- Rivas, F.J.; Beltrán, F.J.; Frades, J.; Buxeda, P. Oxidation of P-Hydroxybenzoic Acid by Fenton’s Reagent. Water Res. 2001, 35, 387–396. [Google Scholar] [CrossRef]
- Pajootan, E.; Arami, M.; Rahimdokht, M. Discoloration of Wastewater in a Continuous Electro-Fenton Process Using Modified Graphite Electrode with Multi-Walled Carbon Nanotubes/Surfactant. Sep. Purif. Technol. 2014, 130, 34–44. [Google Scholar] [CrossRef]
- Ruiz, E.J.; Arias, C.; Brillas, E.; Hernández-ramírez, A.; Peralta-hernández, J.M. Chemosphere Mineralization of Acid Yellow 36 Azo Dye by Electro-Fenton and Solar Photoelectro-Fenton Processes with a Boron-Doped Diamond Anode. Chemosphere 2011, 82, 495–501. [Google Scholar] [CrossRef] [PubMed]
- Kubo, D.; Kawase, Y. Hydroxyl Radical Generation in Electro-Fenton Process with in Situ Electro-Chemical Production of Fenton Reagents by Gas-Diffusion-Electrode Cathode and Sacrificial Iron Anode. J. Clean. Prod. 2018, 203, 685–695. [Google Scholar] [CrossRef]
- Barhoumi, N.; Oturan, N.; Olvera-Vargas, H.; Brillas, E.; Gadri, A.; Ammar, S.; Oturan, M.A. Pyrite as a Sustainable Catalyst in Electro-Fenton Process for Improving Oxidation of Sulfamethazine. Kinetics, Mechanism and Toxicity Assessment. Water Res. 2016, 94, 52–61. [Google Scholar] [CrossRef]
- Samet, Y.; Agengui, L.; Abdelhédi, R. Electrochemical Degradation of Chlorpyrifos Pesticide in Aqueous Solutions by Anodic Oxidation at Boron-Doped Diamond Electrodes. Chem. Eng. J. 2010, 161, 167–172. [Google Scholar] [CrossRef]
- Ren, G.; Zhou, M.; Liu, M.; Ma, L.; Yang, H. A Novel Vertical-Flow Electro-Fenton Reactor for Organic Wastewater Treatment. Chem. Eng. J. 2016, 298, 55–67. [Google Scholar] [CrossRef]
- Moreira, F.C.; Soler, J.; Fonseca, A.; Saraiva, I.; Boaventura, R.A.R.; Brillas, E.; Vilar, V.J.P. Electrochemical Advanced Oxidation Processes for Sanitary Landfill Leachate Remediation: Evaluation of Operational Variables. Appl. Catal. B Environ. 2016, 182, 161–171. [Google Scholar] [CrossRef]
- Hamza, M.; Abdelhedi, R.; Brillas, E.; Sirés, I. Comparative Electrochemical Degradation of the Triphenylmethane Dye Methyl Violet with Boron-Doped Diamond and Pt Anodes. J. Electroanal. Chem. 2009, 627, 41–50. [Google Scholar] [CrossRef]
- Sun, J.H.; Sun, S.P.; Wang, G.L.; Qiao, L.P. Degradation of Azo Dye Amido Black 10B in Aqueous Solution by Fenton Oxidation Process. Dyes Pigment. 2007, 74, 647–652. [Google Scholar] [CrossRef]
- Wang, C.T.; Hu, J.L.; Chou, W.L.; Kuo, Y.M. Removal of Color from Real Dyeing Wastewater by Electro-Fenton Technology Using a Three-Dimensional Graphite Cathode. J. Hazard. Mater. 2008, 152, 601–606. [Google Scholar] [CrossRef]
- Wang, C.T.; Chou, W.L.; Chung, M.H.; Kuo, Y.M. COD Removal from Real Dyeing Wastewater by Electro-Fenton Technology Using an Activated Carbon Fiber Cathode. Desalination 2010, 253, 129–134. [Google Scholar] [CrossRef]
- Zyoud, A.; Zu’bi, A.; Helal, M.H.S.; Park, D.H.; Campet, G.; Hilal, H.S. Optimizing Photo-Mineralization of Aqueous Methyl Orange by Nano-ZnO Catalyst under Simulated Natural Conditions. J. Environ. Health Sci. Eng. 2015, 13, 46. [Google Scholar] [CrossRef] [PubMed] [Green Version]
- Van Der Zee, F.P.; Villaverde, S. Combined Anaerobic-Aerobic Treatment of Azo Dyes—A Short Review of Bioreactor Studies. Water Res. 2005, 39, 1425–1440. [Google Scholar] [CrossRef] [PubMed]
- Mäkelä, M. Experimental Design and Response Surface Methodology in Energy Applications: A Tutorial Review. Energy Convers. Manag. 2017, 151, 630–640. [Google Scholar] [CrossRef]
- Amiri, F.; Mousavi, S.M.; Yaghmaei, S. Enhancement of Bioleaching of a Spent Ni/Mo Hydroprocessing Catalyst by Penicillium Simplicissimum. Sep. Purif. Technol. 2011, 80, 566–576. [Google Scholar] [CrossRef]
- Jha, A.K.; Sit, N. Comparison of Response Surface Methodology (RSM) and Artificial Neural Network (ANN) Modelling for Supercritical Fluid Extraction of Phytochemicals from Terminalia Chebula Pulp and Optimization Using RSM Coupled with Desirability Function (DF) and Genetic Algorithm (GA) and ANN with GA. Ind. Crops Prod. 2021, 170, 113769. [Google Scholar] [CrossRef]
- Sharifpour, E.; Khafri, H.Z.; Ghaedi, M.; Asfaram, A.; Jannesar, R. Isotherms and Kinetic Study of Ultrasound-Assisted Adsorption of Malachite Green and Pb2+ Ions from Aqueous Samples by Copper Sulfide Nanorods Loaded on Activated Carbon: Experimental Design Optimization. Ultrason. Sonochem. 2018, 40, 373–382. [Google Scholar] [CrossRef]
Publisher’s Note: MDPI stays neutral with regard to jurisdictional claims in published maps and institutional affiliations. |
© 2022 by the authors. Licensee MDPI, Basel, Switzerland. This article is an open access article distributed under the terms and conditions of the Creative Commons Attribution (CC BY) license (https://creativecommons.org/licenses/by/4.0/).