Article

Investigation of the Gender-Specific Discourse about Online Learning during COVID-19 on Twitter Using Sentiment Analysis, Subjectivity Analysis, and Toxicity Analysis

1
Department of Computer Science, Emory University, Atlanta, GA 30322, USA
2
Program in Linguistics, Emory University, Atlanta, GA 30322, USA
*
Author to whom correspondence should be addressed.
Computers 2023, 12(11), 221; https://doi.org/10.3390/computers12110221
Submission received: 29 September 2023 / Revised: 29 October 2023 / Accepted: 30 October 2023 / Published: 31 October 2023
(This article belongs to the Special Issue Computational Modeling of Social Processes and Social Networks)

Abstract

:
This paper presents several novel findings from a comprehensive analysis of about 50,000 Tweets about online learning during COVID-19, posted on Twitter between 9 November 2021 and 13 July 2022. First, the results of sentiment analysis from VADER, Afinn, and TextBlob show that a higher percentage of these Tweets were positive. The results of gender-specific sentiment analysis indicate that for positive Tweets, negative Tweets, and neutral Tweets, between males and females, males posted a higher percentage of the Tweets. Second, the results from subjectivity analysis show that the percentage of least opinionated, neutral opinionated, and highly opinionated Tweets were 56.568%, 30.898%, and 12.534%, respectively. The gender-specific results for subjectivity analysis indicate that females posted a higher percentage of highly opinionated Tweets as compared to males. However, males posted a higher percentage of least opinionated and neutral opinionated Tweets as compared to females. Third, toxicity detection was performed on the Tweets to detect different categories of toxic content—toxicity, obscene, identity attack, insult, threat, and sexually explicit. The gender-specific analysis of the percentage of Tweets posted by each gender for each of these categories of toxic content revealed several novel insights related to the degree, type, variations, and trends of toxic content posted by males and females related to online learning. Fourth, the average activity of males and females per month in this context was calculated. The findings indicate that the average activity of females was higher in all months as compared to males other than March 2022. Finally, country-specific tweeting patterns of males and females were also performed which presented multiple novel insights, for instance, in India, a higher percentage of the Tweets about online learning during COVID-19 were posted by males as compared to females.

1. Introduction

In December 2019, an outbreak of coronavirus disease 2019 (COVID-19) due to severe acute respiratory syndrome coronavirus 2 (SARS-CoV-2) began in China. [1]. After the initial outbreak, COVID-19 soon spread to different parts of the world, and on 11 March 2020, the World Health Organization (WHO) declared COVID-19 an emergency [2]. As no treatments or vaccines for COVID-19 were available at that time, the virus rampaged unopposed across different countries, infecting and leading to the demise of people the likes of which the world had not witnessed in centuries. As of 21 September 2023, there have been a total of 770,778,396 cases and 6,958,499 deaths due to COVID-19 [3]. As an attempt to mitigate the spread of the virus, several countries across the world went on partial to complete lockdowns [4]. Such lockdowns affected the educational sector immensely. Universities, colleges, and schools across the world were left searching for solutions to best deliver course content online, engage learners, and conduct assessments during the lockdowns [5]. During this time, online learning was considered a feasible solution. This switch to online learning took place in more than 100 countries [6] and led to an incredible increase in the need to familiarize, utilize, and adopt online learning platforms by educators, students, administrators, and staff at universities, colleges, and schools across the world [7].
In today’s Internet of Everything era [8], the usage of social media platforms has skyrocketed as such platforms serve as virtual communities [9] for people to seamlessly connect with each other. Currently, around 4.9 billion individuals worldwide actively participate in social media, and it is projected that this number will reach 5.85 billion by 2027. Among the various social media platforms available, Twitter has gained substantial popularity across diverse age groups [10,11]. This rapid transition to online learning resulted in a tremendous increase in the usage of social media platforms, such as Twitter, where individuals communicated their views, perspectives, and concerns towards online learning, leading to the generation of Big Data of social media conversations. This Big Data of conversations holds the potential to provide insights about these paradigms of information-seeking and sharing behavior in the context of online learning during COVID-19.

1.1. Twitter: A Globally Popular Social Media Platform

Twitter ranks as the sixth most popular social platform in the United States and the seventh globally [12,13]. At present, Twitter has 353.9 million monthly active users, constituting 9.4% of the global social media user base [14]. Notably, 42% of Americans between the ages of 12 and 34 are active Twitter users. The majority of Twitter users fall within the age range of 25 to 49 years [15]. On average, adults in the United States spend approximately 34.1 min per day on Twitter [16]. To add to this, about 500 million Tweets are published each day, which is equivalent to the publication of 5787 Tweets per second. Furthermore, 42.3% of social media users in the United States use Twitter at least once a month, and it is currently the ninth most visited website globally. The countries with the highest number of Twitter users include the United States with 95.4 million users, Japan with 67.45 million users, India with 27.25 million users, Brazil with 24.3 million users, Indonesia with 24 million users, the UK with 23.15 million users, Turkey with 18.55 million users, and Mexico with 17.2 million users [17,18]. On average, a Twitter user spends 5.1 hours per month on the platform, translating to approximately 10 minutes daily. Twitter is a significant source of news, with 55% of users accessing it regularly for this purpose [19,20].
Due to this ubiquitousness of Twitter, studying the multimodal components of information-seeking and sharing behavior has been of keen interest to scientists from different disciplines, as can be seen from recent works in this field that focused on the analysis of Tweets about various emerging technologies [21,22], global affairs [23,24], humanitarian issues [25,26], societal problems [27,28], and virus outbreaks [29,30]. Since the outbreak of COVID-19, there have been several research works conducted in this field (Section 2) where researchers analyzed different components and characteristics of the Tweets to interpret the varying degrees of public perceptions, attitudes, views, opinions, and responses towards this pandemic. However, the tweeting patterns about online learning during COVID-19, with respect to the gender of Twitter users, have not been investigated in any prior work in this field. Section 1.2 further outlines the relevance of performing such an analysis based on studying relevant Tweets.

1.2. Gender Diversity on Social Media Platforms

Gender differences in content creation online have been comprehensively studied by researchers from different disciplines [31] and such differences have been considered important in the investigation of digital divides that produce inequalities of experience and opportunity [32,33]. Analysis of gender diversity and the underlying patterns of content creation on social media platforms has also been widely investigated [34]. However, the findings are mixed. Some studies have concluded that males are more likely to express themselves on social media as compared to females [35,36,37], while others found no such difference between genders [38,39,40]. The gender diversity related to the usage of social media platforms has varied over the years in different geographic regions [41]. For instance, Figure 1 shows the variation in social media use by gender from the findings of a survey conducted by the Pew Research Center from 2005 to 2021 [42].
In general, most social media platforms tend to exhibit a notable preponderance of male users over their female counterparts, for example—WhatsApp [43], Sina Weibo [44], QQ [45], Telegram [46], Quora [47], Tumblr [48], Facebook, LinkedIn, Instagram [49], and WeChat [50]. Nevertheless, there do exist exceptions to this prevailing trend. Snapchat has male and female users, accounting for 48.2% and 51%, respectively [51]. These statistics about the percentage of male and female users in different social media platforms are summarized in Table 1. As can be seen from Table 1, Twitter has the highest gender gap as compared to several social media platforms such as Instagram, Tumblr, WhatsApp, WeChat, Quora, Facebook, LinkedIn, Telegram, Sina Weibo, QQ, and SnapChat. Therefore, this paper focuses on the analysis of user diversity-based (with a specific focus on gender) patterns of public discourse on Twitter in the context of online learning during COVID-19.
The rest of this paper is organized as follows. In Section 2, a comprehensive review of recent works in this field is presented. Section 3 discusses the methodology that was followed for this work. The results of this study are presented and discussed in Section 4. It is followed by Section 5, which summarizes the scientific contributions of this study and outlines the scope of future research in this area.

2. Literature Review

This section is divided into two parts. Section 2.1 presents an overview of the recent works related to sentiment analysis of Tweets about COVID-19. In Section 2.2, a review of emerging works in this field is presented where the primary focus was the analysis of Tweets about online learning during COVID-19.

2.1. A Brief Review of Recent Works Related to Sentiment Analysis of Tweets about COVID-19

Villavicencio et al. [52] analyzed Tweets to determine the sentiment of people towards the Philippines government, regarding their response to COVID-19. They used the Naïve Bayes model to classify the Tweets as positive, negative, and neutral. Their model achieved an accuracy of 81.77%. Boon-Itt et al. [53] conducted a study involving the analysis of Tweets to gain insights into public awareness and concerns related to the COVID-19 pandemic. They conducted sentiment analysis and topic modeling on a dataset of over 100,000 Tweets related to COVID-19. Marcec et al. [54] analyzed 701,891 Tweets mentioning the COVID-19 vaccines, specifically AstraZeneca, Pfizer, and Moderna. They used the AFINN lexicon to calculate the daily average sentiment. The findings of this work showed that Pfizer and Moderna remained consistently positive as opposed to AstraZeneca, which showed a declining trend. Machuca et al. [55] focused on evaluating the sentiment of the general public towards COVID-19. They used a Logistic Regression-based approach to classify relevant Tweets as positive or negative. The methodology achieved 78.5% accuracy. Kruspe et al. [56] performed sentiment analysis of Tweets about COVID-19 from Europe, and their approach used a neural network for performing sentiment analysis. Similarly, the works of Vijay et al. [57], Shofiya et al. [58], and Sontayasara et al. [59] focused on sentiment analysis of Tweets about COVID-19 from India, Canada, and Thailand, respectively. Nemes et al. [60] used a Recurrent Neural Network for sentiment analysis of the Tweets about COVID-19.
Okango et al. [61] utilized a dictionary-based method for detecting sentiments in Tweets about COVID-19. Their work indicated that mental health issues and lack of supplies were a direct result of the pandemic. The work of Singh et al. [62] focused on a deep-learning approach for sentiment analysis of Tweets about COVID-19. Their algorithm was based on an LSTM-RNN-based network and enhanced featured weighting by attention layers. Kaur et al. [63] developed an algorithm, the Hybrid Heterogeneous Support Vector Machine (H-SVM), for sentiment classification. The algorithm was able to categorize Tweets as positive, negative, and neutral as well as detect the intensity of sentiments. In [64], Vernikou et al. performed sentiment analysis through seven different deep-learning models based on LSTM neural networks. Sharma et al. [65] studied the sentiments of people towards COVID-19 from the USA and India using text mining-based approaches. The authors also discussed how their findings could provide guidance to authorities in healthcare to tailor their policies in response to the emotional state of the general public. Sanders et al. [66] analyzed over one million Tweets to illustrate public attitudes toward mask-wearing during the pandemic. Their work showed that both the volume and polarity of Tweets relating to mask-wearing increased over time. Alabid et al. [67] used two machine learning classification models—SVM and Naïve Bayes classifier to perform sentiment analysis of Tweets related to COVID-19 vaccines. Mansoor et al. [68] used Long Short-Term Memory (LSTM) and Artificial Neural Networks (ANNs) to perform sentiment analysis of the public discourse on Twitter about COVID-19. Singh et al. [69] studied two datasets, one of Tweets from people all over the world and the second restricted to Tweets only by Indians. They conducted sentiment analysis using the BERT model and achieved a classification accuracy of 94%. Imamah et al. [70] conducted a sentiment classification of 355,384 Tweets using Logistic Regression. The objective of their work was to study the negative effects of ‘stay at home’ on the mental health of individuals. Their model achieved a sentiment classification accuracy of 94.71%. As can be seen from this review, a considerable number of works in this field have focused on the sentiment analysis of Tweets about COVID-19. In the context of online learning during COVID-19, understanding the underlying patterns of public emotions becomes crucial, and this has been investigated in multiple prior works in this field. A review of the same is presented in Section 2.2.

2.2. Review of Recent Works Related to Data Mining and Analysis of Tweets about Online Learning during COVID-19

Sahir et al. [71] used the Naïve Bayes classifier to perform sentiment analysis of Tweets about online learning posted in October 2020 from individuals in Indonesia. The results showed that the percentage of negative, positive, and neutral Tweets were 74%, 25%, and 1%, respectively. Althagafi et al. [72] analyzed Tweets about online learning during COVID-19 posted by individuals from Saudi Arabia. They used the Random Forest approach and the K-Nearest Neighbor (KNN) classifier alongside Naïve Bayes and found that most Tweets were neutral about online learning. Ali [73] used Naïve Bayes, Multinomial Naïve Bayes, KNN, Logistic Regression, and SVM to analyze the public opinion towards online learning during COVID-19. The results showed that the SVM classifier achieved the highest accuracy of 89.6%. Alcober et al. [74] reported the results of multiple machine learning approaches such as Naïve Bayes, Logistic Regression, and Random Forest for performing sentiment analysis of Tweets about online learning.
While Remali et al. [75] also used Naïve Bayes and Random Forest, their research additionally utilized the Support Vector Machine (SVM) approach and a Decision Tree-based modeling. The classifiers evaluated Tweets posted between July 2020 and August 2020. The results showed that the SVM classifier using the VADER lexicon achieved the highest accuracy of 90.41%. The work of Senadhira et al. [76] showed that an Artificial Neural Network (ANN)-based approach outperformed an SVM-based approach for sentiment analysis of Tweets about online learning. Lubis et al. [77] used a KNN-based method for sentiment analysis of Tweets about online learning. The model achieved a performance accuracy of 88.5% and showed that a higher number of Tweets were positive. These findings are consistent with another study [78] which reported that for Tweets posted between July 2020 and August 2020, 54% were positive Tweets. The findings of the work by Isnain et al. [79] indicated that the public opinion towards online learning between February 2020 and September 2020 was positive. These results were computed with a KNN-based approach that reported an accuracy of 84.65%.
Aljabri et al. [80] analyzed results at different stages of education. Using Term Frequency-Inverse Document Frequency (TF-IDF) as a feature extraction method and a Logistic Regression classifier, the model developed by the authors achieved an accuracy of 89.9%. The results indicated positive sentiment from elementary through high school, but negative sentiment for universities. The work by Asare et al. [81] aimed to cluster the most commonly used words into general topics or themes. The analysis of different topics found 48.9% of positive Tweets, with “learning”, “COVID”, “online”, and “distance” being the most used words. Mujahid et al. [82] used TF-IDF alongside Bag of Words (BoW) for analyzing Tweets about online learning. They also used SMOTE to balance the data. The results demonstrated that the Random Forest and SVM classifier achieved an accuracy of 95% when used with the BoW features. Al-Obeidat [83] also used TF-IDF to classify sentiments related to online education during the pandemic. The study reported that students had negative feelings towards online learning. In view of the propagation of misinformation on Twitter during the pandemic, Waheeb et al. [84] proposed eliminating noise using AutoEncoder in their work. The results found that their approach yielded a higher accuracy for sentiment analysis, with an F1-score value of 0.945. Rijal et al. [85] aimed to remove bias from sentiment analysis using concepts of feature selection. Their methodology involved the usage of the AdaBoost approach on the C4.5 method. The results found that the accuracy of C4.5 and Random Forest went up from 48.21% and 50.35% to 94.47% for detecting sentiments in Tweets about online learning. Martinez [86] investigated negative sentiments about “teaching and schools” and “teaching and online” using multiple concepts of text analysis. Their study reported negativity towards both topics. At the same time, a higher negative sentiment along with expressions of anger, distrust, or stress towards “teaching and school”, was observed.
As can be seen from this review of works related to the analysis of public discourse on Twitter about online learning during COVID-19, such works have multiple limitations centered around lack of reporting from multiple sentiment analysis approaches to explain the trends of sentiments, lack of focus on subjectivity analysis, lack of focus on toxicity analysis, and lack of focus on gender-specific tweeting patterns. Addressing these research gaps serves as the main motivation for this work.

3. Methodology

This section presents the methodology that was followed for this research work. This section is divided into two parts. In Section 3.1 a description of the dataset that was used for this research work is presented. Section 3.2 discusses the procedure and the methods that were followed for this research work.

3.1. Data Description

The dataset used for this research was proposed in [87]. The dataset consists of about 50,000 unique Tweet IDs of Tweets about online learning during COVID-19, posted on Twitter between 9 November 2021 and 13 July 2022. The dataset includes Tweets in 34 different languages, with English being the most common. The dataset spans 237 different days, with the highest Tweet count recorded on 5 January 2022. These Tweets were posted by 17,950 distinct Twitter users, with a combined follower count of 4,345,192,697. The dataset includes 3,273,263 favorites and 556,980 retweets. There are a total of 7869 distinct URLs embedded in these Tweets. The Tweet IDs present in this dataset are organized into nine .txt files based on the date range of the Tweets. The dataset was developed by mining Tweets that referred to COVID-19 and online learning at the same time. To perform the same, a collection of synonyms of COVID-19, such as COVID, COVID-19, coronavirus, Omicron, etc., and a collection of synonyms of online learning such as online education, remote education, remote learning, e-learning, etc. were used. Thereafter, duplicate Tweets were removed to obtain a collection of about 50,000 Tweet IDs. The standard procedure for working with such a dataset is the hydration of the Tweet IDs. However, this dataset was developed by the first author of this paper. So, the Tweets were already available, and hydration was not necessary. In addition to the Tweet IDs, the dataset file that was used comprised several characteristic properties of Tweets and Twitter users who posted these Tweets, such as the Tweet Source, Tweet Text, Retweet count, user location, username, user favorites count, user follower count, user friends, count, user screen name, and user status count. This dataset complies with the FAIR principles (Findability, Accessibility, Interoperability, and Reusability) of scientific data management [88]. It is designed to be findable through a unique and permanent DOI. It is accessible online for users to locate and download. The dataset is interoperable as it uses .txt files, enabling compatibility across various computer systems and applications. Finally, it is reusable because researchers can obtain Tweet-related information, such as user ID, username, and retweet count, for all Tweet IDs through a hydration process, facilitating data analysis and interpretation.

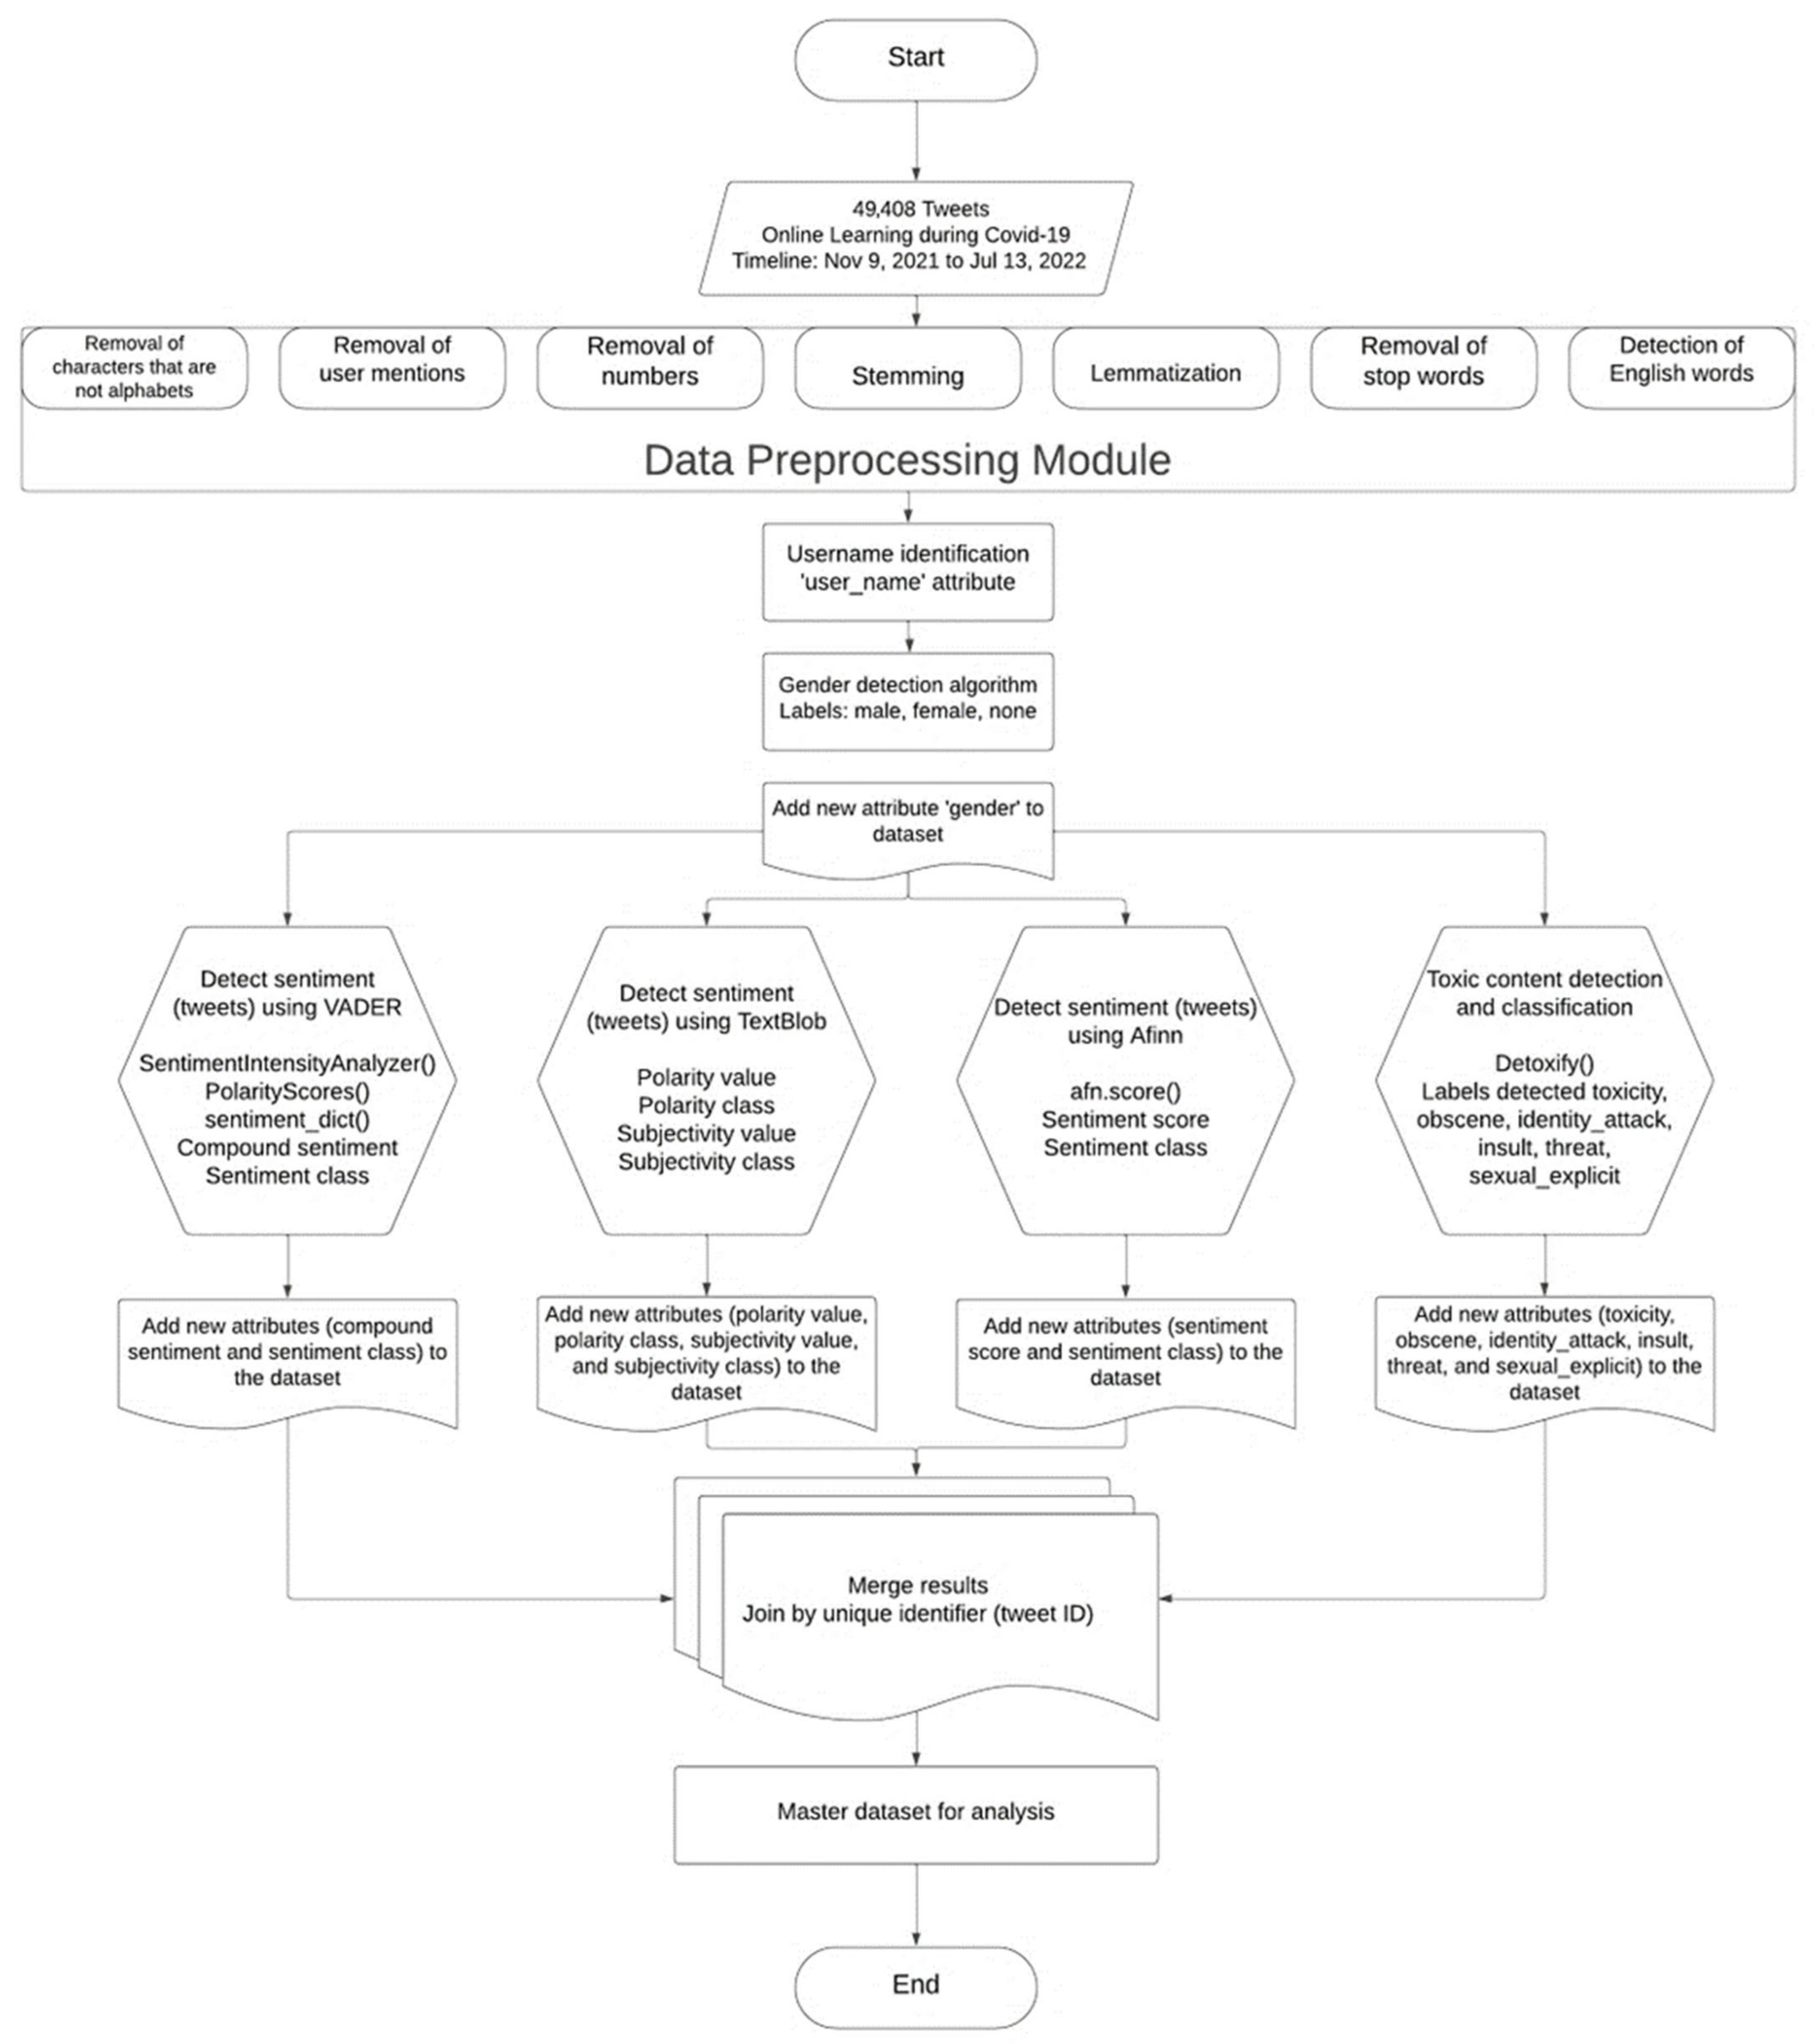
3.2. System Design and Development

At first, the data preprocessing of these Tweets was performed by writing a program in Python 3.11.5 installed on a computer with a Microsoft Windows 10 Pro operating system (Version 10.0.19043 Build 19043) comprising Intel(R) Core (TM) i7-7600U CPU @ 2.80 GHz, 2904 MHz, two Core(s) and 4 Logical Processor(s). The data preprocessing involved the following steps. The pseudocode of this program is shown in Algorithm 1.
(a)
Removal of characters that are not alphabets.
(b)
Removal of URLs
(c)
Removal of hashtags
(d)
Removal of user mentions
(e)
Detection of English words using tokenization.
(f)
Stemming.
(g)
Removal of stop words
(h)
Removal of numbers
Algorithm 1: Data Preprocessing
Input: Dataset
Output: New Attribute of Preprocessed Tweets
File Path
Read data as dataframe
English words: nltk.download(‘words’)
Stopwords: nltk.download(‘stopwords’)
Initialize an empty list to store preprocessed text
corpus[]
for i from 0 to n do
Obtain Text of the Tweet (‘text’ column)
  text = re.sub(‘[^a-zA-Z]’, whitespace, string)
  text = re.sub(r‘http\S+’, '', string)
  text = text.lower()
  text = text.split()
  ps = PorterStemmer()
  all_stopwords = english stopwords
  text = ps.stem(word) for word in text if not in all_stopwords
  text = whitespace.join(text)
  text = whitespace.join(re.sub(“(#[A-Za-z0-9]+)|
        (@[A-Za-z0-9]+)|([^0-9A-Za-z\t])|
        (\w+:\/\/\S+)", whitespace, string).split())
  text = whitespace.join(if c.isdigit() else c for c in text)
  text = whitespace.join(w for w in wordpunct_tokenize(text) if w.lower() in words)
  corpus ← append(text)
End of for loop
New Attribute ← Preprocessed Text (from corpus)
After performing data preprocessing, the GenderPerformr package in Python developed by Wang et al. [89,90] was applied to the usernames to detect the gender of each username. GenderPerformr uses an LSTM model built in PyTorch to analyze usernames and detect genders in terms of ‘male’, ‘female’, or ‘none’. The working of this algorithm was extended to classify usernames into four categories—‘male’, ‘female’, ‘none’, and ‘maybe’. The algorithm classified a username as ‘male’ if that username matched a male name from the list of male names accessible to this Python package. Similarly, the algorithm classified a username as ‘female’ if that username matched a female name from the list of female names accessible to this Python package. The algorithm classified a username as ‘none’ if that username was a word in the English dictionary that cannot be a person’s name. Finally, the algorithm classified a username as ‘maybe’ if the username was a word absent in the list of male and female names accessible to this Python package and the username was also not an English word. The classification performed by this algorithm was manually verified and any errors in classification were corrected during the process of manual verification. Furthermore, all the usernames that were classified as ‘maybe’ were manually classified as ‘male’, ‘female’, or ‘none’. The pseudocode of the program that was written in Python 3.11.5 to detect genders from Twitter usernames is presented as Algorithm 2.
Algorithm 2: Detect Gender from Twitter Usernames
Input: Dataset
Output: File with the Gender of each Twitter User
File Path
Read data as dataframe
procedure PredictGender (csv file)
   gp ← Initialize GenderPerformr
   output_file ← Initialize empty text file
   regex ← Initialize RegEx
   df ← Read csv file into Dataframe
   for each column in df do
    if column is user_name column then
      name_values ← Extract values of the column
    end if
   End of for loop
   for each name in name_values do
    if name is ”null”, ”nan”, empty, or None then
     write name and ”None” to Gender
    else if name does not match RegEx then
     write name to output file
     count number of words in name
     if words > 1 then
      splittedname ← split name by spaces
      name ← First element of splittedname
     end if
     str result ← Perform gender prediction
     using gp gender ← str result extract gender
     if gender is “M” then
      write ”Male” to Gender
     else if gender is ”F” then
      write ”Female” to Gender
     else if gender is empty or whitespace then
      write ”None” to Gender
     else
      if name in lowercase exists in set of english words then
       write ”None” to Gender
      else
       write ”Maybe” to Gender
      end if
     else
      write name and ”None” to Gender
     end if
    End of for loop
End of procedure
Write df with a new “Gender” attribute to a new .CSV file
Export .CSV file
Thereafter, three different models for sentiment analysis—VADER, Afinn, and TextBlob were applied to the Tweets. VADER (Valence Aware Dictionary and sEntiment Reasoner), developed by Hutto et al. [91] is a lexicon and rule-based sentiment analysis tool that is specifically attuned to sentiments expressed in social media. The VADER approach can analyze a text and classify it as positive, negative, or neutral. Furthermore, it can also detect the compound sentiment score and the intensity of the sentiment (0 to +4 for positive sentiment and 0 to −4 for negative sentiment) expressed in a given text. The AFINN lexicon developed by Nielsen is also used to analyze the sentiment of Tweets [92]. The AFINN lexicon is a list of English terms manually rated for valence with an integer between −5 (negative) and +5 (positive). Finally, TextBlob, developed by Lauria [93] is a lexicon-based sentiment analyzer that also uses a set of predefined rules to perform sentiment analysis and subjectivity analysis. The sentiment score lies between −1 to 1, where −1 identifies the most negative words such as ‘disgusting’, ‘awful’, and ‘pathetic’, and 1 identifies the most positive words like ‘excellent’, and ‘best’. The subjectivity score lies between 0 and 1. It represents the degree of personal opinion, if a sentence has high subjectivity i.e., close to 1, it means that the text contains more personal opinion than factual information. These three approaches for performing sentiment analysis of Tweets have been very popular, as can be seen from several recent works in this field which used VADER [94,95,96,97], Afinn [98,99,100,101], and TextBlob [102,103,104,105]. The pseudocodes of the programs that were written in Python 3.11.5 to apply VADER, Afinn, and TextBlob to these Tweets are shown in Algorithms 3–5, respectively.
Algorithm 3: Detect Sentiment of Tweets Using VADER
Input: Preprocessed Dataset (output from Algorithm 1)
Output: File with Sentiment of each Tweet
File Path
Read data as dataframe
Import VADER
sid obj ← Initialize SentimentIntensityAnalyzer
for each row in df[‘PreprocessedTweet’] do
  tweet_text ← df[‘PreprocessedTweet’][row]
   if tweet_text is null then
    sentiment score ← 0
   else
    sentiment_dict = sid_obj.polarity_scores(df[‘PreprocessedTweet’][row])
    compute sentiment_dict[‘compound’]
    sentiment score ← compound sentiment
   end if
  if sentiment score >= 0.05 then
   sentiment ← ‘positive’
  else if sentiment score <= −0.05 then
   sentiment ← ‘negative’
  else
   sentiment ← ‘neutral’
  end if
df [row] ← compound sentiment and sentiment score
End of for loop
Write df with new attributes – sentiment class and sentiment score to a new .CSV file
Export .CSV file
Algorithm 4: Detect Sentiment of Tweets Using Afinn
Input: Preprocessed Dataset (output from Algorithm 1)
Output: File with Sentiment of each Tweet
File Path
Read data as dataframe
Import Afinn
afn ← Instantiate Afinn
for each row in df[‘PreprocessedTweet’] do
  tweet_text ← df[‘PreprocessedTweet’][row]
   if tweet_text is null then
    sentiment score ← 0
   else
    apply afn.score() to df[‘PreprocessedTweet’][row]
    sentiment score ← afn.score(df[‘PreprocessedTweet’][row])
   end if
  if sentiment score > 0 then
   sentiment ← ‘positive’
  else if sentiment score < 0 then
   sentiment ← ‘negative’
  else
   sentiment ← ‘neutral’
  end if
df [row] ← sentiment and sentiment score
End of for loop
Write df with new attributes – sentiment class and sentiment score to a new .CSV file
Export .CSV file
Algorithm 5: Detect Polarity and Subjectivity of Tweets Using TextBlob
Input: Preprocessed Dataset (output from Algorithm 1)
Output: File with metrics for polarity and subjectivity of each Tweet
File Path
Read data as dataframe
Import TextBlob
Initialize Lists for Blob, Polarity, Subjectivity, Polarity Class, and Subjectivity Class
for row in df[‘PreprocessedTweet’] do
  convert item to TextBlob and append to Blob List
End of for loop
for each blob in Blob List do
  for each sentence in blob do
   calculate polarity and subjectivity
   append them to Polarity and Subjectivity Lists respectively
  End of for loop
End of for loop
for each value in Polarity List do
  if (p > 0):
   pclass.append(‘Positive’)
  else if (p < 0):
   pclass.append(‘Negative’)
  else:
   pclass.append(‘Neutral’)
  end if
End of for loop
for each value in Subjectivity List do
  if (s > 0.6):
   sclass.append(‘Highly Opinionated’)
  else if (s < 0.4):
   sclass.append(‘Least Opinionated’)
  else:
   sclass.append(‘Neutral’)
  end if
End of for loop
Write df with new attributes - polarity, polarity class, subjectivity, and subjectivity class to a new CSV file
Export .CSV file
Thereafter, toxicity analysis of these Tweets was performed using the Detoxify package [106]. It includes three different trained models and outputs different toxicity categories. These models are trained on data from three Kaggle jigsaw toxic comment classification challenges [107,108,109]. As a result of this analysis, each Tweet received a score in terms of the degree of toxicity, obscene content, identity attack, insult, threat, and sexually explicit content. The pseudocode of the program that was written in Python 3.11.5 to apply the Detoxify package to these Tweets is shown in Algorithm 6.
Algorithm 6: Perform Toxicity Analysis of the Tweets Using Detoxify
Input: Preprocessed Dataset (output from Algorithm 1)
Output: File with metrics of toxicity for each Tweet
File Path
Read data as dataframe
Import Detoxify
Instantiate Detoxify
predictor = Detoxify(‘multilingual’)
Initialize Lists for toxicity, obscene, identity attack, insult, threat, and sexually explicit
for each row in df[‘PreprocessedTweet’] do
  apply predictor.predict() to df[‘PreprocessedTweet’][row]
  data ← predictor.predict (df[‘PreprocessedTweet’][row])
  toxic_value = data[‘toxicity’]
  obscene_value = data['obscene’]
  identity_attack_value = data[‘identity_attack’]
  insult_value = data[‘insult’]
  threat_value = data[‘threat’]
  sexual_explicit_value = data[‘sexual_explicit’]
  append ← lists for toxicity, obscene, identity attack, insult, threat, sexually explicit
  score [] ← toxicity, obscene, identity attack, insult, threat, and sexually explicit
  max_value = maximum value in Score[]
  label = class for max_value
  append values to the corpus
End of for loop
data = []
for each i from 0 to n do:
   create an empty list tmp
   append tweet id, text, score[],max_value, and label to tmp
   append tmp to data
End of for loop
Write new attributes - toxicity, obscene, identity attack, insult, threat, and sexually explicit, and label to a new CSV file
Export .CSV file
Figure 2 represents a flowchart summarizing the working of Algorithms 1–6. In addition to the above, average activity analysis of different genders (male, female, and none) was also performed. The pseudocode of the program that was written in Python 3.11.5 to compute and analyze the average activity of different genders is shown in Algorithm 7. Algorithm 7 uses the formula for the total activity calculation of a Twitter user which was proposed in an earlier work in this field [110]. This formula is shown in Equation (1).
Activity of a Twitter User = Author Tweets count + Author favorites count
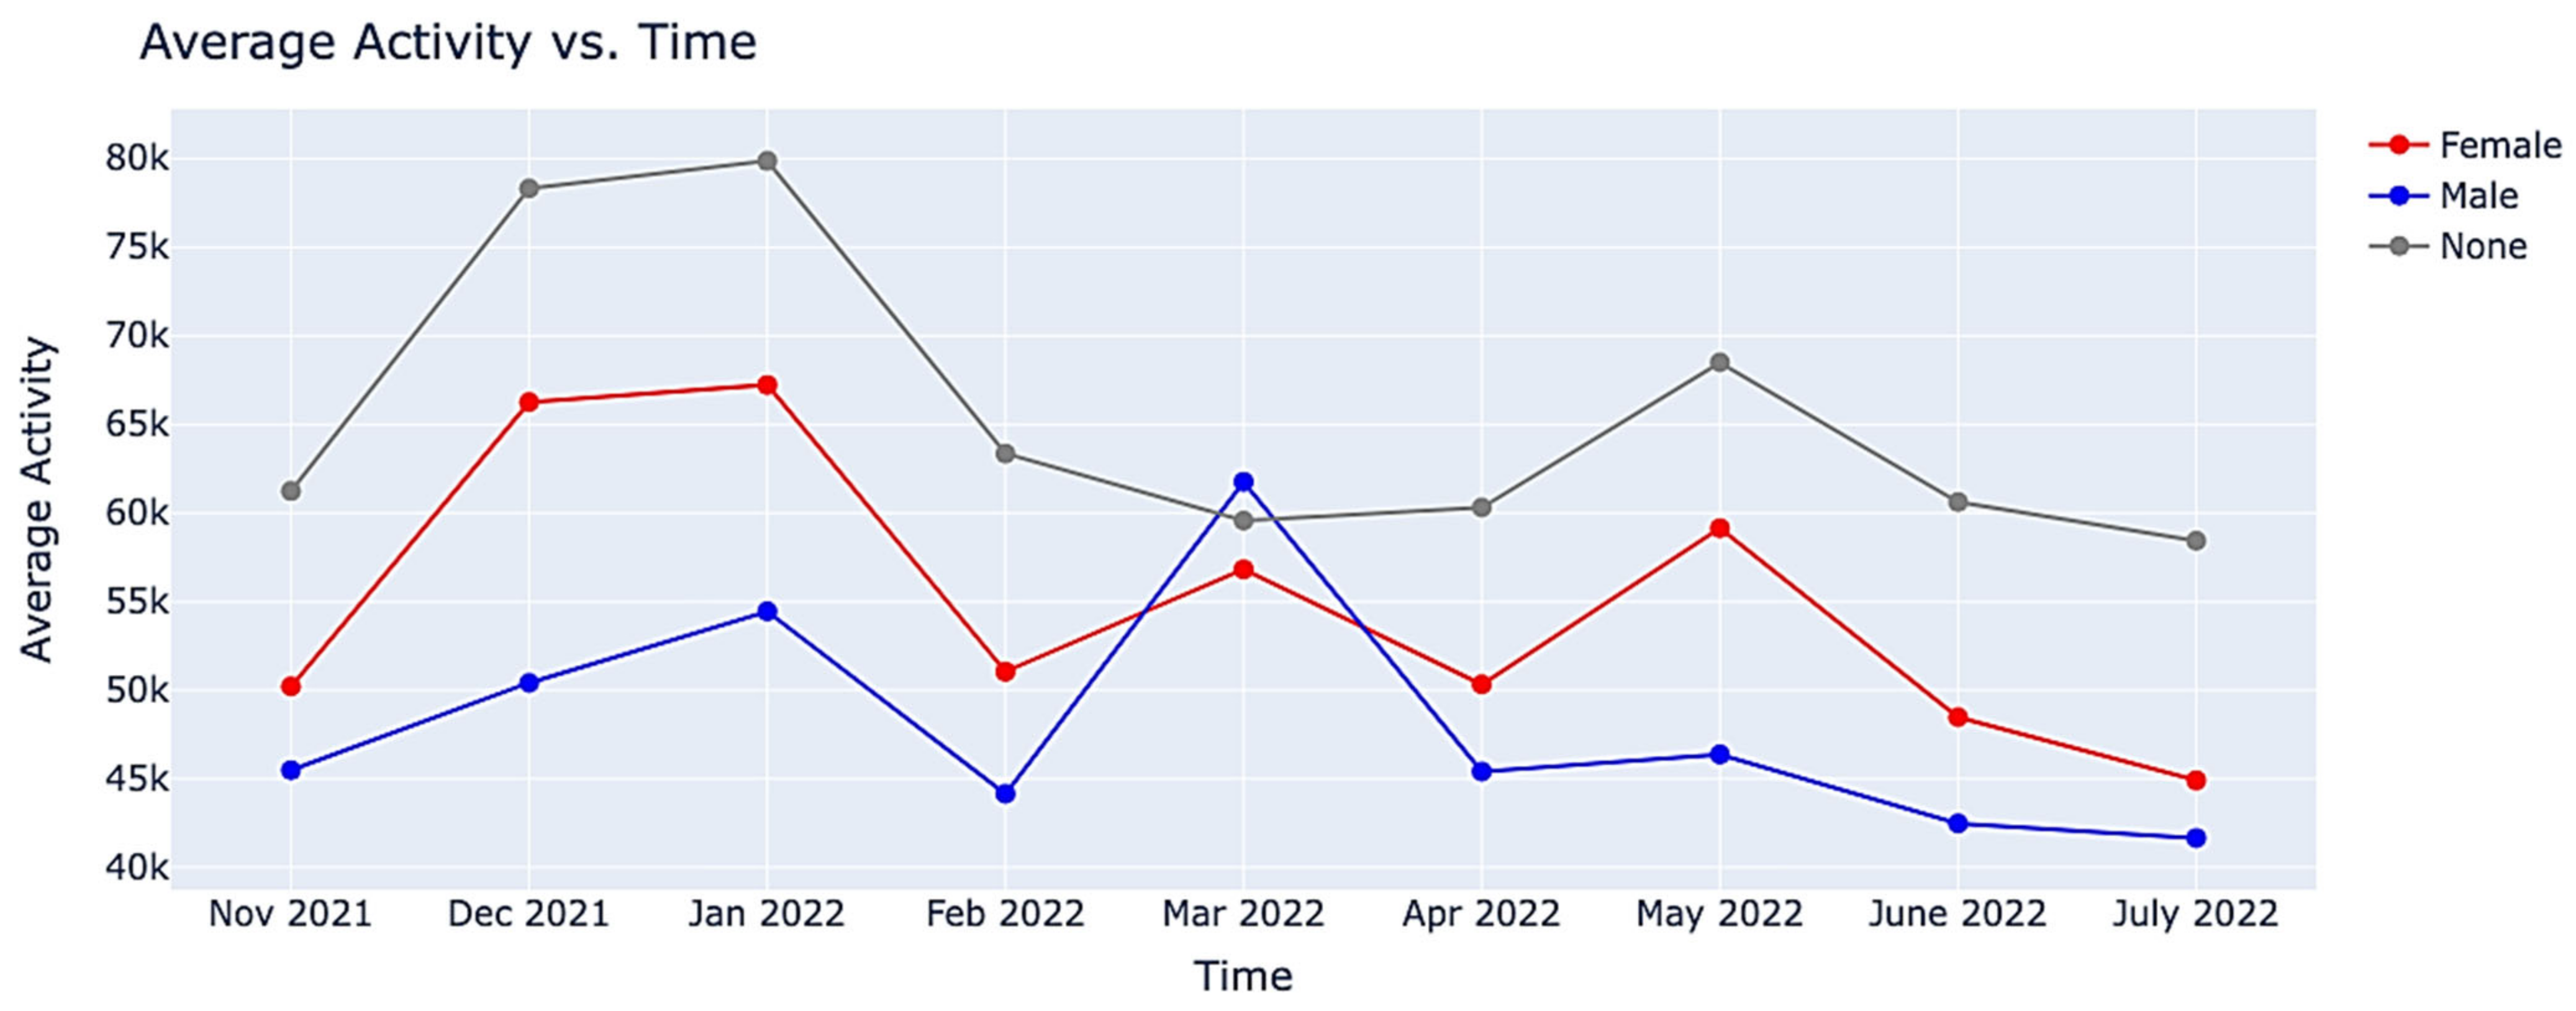
Algorithm 7: Compute the Average Activity of different Genders on a monthly basis
Input: Preprocessed Dataset (output from Algorithm 1)
Output: Average Activity per gender per month
File Path
Read data as dataframe
Initialize lists for distinct males, distinct females, and distinct none
for each row in df[‘created_at’] do
  extract month and year
  append data
End of for loop
Create new attribute month_year to hold month and year
for each month in df[‘month_year’] do
  d_males = number of distinct males based on df[‘user_id’] and df[‘gender’]
  d_females = number of distinct females based on df[‘user_id’] and df[‘gender’]
  d_none = calculate number of distinct none based on df[‘user_id’] and df[‘gender’]
  for each male in d_males
   activity = author Tweets count + author favorites count
   males_total_activity = males_total_activity + activity
End of for loop
males_avg_activity = males_total_activity/d_males
  for each female in d_females
   activity = author Tweets count + author favorites count
   females_total_activity = females_total_activity + activity
  End of for loop
females_avg_activity = females_total_activity/d_females
  for each none in d_none
   activity = author Tweets count + author favorites count
   none_total_activity = none_total_activity + activity
  End of for loop
none_avg_activity = none_total_activity/d_none
End of for loop
Finally, the trends in tweeting patterns related to online learning from different geographic regions were also analyzed to understand the gender-specific tweeting patterns from different geographic regions. To perform this analysis, the PyCountry [111] package was used. Specifically, the program that was written in Python applied the fuzzy search function available in this package to detect the country of a Twitter user based on the publicly listed city, county, state, or region on their Twitter profile. Algorithm 8 shows the pseudocode of the Python program that was written to perform this task. The results of applying all these algorithms on the dataset are discussed in Section 4.
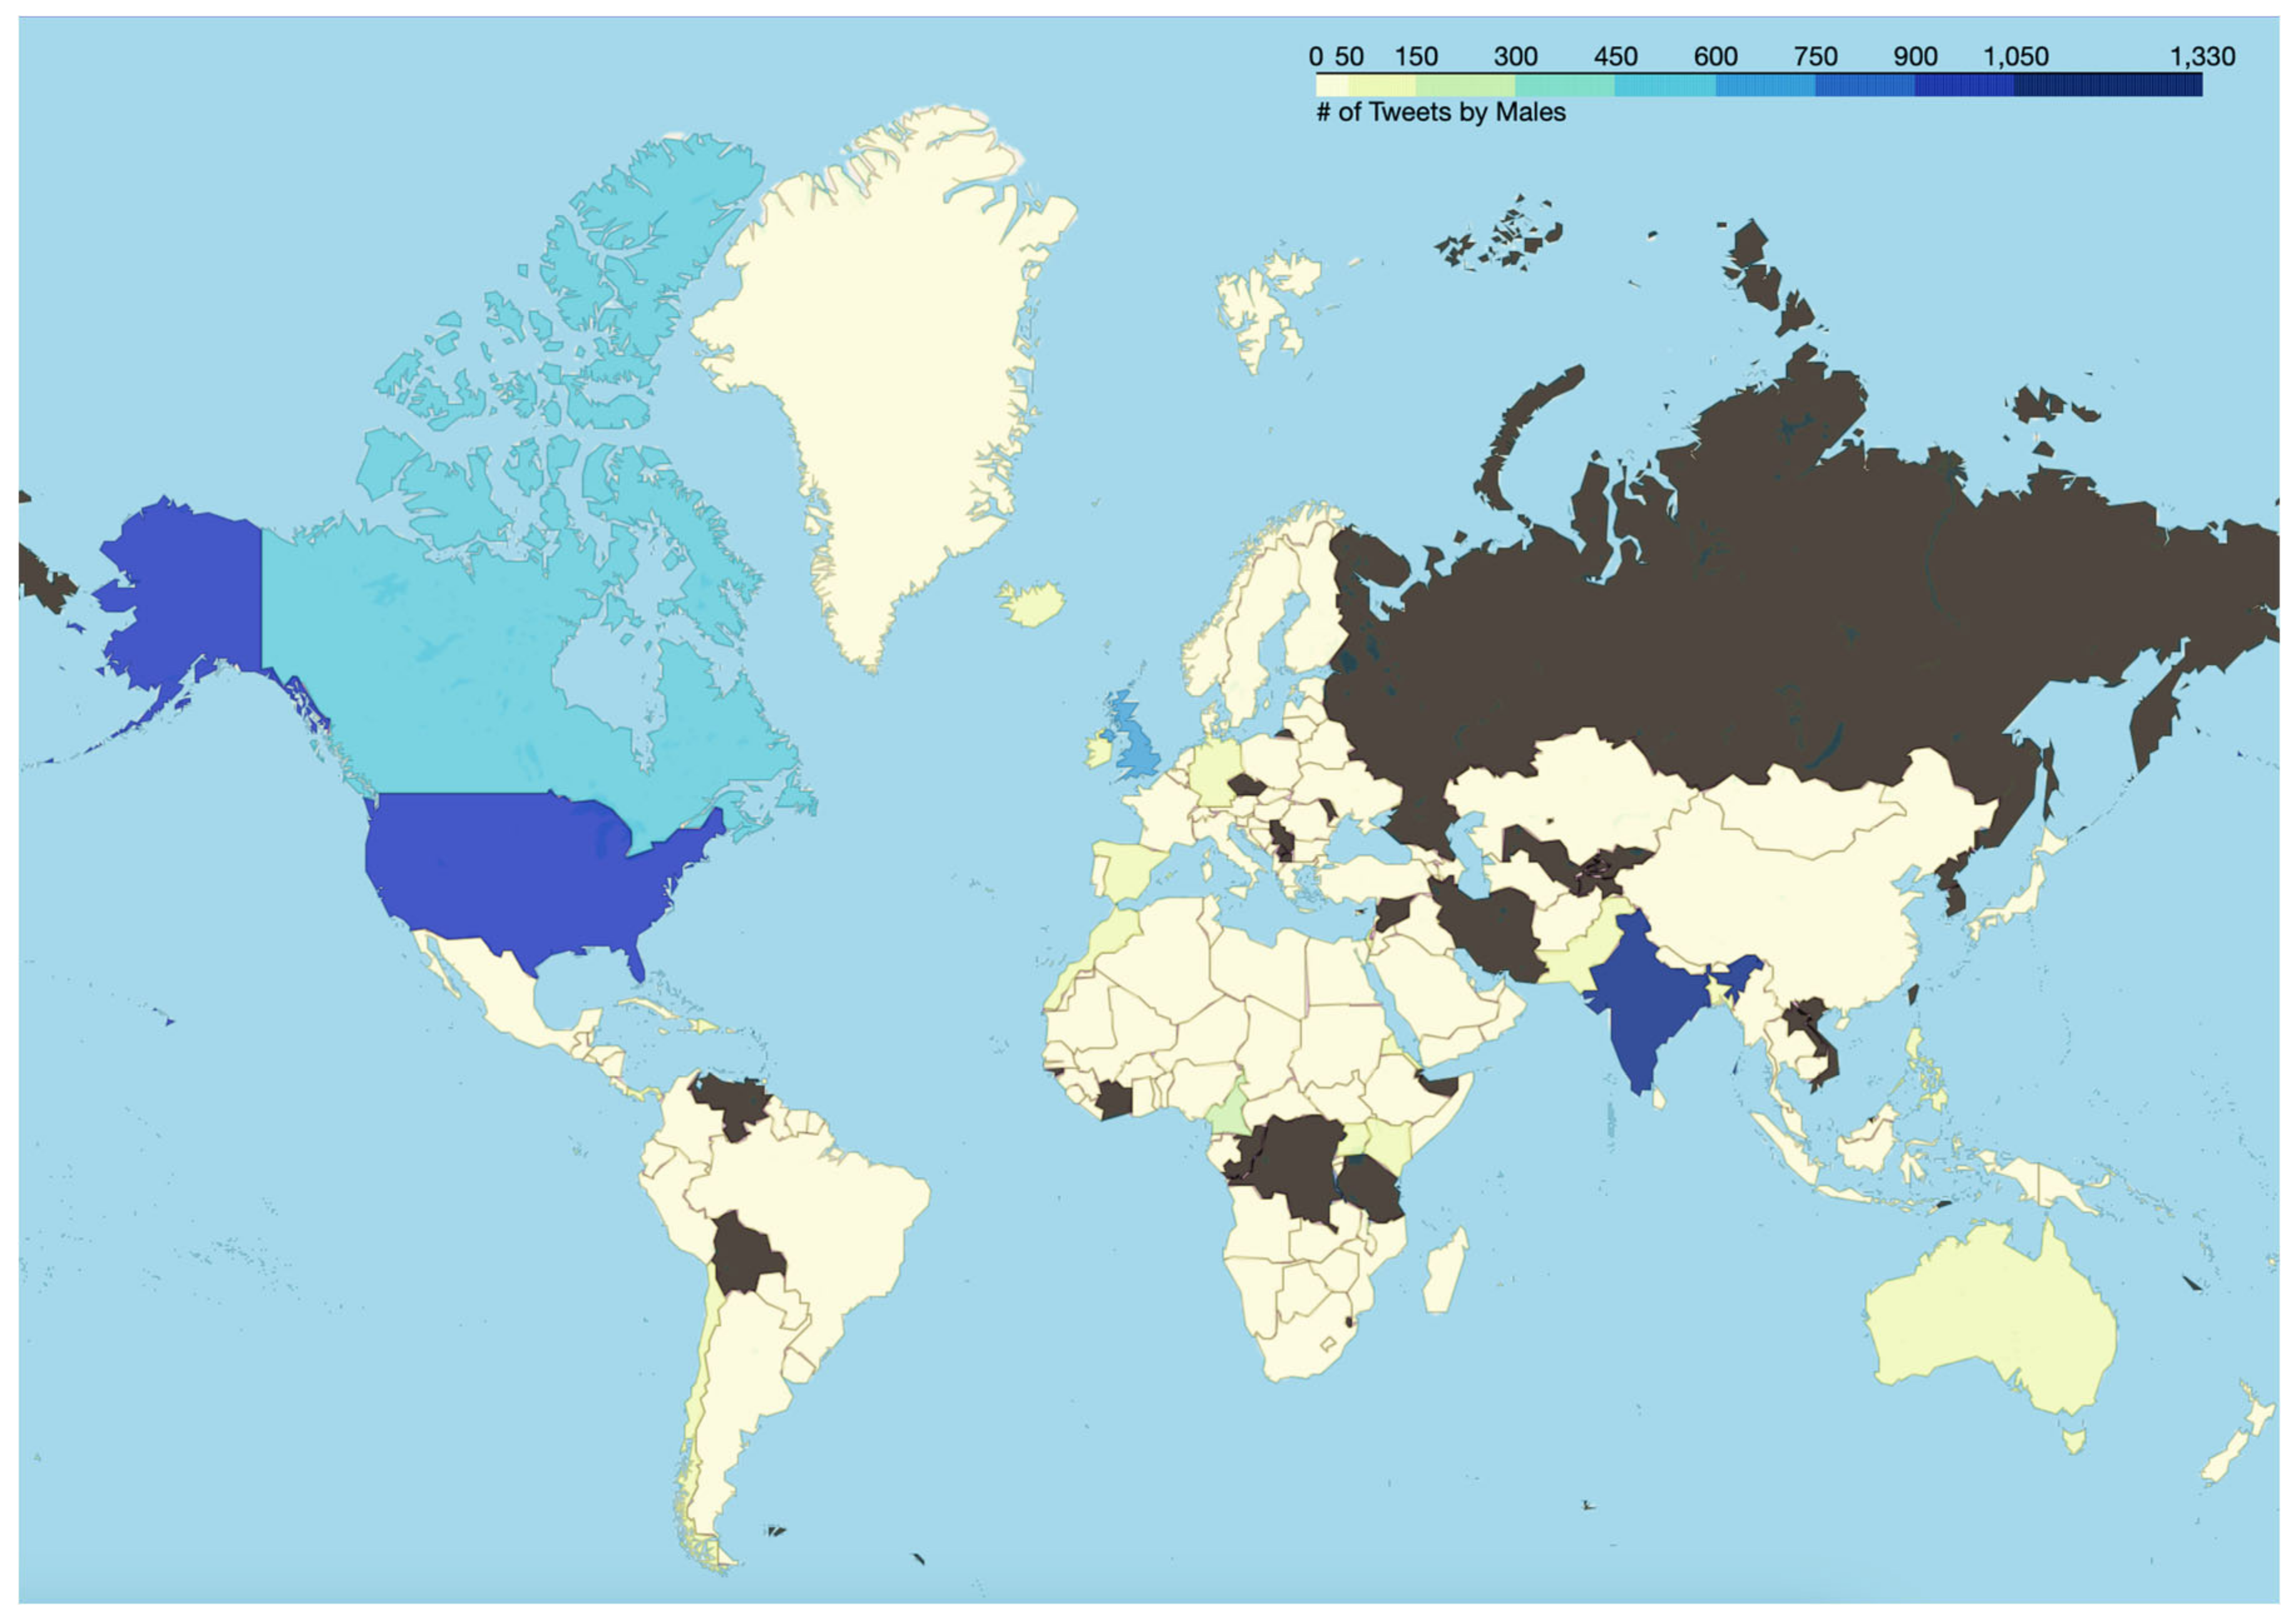
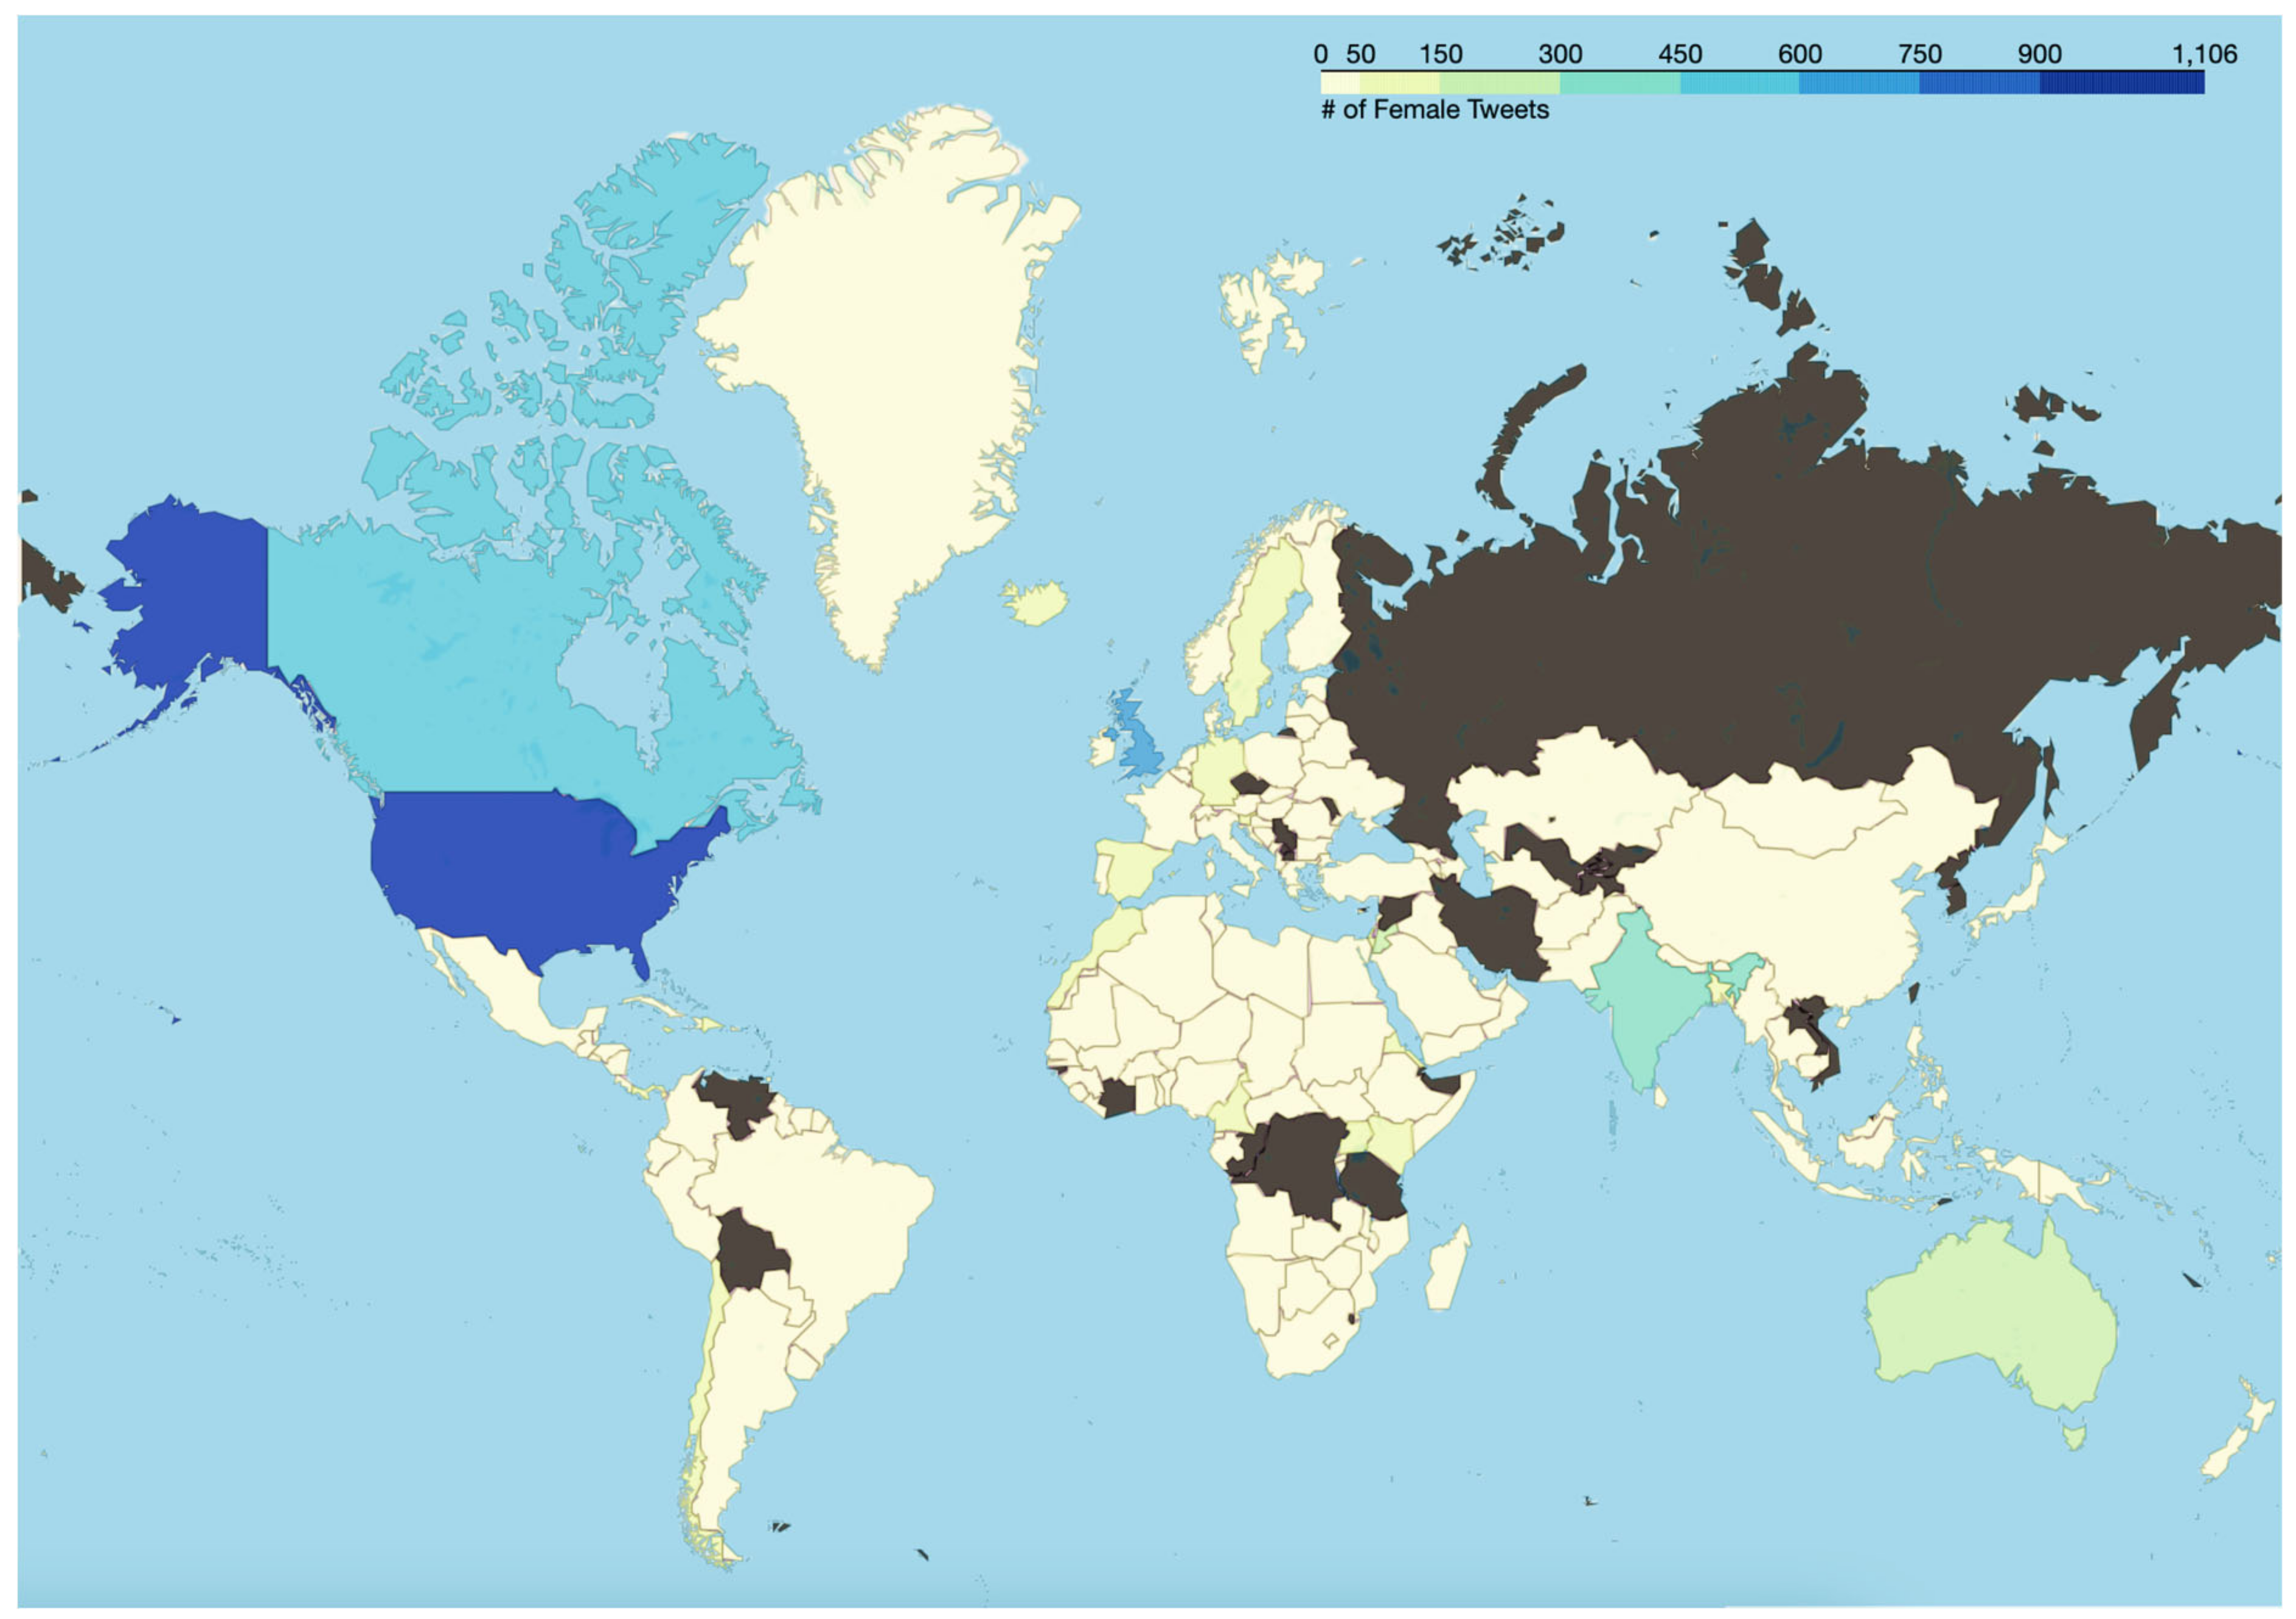
Algorithm 8: Detect Locations of Twitter Users, Visualize Gender-Specific Tweeting Patterns
Input: Dataset
Output: File with locations (country) of each user, visualization of gender-specific tweeting patterns
File Path
Read data as dataframe
Import PyCountry
Import Folium
Import Geodata data package
for each row in df[‘user_location’] do
 location_values = columnSeriesObj.values
End of for loop
For each location in location_values
if location is “null”, “nan”, empty, or None then
 country = none
else
  if spaces = location.count(‘ ’)
  if (spaces > 0):
   for word in location.split():
    country = pycountry.countries.search_fuzzy(word)
    defaultcountry = country.name
   if (spaces = 0)
    country = pycountry.countries.search_fuzzy(location)
   end if
append values to corpus
End of for loop
write new attribute “country” to the dataset
df pivotdata ← “user location” as the index and “Gender” as attributes
pivotdata [attributes] ← “Female”, “Male”, and “None”
pivot data [total] ← add “Male”, “Female”, and “None” columns
Instantiate Folium map m
define threshold scale ← list of threshold values for colored bins
choropleth layer ← custom color scale, ranges, and opacity
pivotdata [key] ← mapping
legend name ← pivotdata [attributes]
GenerateMap()

4. Results and Discussion

This section presents and discusses the results of this study. As stated in Section 3, Algorithm 2 was run on the dataset to detect the gender of each Twitter user. After obtaining the output from this algorithm, the classifications were manually verified, as well and the ‘maybe’ labels were manually classified as either ‘male’, ‘female’, or ‘none’. Thereafter, the dataset contained only three labels for the “Gender” attribute—‘male’, ‘female’, and ‘none’. Figure 3 shows a pie chart-based representation of the same. As can be seen from Figure 3, out of the Tweets posted by males and females, males posted a higher percentage of the Tweets. The results obtained from Algorithms 3 to 5 are presented in Figure 4, Figure 5 and Figure 6, respectively. Figure 4 presents a pie chart to show the percentage of Tweets in each of the sentiment classes (positive, negative, and neutral) as per VADER by taking all the genders together. As can be seen from Figure 4, the percentages of positive, negative, and neutral Tweets as per VADER were 41.704%, 29.932%, and 28.364%, respectively.
Similarly, the percentage of Tweets in each of these sentiment classes obtained from the outputs of Algorithms 4 and 5 are presented in Figure 5 and Figure 6, respectively. As can be seen from Figure 5, the percentage of positive Tweets (as per the Afinn approach for sentiment analysis) was higher than the percentage of negative and neutral Tweets. This is consistent with the findings from VADER (presented in Figure 4). From Figure 6, it can be inferred that, as per TextBlob, the percentage of positive Tweets was higher as compared to the percentage of negative and neutral Tweets. This is consistent with the results of VADER (Figure 4) and Afinn (Figure 5). After obtaining the outputs of these Algorithms, gender-specific Tweeting behavior was performed for these outputs, i.e., the percentage of Tweets posted by males, females, and none for each of these sentiment classes (positive, negative, and neutral) were computed. The results are presented in Table 2. As can be seen from Table 2, irrespective of the methodology of sentiment analysis (VADER, Afinn, or TextBlob) for each sentiment class (positive, negative, and neutral), between males and females, males posted a higher percentage of Tweets. In addition to sentiment analysis, Algorithm 5 also computed the subjectivity of each tweet and categorized each tweet as highly opinionated, least opinionated, or neutral. The results of the same are shown in Figure 7.
The results obtained from Algorithm 6 are discussed next. This algorithm analyzed all the Tweets and categorized them into one of toxicity classes—toxicity, obscene, identity attack, insult, threat, and sexually explicit. The number of Tweets that were classified into each of these classes was 36,081, 8729, 3411, 1165, 18, and 4, respectively. This is shown in Figure 8. Thereafter, the percentage of Tweets posted by each gender for each of these categories of subjectivity and toxic content was analyzed, and the results are presented in Table 3.
From Table 3, multiple inferences can be drawn. First, between males and females, females posted a higher percentage of highly opinionated Tweets. Second, for least opinionated Tweets and for Tweets assigned a neutral subjectivity class, between males and females, males posted a higher percentage of the Tweets. Third, in terms of toxic content analysis, for the classes—toxicity, obscene, identity attack, and insult, between males and females, males posted a higher percentage of the Tweets. However, for Tweets that were categorized as sexually explicit, between males and females, females posted a higher percentage of those Tweets. It is worth mentioning here that the results of detecting threats and sexually explicit content are based on data that constitutes less than 1% of the Tweets present in the dataset. So, in a real-world scenario, these percentages could vary when a greater number of Tweets are posted for each of the two categories—threat and sexually explicit.
In addition to analyzing the varying trends in sentiments and toxicity, the content of the underlying Tweets was also analyzed using word clouds. For the generation of these word clouds, the top 100 words (in terms of frequency were considered). To perform the same, a consensus of sentiment labels from the three different sentiment analysis approaches was considered. For instance, to prepare a word cloud of positive Tweets, all those Tweets that were labeled as positive by VADER, Afinn, and TextBlob were considered. Thereafter, for all the positive Tweets, gender-specific tweeting patterns were also analyzed to compute the top 100 words used by males for positive Tweets, the top 100 words used by females for positive Tweets, and the top 100 words used by Twitter accounts associated with a ‘none’ gender label. A high degree of overlap in terms of the 100 words for all these scenarios was observed. More specifically, a total of 79 words were common amongst the lists of the top 100 words for positive Tweets, the top 100 words used by males for positive Tweets, the top 100 words used by females for positive Tweets, and the top 100 words used by Twitter accounts associated with a ‘none’ gender label. So, to avoid redundancy, Figure A1 (refer to Appendix A) shows a word cloud-based representation of the top 100 words used in positive Tweets. Similarly, a high degree of overlap in terms of the 100 words was also observed for the analysis of different lists for negative Tweets and neutral Tweets. So, to avoid redundancy, Figure A2 and Figure A3 (refer to Appendix A) show word cloud-based representations of the top 100 words used in negative Tweets and neutral Tweets, respectively. In a similar manner, the top 100 frequently used words for the different subjectivity classes were also computed, and word cloud-based representations of the same are shown in Figure A4, Figure A5 and Figure A6 (refer to Appendix A).
After performing this analysis, a similar word frequency-based analysis was performed for the different categories of toxic content that were detected in the Tweets, using Algorithm 6. These classes were toxicity, obscene, identity attack, insult, threat, and sexually explicit. As shown in Algorithm 6, each Tweet was assigned a score for each of these classes, and whichever class received the highest score, the label of the tweet was decided accordingly. For instance, if the toxicity score for a Tweet was higher than the scores that the Tweet received for the classes—obscene, identity attack, insult, threat, and sexually explicit, then the label of that tweet was assigned as toxicity. Similarly, if the obscene score for a Tweet was higher than the scores that the Tweet received for the classes—toxicity, identity attack, insult, threat, and sexually explicit, then the label of that Tweet was assigned as obscene. The results of this word cloud-based analysis for the top 100 words (in terms of frequency) for each of these classes are shown in Figure A7, Figure A8, Figure A9, Figure A10, Figure A11 and Figure A12 (refer to Appendix A). As can be seen from Figure A7, Figure A8, Figure A9, Figure A10, Figure A11 and Figure A12 the patterns of communication were diverse for each of the categories of toxic content designated by the classes—toxicity, identity attack, insult, threat, and sexually explicit. At the same time, Figure A11 and Figure A12 are considerably different in terms of the top 100 words used as compared to Figure A7, Figure A8, Figure A9 and Figure A10. This also shows that for Tweets that were categorized as threat (Figure A11) and as containing sexually explicit content (Figure A12), the paradigms of communication and information exchange in those Tweets were very different as compared to Tweets categorized into any of the remaining classes representing different types of toxic content. In addition to performing this word cloud-based analysis, the scores each of these classes received were analyzed to infer the trends of their intensities over time. To perform this analysis, the mean value of each of these classes was computed per month and the results were plotted in a graphical manner as shown in Figure 9. From Figure 9, several insights related to the tweeting patterns of the general public can be inferred. For instance, the intensity of toxicity was higher than the intensity of obscene, identity attack, insult, threat, and sexually explicit content. Similarly, the intensity of insult was higher than the intensity of obscene, identity attack, threat, and sexually explicit content. Next, gender-specific tweeting patterns for each of these categories of toxic content were analyzed to understand the trends of the same. These results are shown in Figure 10, Figure 11, Figure 12, Figure 13, Figure 14 and Figure 15. This analysis also helped to unravel multiple paradigms of tweeting behavior of different genders in the context of online learning during COVID-19. For instance, Figure 10 and Figure 14 show that the intensity of toxicity and threat in Tweets by males and females has increased since July 2022. The analysis shown in Figure 11, shows that the intensity of obscene content in Tweets by males and females has decreased since May 2022.
The result of Algorithm 7 is shown in Figure 16. As can be seen from this Figure, between males and females, the average activity of females in the context of posting Tweets about online learning during COVID-19 has been higher in all months other than March 2022. The results from Algorithm 8 are presented in Figure 17 and Figure 18, respectively. Figure 17 shows the trends in Tweets about online learning during COVID-19 posted by males from different countries of the world. Similarly, Figure 18 shows the trends in Tweets about online learning during COVID-19 posted by females from different countries of the world. Figure 17 and Figure 18 reveal the patterns of posting Tweets by males and females about online learning during COVID-19. These patterns include similarities as well as differences. For instance, from these two figures, it can be inferred that in India, a higher percentage of the Tweets were posted by males as compared to females. However, in Australia, a higher percentage of the Tweets were posted by females as compared to males.
Finally, a comparative study is presented in Table 4 where the focus area of this work is compared with the focus areas of prior areas in this field to highlight its novelty and relevance. As can be seen from this Table, this paper is the first work in this area of research where the focus area has included text analysis, sentiment analysis, analysis of toxic content, and subjectivity analysis of Tweets about online learning during COVID-19. It is worth mentioning here that the work by Martinez et al. [86] considered only two types of toxic content—insults and threats whereas this paper performs the detection and analysis of six categories of toxic content— toxicity, obscene, identity attack, insult, threat, and sexually explicit. Furthermore, no prior work in this field has performed a gender-specific analysis of Tweets about online learning during COVID-19. As this paper analyzes the tweeting patterns in terms of gender, the authors would like to clarify three aspects. First, the results presented and discussed in this paper aim to address the research gaps in this field (as discussed in Section 2). These results are not presented with the intention to comment on any gender directly or indirectly. Second, the authors respect the gender identity of every individual and do not intend to comment on the same in any manner by presenting these results. Third, the authors respect every gender identity and associated pronouns [112]. The results presented in this paper take into account only three gender categories—‘male’, ‘female’, and ‘none’ as the GenderPerformr package (the current state-of-the-art method that predicts gender from usernames at the time of writing this paper) has limitations.
This study has a few limitations. First, the data analyzed is limited to the data originating from only a subset of the global population, specifically those who have the ability to access the internet and who posted Tweets about online learning during COVID-19. Second, the conversations on Twitter related to online learning during COVID-19 represent diverse topics and the underlining sentiments, subjectivity, and toxicity keep evolving on Twitter. The results of the analysis presented in this paper are based on the topics and the underlining sentiments, subjectivity, and toxicity related to online learning as expressed by people on Twitter between 9 November 2021 and 13 July 2022. Finally, the Tweets analyzed in this research were still accessible on Twitter at the time of data analysis. However, Twitter provides users with the option to remove their Tweets and deactivate their accounts. Moreover, in accordance with Twitter’s guidelines on inactive accounts [113], Twitter reserves the right to permanently delete accounts that have been inactive for an extended period of time, hence leading to the deletion of all Tweets posted from such accounts. If this study were to be replicated in the future, it is possible that the findings could exhibit some variation as compared to the results presented in this paper if any of the examined Tweets were removed as a result of users deleting those Tweets, users deleting their accounts, or Twitter permanently deleting one or more of the accounts from which the analyzed Tweets were posted.

5. Conclusions

To reduce the rapid spread of the SARS-CoV-2 virus, several universities, colleges, and schools across the world transitioned to online learning. This was associated with a range of emotions in students, educators, and the general public, who used social media platforms such as Twitter during this time to share and exchange information, views, and perspectives related to online learning, leading to the generation of Big Data of conversations in this context. Twitter has been popular amongst researchers from different domains for the investigation of patterns of public discourse related to different topics. Furthermore, out of several social media platforms, Twitter has the highest gender gap as of 2023. There have been a few works published in the last few months where sentiment analysis of Tweets about online learning during COVID-19 was performed. However, those works have multiple limitations centered around a lack of reporting from multiple sentiment analysis approaches, a lack of focus on subjectivity analysis, a lack of focus on toxicity analysis, and a lack of focus on gender-specific tweeting patterns. This paper aims to address these research gaps as well as it aims to contribute towards advancing research and development in this field. A dataset comprising about 50,000 Tweets about online learning during COVID-19, posted on Twitter between 9 November 2021 and 13 July 2022, was analyzed for this study. This work reports multiple novel findings. First, the results of sentiment analysis from VADER, Afinn, and TextBlob show that a higher percentage of the Tweets were positive. The results of gender-specific sentiment analysis indicate that for positive Tweets, negative Tweets, and neutral Tweets, between males and females, males posted a higher percentage of the Tweets. Second, the results from subjectivity analysis show that the percentage of least opinionated, neutral opinionated, and highly opinionated Tweets were 56.568%, 30.898%, and 12.534%, respectively. The gender-specific results for subjectivity analysis show that for two subjectivity classes (least opinionated and neutral opinionated) males posted a higher percentage of Tweets as compared to females. However, females posted a higher percentage of highly opinionated Tweets as compared to males. Third, toxicity detection was applied to the Tweets to detect different categories of toxic content—toxicity, obscene, identity attack, insult, threat, and sexually explicit. The gender-specific analysis of the percentage of Tweets posted by each gender in each of these categories revealed several novel insights. For instance, males posted a higher percentage of Tweets that were categorized as toxicity, obscene, identity attack, insult, and threat, as compared to females. However, for the sexually explicit category, females posted a higher percentage of Tweets as compared to males. Fourth, gender-specific tweeting patterns for each of these categories of toxic content were analyzed to understand the trends of the same. These results unraveled multiple paradigms of tweeting behavior of different genders in the context of online learning during COVID-19. For instance, the results show that the intensity of toxicity and threat in Tweets by males and females has increased since July 2022. To add to this, the intensity of obscene content in Tweets by males and females has decreased since May 2022. Fifth, the average activity of males and females per month in the context of posting Tweets about online learning was also investigated. The findings indicate that the average activity of females has been higher in all months as compared to males other than March 2022. Finally, country-specific tweeting patterns of males and females were also investigated which presented multiple novel insights. For instance, in India, a higher percentage of Tweets about online learning during COVID-19 were posted by males as compared to females. However, in Australia, a higher percentage of such Tweets were posted by females as compared to males. As per the best knowledge of the authors, no similar work has been conducted in this field thus far. Future work in this area would involve performing gender-specific topic modeling to investigate the similarities and differences in terms of the topics that have been represented in the Tweets posted by males and females to understand the underlying context of the public discourse on Twitter in this regard.

Author Contributions

Conceptualization, N.T.; methodology, N.T., S.C., K.K. and Y.N.D.; software, N.T., S.C., K.K., Y.N.D. and M.S.; validation, N.T.; formal analysis, N.T., K.K., S.C., Y.N.D. and V.K.; investigation, N.T., K.K., S.C. and Y.N.D.; resources, N.T., K.K., S.C. and Y.N.D.; data curation, N.T. and S.C.; writing—original draft preparation, N.T., V.K., K.K., M.S., Y.N.D. and S.C.; writing—review and editing, N.T.; visualization, N.T., S.C., K.K. and Y.N.D.; supervision, N.T.; project administration, N.T.; funding acquisition, Not Applicable. All authors have read and agreed to the published version of the manuscript.

Funding

This research received no external funding.

Institutional Review Board Statement

Not applicable.

Informed Consent Statement

Not applicable.

Data Availability Statement

The data analyzed in this study are publicly available at https://doi.org/10.5281/zenodo.6837118 (accessed on 23 August 2023).

Conflicts of Interest

The authors declare no conflict of interest.

Appendix A

Figure A1. A word cloud-based representation of the 100 most frequently used in positive Tweets.
Computers 12 00221 g0a1
Figure A2. A word cloud-based representation of the 100 most frequently used in negative Tweets.
Computers 12 00221 g0a2
Figure A3. A word cloud-based representation of the 100 most frequently used in neutral Tweets.
Computers 12 00221 g0a3
Figure A4. A word cloud-based representation of the 100 most frequently used words in Tweets that were highly opinionated.
Computers 12 00221 g0a4
Figure A5. A word cloud-based representation of the 100 most frequently used words in Tweets that were least opinionated.
Computers 12 00221 g0a5
Figure A6. A word cloud-based representation of the 100 most frequently used words in Tweets that were categorized as having a neutral opinion.
Computers 12 00221 g0a6
Figure A7. A word cloud-based representation of the 100 most frequently used words in Tweets that belonged to the toxicity category.
Computers 12 00221 g0a7
Figure A8. A word cloud-based representation of the 100 most frequently used words in Tweets that belonged to the obscene category.
Computers 12 00221 g0a8
Figure A9. A word cloud-based representation of the 100 most frequently used words in Tweets that belonged to the identity attack category.
Computers 12 00221 g0a9
Figure A10. A word cloud-based representation of the 100 most frequently used words in Tweets that belonged to the insult category.
Computers 12 00221 g0a10
Figure A11. A word cloud-based representation of the 100 most frequently used words in Tweets that belonged to the threat category.
Computers 12 00221 g0a11
Figure A12. A word cloud-based representation of the 100 most frequently used words in Tweets that belonged to the sexually explicit category.
Computers 12 00221 g0a12

References

  1. Fauci, A.S.; Lane, H.C.; Redfield, R.R. COVID-19—Navigating the Uncharted. N. Engl. J. Med. 2020, 382, 1268–1269. [Google Scholar] [CrossRef] [PubMed]
  2. Cucinotta, D.; Vanelli, M. WHO Declares COVID-19 a Pandemic. Acta Bio Medica Atenei Parm. 2020, 91, 157. [Google Scholar] [CrossRef]
  3. WHO Coronavirus (COVID-19) Dashboard. Available online: https://covid19.who.int/ (accessed on 26 September 2023).
  4. Allen, D.W. COVID-19 Lockdown Cost/Benefits: A Critical Assessment of the Literature. Int. J. Econ. Bus. 2022, 29, 1–32. [Google Scholar] [CrossRef]
  5. Kumar, V.; Sharma, D. E-Learning Theories, Components, and Cloud Computing-Based Learning Platforms. Int. J. Web-based Learn. Teach. Technol. 2021, 16, 1–16. [Google Scholar] [CrossRef]
  6. Muñoz-Najar, A.; Gilberto, A.; Hasan, A.; Cobo, C.; Azevedo, J.P.; Akmal, M. Remote Learning during COVID-19: Lessons from Today, Principles for Tomorrow; World Bank: Washington, DC, USA, 2021. [Google Scholar]
  7. Simamora, R.M.; De Fretes, D.; Purba, E.D.; Pasaribu, D. Practices, Challenges, and Prospects of Online Learning during COVID-19 Pandemic in Higher Education: Lecturer Perspectives. Stud. Learn. Teach. 2020, 1, 185–208. [Google Scholar] [CrossRef]
  8. DeNardis, L. The Internet in Everything; Yale University Press: New Haven, CT, USA, 2020; ISBN 9780300233070. [Google Scholar]
  9. Bonifazi, G.; Cauteruccio, F.; Corradini, E.; Marchetti, M.; Terracina, G.; Ursino, D.; Virgili, L. A Framework for Investigating the Dynamics of User and Community Sentiments in a Social Platform. Data Knowl. Eng. 2023, 146, 102183. [Google Scholar] [CrossRef]
  10. Belle Wong, J.D. Top Social Media Statistics and Trends of 2023. Available online: https://www.forbes.com/advisor/business/social-media-statistics/ (accessed on 26 September 2023).
  11. Morgan-Lopez, A.A.; Kim, A.E.; Chew, R.F.; Ruddle, P. Predicting Age Groups of Twitter Users Based on Language and Metadata Features. PLoS ONE 2017, 12, e0183537. [Google Scholar] [CrossRef]
  12. #InfiniteDial. The Infinite Dial 2022. Available online: http://www.edisonresearch.com/wp-content/uploads/2022/03/Infinite-Dial-2022-Webinar-revised.pdf (accessed on 26 September 2023).
  13. Twitter ‘Lurkers’ Follow–and Are Followed by–Fewer Accounts. Available online: https://www.pewresearch.org/short-reads/2022/03/16/5-facts-about-Twitter-lurkers/ft_2022-03-16_Twitterlurkers_03/ (accessed on 26 September 2023).
  14. Lin, Y. Number of Twitter Users in the US [Aug 2023 Update]. Available online: https://www.oberlo.com/statistics/number-of-Twitter-users-in-the-us (accessed on 26 September 2023).
  15. Twitter: Distribution of Global Audiences 2021, by Age Group. Available online: https://www.statista.com/statistics/283119/age-distribution-of-global-Twitter-users/ (accessed on 26 September 2023).
  16. Feger, A. TikTok Screen Time Will Approach 60 Minutes a Day for US Adult Users. Available online: https://www.insiderintelligence.com/content/tiktok-screen-time-will-approach-60-minutes-day-us-adult-users/ (accessed on 26 September 2023).
  17. Demographic Profiles and Party of Regular Social Media News Users in the U.S. Available online: https://www.pewresearch.org/journalism/2021/01/12/news-use-across-social-media-platforms-in-2020/pj_2021-01-12_news-social-media_0-04/ (accessed on 26 September 2023).
  18. Countries with Most X/Twitter Users 2023. Available online: https://www.statista.com/statistics/242606/number-of-active-Twitter-users-in-selected-countries/ (accessed on 26 September 2023).
  19. Kemp, S. Twitter Users, Stats, Data, Trends, and More—DataReportal–Global Digital Insights. Available online: https://datareportal.com/essential-Twitter-stats (accessed on 26 September 2023).
  20. Singh, C. 60+ Twitter Statistics to Skyrocket Your Branding in 2023. Available online: https://www.socialpilot.co/blog/Twitter-statistics (accessed on 26 September 2023).
  21. Albrecht, S.; Lutz, B.; Neumann, D. The Behavior of Blockchain Ventures on Twitter as a Determinant for Funding Success. Electron. Mark. 2020, 30, 241–257. [Google Scholar] [CrossRef]
  22. Kraaijeveld, O.; De Smedt, J. The Predictive Power of Public Twitter Sentiment for Forecasting Cryptocurrency Prices. J. Int. Financ. Mark. Inst. Money 2020, 65, 101188. [Google Scholar] [CrossRef]
  23. Siapera, E.; Hunt, G.; Lynn, T. #GazaUnderAttack: Twitter, Palestine and Diffused War. Inf. Commun. Soc. 2015, 18, 1297–1319. [Google Scholar] [CrossRef]
  24. Chen, E.; Ferrara, E. Tweets in Time of Conflict: A Public Dataset Tracking the Twitter Discourse on the War between Ukraine and Russia. In Proceedings of the International AAAI Conference on Web and Social Media, Limassol, Cyprus, 5–8 June 2023; Volume 17, pp. 1006–1013. [Google Scholar] [CrossRef]
  25. Madichetty, S.; Muthukumarasamy, S.; Jayadev, P. Multi-Modal Classification of Twitter Data during Disasters for Humanitarian Response. J. Ambient Intell. Humaniz. Comput. 2021, 12, 10223–10237. [Google Scholar] [CrossRef]
  26. Dimitrova, D.; Heidenreich, T.; Georgiev, T.A. The Relationship between Humanitarian NGO Communication and User Engagement on Twitter. New Media Soc. 2022, 146144482210889. [Google Scholar] [CrossRef]
  27. Weller, K.; Bruns, A.; Burgess, J.; Mahrt, M.; Twitter, C.P.T. Twitter and Society; 447p. Available online: https://journals.uio.no/TJMI/article/download/825/746/3768 (accessed on 26 September 2023).
  28. Li, M.; Turki, N.; Izaguirre, C.R.; DeMahy, C.; Thibodeaux, B.L.; Gage, T. Twitter as a Tool for Social Movement: An Analysis of Feminist Activism on Social Media Communities. J. Community Psychol. 2021, 49, 854–868. [Google Scholar] [CrossRef]
  29. Edinger, A.; Valdez, D.; Walsh-Buhi, E.; Trueblood, J.S.; Lorenzo-Luaces, L.; Rutter, L.A.; Bollen, J. Misinformation and Public Health Messaging in the Early Stages of the Mpox Outbreak: Mapping the Twitter Narrative with Deep Learning. J. Med. Internet Res. 2023, 25, e43841. [Google Scholar] [CrossRef] [PubMed]
  30. Bonifazi, G.; Corradini, E.; Ursino, D.; Virgili, L. New Approaches to Extract Information from Posts on COVID-19 Published on Reddit. Int. J. Inf. Technol. Decis. Mak. 2022, 21, 1385–1431. [Google Scholar] [CrossRef]
  31. Hargittai, E.; Walejko, G. THE PARTICIPATION DIVIDE: Content Creation and Sharing in the Digital Age1. Inf. Commun. Soc. 2008, 11, 239–256. [Google Scholar] [CrossRef]
  32. Trevor, M.C. Political Socialization, Party Identification, and the Gender Gap. Public Opin. Q. 1999, 63, 62–89. [Google Scholar] [CrossRef]
  33. Verba, S.; Schlozman, K.L.; Brady, H.E. Voice and Equality: Civic Voluntarism in American Politics; Harvard University Press: London, UK, 1995; ISBN 9780674942936. [Google Scholar]
  34. Bode, L. Closing the Gap: Gender Parity in Political Engagement on Social Media. Inf. Commun. Soc. 2017, 20, 587–603. [Google Scholar] [CrossRef]
  35. Lutz, C.; Hoffmann, C.P.; Meckel, M. Beyond Just Politics: A Systematic Literature Review of Online Participation. First Monday 2014, 19. [Google Scholar] [CrossRef]
  36. Strandberg, K. A Social Media Revolution or Just a Case of History Repeating Itself? The Use of Social Media in the 2011 Finnish Parliamentary Elections. New Media Soc. 2013, 15, 1329–1347. [Google Scholar] [CrossRef]
  37. Vochocová, L.; Štětka, V.; Mazák, J. Good Girls Don’t Comment on Politics? Gendered Character of Online Political Participation in the Czech Republic. Inf. Commun. Soc. 2016, 19, 1321–1339. [Google Scholar] [CrossRef]
  38. Gil de Zúñiga, H.; Veenstra, A.; Vraga, E.; Shah, D. Digital Democracy: Reimagining Pathways to Political Participation. J. Inf. Technol. Politics 2010, 7, 36–51. [Google Scholar] [CrossRef]
  39. Vissers, S.; Stolle, D. The Internet and New Modes of Political Participation: Online versus Offline Participation. Inf. Commun. Soc. 2014, 17, 937–955. [Google Scholar] [CrossRef]
  40. Vesnic-Alujevic, L. Political Participation and Web 2.0 in Europe: A Case Study of Facebook. Public Relat. Rev. 2012, 38, 466–470. [Google Scholar] [CrossRef]
  41. Krasnova, H.; Veltri, N.F.; Eling, N.; Buxmann, P. Why Men and Women Continue to Use Social Networking Sites: The Role of Gender Differences. J. Strat. Inf. Syst. 2017, 26, 261–284. [Google Scholar] [CrossRef]
  42. Social Media Fact Sheet. Available online: https://www.pewresearch.org/internet/fact-sheet/social-media/?tabId=tab-45b45364-d5e4-4f53-bf01-b77106560d4c (accessed on 26 September 2023).
  43. Global WhatsApp User Distribution by Gender 2023. Available online: https://www.statista.com/statistics/1305750/distribution-whatsapp-users-by-gender/ (accessed on 26 September 2023).
  44. Sina Weibo: User Gender Distribution 2022. Available online: https://www.statista.com/statistics/1287809/sina-weibo-user-gender-distibution-worldwide/ (accessed on 26 September 2023).
  45. QQ: User Gender Distribution 2022. Available online: https://www.statista.com/statistics/1287794/qq-user-gender-distibution-worldwide/ (accessed on 26 September 2023).
  46. Samanta, O. Telegram Revenue & User Statistics 2023. Available online: https://prioridata.com/data/telegram-statistics/ (accessed on 26 September 2023).
  47. Shewale, R. 36 Quora Statistics: All-Time Stats & Data (2023). Available online: https://www.demandsage.com/quora-statistics/ (accessed on 26 September 2023).
  48. Gitnux the Most Surprising Tumblr Statistics and Trends in 2023. Available online: https://blog.gitnux.com/tumblr-statistics/ (accessed on 26 September 2023).
  49. Social Media User Diversity Statistics. Available online: https://blog.hootsuite.com/wp-content/uploads/2023/03/Twitter-stats-4.jpg (accessed on 26 September 2023).
  50. WeChat: User Gender Distribution 2022. Available online: https://www.statista.com/statistics/1287786/wechat-user-gender-distibution-worldwide/ (accessed on 26 September 2023).
  51. Global Snapchat User Distribution by Gender 2023. Available online: https://www.statista.com/statistics/326460/snapchat-global-gender-group/ (accessed on 26 September 2023).
  52. Villavicencio, C.; Macrohon, J.J.; Inbaraj, X.A.; Jeng, J.-H.; Hsieh, J.-G. Twitter Sentiment Analysis towards COVID-19 Vaccines in the Philippines Using Naïve Bayes. Information 2021, 12, 204. [Google Scholar] [CrossRef]
  53. Boon-Itt, S.; Skunkan, Y. Public Perception of the COVID-19 Pandemic on Twitter: Sentiment Analysis and Topic Modeling Study. JMIR Public Health Surveill. 2020, 6, e21978. [Google Scholar] [CrossRef]
  54. Marcec, R.; Likic, R. Using Twitter for Sentiment Analysis towards AstraZeneca/Oxford, Pfizer/BioNTech and Moderna COVID-19 Vaccines. Postgrad. Med. J. 2022, 98, 544–550. [Google Scholar] [CrossRef]
  55. Machuca, C.R.; Gallardo, C.; Toasa, R.M. Twitter Sentiment Analysis on Coronavirus: Machine Learning Approach. J. Phys. Conf. Ser. 2021, 1828, 012104. [Google Scholar] [CrossRef]
  56. Kruspe, A.; Häberle, M.; Kuhn, I.; Zhu, X.X. Cross-Language Sentiment Analysis of European Twitter Messages Duringthe COVID-19 Pandemic. arXiv 2020, arXiv:2008.12172v1. [Google Scholar]
  57. Vijay, T.; Chawla, A.; Dhanka, B.; Karmakar, P. Sentiment Analysis on COVID-19 Twitter Data. In Proceedings of the 2020 5th IEEE International Conference on Recent Advances and Innovations in Engineering (ICRAIE), Jaipur, India, 1–3 December 2020; IEEE: New York, NY, USA, 2020. [Google Scholar]
  58. Shofiya, C.; Abidi, S. Sentiment Analysis on COVID-19-Related Social Distancing in Canada Using Twitter Data. Int. J. Environ. Res. Public Health 2021, 18, 5993. [Google Scholar] [CrossRef] [PubMed]
  59. Sontayasara, T.; Jariyapongpaiboon, S.; Promjun, A.; Seelpipat, N.; Saengtabtim, K.; Tang, J.; Leelawat, N. Twitter Sentiment Analysis of Bangkok Tourism during COVID-19 Pandemic Using Support Vector Machine Algorithm. J. Disaster Res. 2021, 16, 24–30. [Google Scholar] [CrossRef]
  60. Nemes, L.; Kiss, A. Social Media Sentiment Analysis Based on COVID-19. J. Inf. Telecommun. 2021, 5, 1–15. [Google Scholar] [CrossRef]
  61. Okango, E.; Mwambi, H. Dictionary Based Global Twitter Sentiment Analysis of Coronavirus (COVID-19) Effects and Response. Ann. Data Sci. 2022, 9, 175–186. [Google Scholar] [CrossRef]
  62. Singh, C.; Imam, T.; Wibowo, S.; Grandhi, S. A Deep Learning Approach for Sentiment Analysis of COVID-19 Reviews. Appl. Sci. 2022, 12, 3709. [Google Scholar] [CrossRef]
  63. Kaur, H.; Ahsaan, S.U.; Alankar, B.; Chang, V. A Proposed Sentiment Analysis Deep Learning Algorithm for Analyzing COVID-19 Tweets. Inf. Syst. Front. 2021, 23, 1417–1429. [Google Scholar] [CrossRef] [PubMed]
  64. Vernikou, S.; Lyras, A.; Kanavos, A. Multiclass Sentiment Analysis on COVID-19-Related Tweets Using Deep Learning Models. Neural Comput. Appl. 2022, 34, 19615–19627. [Google Scholar] [CrossRef] [PubMed]
  65. Sharma, S.; Sharma, A. Twitter Sentiment Analysis during Unlock Period of COVID-19. In Proceedings of the 2020 Sixth International Conference on Parallel, Distributed and Grid Computing (PDGC), Waknaghat, India, 6–8 November 2020; IEEE: New York, NY, USA, 2020; pp. 221–224. [Google Scholar]
  66. Sanders, A.C.; White, R.C.; Severson, L.S.; Ma, R.; McQueen, R.; Alcântara Paulo, H.C.; Zhang, Y.; Erickson, J.S.; Bennett, K.P. Unmasking the Conversation on Masks: Natural Language Processing for Topical Sentiment Analysis of COVID-19 Twitter Discourse. AMIA Summits Transl. Sci. Proc. 2021, 2021, 555. [Google Scholar]
  67. Alabid, N.N.; Katheeth, Z.D. Sentiment Analysis of Twitter Posts Related to the COVID-19 Vaccines. Indones. J. Electr. Eng. Comput. Sci. 2021, 24, 1727–1734. [Google Scholar] [CrossRef]
  68. Mansoor, M.; Gurumurthy, K.; Anantharam, R.U.; Prasad, V.R.B. Global Sentiment Analysis of COVID-19 Tweets over Time. arXiv 2020, arXiv:2010.14234v2. [Google Scholar]
  69. Singh, M.; Jakhar, A.K.; Pandey, S. Sentiment Analysis on the Impact of Coronavirus in Social Life Using the BERT Model. Soc. Netw. Anal. Min. 2021, 11, 33. [Google Scholar] [CrossRef] [PubMed]
  70. Imamah; Rachman, F.H. Twitter Sentiment Analysis of COVID-19 Using Term Weighting TF-IDF and Logistic Regresion. In Proceedings of the 2020 6th Information Technology International Seminar (ITIS), Surabaya, Indonesia, 14–16 October 2020; IEEE: New York, NY, USA, 2020; pp. 238–242. [Google Scholar]
  71. Sahir, S.H.; Ayu Ramadhana, R.S.; Romadhon Marpaung, M.F.; Munthe, S.R.; Watrianthos, R. Online Learning Sentiment Analysis during the COVID-19 Indonesia Pandemic Using Twitter Data. IOP Conf. Ser. Mater. Sci. Eng. 2021, 1156, 012011. [Google Scholar] [CrossRef]
  72. Althagafi, A.; Althobaiti, G.; Alhakami, H.; Alsubait, T. Arabic Tweets Sentiment Analysis about Online Learning during COVID-19 in Saudi Arabia. Int. J. Adv. Comput. Sci. Appl. 2021, 12, 620–625. [Google Scholar] [CrossRef]
  73. Ali, M.M. Arabic Sentiment Analysis about Online Learning to Mitigate COVID-19. J. Intell. Syst. 2021, 30, 524–540. [Google Scholar] [CrossRef]
  74. Alcober, G.M.I.; Revano, T.F. Twitter Sentiment Analysis towards Online Learning during COVID-19 in the Philippines. In Proceedings of the 2021 IEEE 13th International Conference on Humanoid, Nanotechnology, Information Technology, Communication and Control, Environment, and Management (HNICEM), Manila, Philippines, 28–30 November 2021; IEEE: New York, NY, USA, 2021. [Google Scholar]
  75. Remali, N.A.S.; Shamsuddin, M.R.; Abdul-Rahman, S. Sentiment Analysis on Online Learning for Higher Education during COVID-19. In Proceedings of the 2022 3rd International Conference on Artificial Intelligence and Data Sciences (AiDAS), Ipoh, Malaysia, 7–8 September 2022; IEEE: New York, NY, USA, 2022; pp. 142–147. [Google Scholar]
  76. Senadhira, K.I.; Rupasingha, R.A.H.M.; Kumara, B.T.G.S. Sentiment Analysis on Twitter Data Related to Online Learning during the COVID-19 Pandemic. Available online: http://repository.kln.ac.lk/handle/123456789/25416 (accessed on 27 September 2023).
  77. Lubis, A.R.; Prayudani, S.; Lubis, M.; Nugroho, O. Sentiment Analysis on Online Learning during the COVID-19 Pandemic Based on Opinions on Twitter Using KNN Method. In Proceedings of the 2022 1st International Conference on Information System & Information Technology (ICISIT), Yogyakarta, Indonesia, 27–28 July 2022; IEEE: New York, NY, USA, 2022; pp. 106–111. [Google Scholar]
  78. Arambepola, N. Analysing the Tweets about Distance Learning during COVID-19 Pandemic Using Sentiment Analysis. Available online: https://fct.kln.ac.lk/media/pdf/proceedings/ICACT-2020/F-7.pdf (accessed on 27 September 2023).
  79. Isnain, A.R.; Supriyanto, J.; Kharisma, M.P. Implementation of K-Nearest Neighbor (K-NN) Algorithm for Public Sentiment Analysis of Online Learning. IJCCS (Indones. J. Comput. Cybern. Syst.) 2021, 15, 121–130. [Google Scholar] [CrossRef]
  80. Aljabri, M.; Chrouf, S.M.B.; Alzahrani, N.A.; Alghamdi, L.; Alfehaid, R.; Alqarawi, R.; Alhuthayfi, J.; Alduhailan, N. Sentiment Analysis of Arabic Tweets Regarding Distance Learning in Saudi Arabia during the COVID-19 Pandemic. Sensors 2021, 21, 5431. [Google Scholar] [CrossRef]
  81. Asare, A.O.; Yap, R.; Truong, N.; Sarpong, E.O. The Pandemic Semesters: Examining Public Opinion Regarding Online Learning amidst COVID-19. J. Comput. Assist. Learn. 2021, 37, 1591–1605. [Google Scholar] [CrossRef]
  82. Mujahid, M.; Lee, E.; Rustam, F.; Washington, P.B.; Ullah, S.; Reshi, A.A.; Ashraf, I. Sentiment Analysis and Topic Modeling on Tweets about Online Education during COVID-19. Appl. Sci. 2021, 11, 8438. [Google Scholar] [CrossRef]
  83. Al-Obeidat, F.; Ishaq, M.; Shuhaiber, A.; Amin, A. Twitter Sentiment Analysis to Understand Students’ Perceptions about Online Learning during the COVID-19. In Proceedings of the 2022 International Conference on Computer and Applications (ICCA), Cairo, Egypt, 20–22 December 2022; IEEE: New York, NY, USA, 2022; p. 1. [Google Scholar]
  84. Waheeb, S.A.; Khan, N.A.; Shang, X. Topic Modeling and Sentiment Analysis of Online Education in the COVID-19 Era Using Social Networks Based Datasets. Electronics 2022, 11, 715. [Google Scholar] [CrossRef]
  85. Rijal, L. Integrating Information Gain Methods for Feature Selection in Distance Education Sentiment Analysis during COVID-19. TEM J. 2023, 12, 285–290. [Google Scholar] [CrossRef]
  86. Martinez, M.A. What Do People Write about COVID-19 and Teaching, Publicly? Insulators and Threats to Newly Habituated and Institutionalized Practices for Instruction. PLoS ONE 2022, 17, e0276511. [Google Scholar] [CrossRef] [PubMed]
  87. Thakur, N. A Large-Scale Dataset of Twitter Chatter about Online Learning during the Current COVID-19 Omicron Wave. Data 2022, 7, 109. [Google Scholar] [CrossRef]
  88. Wilkinson, M.D.; Dumontier, M.; Aalbersberg, I.J.; Appleton, G.; Axton, M.; Baak, A.; Blomberg, N.; Boiten, J.-W.; da Silva Santos, L.B.; Bourne, P.E.; et al. The FAIR Guiding Principles for Scientific Data Management and Stewardship. Sci. Data 2016, 3, 160018. [Google Scholar] [CrossRef] [PubMed]
  89. Genderperformr. Available online: https://pypi.org/project/genderperformr/ (accessed on 27 September 2023).
  90. Wang, Z.; Jurgens, D. It’s Going to Be Okay: Measuring Access to Support in Online Communities. In Proceedings of the Proceedings of the 2018 Conference on Empirical Methods in Natural Language Processing, Brussels, Belgium, 31 October–4 November 2018; Association for Computational Linguistics: Stroudsburg, PA, USA, 2018; pp. 33–45. [Google Scholar]
  91. Hutto, C.; Gilbert, E. VADER: A Parsimonious Rule-Based Model for Sentiment Analysis of Social Media Text. In Proceedings of the International AAAI Conference on Web and Social Media, Ann Arbor, MI, USA, 1–4 June 2014; Volume 8, pp. 216–225. [Google Scholar] [CrossRef]
  92. Nielsen, F.Å. A New ANEW: Evaluation of a Word List for Sentiment Analysis in Microblogs. arXiv 2011, arXiv:1103.2903v1. [Google Scholar]
  93. TextBlob. Available online: https://media.readthedocs.org/pdf/textblob/latest/textblob.pdf (accessed on 27 September 2023).
  94. Jumanto, J.; Muslim, M.A.; Dasril, Y.; Mustaqim, T. Accuracy of Malaysia Public Response to Economic Factors during the COVID-19 Pandemic Using Vader and Random Forest. J. Inf. Syst. Explor. Res. 2022, 1, 49–70. [Google Scholar] [CrossRef]
  95. Bose, D.R.; Aithal, P.S.; Roy, S. Survey of Twitter Viewpoint on Application of Drugs by VADER Sentiment Analysis among Distinct Countries. Int. J. Manag. Technol. Soc. Sci. (IJMTS) 2021, 6, 110–127. [Google Scholar] [CrossRef]
  96. Borg, A.; Boldt, M. Using VADER Sentiment and SVM for Predicting Customer Response Sentiment. Expert Syst. Appl. 2020, 162, 113746. [Google Scholar] [CrossRef]
  97. Newman, H.; Joyner, D. Sentiment Analysis of Student Evaluations of Teaching. In Lecture Notes in Computer Science; Springer International Publishing: Cham, Switzerland, 2018; pp. 246–250. ISBN 9783319938455. [Google Scholar]
  98. Gan, Q.; Yu, Y. Restaurant Rating: Industrial Standard and Word-of-Mouth—A Text Mining and Multi-Dimensional Sentiment Analysis. In Proceedings of the 2015 48th Hawaii International Conference on System Sciences, Kauai, HI, USA, 5–8 January 2015; IEEE: New York, NY, USA, 2015. [Google Scholar]
  99. Gabarron, E.; Dechsling, A.; Skafle, I.; Nordahl-Hansen, A. Discussions of Asperger Syndrome on Social Media: Content and Sentiment Analysis on Twitter. JMIR Form. Res. 2022, 6, e32752. [Google Scholar] [CrossRef]
  100. Lee, I.T.-L.; Juang, S.-E.; Chen, S.T.; Ko, C.; Ma, K.S.-K. Sentiment Analysis of Tweets on Alopecia Areata, Hidradenitis Suppurativa, and Psoriasis: Revealing the Patient Experience. Front. Med. 2022, 9, 996378. [Google Scholar] [CrossRef]
  101. Nalisnick, E.T.; Baird, H.S. Character-to-Character Sentiment Analysis in Shakespeare’s Plays. Available online: https://aclanthology.org/P13-2085.pdf (accessed on 27 September 2023).
  102. Hazarika, D.; Konwar, G.; Deb, S.; Bora, D.J. Sentiment Analysis on Twitter by Using TextBlob for Natural Language Processing. In Proceedings of the Annals of Computer Science and Information Systems, Nagpur, India, 5–6 December 2020; PTI: Warszawa, Poland, 2020; Volume 24. [Google Scholar]
  103. Mas Diyasa, I.G.S.; Marini Mandenni, N.M.I.; Fachrurrozi, M.I.; Pradika, S.I.; Nur Manab, K.R.; Sasmita, N.R. Twitter Sentiment Analysis as an Evaluation and Service Base on Python Textblob. IOP Conf. Ser. Mater. Sci. Eng. 2021, 1125, 012034. [Google Scholar] [CrossRef]
  104. Mansouri, N.; Soui, M.; Alhassan, I.; Abed, M. TextBlob and BiLSTM for Sentiment Analysis toward COVID-19 Vaccines. In Proceedings of the 2022 7th International Conference on Data Science and Machine Learning Applications (CDMA), Riyadh, Saudi Arabia, 1–3 March 2022; IEEE: New York, NY, USA, 2022. [Google Scholar]
  105. Hermansyah, R.; Sarno, R. Sentiment Analysis about Product and Service Evaluation of PT Telekomunikasi Indonesia Tbk from Tweets Using TextBlob, Naive Bayes & K-NN Method. In Proceedings of the 2020 International Seminar on Application for Technology of Information and Communication (iSemantic), Semarang, Indonesia, 19–20 September 2020; IEEE: New York, NY, USA, 2020. [Google Scholar]
  106. Detoxify. Available online: https://pypi.org/project/detoxify/ (accessed on 27 September 2023).
  107. Jigsaw Unintended Bias in Toxicity Classification. Available online: https://www.kaggle.com/c/jigsaw-unintended-bias-in-toxicity-classification (accessed on 27 September 2023).
  108. Jigsaw Multilingual Toxic Comment Classification. Available online: https://www.kaggle.com/c/jigsaw-multilingual-toxic-comment-classification (accessed on 27 September 2023).
  109. Toxic Comment Classification Challenge. Available online: https://www.kaggle.com/c/jigsaw-toxic-comment-classification-challenge (accessed on 27 September 2023).
  110. Sharma, S.; Gupta, V. Role of Twitter User Profile Features in Retweet Prediction for Big Data Streams. Multimed. Tools Appl. 2022, 81, 27309–27338. [Google Scholar] [CrossRef] [PubMed]
  111. Pycountry. Available online: https://pypi.org/project/pycountry/ (accessed on 28 September 2023).
  112. Zambon, V. Gender Identity. Available online: https://www.medicalnewstoday.com/articles/types-of-gender-identity (accessed on 28 September 2023).
  113. X’s Inactive Account Policy. Available online: https://help.Twitter.com/en/rules-and-policies/inactive-x-accounts (accessed on 18 October 2023).
Figure 1. The variation of social media use by gender from the findings of a survey conducted by the Pew Research Center from 2005 to 2021.
Computers 12 00221 g001
Figure 2. A flowchart representing the working of Algorithm 1 to Algorithm 6 for the development of the master dataset.
Computers 12 00221 g002
Figure 3. A pie chart to represent different genders from the “Gender” attribute.
Computers 12 00221 g003
Figure 4. A pie chart to represent the distribution of positive, negative, and neutral sentiments (as per VADER) in the Tweets.
Computers 12 00221 g004
Figure 5. A pie chart to represent the distribution of positive, negative, and neutral sentiments (as per Afinn) in the Tweets.
Computers 12 00221 g005
Figure 6. A pie chart to represent the distribution of positive, negative, and neutral sentiments (as per TextBlob) in the Tweets.
Computers 12 00221 g006
Figure 7. A pie chart to represent the results of subjectivity analysis using TextBlob.
Computers 12 00221 g007
Figure 8. Representation of the variation of different categories of toxic content present in the Tweets.
Computers 12 00221 g008
Figure 9. A graphical representation of the variation of the intensities of different categories of toxic content on a monthly basis in Tweets about online learning during COVID-19.
Computers 12 00221 g009
Figure 10. A graphical representation of the variation of the intensity of toxicity on a monthly basis by different genders in Tweets about online learning during COVID-19.
Computers 12 00221 g010
Figure 11. A graphical representation of the variation of the intensity of obscene content on a monthly basis by different genders in Tweets about online learning during COVID-19.
Computers 12 00221 g011
Figure 12. A graphical representation of the variation of the intensity of identity attacks on a monthly basis by different genders in Tweets about online learning during COVID-19.
Computers 12 00221 g012
Figure 13. A graphical representation of the variation of the intensity of insult on a monthly basis by different genders in Tweets about online learning during COVID-19.
Computers 12 00221 g013
Figure 14. A graphical representation of the variation of the intensity of threat on a monthly basis by different genders in Tweets about online learning during COVID-19.
Computers 12 00221 g014
Figure 15. A graphical representation of the variation of the intensity of sexually explicit content on a monthly basis by different genders in Tweets about online learning during COVID-19.
Computers 12 00221 g015
Figure 16. A graphical representation of the variation of the average activity on Twitter (in the context of tweeting about online learning during COVID-19) on a monthly basis.
Computers 12 00221 g016
Figure 17. Representation of the trends in Tweets about online learning during COVID-19 posted by males from different countries of the world.
Computers 12 00221 g017
Figure 18. Representation of the trends in Tweets about online learning during COVID-19 posted by females from different countries of the world.
Computers 12 00221 g018
Table 1. Gender Diversity in Different Social Media Platforms.
Social Media PlatformPercentage of Male UsersPercentage of Female Users
Twitter6337
Instagram51.848.2
Tumblr5248
WhatsApp53.246.7
WeChat53.546.5
Quora5545
Facebook56.343.7
LinkedIn57.242.8
Telegram58.641.4
Sina Weibo5149
QQ51.748.3
SnapChat48.251
Table 2. Results from gender-specific analysis of positive, negative, and neutral Tweets.
Characteristics of Tweets AnalyzedTweets Posted by
Males
Tweets Posted by
Females
Tweets Posted by
None
Positive Tweets (as per VADER)25.402%21.403%53.196%
Negative Tweets (as per VADER)24.457%22.801%52.742%
Neutral Tweets (as per VADER)22.214%14.179%63.608%
Positive Tweets (as per Afinn)23.653%19.270%57.077%
Negative Tweets (as per Afinn) 24.227%18.663%57.110%
Neutral Tweets (as per Afinn)25.037%21.475%53.488%
Positive Tweets (as per TextBlob)23.529%21.168%55.303%
Negative Tweets (as per TextBlob)22.905%20.494%56.602%
Neutral Tweets (as per TextBlob)27.894%15.535%56.572%
In this Table, “Tweets posted by None” refers to the Tweets posted from Twitter accounts (such as universities, companies, organizations, etc.) that were assigned the gender label “None” by Algorithm 2.
Table 3. Results from gender-specific analysis of different types of subjective and toxic Tweets.
Characteristics of Tweets AnalyzedTweets Posted by MalesTweets Posted by
Females
Tweets Posted by None
Highly opinionated Tweets (as per TextBlob)26.094%27.735%51.171%
Least opinionated Tweets (as per TextBlob)23.618%18.355%58.027%
Neutral opinionated Tweets (as per TextBlob)24.545%21.165%52.291%
Tweets in the toxicity class (as per Detoxify)23.680%20.119%56.201%
Tweets in the obscene class (as per Detoxify)34.184%14.483%51.334%
Tweets in the identity attack class (as per Detoxify)22.339%21.045%56.616%
Tweets in the insult class (as per Detoxify)25.923%14.936%59.142%
Tweets in the threat class (as per Detoxify)25.000%0.000%75.000%
Tweets in the sexually explicit class (as per Detoxify)5.556%27.778%66.667%
In this Table, “Tweets posted by None” refers to the Tweets posted from Twitter accounts (such as universities, companies, organizations, etc.) that were assigned the gender label ‘None’ by Algorithm 2.
Table 4. A comparative study of this work with prior works in this field in terms of focus areas.
WorkText Analysis of Tweets about Online Learning during COVID-19Sentiment Analysis of Tweets about Online Learning during COVID-19Analysis of Types of Toxic Content in Tweets about Online Learning during COVID-19Subjectivity Analysis of Tweets about Online Learning during COVID-19
Sahir et al. [71]
Althagafi et al. [72]
Ali et al. [73]
Alcober et al. [74]
Remali et al. [75]
Senadhira et al. [76]
Lubis et al. [77]
Arambepola [78]
Isnain et al. [79]
Aljabri et al. [80]
Asare et al. [81]
Mujahid et al. [82]
Al-Obeidat et al. [83]
Waheeb et al. [84]
Rijal et al. [85]
Martinez et al. [86]
Thakur et al.
[this work]
Disclaimer/Publisher’s Note: The statements, opinions and data contained in all publications are solely those of the individual author(s) and contributor(s) and not of MDPI and/or the editor(s). MDPI and/or the editor(s) disclaim responsibility for any injury to people or property resulting from any ideas, methods, instructions or products referred to in the content.

